Exhibit 99.23
Management’s Discussion & Analysis
F3 Uranium Corp.
For the Year Ended
June 30, 2024
| F3
Uranium Corp. Management’s Discussion and Analysis For the year ended June 30, 2024 (Expressed in Canadian dollars, unless otherwise noted) |
 |
Introduction
The following Management’s Discussion and Analysis (“MD&A”), prepared as of October 28, 2024, should be read in conjunction with the audited consolidated financials for the same year along with the accompanying notes of F3 Uranium Corp. (the “Company”).
The Company’s consolidated financial statements have been prepared in accordance with IFRS, as issued by the International Accounting Standards Board (“IASB”) as at June 30, 2024.
Additional information related to the Company is available for viewing on SEDAR at www.sedar.com. Further information including news releases and property maps are available on the Company’s website at www.fission3corp.com, or by requesting further information from the Company’s head office located at 750 – 1620 Dickson Ave., Kelowna, BC, Canada, V1Y 9Y2.
Forward looking statements
Statements in this report that are forward looking could involve known and unknown risks and uncertainties, which could cause actual results to vary considerably from these statements. Should one or more of these unknown risks and uncertainties, or those described under the headings “Cautionary notes regarding forward-looking statements” and “Risks and uncertainties” materialize, or should underlying assumptions prove incorrect, then actual results may vary materially from those described in forward-looking statements.
Scientific and technical disclosure
Scientific and technical information in this MD&A was reviewed and approved by Raymond Ashley, P. Geo., Vice President Exploration of the Company. Raymond Ashley is a “Qualified Person” as defined by Canadian National Instrument 43-101 Standards of Disclosure for Mineral Projects (“NI 43-101”).
Description of business
The Company was incorporated on September 23, 2013 under the laws of the Canada Business Corporations Act in connection with a court approved plan of arrangement to reorganize Fission Uranium Corp. (“Fission Uranium”) which was completed on December 6, 2013 (the “Fission Uranium Arrangement”).
The Company is a junior resource issuer engaged in the acquisition, exploration, and development of uranium resource properties in the Saskatchewan’s Athabasca Basin. The Company’s primary objective is to locate, evaluate and acquire properties with the potential to host high grade uranium. The preference is to evaluate early-stage properties with the potential to host high grade uranium at shallow depths and to finance their exploration and potential development by way of equity financing, joint ventures, option agreements or other means.
The Company has approximately 211,384 ha of exploration properties with uranium potential in Saskatchewan and Alberta in Canada.
The Company’s award-winning management and technical team have a track record of acquiring highly prospective uranium properties, and successfully exploring and developing them for potential sale. By embracing the Project Generator model, the Company, through property option and joint venture agreements and technical expertise as operator, has the ability to attract financial partners.
The Company’s common shares are listed on the TSX Venture Exchange under the symbol “FUU”, the OTCQB marketplace in the U.S. under the symbol “FISOF” and the Frankfurt Stock Exchange under the symbol “2F3”.
Page | 1
| F3
Uranium Corp. Management’s Discussion and Analysis For the year ended June 30, 2024 (Expressed in Canadian dollars, unless otherwise noted) |
|
Corporate goals
Overall
The Company’s goals are to discover an economic uranium deposit through exploration and to develop it. In addition, the Company will use its award-winning technical team to continually identify, evaluate and stake mineral claims in the Athabasca Basin that are prospective for high-grade uranium for exploration at a later stage. The Company’s properties are located primarily in and around Saskatchewan’s Athabasca Basin, home of the richest uranium deposits in the world.
The Company’s intent is to utilize specialized exploration surveys and interpretations that led to the successful discovery of Fission Uranium’s shallow, high-grade uranium discovery at Patterson Lake South (PLS) to advance its properties. These include its innovative approach to ground EM and IP geophysical and radon surveys, underwater spectrometer analysis and radiometric airborne surveys; the same technology used to identify the high-grade boulder field at PLS.
Management continues to believe that long-term world-wide uranium demand and the corresponding nuclear power plant build-out will require new uranium supply to meet this expected new demand. As such, management is highly optimistic about the long-term prospects for the uranium market and the Company remains committed to advancing its exploration plans in the Athabasca Basin to emulate the success of its predecessor companies, Fission Uranium and Fission Energy Corp. In addition, the Company will continue to examine joint venture, property acquisition, and other strategic corporate opportunities to enhance shareholder value.
Spin-out of F3 Uranium Corp.
On January 16, 2024, the Company announced that it has initiated steps to spin out (the “Spin-Out”) 17 of the Company’s prospective uranium exploration projects in the Athabasca Basin including the Murphy Lake, Cree Bay, Hearty Bay, Clearwater West, Wales Lake, Todd, Smart Lake, Lazy Edward Bay, Grey Island, Seahorse Lake, Bird Lake, Beaver River, Bell Lake, Flowerdew Lake, James Creek, Henderson Lake and Wales Lake East and West properties (collectively, the “Properties”) into a newly incorporated wholly-owned subsidiary to be named F4 Uranium Corp. (“F4”). The Patterson Lake North Property along with the Broach and Minto Properties (collectively, the “PLN Project”), totaling 39,946 hectares, will remain with F3. It is expected that the Spin-Out will be affected by way of a plan of arrangement (the “Arrangement”), under the Canada Business Corporations Act.
Subsequently, On August 15, 2024, F3 completed the Spin-Out of F4 Uranium Corp.
Summary of significant accomplishments and corporate developments for the year ended June 30, 2024
A new uranium discovery at the PLN Property, named the JR Zone, was made in the second drill hole of the fall program. PLN22-035 is a 730 m step-out from a weakly mineralized drillhole, PLN14-019, drilled in 2014. Uranium assay results from the discovery hole PLN22-035 at PLN, returned one continuous 15.0 m interval averaging 6.97% U3O8 including a high-grade 5.5 m interval averaging 18.6% U3O8 and an ultra high-grade core assay of 59.2% over 1.0 m.
Page | 2
| F3
Uranium Corp. Management’s Discussion and Analysis For the year ended June 30, 2024 (Expressed in Canadian dollars, unless otherwise noted) |
|
Exploration properties
A list of the Company’s uranium exploration properties, their current project status and their carrying value as at June 30, 2024 is shown below. This table excludes the 37 claims at Hobo Lake (which also included Karpinka Lake, and Millson Lake) were exchanged for another set of claims on January 22, 2024. In addition, the carrying values of all properties except for Patterson Lake North, Broach, Minto, Smart Lake and Todd were reclassified as assets held for distribution at June 30, 2024. See Note 10 of the year ended June 30, 2024 financial statements, and further discussion below.
| Property | Location | Ownership | Claims | Hectares | Stage | Carrying value | ||||||
| PLS Area | ||||||||||||
| Clearwater West | Athabasca Basin Region, SK | 100% | 3 | 11,786 | 3 | - | ||||||
| Patterson Lake North | Athabasca Basin Region, SK | 100% | 2 | 4,074 | 3 | 53,334,672 | ||||||
| Broach | Athabasca Basin Region, SK | 100% | 17 | 19,023 | 3 | 112,090 | ||||||
| Minto | Athabasca Basin Region, SK | 100% | 23 | 19,864 | 3 | 863 | ||||||
| Wales Lake | Athabasca Basin Region, SK | 100% | 31 | 42,134 | 3 | - | ||||||
| Smart Lake | Athabasca Basin Region, SK | 100% | 3 | 1,870 | 1 | 1,013 | ||||||
| Todd | Athabasca Basin Region, SK | 100% | 4 | 9,704 | 2 | 25,507 | ||||||
| James Creek | Athabasca Basin Region, SK | 100% | 2 | 1,089 | 1 | - | ||||||
| Total: PLS Area | 85 | 109,544 | 53,474,145 | |||||||||
| Key Lake Area | ||||||||||||
| Bird Lake | Athabasca Basin Region, SK | 100% | 1 | 1,803 | 2 | - | ||||||
| Grey Island | Athabasca Basin Region, SK | 100% | 22 | 47,912 | 1 | - | ||||||
| Lazy Edward Bay | Athabasca Basin Region, SK | 100% | 11 | 1,828 | 3 | - | ||||||
| Seahorse Lake | Athabasca Basin Region, SK | 100% | 3 | 7,519 | 2 | - | ||||||
| Henderson Lake | Athabasca Basin Region, SK | 100% | 1 | 1,427 | 1 | - | ||||||
| Total: Key Lake Area | 38 | 60,489 | - | |||||||||
| Beaverlodge/Uranium City Area | ||||||||||||
| Beaver River | Athabasca Basin Region, SK | 100% | 9 | 7,599 | 2 | - | ||||||
| Hearty Bay | Athabasca Basin Region, SK | 100% | 7 | 11,173 | 3 | - | ||||||
| Total: Beaverlodge/Uranium City Area | 16 | 18,772 | - | |||||||||
| Northeast Athabasca Basin Area | ||||||||||||
| Bell Lake | Athabasca Basin Region, SK | 100% | 1 | 2,225 | 1 | - | ||||||
| Cree Bay | Athabasca Basin Region, SK | 100% | 16 | 14,080 | 3 | - | ||||||
| Flowerdew Lake | Athabasca Basin Region, SK | 100% | 4 | 5,664 | 1 | - | ||||||
| Murphy Lake | Athabasca Basin Region, SK | 100% | 8 | 609 | 3 | - | ||||||
| Total: Northeast Athabasca Basin Area | 29 | 22,578 | - | |||||||||
| Totals | 168 | 211,383 | 53,474,145 |
Exploration Stage:
| 1. | Prospecting |
| 2. | Line Cutting, Geophysical Exploration (including IP and EM surveys), Rock and Soil Sampling, |
| 3. | Drilling |
Within the Athabasca Basin Region, the Company’s properties are all located in areas that are prospective for near surface uranium mineralization in both basement and unconformity hosted models. The emphasis for land selection has been on identifying shallow hosted mineralization potential in conjunction with underlying structural and alteration features associated with appropriate lithologic units, with a focus on being near historic mining districts (such as Beaverlodge / Uranium City in north-western Athabasca Basin region and Key Lake area in the eastern Athabasca Basin region) or emerging major mining districts (such as the south-western Athabasca Basin region). As such, property locations tend to be proximal to the Athabasca Basin margins. Three geographic areas represent a key focus area and these include:
| 1. | PLS Area: Includes 109,544 ha in eight properties. |
| 2. | Key Lake Area: Includes 60,489 ha in five properties. |
| 3. | Beaverlodge/Uranium City Area: Includes 18,772 ha in two properties. |
Page | 3
| F3
Uranium Corp. Management’s Discussion and Analysis For the year ended June 30, 2024 (Expressed in Canadian dollars, unless otherwise noted) |
|
Exploration properties (continued)
There are four other highly prospective properties within the Athabasca Basin Region in Saskatchewan which fall outside these three geographical areas, all situated in geologically attractive settings that indicate the potential to host uranium mineralization.
PLS Area, Canada
The PLS area has been the focus of two of the most significant, recently discovered deposits in the Athabasca Basin; Fission Uranium’s Triple R and NexGen Energy’s Arrow deposits, and more recently the JR Zone on the Company’s PLN Property. The area is considered an important, major emerging uranium mining district of the Athabasca Basin. The PLS Area portfolio consists of 85 claims and 109,544 ha on eight properties. The PLN property is considered the most advanced and is located approximately 17 km to the north of Fission Uranium’s Triple R deposit.
Recent developments on the PLS Area properties include:
Clearwater West Property
The Clearwater West property (CWW) encompasses 3 contiguous claims covering 11,786 ha. The uranium mineralization model that is envisioned for the CWW property is analogous to the structurally controlled Athabasca Basin unconformity deposits. These deposits are generally associated with hydrothermally altered, structurally controlled metasedimentary lithology, which appears as magnetic lows on geophysical surveys.
Between 2013 and 2015 various airborne and ground geophysics programs were conducted to investigate and evaluate the subsurface properties. The goal was to assist in assessing exploration potential and identifying drill targets. In 2013, a high-resolution magnetic and radiometric airborne survey was completed over the entire property. In 2014, an airborne VTEM magnetic and electromagnetic (EM) geophysical survey identified several EM conductors on the property’s east side. These may represent on-strike continuation of the EM conductors seen on the PLS property immediately to the north. In 2015, a DC resistivity and EM ground geophysical survey prioritized drill locations over eight separate EM conductors.
In 2015, a three-hole drill program spanning 534 m was completed. Drilling intersected wide intervals of hydrothermal alteration and structural features and locally narrow anomalous radioactivity, with a peak of 2,333 cps over 0.1 m (measured from a down-hole gamma probe).
In May 2023 an option agreement was entered into with SKRR Exploration Inc. respecting an option for SKRR to acquire up to a 70% interest in the property.
In July 2024 F4 conducted a 6-hole 1,317.8 m diamond drill program as operator in the property option agreement with SKRR Exploration Inc. The drilling targeted re-interpreted airborne VTEM anomalies and results of historic drilling by F3 Uranium Corp. Three of the F4 holes intersected graphitic and sulphidic fault breccias over significant widths, with DDH CWW24-009 returning anomalous radioactivity with a maximum of 410 cps between 152.5 m – 153.0 m and 159.5 m – 160.0 m depth.
Patterson Lake North (PLN) Property
The PLN property consists of 51 claims covering 4,074 ha and is located 17 km to the north of Fission Uranium’s PLS high-grade Triple R uranium deposit. The PLN Property hosts the recently discovered JR Uranium Zone.
A summary of exploration activity on the PLN property is as follows:
During winter 2014, radon-in-water and radon-in-sediment samples from Hodge Lake and Harrison Lake were collected and analyzed for radioelement content. Results were inconclusive.
Page | 4
| F3
Uranium Corp. Management’s Discussion and Analysis For the year ended June 30, 2024 (Expressed in Canadian dollars, unless otherwise noted) |
|
Exploration properties (continued)
PLS Area, Canada (continued)
Patterson Lake North Property (continued)
Over the winter and summer of 2014, a total of 10 diamond drill holes were completed on the A1, B1 (aka A1B), A3 and A4 conductors totaling 4,118 m of drilling. The most significant result came from drill hole PLN14-019, which tested the A1 EM conductor. This hole encountered anomalous radioactivity confirmed with geochemical analysis and assayed 0.047% U3O8 over 0.5 m. These results increased the potential of the A1 conductor to host high-grade uranium mineralization. In February 2019, the Company completed a winter drill program. The program drilled a total of 2,051 m in six completed holes and two holes that were abandoned due to poor ground conditions. The drilling focused on the northwest-southeast trending A1 basement hosted EM conductor. Previous drilling in 2014, including hole PLN14-019 (6.0 m @ 0.012% U3O8), indicated the conductive corridor to be prospective for mineralization. All six holes encountered strong hydrothermal alteration over variable widths and several narrow radiometric anomalies, including a downhole radiometric peak of 1,382 cps (PLN19-026), often a key signature of mineralized systems. The A1 conductive corridor remains prospective to the south, and PLN hosts multiple drill targets that remain untested on the property and will be the subject of future exploration.
From January to June 2022 DC Resistivity and TDEM surveying was carried out on the G4 grid, an area on the west side of the PLN Property where the southeast trending A1 conductor had been previously identified through geophysical surveying and limited drilling. The 13.95 line-km of DC Resistivity and 4.9 line-km of Small Moving Loop TDEM were designed to extend coverage of the A1 conductor to the west boundary of the Property.
The fall drilling program began on November 10, 2022. One sonic and two diamond drills commenced on the previously undrilled 800 m northwest strike extension of the A1 conductor, which is approximately three-kilometers-long. The second drill hole of the fall program led to a new uranium discovery, named the JR Zone.
PLN22-035, a drill hole located 730 m away from a weakly mineralized drillhole (PLN14-019) drilled in 2014, targeted the ground Time Domain Electromagnetic (TDEM) A1 conductor. The first follow-up drill hole to this new high-grade discovery, PLN22-038, intersected 3.48 m of total composite mineralization with greater than 10,000 cps. This included 2.5 m of total off-scale radioactivity (>65,535 cps), which occurred as pitchblende patches. Furthermore, two out of three follow-up holes intersected significant radioactivity. PLN22-040 was along strike from the discovery hole, and PLN22-041 was up-dip from PLN22-038.
Uranium assay results from the discovery hole PLN22-035 at PLN returned one continuous 15.0 m interval averaging 6.97% U3O8. This includes a high-grade 5.5 m interval averaging 18.6% U3O8 and an ultra high-grade core assay of 59.2% over 1.0 m.
A winter program of step-out drilling started on January 3, 2023. The program used a sonic drill to case holes through overburden and a diamond drill to complete the holes through bedrock. The aim was to test for continuation of mineralization along the JR Zone (A1 Shear) along strike, and up and down dip. The program completed 21 holes, with an additional three holes cased through the overburden in preparation for an anticipated summer 2023 drill schedule.
Highlights included DDH PLN23-060, which was collared on line 060S and intersected the strongest radioactivity to date with 5.00 m of 26.7% U3O8 between 243.0 m and 248.0 m. This includes 3.5 m of 37.1% U3O8 and 1.0 m of 57.6% U3O8. Holes PLN23-061 and PLN23-062 were cored 75 m and 90 m respectively to the south of the JR Zone discovery hole, with PLN23-061 returning assays of 4.6% U3O8 over a 12.5 m interval including a high-grade 5.0 m interval averaging 10.9% U3O8, which further included a 3.0 m interval grading 16.1% U3O8. PLN23-062 intersected a high-grade core of 15.0% U3O8 over a core length of 1.0 m.
Page | 5
| F3
Uranium Corp. Management’s Discussion and Analysis For the year ended June 30, 2024 (Expressed in Canadian dollars, unless otherwise noted) |
|
Exploration properties (continued)
PLS Area, Canada (continued)
Patterson Lake North Property (continued)
This drilling program, spanning 7,575 m expanded the known length of the JR Zone to 105 m.
In June 2023 an airborne Lidar survey was commissioned over the property to provide detailed DEM values. A total of 983.8 hectares was surveyed over the newly discovered JR Uranium Zone.
Mobilization with two diamond drills commenced on June 7, 2023 for a planned 30 hole summer drill program to expand on the highly successful winter drill results at the JR Zone.
Highlights of the summer program included hole PLN23-068 on line 060S which returned 18.0 m of 8.8% U3O8, including a high grade 11.5 m interval averaging 13.7% U3O8, further including an ultra-high-grade core of 4.5 m of 30.1% U3O8. Also hole PLN23-079 on line 045S which returned 12.0 m of 10.3% U3O8, including a high grade 6.5 m interval averaging 18.9% U3O8, further including an ultra-high-grade core of 2.5 m of 38.8% U3O8. Holes PLN23-073 & PLN23-074 tested for mineralization up-dip of previous intercepts and both holes intersected anomalous radioactivity within 8 m of the unconformity. PLN23-073 on line 060S returned 8.5 m of 2.14% U3O8, including a high grade 1 m interval of 17.2% U3O8. PLN23-074 on line 075S returned 15.0 m of 0.37% U3O8, including higher grade
0.5 m intervals of 2.58% U3O8 and 1.64% U3O8.
The B1 conductor/shear zone area, to the south of the JR Zone/A1 conductor, represents an area of widespread structural complexity with evidence of significant reactivated reverse structures into the sandstone. Hole PLN23-078 first confirmed the B1 conductor as corresponding to a major shear zone. Hole PLN23-093 tested B1 and returned a 2.0 m interval with significant individual boron values between 3,000 ppm and 10,000 ppm. Boron values over 5,000 ppm have previously only been intersected on the property within Athabasca Sandsone immediately above the JR Zone, 3.5 km away. Hole PLN23-095 was the first hole to intersect anomalous radioactivity at B1, 840 m to the north of PLN23-093. PLN23-095 on line 2610S intersected 0.5 m of 300 cps radioactivity from 610 m to 610.5 m.
By September 19, 2023 the summer program was concluded with a total of 14,291.4 m in 30 completed diamond drillholes and 44 sonic drill pre-casings.
In July 2023, an airborne magneto-telluric (MT) survey was completed that covered the entirety of the PLN Property. Preliminary survey results indicate that the prospective conductive corridor which hosts the JR Zone discovery at its north end now has a one third increase in total strike length to 4.9 km, displaying an extension of 1.3 km further to the SE than the previously defined historical A1 and parallel and offset B1 conductors. Final interpreted results are pending.
In October 2023, Dias Geophysical of Saskatoon commenced a Dias32-3DIP ground resistivity survey. The purpose of the survey was to obtain a signature over the JR Zone and to develop targets for drilling in 2024 over the B1 conductor and the newly defined 1.3 km extension to the southeast. The area to be surveyed was based on an interpretation of the 2D results of the airborne MobileMT electromagnetic survey conducted in July 2023. The work was completed in early February 2023 and results are pending processing and interpretation by Geotexera Inc.
The fall diamond drill program followed immediately upon the heels of the summer program, commencing with hole PLN23-101. PLN23-102, collared 3.4 km south of the JR Zone on line 3450S, was the second hole to intersect anomalous radioactivity along the recently discovered B1 Shear Zone. The hole encountered 96 m of cumulative core loss in the Athabasca sandstone between 176 m and 338 m and 0.5 m of 79 ppm uranium from 411.5 m to 412 m. Follow-up hole PLN23-105 on the same grid line returned 7.5 m of 48 ppm uranium between 528.5 m and 535.0 m, including 0.5 m of 137 ppm uranium from 531.5 m to 532.0 m.
Page | 6
| F3
Uranium Corp. Management’s Discussion and Analysis For the year ended June 30, 2024 (Expressed in Canadian dollars, unless otherwise noted) |
|
Exploration properties (continued)
PLS Area, Canada (continued)
Patterson Lake North Property (continued)
JR Zone drilling returned the highest assay to date within hole PLN23-110 on line 015S, with 2.0 m of 42.4% U3O8 from 226.0 m to 228.0 m, including 1.5 m of 55.4% U3O8 and 0.5 m of 66.8% U3O8. PLN23-101 extended mineralization up-dip on grid line 015S with 11.5 m of 0.76% U3O8 from 218.5 m to 230.0 m, including 1.5 m intervals of 1.77% U3O8 and 2.64% U3O8. Other notable intercepts include hole PLN23-112 on line 060S with 8.0 m of 1.03% U3O8 between 229.0 m and 237.0 m, including 0.5 m of 13.2% U3O8, and 3.5 m of 4.24% U3O8 between 237.0 m and 240.5 m, including 0.5 m of 20.0% U3O8.
The fall 2023 drill program concluded on December 11, 2023 with a total of 8,550.5 m in 15 completed diamond drillholes and 31 completed sonic drill pre-casings.
The winter drill program ran between January – April 2024 and totaled 30 diamond drillholes for a total drill meterage of 12,100 m. The JR Zone continued to deliver high-grade intercepts including PLN23-137 with 18.5 m of anomalous radioactivity including a 1.25m intersection of composite off-scale (> 65,535 cps) mineralization. Considerable undrilled gaps remain open for exploration along the A1 main shear. Drilling along the B1 shear zone resulted in five drillholes that intersected anomalous radiation over a strike length of 600 m. Drill hole PLN24-133 targeted an area near the northwest end of the B1 shear zone and encountered a 120 m thick strongly altered and deformed basement wedge within the sandstone. An extremely graphitic structure was intersected within the basement wedge and in all follow up drilling on section and along strike. This offsetting reverse structure appears discordant to the B1 main shear and is likely related to the Harrison fault, a significant regional structure that played an important role in the developemnt of the Athabasca Basin.
During January-February 2024 65.6 line-kms of fixed loop surface SQUID electromagnetic coverage was completed to cover the B1 conductor/shear and southwest toward the A3 conductor. Interpreted results of this survey are pending.
A ground gravity survey covering sections of the A1 & B1 shear, and known conductors to the south, was completed in the early summer of 2024. A total of 11,408 stations were measured within the PLN claims. Final interpretation is pending.
A summer drill program is ongoing along the A1 & B1 shear zones. As of October 20, 2024 a total of 19,401.4 m had been drilled in 42 completed diamond drill holes and 53 completed sonic pre-casings. Highlights included a drill-confirmed extension of the B1 shear zone 700 m to the southeast, targeting a recently interpreted conductivity model of electromagnetic geophysical survey data. In-fill drilling at the A1 shear hosted JR Zone continued to return significant high-grade uranium intersections, including hole PLN24-116 which returned 12.0 m of 7.6% U3O8, including a high grade 8.0 m interval averaging 11.2% U3O8. Also hole PLN24-137 which returned 15.0 m of 3.2% U3O8, including a high grade 2.5 m interval averaging 18.6% U3O8, further including the ultra-high grade core with 1.5 m of 30.3% U3O8. Exploration drilling southeast along the A1 shear zone tested a related fault splay termed the ‘North Horse’ structure. Two radioactive intervals corresponding to the main A1 and North Horse structures respectively yielded the strongest exploration geochemistry results outside of JR Zone to date, with the main A1 intersect assaying 0.045% U3O8 and the North Horse intersect assaying 0.014% U3O8 over 7 meters including 0.051% U3O8 over 0.5m
Page | 7
| F3
Uranium Corp. Management’s Discussion and Analysis For the year ended June 30, 2024 (Expressed in Canadian dollars, unless otherwise noted) |
|
Exploration properties (continued)
PLS Area, Canada (continued)
Broach Property
The Broach Property comprises 17 claims totaling 19,023 hectares and is located contiguous to the south of the PLN Property, and 5.5 km north of the Triple R Uranium Deposit.
The Broach Lake EM conductors are situated nine kilometers to the north, adjacent and parallel to EM conductors of the Patterson Lake Structural Corridor, host to Fission Uranium’s Triple R deposit and NexGen’s Arrow Deposit.
During winter-spring 2014 a total of 31.5 km of moving loop time domain EM (MLTEM) and 34.0 km of induced polarization-DC resistivity (DCRES) surveying was completed to define drill targets on the conductors.
An additional 12.9 km of MLTEM and 16.0 km of DCRES were completed during winter 2022.
This was immediately followed up by five diamond drill holes totaling 3,015 m that targeted electromagnetic conductors and suspected ’sandstone chimney’ alteration that was indicated by the
Broach Property (continued)
ground geophysical surveys. Hole PLN22-031 completed at Broach Lake intersected anomalous radioactivity of 510 cps, measured with a handheld RS-125 scintillometer, and a peak of 2,382 cps with the down-hole gamma survey. The anomalous results are associated with a narrow, brecciated fault zone. A 30 m wide graphitic mylonitic fault zone was encountered a further 150 m down-hole. The first
two holes at Broach Lake (PLN22-028 and 030B) encountered visible dravite, often found in association with uranium mineralization.
In June 2023, an airborne Lidar survey was commissioned in the northwest section of the property to provide detailed DEM values. A total of 451.5 hectares was surveyed.
In July 2023, an airborne magneto-telluric (MT) survey was completed that covered most of the Broach Property. The intention was to map structure and conductivity at depth and attempt to discern valid data beneath shallow horizontal conductive cretaceous layers. Results are pending.
In January 2024 two claims were appended to the southwest corner of the property after a land swap deal with CanAlaska Uranium Ltd.
A ground gravity survey covering known conductors was completed in the early summer of 2024. A total of 12,710 stations were measured within the Broach claims. Final interpretation is pending.
A summer 2024 drill program targeting the A1 and B1 shear zones at PLN is ongoing and one hole, PLN24-182, was drilled within the Broach claims, targeting an interpreted extension of the B1 shear to the southeast.
Page | 8
| F3
Uranium Corp. Management’s Discussion and Analysis For the year ended June 30, 2024 (Expressed in Canadian dollars, unless otherwise noted) |
|
Exploration properties (continued)
PLS Area, Canada (continued)
Minto Property
The Minto Property comprises 23 claims totaling 19,864 hectares and is located contiguous to the north of the PLN Property.
In 2013, a VTEM MAX survey was conducted over the Minto Property. This survey revealed a strong ‘late time’ EM conductor with significant offsets, indicating cross structure. This sinuous feature, known as the ‘N’ conductor, is believed to extend onto the Minto Property in two locations. Ground follow up geophysical surveys indicated a wide complex conductor system that may consist of individual conductors that are not yet uniquely resolved.
A single test line of ground magneto-tellurics (MT) was completed over the ‘N’ conductor in October 2013.
During winter-spring 2014 surveys in the A4 Extension area and the ‘N’ conductor area included 27 km of moving loop time domain EM and 61.2 km of induced polarization-DC resistivity, conducted in order to define drill targets.
In winter 2022 a single diamond drill hole (PLN22-029) was completed on the ‘N’ conductor target. A total of 1,157 m was drilled. The unconformity was intersected at a depth of 675.9 m and the drill hole intersected multiple structures in the basement gneisses within a 91 m core interval that were strongly graphitic, in very broken sections of core displaying cataclastic and mylonitic textures indicative of both ductile shearing and brittle faulting. Anomalous radioactivity of 300 cps measured with a handheld RS-125 scintillometer was encountered in the drill hole at a depth of 783.3 m.
In July 2023, an airborne magneto-telluric (MT) survey was completed that covered the south part of the Minto Property. The intention was to map structure and conductivity at depth and attempt to discern valid data beneath shallow horizontal conductive cretaceous layers. Results are pending.
A ground gravity survey covering known conductors was completed in the early summer of 2024. A total of 1,748 stations were measured within the Minto claims. Final interpretation is pending.
Smart Lake Property
The Smart Lake Property consists of 3 claims covering 1,870 ha. It is approximately 25 km northwest of, and roughly on trend with, the recently discovered PLN JR Uranium Zone. There is no recorded historic groundwork within the property claims, but nearby historic drilling indicates a bedrock unconformity depth in the range of 250 m.
Page | 9
| F3
Uranium Corp. Management’s Discussion and Analysis For the year ended June 30, 2024 (Expressed in Canadian dollars, unless otherwise noted) |
|
Exploration properties (continued)
PLS Area, Canada (continued)
Wales Lake Property
The Wales Lake Property consists of 31 claims in a single geographic block totaling 42,134 ha. It is located outside the margin of the southwest Athabasca Basin. The Wales Lake claims are situated approximately 25 km to the south and west of Fission Uranium’s flagship Triple R uranium deposit and occupies the same stratigraphic position within the Clearwater Domain. The Wales Lake project represents relatively shallow depth target areas outside of the margin of the Athabasca Basin.
In summer 2017, the Company contracted Geotech Ltd. to use their helicopter-borne VTEM system to survey a total of 1,546 line-km at 200 m line-spacing over the Wales Lake claims within Blocks A & C.
A ground geophysical small moving loop electromagnetic survey was conducted by Discovery Geophysics Inc., in November 2018 within the Block C area. Nine grid lines were surveyed for a total of 21.5 km. Survey lines targeted prospective anomalies interpreted from the 2017 airborne VTEM survey. As a result of analysis of both surveys, a claim of 5,547 ha was staked in December 2018 to capture prospective ground on the southwest corner of Block C.
In December 2018, follow-up drilling within Block C targeted anomalies as interpreted from the ground electromagnetic survey. The drilling resulted in two completed holes totaling 586 m. The intersected lithologies were gneissic with intervals of moderate to strong hematite and chlorite alteration. Hole WL18-002 encountered a 0.5 m interval of anomalous radioactivity associated with a pegmatite vein.
In June 2019 a small moving loop TEM survey was conducted over a distance of 3.2 km on a single line in the northwest claim block (Block A). The purpose was to better delineate VTEM conductors.
Subsequently in July and August 2019 a VTEM survey was flown over two distinct claim blocks, B and C, covering a total area of 1,096 km. The survey successfully identified several conductive packages. Ground follow-up is necessary for complex conductors and P-type responses to establish drill targets.
Todd Property
The Todd Property encompasses 4 claims covering 9,704 ha. Its eastern boundary aligns with the Fission Uranium Corp.’s PLS Property, which hosts the Triple R uranium deposit. Like the PLS Property, the Todd Property lies outside the Athabasca Basin’s sediment cover. Most of the Property overlies granites of the Clearwater Domain and high metamorphic grade orthogneisses of the Lloyd Domain.
Historically, minimal exploration work was conducted until 2013. During this year, Dale Resources Corp. (DRC) and Aldrin Resources Corp. (ARC) flew a high-resolution magnetic and electromagnetic (VTEM) airborne survey. This was done in tandem with an airborne spectrometer survey. Five areas within the Todd Property boundaries were selected for ground follow-up due to their anomalous uranium (ppm) values. It remains unclear whether any subsequent groundwork was carried out.
In 2016, DRC/ARC flew an airborne audio frequency electromagnetic (AFMAG ZTEM) survey over the south half of the Property. The interpretation of this survey revealed two zones indicating deep basement conductors extending into the sedimentary sections. Both zones are flanked by basement uplift and structure, as inferred from airborne magnetics.
Page | 10
| F3
Uranium Corp. Management’s Discussion and Analysis For the year ended June 30, 2024 (Expressed in Canadian dollars, unless otherwise noted) |
|
Exploration properties (continued)
PLS Area, Canada (continued)
Todd Property (continued)
In August 2023 F3 Uranium Corp. completed a 359 line-km heli-borne MobileMT electromagnetic and magnetic survey over the north half of the Todd Property. The purpose was to map bedrock structure and lithology, including possible alteration and mineralization zones. The survey data was inverted to obtain resistivity distribution with depth.
James Creek Property
The James Creek Property was map-staked in January 2024 and comprises 2 non-contiguous claims covering 1,089 ha. The property is 43 km northeast of the PLN JR uranium zone, and 20 km southeast of the Shea Creek uranium deposits (four zones containing 67.57 Mlbs of U3O8 Indicated and 28.06 Mlbs U3O8 Inferred). The James Creek area is characterized by north-northwest trending strike-extensive electromagnetic conductors, associated with a wide magnetic low that may be indicative of favourable metasediment lithologies. The property has seen minimal recent exploration efforts and no historic drilling.
Key Lake Area, Canada
The Key Lake area is a significant historic mining district that hosts the Key Lake uranium deposits and mine and mill complex, co-owned by Cameco Corp. and Orano Canada Inc. This mine produced 208 million pounds of uranium from 1975 to 1997. The Key Lake mill, one of the world’s largest, processed ore from the McArthur River uranium deposit. However, due to low uranium prices, Cameco announced an indefinite suspension of mining of McArthur River in 2018. The area is considered highly prospective for discovering new uranium occurrences.
The Company’s Key Lake Area portfolio includes five properties: Bird Lake, Grey Island, Lazy Edward Bay, Seahorse Lake and Henderson Lake. These properties total 38 claims and 60,489 ha. They are located within and near the Key Lake Shear Zone, a broad northeast-southwest trending metasedimentary corridor characterized by a magnetic low in geophysical surveys. Numerous basement EM conductors are present within this corridor.
These EM conductors in metasedimentary corridors represent the classic setting for structurally controlled Athabasca-style high-grade uranium deposits. The Company believes its Key Lake area properties could host near-surface high-grade uranium mineralization similar to the nearby historic Key Lake deposits. All properties have undergone significant historic exploration that has identified various geophysical and geochemical anomalies and enhanced their overall merits.
Recent developments on the Key Lake Area properties include:
Bird Lake Property
Acquired by staking in February 2020, the Bird Lake Property comprises 1 mineral claim with an area of 1,803 ha. It is located 13 km northeast of the McArthur River Uranium Mine. The property overlies a northeast trending regional magnetic low within favourable Wollaston domain lithologies and is associated with the prospective Bird Lake fault system, a large scale thrust fault with offset of up to 50 m and overlain by approximately 150 m of Athabasca sediments.
In April and May 2022, geophysical surveys were conducted, resulting in the collection of 11.53 line-km of DC Resistivity and 10.50 line-km of Small Moving Loop Time Domain Electromagnetics data. The interpreted responses were weak and no definitive drill targets could be established. However, there is potential to follow up historic (pre-Fission) drilling that targeted a possible extension of the Bird Lake fault trending onto the property from the east.
Page | 11
| F3
Uranium Corp. Management’s Discussion and Analysis For the year ended June 30, 2024 (Expressed in Canadian dollars, unless otherwise noted) |
|
Exploration properties (continued)
Key Lake Area, Canada (continued)
Grey Island Property
The Grey Island Property, acquired in October 2021 and expanded in January 2024, comprises 22 claims spanning an area of 47,912 ha. The property is situated 35 km east of a major basement structural feature, the Cable Bay Shear Zone (CBSZ). Prominent structural splays from the CBSZ intersect with a favourable northeast trending structure/conductor within the Grey Island property. A historic drill-hole on this feature revealed strong bleaching and alteration in the sandstone and anomalous uranium (2.16 ppm) above the unconformity. The basement rocks exhibited pyritic and highly graphitic mineralization.
Lazy Edward Bay Property
The Lazy Edward Bay Property was staked in April 2020 and comprises 11 mineral claims covering an area of 1,828 ha. This property is located over shallow sandstone cover along the highly prospective Wollaston-Mudjatik lithologic trend of the eastern Athabasca Basin. The western portion of the property captures most of the Ponderosa conductive trend, along with historic drill holes LE-072 and LE-073 that respectively encountered 170 ppm uranium in brecciated and sheared gneiss, and 40 ppm uranium along with 550 ppm boron within sandstone fault gouge. Claims in the eastern portion of the property cover part of the Liberty conductive trend, with nearby historic drillhole LE-001 intersecting 224 ppm U3O8 over 0.5 metres.
A ten-hole, 3,005 m drill program was carried out in May and June 2022. Drilling encountered favorable structure and alteration along the Horse West (aka Ponderosa) conductor near historic hole LE-073, confirming this conductive corridor’s prospectivity for possible high-grade uranium mineralization. Geochemical analyses of drill core returned weakly anomalous radioactivity over narrow widths. Further drilling along this conductor is warranted. The drilling program was funded by Traction Uranium Corp., per the terms of their December 9, 2021 Option Agreement whereby Traction can acquire up to a 70% interest in the property. On December 24, 2022, Traction terminated the option for the Lazy Edward Bay Property.
Seahorse Lake Property
The Seahorse Lake Property, staked in April 2020, encompasses 3 mineral claims over an area covering 7,519 ha. Situated above shallow sandstone cover, this property aligns with the highly prospective Wollaston-Mudjatik lithologic trend of the eastern Athabasca Basin. A historic drill-hole (4679-1-81) targeted a resistivity low anomaly and encountered fractured broken core from a depth of 53 m past the Athabasca unconformity to a depth of 139 m. In the summer of 2022, a ground Moving Loop Time Domain EM survey covered 14.55 km to define conductive geologic structures on the property. The survey responses likely indicated a wide conductive block as the source of historic airborne electromagnetic anomalies.
Henderson Lake Property
The Henderson Lake Property was staked in January 2024 and consists of 1 claim totaling 1,427 hectares. The area is characterised by the Cable Bay Shear Zone (CBSZ), a significant crustal-scale structural feature that transects the Athabasca Basin through the Mudjatik geologic domain. The property encompasses a small portion of a strike-extensive conductor system that is coincident with the CBSZ and lies just 20 km south of the Athabasca Basin’s sedimentary cover. Nearby historic drilling returned 0.06% U3O8 in quartz/pegmatite zones within graphitic semi-pelitic metasediments.
Page | 12
| F3
Uranium Corp. Management’s Discussion and Analysis For the year ended June 30, 2024 (Expressed in Canadian dollars, unless otherwise noted) |
|
Exploration properties (continued)
Beaverlodge/Uranium City Area, Canada
The Beaverlodge/Uranium City region is a major historic uranium mining district and was home to Saskatchewan’s first uranium mining operations. Before the discovery of high-grade uranium mineralization in the Athabasca Basin, the Beaverlodge area was Saskatchewan’s most important uranium mining district. Throughout the 1950’s and 1960’s, 52 mines were in operation.
The Beaverlodge/Uranium City Area portfolio consists of 16 claims covering 18,772 ha across two properties. The most recent developments on these properties are as follows:
Beaver River Property
The Beaver River Property consists of 9 claims totaling 7,599 ha. Located on the north central edge of Saskatchewan’s Athabasca Basin, it is approximately 44 km east of Uranium City, Saskatchewan. The property includes numerous confirmed EM basement conductors and several uranium showings with surface outcrop sample assays of up to 3.66% U3O8.
In May 2016, the Company completed an airborne VTEM survey covering 880 line-km at 200 m line-spacing. This survey was focused on the property’s eastern portion, an area known for its several identified historic in-situ uranium anomalies. The survey defined conductive packages over the entire project area, with more than 258 km of conductors identified by the VTEM survey. The interpreted results indicate the presence of complex conductor swarms requiring ground follow-up to establish drill targets. The project area is characterized by numerous zones of enhanced conductivity and many areas where trend widening is evident due to an increase in parallel multiple conductors. Additionally, there are numerous offsets and termination points indicative of cross structure.
In July and August 2019, the Company carried out a field program that prospected historic showings, airborne radiometric anomalies, and VTEM anomalies near zones of structural complexity, in the south-central and north area of the property. Significant results from historic showings included Coin Canyon with assays of 2.55% U3O8 and 0.41% Ni, Kisiwak Lake running 2.04% U3O8 and 0.26 g/t Au, and the VIC showing with up to 1.1% U3O8 0.98% Cu, and 0.14% Ni. New discoveries in the north area of the property included the Trigger Zone - a radioactive vein (0.3 m wide) hosted in a quartz-feldspar gneiss running up to 13.9% U3O8 and 2.27 g/t Au.
Hearty Bay Property
The Hearty Bay Property, located on the northern edge of the Athabasca basin, comprises 7 mineral claims totalling 11,173 ha. It is situated 20 km west of the Fond-du-Lac uranium deposit and 60 km east of the Beaver Lodge uranium district.
The Property encompasses the historic Isle Brochet radioactive sandstone boulder trains. These are one-kilometer-long dispersal trains that trend along the main ice direction and containing up to 3% uranium. Several more radioactive boulders of both sandstone and basement origin were discovered approximately 600 m to the northeast, on the bottom of Lake Athabasca. Historic drilling near these boulders did not intersect any significant radioactivity, leaving the source undetermined. Historic surveys identified strong airborne EM conductors within the property, up-ice of the radioactive boulder trains.
In July-August 2019, the Company conducted a field program that examined glaciology characteristics of the radioactive boulder train area and prospected conductors and radiometric anomalies on the north mainland. Boulder prospecting on Isle Brochet yielded results exceeding historic findings, with uranium content up to 8.23% U3O8 in new sampling. Additionally, 271 km of detailed marine acoustic data was collected northeast of Isle Brochet and up-ice of the radioactive boulder trains. This data revealed structural lineaments and potential sandstone outliers that may be associated with the source of the radioactive boulders on Isle Brochet and represent possible drill targets. A marine spectrometer survey collected 1,161 measurements of the lake bottom in areas interpreted from the acoustic survey as prospective for sandstone outliers. This reaffirmed an area of submarine radioactive boulders found by Eldorado Nuclear/DNR in 1977 and located groupings of anomalous results further up-ice from the island boulder trains. A radon soil gas survey sampled 148 sites across the strike of the radioactive boulder trains; however, results from this survey were inconclusive.
Page | 13
| F3
Uranium Corp. Management’s Discussion and Analysis For the year ended June 30, 2024 (Expressed in Canadian dollars, unless otherwise noted) |
|
Exploration properties (continued)
Beaverlodge/Uranium City Area, Canada (continued)
Hearty Bay Property (continued)
In March 2022, the Company carried out a 77 line-km ground EM geophysics survey and completed 14 drill holes for a total of 1,304 m of diamond drilling. The objective was to test interpreted structural features and sandstone outliers based on the 2019 marine seismic acoustic survey in the main up-ice direction from the historic high-grade uranium boulder trains on Isle Brochet and beyond the known edge of the Athabasca Basin. While no sandstone outliers were identified, holes HB22-005 and HB22-008 intersected a three-meter zone and an 11.5 m zone, respectively of brecciated and faulted basement rocks with hydrothermal clay alteration. The ground EM survey identified previously unknown northeast-trending basement conductors to the northeast of Isle Brochet. Drillhole HB22-008 is located at the southwest end of these new two-kilometer-long subparallel conductors. The ground geophysics and drilling program was funded by Traction Uranium Corp., in accordance with the terms of the December 9, 2021 Option Agreement, whereby Traction can acquire up to a 70% interest in the property from the Company.
In the fall of 2022, Palmer Environmental Consulting Group (now a division of SLR Consulting Ltd.) was employed to complete a reconnaissance field visit to Isle Brochet. The purpose was to characterize the surficial environment where high-grade uranium boulders were discovered and to identify suitable exploration strategies for ongoing work programs. A team prospected the south part of the island and discovered new in-situ mineralized boulders. It was also found that sub-glacial till, an optimal media for exploration purposes, was commonly present at depth. As a result, an island-wide base-of-till sampling program was developed and carried out by Palmer during winter 2023. The data revealed two distinct linear dispersal patterns in subglacial till composed of uranium and other pathfinder elements, thereby providing new target areas for drill testing in 2024. Six new radioactive boulders were also discovered that assayed up to 4.23% U3O8.
In conjunction with Palmers research work, an airborne Lidar survey was flown in fall 2022 to provide detailed glacial landform mapping to supplement the ground based studies.
In early 2024 a ground gravity survey was completed to cover areas of interest up-ice of the Isle Brochet radioactive boulders. The survey was expected to delineate areas of possible basement rock alteration that is favourable for uranium mineralization.
In March 2024 a sonic drill rig was mobilized to the property in a program designed to find the source of the glacially dispersed uraniferous boulders and anomalous till geochemistry on Isle Brochet. The program envisioned 2,000 m of drilling that would sample both overburden and bedrock. The program was halted due to deteriorating ice conditions.
Northeast Athabasca Basin Area, Canada
The Company possesses 29 claims, which total 22,578 ha, spread across four uranium properties in the Northeast Athabasca Basin area of Saskatchewan. This basin area overlays the northeast trending Wollaston-Mudjatik Transition/Shear Zone, expressed as a broad low magnetic zone in the basement rocks. This zone often exhibits conductive characteristics coinciding with known uranium deposits including McArthur River, Cigar Lake, and Rabbit Lake. All properties are prospective for basement and/or unconformity hosted mineralization settings.
The most recent developments on the Northeast Athabasca Basin Area properties are follows:
Bell Lake Property
Acquired in July 2023 through staking, the Bell Lake property consists of 1 claim totaling 2,225 ha. It is located within the northeast Athabasca Basin, approximately 55 km northwest of the McLean Lake Uranium Mine and Mill. Access is available from Provincial Highway #905, three kilometers to the west.
Page | 14
| F3
Uranium Corp. Management’s Discussion and Analysis For the year ended June 30, 2024 (Expressed in Canadian dollars, unless otherwise noted) |
|
Exploration properties (continued)
Northeast Athabasca Basin Area, Canada (continued)
Bell Lake Property (continued)
Bell Lake is nine kilometers west of the recently discovered Hurricane Uranium Zone. Drilling at the Hurricane Zone in 2020 revealed high-grade mineralized intersections of 33.9% U3O8 over 8.5 m, including 57.1% U3O8 over 5.0 m. The Athabasca sandstone cover is expected to be approximately 300 m thick based on nearby drilling; however, no historic drilling has been carried out within the property.
Cree Bay Property
The Cree Bay property comprises 16 claims totaling 14,080 ha and is located on the inside edge of the northern Athabasca Basin. The town of Stony Rapids is 20 km to the north, and the historic Nisto uranium mine is 13 km to the northeast.
In August 2015, a high resolution airborne magnetic and radiometric survey covering 4,214 line-km at 50 m line spacing was completed over the property.
In September 2017, a DC Resistivity Induced Polarization ground geophysical survey was conducted, covering two separate grids spanning 24 km. The survey focused on sections of strong conductivity, interpreted from a historic airborne Geotem electromagnetic survey. It detected basement conductive features and some sandstone resistivity low (alteration) features. However, difficulties were encountered while surveying on Black Lake. The survey confirmed anomalous conditions indicative of alteration halos in the lower sandstone.
In April 2019, Discovery Geophysics Inc. conducted a nine-line, 27 km DCIP Resistivity and moving loop TEM survey over the area identified as most prospective by the historic GEOTEM electromagnetic survey. The TEM survey results returned weak conductor responses, while the DC/IP resolved a strong resistivity anomaly on L2700 and a weaker one on L2100.
In June 2019, the Company completed a first pass drill program on the property. Two holes were drilled for a total of 1,045 m, encountering significant faulting, strong hydrothermal alteration, and elevated concentrations of pathfinder elements. The depth to the basement unconformity was intersected approximately 200 m deeper than expected, indicating a possible major offset in the vicinity. This could be a favorable setting for hosting high-grade uranium, such as at the MacArthur River deposit. Both holes were drilled on the same section line and intersected the same anomalous fault zone. This defined a broad target area, approximately 300 m, for potential follow-up drilling where it roughly projects to intersect the basement unconformity, approximately 600 m down dip.
Due to the deeper than expected basement unconformity, the previous ground geophysics could not image deep enough. In March 2022, the Company carried out a 10.5 line-km Sideline Moving Loop Time Domain Electromagnetic (TDEM) survey designed to pinpoint potential conductive basement faults at these greater depths and provide discrete drill targets. These may represent reactivated structures with the potential to provide pathways for uranium mineralizing fluids. The survey interpretation revealed two significant conductors: Conductor B is a shallower feature located underneath Black Lake; Conductor A is significantly deeper (between 383 m and 597 m depth) and lies along the west edge of the resistivity low anomaly that was detected during the 2019 surveys. This conductor location is west of where it was originally interpreted from the 2019 survey.
Flowerdew Lake Property
The Flowerdew Lake Property, acquired in October 2021, comprises 4 mineral claims totaling 5,664 ha. The property is located along the Wollaston-Mudjatik lithostructural transition zone, approximately 60 km northeast of Rabbit Lake. It overlies a strongly conductive basement feature that coincides with a significant resistivity low zone. This is indicative of altered basement meta-pelite rocks favourable for uranium mineralization. The property has not been drill tested.
Page | 15
| F3
Uranium Corp. Management’s Discussion and Analysis For the year ended June 30, 2024 (Expressed in Canadian dollars, unless otherwise noted) |
|
Exploration properties (continued)
Northeast Athabasca Basin Area, Canada (continued)
Murphy Lake Property
The Murphy Lake Property comprises 8 mineral claims covering an area of 609 ha. This Property is located in the eastern Athabasca Basin, on the west edge of the favourable Wollaston-Mudjatik lithologic trend. The Property covers a curvilinear EM conductor that is a splay to the east from a regional conductive trend. This trend hosts the La Rocque Uranium Zone, 4.5 km to the west, where intersections along a 400 m drill-defined strike length have returned up to 18.6% uranium over 2.7 m, along with high values of associated base metals and gold. The same trend hosts the Hurricane Uranium Zone recently discovered by ISO Energy Ltd., which is currently 575 m long, 75 m across, and 11 m thick.
Historic drilling by Areva along the conductor within the Property intersected a graphitic and sulphide rich basement conductive unit, with assays up to 199 ppm uranium at 350 m depth, just above the unconformity.
A five-hole, first-pass drill program spanning 2,502 m was initiated in July 2022. The initial aim of the program was to follow a north-striking conductor trend on the east side of the property where Cameco intersected uranium values up to 0.09% U3O8 in historic drill hole Q23-5, 3.2km south of the property boundary. The intersection of encouraging graphite and sulphide-rich basement structures prompted the Company to continue to define the structures northward with ground EM Geophysics. The drill program was expanded and consisted of 14 completed drillholes totalling 6,850m. Drill hole ML22-006, located 4.2km north of Cameco’s historic drill hole Q23-5, intersected a two-meter interval of variable radioactivity including a 0.5 m interval with a maximum of 2,300 cps, 20.9 m below the Athabasca Unconformity. This resulted in laboratory assays of 0.065% U3O8 over 2.5m from 322.5m to 325.0m, including 0.242% U3O8 over 0.5m.
Traction Uranium Corp. Option Agreements
On December 9, 2021, the Company entered into two Option Agreements with Traction Uranium Corp. (Traction) for Traction to acquire up to a 70% interest in two properties controlled by the Company: Hearty Bay Project, and the Lazy Edward Project.
On February 28, 2023, the Company entered into an amending agreement with Traction to extend the time for Traction to incur the exploration expenditures.
Hearty Bay Project
Pursuant to the Option Agreements in respect of the Hearty Bay Project (the “Hearty Bay Agreement”), the Company granted an option to Traction to acquire a 50% interest in the Hearty Bay Project for the following consideration:
| i. | Pay cash payments to the Company of $650,000 over a two-year period (met - $150,000 received in 2024; $200,000 received in 2023; and $300,000 received in 2022). |
| ii. | Issue shares to the Company equal to 7.5% of the number of issued and outstanding common shares of Traction that are outstanding as of such date, provided Traction has completed one or more equity financings for gross proceeds of $2,000,000 by such date (the Company received 3,023,476 Traction shares on December 29, 2021 with a fair value of $2,569,955) (met). |
Page | 16
| F3
Uranium Corp. Management’s Discussion and Analysis For the year ended June 30, 2024 (Expressed in Canadian dollars, unless otherwise noted) |
|
Traction Uranium Corp. Option Agreements (continued)
| iii. | Incur $3,000,000 in exploration work on the Hearty Bay Property by December 31, 2024. On March 11, 2022, the Company received $1,000,000 in cash to be used for mineral expenditures. As at June 30, 2023, the Company had incurred the $1,000,000 in eligible expenditures. During the year ended June 30, 2024, the Company received an additional $2,000,000 in cash to be used for mineral expenditures. As at June 30, 2024, the Company incurred $1,660,974 in eligible expenditures and has a commitment to spend the remaining $339,026. |
To acquire the additional 20% interest in Hearty Bay Project, Traction will need to incur the following:
| i. | Additional cash payments totalling $350,000 ($150,000 on or before June 6, 2025; and $200,000 on or before December 9, 2025). |
| ii. | Incur an additional $3,000,000 in exploration work on the Hearty Bay Property on or before December 9, 2025. |
The Company will retain a 2.0% net smelter royalty (“NSR”) on the property.
During the year ended June 30, 2024, the consideration received was offset against the capitalized exploration and evaluation expenditures, to reduce the balance to $Nil (2023 - $nil) and the remainder of $nil (2023 - $nil) was recognized as a recovery on mineral rights in the statements of loss and comprehensive loss.
Lazy Edward Project
Pursuant to the Lazy Edward Project Option Agreement (the “Lazy Edward Agreement”) the Company granted Traction an option to acquire a 50% interest in the Lazy Edward Project for the following consideration:
| i. | Pay cash payments to Fission of an aggregate of $550,000 over a two-year period (not met - $nil received in 2023; $300,000 received in 2022). |
| ii. | Issue shares to the Company equal to 7.5% of the number of issued and outstanding common shares of Traction that are outstanding as of such date, provided Traction has completed one or more equity financings for gross proceeds of $2,000,000 by such date (the Company received 3,023,476 Traction shares on December 29, 2021 with a fair value of $2,569,955) (met). |
| iii. | Incur $4,500,000 in exploration work on the Lazy Edward Property over the first two years of the contract. On May 20, 2022, the Company received $1,500,000 in cash to be used for mineral expenditures. As at June 30, 2022, the Company incurred $1,406,344 in eligible expenditures and the remaining balance of $93,656 was incurred during the year ended June 30, 2023. As at June 30, 2023, Traction has not yet met the full exploration commitment. |
The Company will retain a 2.0% NSR on the property.
During the year ended June 30, 2023, Traction terminated the Lazy Edward Agreement.
Page | 17
| F3
Uranium Corp. Management’s Discussion and Analysis For the year ended June 30, 2024 (Expressed in Canadian dollars, unless otherwise noted) |
|
SKRR Exploration Inc. Option Agreement
On May 10, 2023, the Company entered into an option agreement with SKRR Exploration Inc. (“SKRR”) whereby SKRR has the opportunity to acquire up to a 70% interest in the Company’s Clearwater West Project.
On January 10, 2024, the Company entered into an amending agreement with SKKR to extend the time for SKRR to incur the exploration expenditures. In consideration of amending the terms, SKRR will issue to the Company 1,000,000 additional common shares, as outlined below.
Pursuant to the Clearwater West Option Agreement (the “Clearwater West Agreement”), the Company granted SKRR an option to acquire a 50% interest in the Clearwater West Project for the following consideration:
| i. | Pay cash payments to the Company of $50,000 (met - $50,000 received). |
| ii. | The issuance of 1,000,000 common shares of SKRR (met - received with a fair value of $225,000). |
| iii. | Incur $3,000,000 in exploration work on the Clearwater West Property (extended to on or before May 10, 2025). |
| iv. | Issue a further 605,000 common shares of SKRR to the Company upon the approval by the TSX Venture Exchange of the amending agreement (met – received with a fair value of $78,650). Additionally, SKRR is required to issue an additional 395,000 common shares on or before June 1, 2024 unless subsequent to such share issuance, the Company’s partially diluted shareholdings in SKRR would exceed 10% of the issued and outstanding shares of SKRR. In which case SKRR shall pay $39,500 in cash on or before June 5, 2024. |
Upon completion of the 50% interest earn-in, SKRR and the Company will automatically enter into a joint venture and will negotiate to formalize a joint venture agreement. Pursuant to the terms of the Clearwater West Option Agreement, SKRR will have the option to increase its interest in the Clearwater West Property to 70% by making additional cash and exploration expenditures:
| i. | Additional cash payments totalling $50,000 on or before December 31, 2024. |
| ii. | Incur an additional $3,000,000 in exploration work on the Clearwater West Property on or before the date that is three years following the date of the Clearwater West Agreement. |
The Company will retain a 2.0% NSR on the property, of which 1% may be repurchased by SKRR for $1,000,000.
During the year ended June 30, 2024, the total consideration received of $78,650 was offset against the capitalized exploration and evaluation expenditures, to reduce the $4,728 balance to $nil and the remainder of $113,422 was recognized as a recovery on mineral rights in the consolidated statement of loss and comprehensive loss.
Page | 18
| F3
Uranium Corp. Management’s Discussion and Analysis For the year ended June 30, 2024 (Expressed in Canadian dollars, unless otherwise noted) |
|
Murphy Lake Option Agreement
On May 29, 2024, the Company entered into a definitive agreement with Canadian GoldCamps Corp. (“GoldCamps”), pursuant to which GoldCamps can earn up to a 70% interest in and to the Company’s Murphy Lake Property.
To earn an initial 50% in and to the Murphy Lake Property, GoldCamps made a non-refundable cash payment of $100,000 to the Company during the year ended June 30, 2024. In consideration for entering into the Agreement, GoldCamps shall make a further non-refundable cash payment of $200,000 to the Company on July 26, 2024 (unpaid). In order to maintain the option in good standing, GoldCamps shall make additional and non-refundable cash payments to the Company in the aggregate of $600,000 according to the following schedule:
| i. | $150,000 on or before the date that is six (6) months after the July 26, 2024; |
| ii. | $150,000 on or before the date that is twelve (12) months after the Initial July 26, 2024; |
| iii. | $150,000 on or before the date that is eighteen (18) months after the July 26, 2024; and |
| iv. | $150,000 on or before the date that is twenty-four (24) months after the July 26, 2024. |
To further maintain the option in good standing, GoldCamps shall incur the following aggregate expenditures totaling $10,000,000 according to the following schedule:
| i. | total cumulative expenditures of $5,000,000 on or before the date that is twelve (12) months after the July 26, 2024; and |
| ii. | additional expenditures of $5,000,000 on or before the date that is twenty-four (24) months after the July 26, 2024. |
All expenditures required to be made by GoldCamps may either make the required expenditures or pay the Company in cash for any shortfall, such cash payment to be made within 30 days of the end of the period for which such expenditures are required to be made pursuant to this option agreement.
In order to maintain the option agreement in good standing, GoldCamps shall, on or before the date that is ten (10) business days after the date that Canadian GoldCamps has completed one or more equity financings to raise gross proceeds totalling at least $6,000,000, issue from treasury to F4 for no additional consideration that number of common shares equal to 9.9% of the total number of common shares that are issued and outstanding as of such issuance date. All common shares issued will be issued as fully paid and non-assessable free and clear of all encumbrances, subject only to a four-month resale restriction imposed by applicable securities legislation. Failure to issue the common shares to F4 in accordance with the schedule will result in the termination of the Initial Option.
Page | 19
| F3
Uranium Corp. Management’s Discussion and Analysis For the year ended June 30, 2024 (Expressed in Canadian dollars, unless otherwise noted) |
|
Murphy Lake Option Agreement (continued)
Upon GoldCamps earning a 50% interest in and to the Murphy Lake Property, both parties agree to participate in a joint venture for the further exploration and development of the Murphy Lake Property, and, if deemed warranted, to bring the Property or a portion thereof into commercial production by establishing and operating a mine.
To earn an additional 20% interest in and to the Murphy Lake Property (for a total 70% interest), GoldCamps must make cash payments to the Company and incur eligible expenditures as follows:
| i. | pay $250,000 on or before the date that is thirty (30) months after the July 26, 2024; |
| ii. | pay $250,000 on or before the date that is thirty-six (36) months after July 26, 2024; and |
| iii. | incur additional expenditures of $8,000,000 on or before the date that is thirty-six (36) months after the July 26, 2024. |
Upon GoldCamps earning a 70% total interest in the Murphy Lake Property, the Company shall receive a 2% net smelter royalty (“NSR Royalty”), provided that GoldCamps be responsible only for the percentage of the NSR Royalty equal to its percentage interest in the Murphy Lake Property.
Page | 20
| F3
Uranium Corp. Management’s Discussion and Analysis For the year ended June 30, 2024 (Expressed in Canadian dollars, unless otherwise noted) |
|
Uranium outlook
Management believes that the exploration and development of uranium properties presents an opportunity to increase shareholder value based on the following categories, including but not limited to supply / demand fundamentals, geopolitics and clean, baseload power generation.
| ● | Increased long-term worldwide demand for nuclear energy |
Global nuclear energy demand and the associated nuclear power plant build-out is projected to increase significantly in the years ahead, which will require new uranium supply to meet this increasing demand. According to the International Atomic Energy Agency (“IAEA”) global electricity demand is forecast to grow by nearly 60% from 2018 to 2040 and over 90% by 2050.
The World Nuclear Association (“WNA”) states that there are 442 nuclear power reactors in operation supplying 30 countries around the world, with 53 under construction, another 104 planned and 325 proposed. Reactor builds continue to be near multi-decade highs as more than twice as many reactors are under construction now than before the Fukushima event in 2011.
Many analysts continue to forecast a long-term global uranium demand/supply imbalance, which suggests the potential for materially higher uranium prices. The following is a list of selected countries with nuclear reactors that are either under construction, planned or proposed:
| Country | In Operation | Under construction | Planned | Proposed | ||||
| China | 48 | 14 | 42 | 168 | ||||
| India | 22 | 7 | 14 | 28 | ||||
| Russia | 39 | 3 | 24 | 22 | ||||
| USA | 94 | 2 | 3 | 18 | ||||
| Canada | 19 | - | - | 2 | ||||
| Japan | 33 | 2 | 1 | 8 | ||||
| Saudi-Arabia | - | - | - | 16 | ||||
| South Korea | 24 | 4 | - | 2 | ||||
| Ukraine | 15 | 2 | - | 2 | ||||
| Others | 148 | 19 | 20 | 59 | ||||
| Total | 442 | 53 | 104 | 325 |
Source: World Nuclear Association (World Nuclear Reactors & Uranium Requirements - www.world-nuclear.org - Updated November 2020)
Page | 21
| F3
Uranium Corp. Management’s Discussion and Analysis For the year ended June 30, 2024 (Expressed in Canadian dollars, unless otherwise noted) |
|
Uranium outlook (continued)
Uranium demand/supply fundamentals
A global uranium demand/primary supply imbalance has existed for many decades, due to the way utilities procure supply and the negative impact on demand stemming from the Fukushima event. Primary uranium supply from uranium producers (mining) has consistently failed to keep pace with demand. This shortfall has been filled from secondary supply, which includes the sale of government stockpiles, spent fuel reprocessing, extending conversion processes, and the highly enriched uranium (“HEU”) agreement (which ended late 2013). Meanwhile, global inventory stockpiles have and continue to be drawn down. While the total inventory figure is difficult to ascertain due to the fact that a significant amount is held in national strategic stockpiles of various governments or stored in the inventories of non-public utilities and other entities, it is important to note that not all inventory is mobile. Sovereign nations will keep their strategic stockpiles for energy security while other material classified as inventory may either be of low grade that will require reprocessing or be in the form of a prefabricated fuel that will require disassembly and reprocessing to be usable for others. It is notable that there has been a change this past year in that the supply from inventories appears to have diminished substantially and that the majority of spot market supply comes from uncommitted production. This signals the possibility that the amount of mobile supply from inventories is nearing a point where it is not mobile at current prices.
Add to this the fact that there are a few mines that will be exhausted in the near future and this points to the possibility that there will be significantly less supply available going forward.
U3O8 prices have risen from the mid US$20/lb level due to the suspension of large mines such as Cameco’s Cigar Lake and the production reduction by NAC Kazatomprom JSC – the world’s largest producer of uranium. Although Cameco has restarted Cigar Lake in September of 2021, a potential outbreak of COVID-19 could possibly cause another interruption in operations. Indeed, the emergence of the global COVID-19 pandemic has caused the closure of many businesses around the world and mines of all commodities have not been an exception. As a result, there may be additional mine closures or curtailments that may further impact global uranium supply if the virus impacts other uranium operations.
This further reduces supply that was already declining due to the ongoing shutdown at McArthur River, and the winding down of the Cominak and Ranger mines.
According to the UxC, mine production peaked in 2016 at 162mm lbs. It fell to 154mm lbs in 2017 and in 2019 production was 142mm lbs. Meanwhile, 2020 reactor demand was 177mm lbs, which generated a gap or shortfall of roughly 35mm in 2020. This supply demand imbalance can be perceived as a positive development for the long-term outlook for uranium prices. In addition, roughly 85% of the current producers are uneconomic at today’s uranium prices. A significant issue in the uranium market is that state-owned entities supply over half of the market, further exacerbating pressure on commercial producers. The UxC suggests that uranium producers need roughly US$45 to $50 per lb uranium to meet their cost of capital. While Tradetech has begun presenting a Production Cost Indicator, which attempts to capture the cost of production (US$43.15/lb as of October 31, 2020). While other industry analysts, including RBC Capital (Canada), Raymond James Canada, and Resource Capital Research (Australia), suggest that a healthy, sustainable global uranium mining sector, requires a uranium price of US$70-$80/lb to stimulate new exploration and mine development worldwide.
Page | 22
| F3
Uranium Corp. Management’s Discussion and Analysis For the year ended June 30, 2024 (Expressed in Canadian dollars, unless otherwise noted) |
|
Uranium outlook (continued)
An additional under-reported issue related to uranium demand, is the disruption of the traditional utility buying cycle. Most uranium is bought and sold via long-term contracts (historically five to ten years in duration) and typically, utilities ensure their fuel requirements are covered between three and five years out. Since the Fukushima event, most utilities have been allowing their contracts with suppliers to get closer to expiry and are relying on their stockpiles or are buying on the secondary market. In fact, the “carry trade” (the act of uranium traders to borrow money in the global low interest rate environment, buying spot or near-term uranium at low prices, and then selling for future delivery to utilities at low prices in order to capture the spread) has been prevalent for years. Since uranium prices have been at historically low levels, many producers have been hesitant to sign long term contracts with utilities that are seeking to renew since they cannot meet their cost of capital at those depressed, unsustainable prices. The result is that the amount of uranium fuel required over the next five years that is currently uncovered by long term contracts is rapidly increasing. It is worth noting that when new reactors are connecting to the electricity grid, they require frontloading of as much as three times annual uranium stock. This is bullish for the demand picture. Many experts in the industry expect that this will inevitably force utilities into the market, leading to strong upward pressure on uranium spot prices which in turn will increase the longer-term contract price. It is also worth noting that the recent rise in the uranium spot price has limited the viability of the carry trade, which reduces the availability of this patchwork form of uranium supply for utilities – thus forcing them to pay more attention to traditional sources of supply, which may result in increased demand and further price strengthening. Indeed, market participants are noticing uncovered production, which was the primary source of supply to fuel traders for the carry trade, has made up a reduced portion of the supply as there is simply less being produced. This is evidenced by the fact that fuel traders are increasingly borrowing material from uranium funds.
Additionally, with its ongoing shutdown of McArthur River and prior suspension of Cigar Lake, Cameco will continue to have to buy significant pounds in the spot market. As of its most recent quarterly update, Cameco claims that it is the world’s largest purchaser in the spot market and has acquired over 50mm lbs from the spot market to date.
| ● | Uranium demand/supply fundamentals |
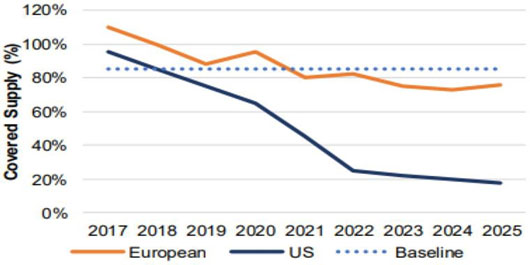
(Source: EIA, Euratom - Future contract coverage rates)
Page | 23
| F3
Uranium Corp. Management’s Discussion and Analysis For the year ended June 30, 2024 (Expressed in Canadian dollars, unless otherwise noted) |
|
Uranium outlook (continued)
| ● | Emerging Demand – Small Modular Reactors |
An emerging source of demand is the rising prominence of Small Modular Reactors (“SMR”). These relatively pint-sized reactors provide less than 300 MWe and are designed to be implemented quickly, require a small footprint, and can be deployed in areas that required power without much infrastructure such as in the Arctic, and other remote locations. In the United Kingdom, Rolls-Royce has announced that it is building up to 16 SMRs aided by a £200mm investment by the country. In Canada, there are 12 different models before Canadian regulators seeking approval.
| ● | China – driver of demand |
China has the most aggressive growth plans for nuclear. With only 4.9% of power generation currently met by nuclear power and a target of 20% non-fossil fuel generation by 2030, there is a significant reactor build required of approximately 500% of current capacity. According to research by the Chinese Ministry of Education and Tianjin University, China, within the 2018 Optimal Power Paper, nuclear energy is now the lowest cost source of electricity generation in China. Consequently, there are currently 14 nuclear power plants under construction in China.
China’s current domestic uranium production accounts for less than 25% of its annual requirements resulting in increased imports and stockpiling as it does not sell its domestic supply to the market but, rather consumes it in its reactors. In 2010, Cameco signed the first of two long-term contracts with Chinese-owned utilities for the delivery of uranium. Additional long-term demand is anticipated from other Asian countries, most notably India and South Korea as they expand their planned nuclear build-out. In 2015, Cameco signed its first contract with India to supply 7.1 million lbs of uranium concentrate through to 2020. CGN Mining’s offtake agreement with Fission Uranium is also highly significant as it highlights that China is moving to further secure its long-term uranium supply chain.
Page | 24
| F3
Uranium Corp. Management’s Discussion and Analysis For the year ended June 30, 2024 (Expressed in Canadian dollars, unless otherwise noted) |
|
Uranium outlook (continued)
China’s commitment to combatting air pollution is evident with nuclear energy benefitting as a zero carbon emissions power generation source. As the below chart depicts, at its lowest point nuclear represented 2% share of Chinese power generation, however that figure has been rising and in the last few months in 2018 it spiked to 5%. This production is coming at the expense of carbon emitting coal fired generation.
Figure 1. Share of nuclear power in China’s electricity generation mix
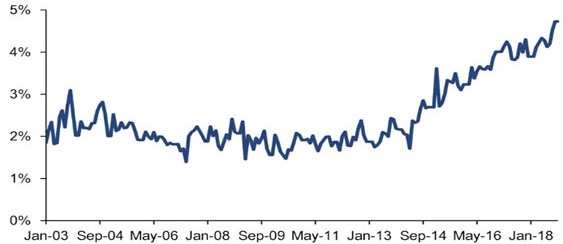
(Source: Citi Research - China’s power generation)
| ● | Japanese nuclear reactor fleet and uranium stockpiles |
Following the Fukushima event in March 2011, Japan shut down all of its nuclear reactors, pending new safety regulations, legislation, and inspections. A new nuclear regulator was established, and after considerable delay, Japan’s nuclear operators were given permission to apply to restart its reactors. This has been among the biggest drags on prices and sentiment in the uranium market. Market participants, specifically producers and issuers, have been adversely affected from this uncertainty as well as the delay in getting reactors restarted.
However, we continue to see improvements. Japan is currently operating a total of nine reactors, of which two were first restarted in 2015 and seven more have restarted since. A further 18 reactors are currently in the restart approval process with 16 of them already clearing government requirements for restart. This is in addition to the two reactors under construction and nine new reactors being planned or proposed. With reactors coming back online and plans to develop new ones, we view this as a positive development to the psyche of the market and the long-term outlook for nuclear power.
To provide context, Japanese nuclear power generation in 2010 represented 25% of the country’s total grid. By 2016 that number was reduced to 2% due to Fukushima. However, plans are to increase nuclear back to 20-22% by 2030.
While the first wave of reactor restarts in Japan is not expected to immediately increase uranium demand as they would likely draw from existing inventory, it should increase confidence that Japan’s utility companies most likely will not sell their uranium fuel stockpiles into the market.
Page | 25
| F3
Uranium Corp. Management’s Discussion and Analysis For the year ended June 30, 2024 (Expressed in Canadian dollars, unless otherwise noted) |
|
Uranium outlook (continued)
The potential for this estimated 90 million lbs of uranium to enter the spot market has been viewed as a significant threat to uranium prices since 2011 and analysts believe it has been a major factor in suppressing the buying cycle, utilities procuring supply contracts, and ultimately the price of uranium. However, it should be noted that at least some of this inventory is in the form of fabricated fuel assemblies. Fuel assemblies are generally reactor-specific and can not be simply purchased and plugged into another reactor that it was not designed for. As such, any purchaser of these assemblies would need to also factor in the cost and time of disassembling and refabricating these assemblies. With uranium prices continuing to be below the marginal cost of production for many producers, it may be better for utilities to acquire uranium through the primary supply chain as opposed to acquiring another utility’s inventory.
As a direct result of low uranium prices, Cameco, the largest commercial producer of uranium announced in April 2016 that it was suspending production at its Rabbit Lake uranium mine in Saskatchewan and placing the facility into “care and maintenance”. It was estimated by Cantor Fitzgerald that this removed 3% of the uranium available to the spot market and showed a strong trend that producers are acting to limit production worldwide. In November 2017, Cameco announced the temporary closure of the McArthur River mine and Key Lake processing facility. The McArthur River mine was the largest uranium mine in the world and its closure removed an estimated 7% of primary production for 2018.
In July 2018, Cameco announced it would layoff approximately 700 employees and shut down production at its McArthur River and Key Lake mine sites indefinitely due to a weak uranium market. This material announcement from an industry leader likely aided in the subsequent increase in uranium spot prices during the latter half of 2018. In 2020, Cameco announced the suspension of its Cigar Lake mine due to concerns over COVID-19. This removed about 18mm lbs. of U3O8 or approximately 13% of 2019 production. The Cigar Lake mine was restarted in September 2020 as the company navigates operating the mine during the era of COVID.
In addition to Cameco’s production curtailments, Kazatomprom has also cut its production guidance. This follows a period in which several new projects have been categorized as uneconomic. Worldwide projects cancelled or deferred since 2012 include: Yeelirrie and Kintyre in Australia (Cameco), Trekkopje in Namibia (AREVA), Imouraren in Niger (AREVA) and the Olympic Dam expansion in Australia (BHP). In 2020, due to measures to combat the COVID-19 pandemic, Kazatomprom announced reduced production guidance that was 10.4 mm lbs. of U3O8 (or roughly 18%) less than its prior outlook. In its Q3/20 market update, Kazatomprom estimated that total global production would be approximately 14% lower than 2019 due to the uncertainty caused by the pandemic and low uranium price environment.
In May 2019, Orano Canada confirmed the closure of its Cominak mine in Niger and cited “very low price conditions” as the reason. It also announced the suspension of production from its McClean Lake Mill in March 2020 in response to the COVID-19 pandemic. Energy Resources of Australia’s Ranger mine closed in January 2021.
| ● | Supply deficits |
Increasing the pressure on medium to long term supply is the lengthy period (approximately ten years on average) and capital costs required to take a uranium project from discovery to production. At the October 2019 NEI Conference, a prominent uranium hedge fund illustrated that the total capital costs of nine greenfield projects will require US$4.6 billion dollars of capital to build their respected mines. COVID-19 related issues have led to planned future production reductions such as Kazatomprom’s earlier announcement that it would produce 20% less than original forecast in 2022 (approximately 14.3 mm lbs). With many projects stalled or abandoned, analysts believe that a growing supply/demand imbalance may be difficult to deal with once secondary supplies can no longer meet rising demand which started to happen in 2018. This increases the attractiveness of assets that have the potential to be taken into production in stable political jurisdictions and at a lower operating cost. Such projects have similar characteristics to Fission Uranium’s Triple R deposit: high-grade, shallow, in basement rock and in a stable jurisdiction.
Page | 26
| F3
Uranium Corp. Management’s Discussion and Analysis For the year ended June 30, 2024 (Expressed in Canadian dollars, unless otherwise noted) |
|
Uranium outlook (continued)
It is also notable to highlight that both Kazatomprom and Cameco have become active as buyers in the uranium spot market as both move to obtain enough material to fulfill contracts that are no longer being met by their respective mines. In its Q3/20 Operations and Trading Update, Kazatomprom noted that its 2020 and 2021 inventory levels are expected to fall below target levels of six to seven months and that it, “will not be possible to compensate for production losses in these periods”. Similarly, Cameco has been an active purchaser in the spot market for quite some time now. This flipping of roles of the world’s two largest producers from adding to global inventory levels to being buyers in the spot market may have a significant impact to the overall supply and demand environment for uranium.
Recently, conflict between the United States and Iran has resulted in accusations of Iran breaking the 2015 agreement that limited its nuclear program, taking the first step toward re-imposing United Nations sanctions. The European countries started the clock on what is anticipated to be 60 days of negotiations with Iran about coming back into full compliance with the nuclear deal. If they cannot resolve their dispute under the agreement, the United Nations could revive sanctions on Iran that had been suspended, including an arms embargo.
| ● | United States of America |
In July 2018, the U.S. Government announced a probe into whether U.S. uranium imports are a threat to national security. The U.S. Government was also threatening to issue tariffs on U.S. uranium imports, similar to what it has already done in other industries such as steel. U.S. nuclear power generators urged the federal government against acting in a dispute against imported uranium, arguing tariffs or quotas would increase costs for the struggling industry and possibly cause some reactors to shut. The U.S. Department of Commerce subsequently launched a “Section 232” investigation into uranium imports following complaints by two U.S. uranium mining companies, Ur-Energy Inc and Energy Fuels Inc., that subsidized foreign competitors have caused them to cut capacity and lay off workers.
| ● | Supply disruption concerns |
In July 2019, U.S. President Trump announced that additional study was necessary beyond the Secretary of Commerce’s findings that uranium imports threaten to impair the national security of the United States as defined under Section 232 of the Act. Although he did agree that the Secretary’s findings raise significant concerns regarding the impact of uranium imports on the national security with respect to domestic mining. Thus, the President established a Nuclear Fuel Working Group (“NFWG”) to examine the current state of domestic nuclear fuel production to reinvigorate the entire nuclear fuel supply chain in July 2019. The Nuclear Fuel Working Group had 90 days to submit its recommendations however, on October 11th, 2019, the U.S. President delayed the report a further 30 days. In April 2020, the NFWG issued a report that included recommendations such as the establishment of a US$150mm budget to build a domestic uranium reserve, to leverage American technological innovation, R&D, etc. to regain American nuclear energy leadership; and to move into markets currently dominated by Russian and Chinese State Owned Enterprises and recover its position as the world leader in exporting best-in-class nuclear energy technology. Notably, the uranium reserve has recently garnered bipartisan support and has been included in the Senate’s Appropriations committee for the 2020-2021 fiscal year. We view the report as a positive for the global uranium industry as it does not close the world’s largest consumer of uranium from non-domestic sources. More importantly, it removes the uncertainty connected to this report as market participants were unclear on what direction it would take and whether it would have negative consequences.
Page | 27
| F3
Uranium Corp. Management’s Discussion and Analysis For the year ended June 30, 2024 (Expressed in Canadian dollars, unless otherwise noted) |
|
Uranium outlook (continued)
The U.S. and Russia also recently agreed on a revised Russian Suspension Agreement (“RSA”) that further removed uncertainty with respect to the amount of uranium and conversion product can be imported from Russia into the U.S. While the agreement does grandfather in a substantial amount of material into the U.S. in the near-term, it has created certainty and some control on the amount of material that can be imported through 2040. Demand for uranium beginning in 2022 and onwards can be seen in the market as the result of this agreement.
Currently in the U.S., there are 94 operating reactors and, it is important to note, nuclear reactors supply about 20 percent of U.S. base load electricity, according to the Nuclear Energy Institute. Despite the headlines of reactors shutting down, it is notable that there are two reactors currently under construction and 21 more in the planned or proposed stage. The Department of Energy is also pushing for a change in Federal Energy Regulatory Commission rules to properly compensate nuclear power for its reliability and resilience, thereby protecting the stability of the U.S. grid. Uranium is also used in the U.S. nuclear arsenal and powers the Navy’s nuclear aircraft carriers and submarines. The nuclear industry said a diverse uranium supply is essential to keep that power flowing.
| ● | Security of Supply |
It should be noted that utilities do not view all sources of uranium supply equally. Since uranium for reactor operation is not a substitutable, it is imperative for utilities to have a secure source of material. As such, utilities do not view the spot market as a primary source of supply of uranium but instead more as an augmentative source. Extrapolating this concept further, material sourced from high cost operations in unstable jurisdictions would also be low on the security of supply totem pole. Fission’s Triple R deposit is a world-class, high grade deposit with low estimated operating costs, located in the safest uranium producing jurisdiction in the world.
Moreover, a by-product of the Section 232/NFWG and RSA processes, the source of the material is now an increasingly important consideration for many utilities as state rules may prohibit the procurement of uranium from embargoed or restricted countries. Triple R’s location in Canada places material sourced from it in the most widely accepted category of material.
| ● | Summary |
The uranium market is showing signs of emerging from what has been a multi-year trough period as some of the world’s largest miners have suspended or reduced production due to the COVID-19 pandemic and the removal of the uncertainty overhang caused by the NFWG. Inventories continue to be drawn down, conversion and SWU prices have increased, at a time when major players are cutting primary production. All this amongst a backdrop of geopolitical tensions including possible government intervention. The backdrop is bullish for the uranium sector, for those situated in safe mining jurisdictions that host high grade, shallow uranium deposit
Page | 28
| F3
Uranium Corp. Management’s Discussion and Analysis For the year ended June 30, 2024 (Expressed in Canadian dollars, unless otherwise noted) |
|
Uranium outlook (continued)
| ● | Uranium market |
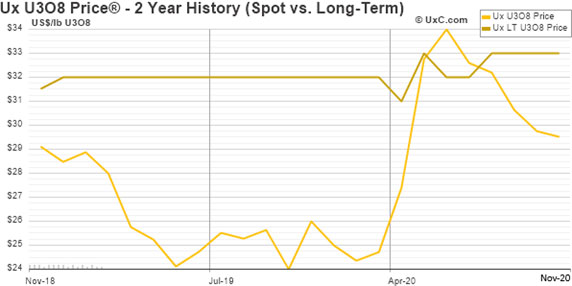
(Source: UxC LLC, www.uxc.com: November 2020)
Selected annual information
The financial information presented below for the current and comparative years was derived from the consolidated financial statements prepared in accordance with IFRS and is expressed in Canadian dollars.
| June
30, 2024 | June
30, 2023 | June
30, 2022 | ||||||||||
| $ | $ | $ | ||||||||||
| Net loss | (20,714,408 | ) | (10,175,600 | ) | (5,670,125 | ) | ||||||
| Total assets | 97,878,306 | 50,447,412 | 29,936,942 | |||||||||
| Current liabilities | 4,353,979 | 4,162,660 | 1,459,298 | |||||||||
| Shareholders’ equity | 74,202,319 | 44,245,128 | 28,274,791 | |||||||||
| Basic and diluted loss per common share | (0.03 | ) | (0.03 | ) | (0.02 | ) | ||||||
Summary of quarterly results
The financial information presented below for the current and comparative periods was derived from annual financial statements prepared in accordance with IFRS or interim financial statements prepared in accordance with IFRS applicable to the preparation of interim financial statements, IAS 34, Interim Financial Reporting.
Page | 29
| F3
Uranium Corp. Management’s Discussion and Analysis For the year ended June 30, 2024 (Expressed in Canadian dollars, unless otherwise noted) |
|
Summary of quarterly results (continued)
| June 30, 2024 | March 31, 2024 | December 31, 2023 | September 30, 2023 | |||||||||||||
| $ | $ | $ | $ | |||||||||||||
| Exploration and evaluation assets | 53,474,145 | 54,370,172 | 43,963,819 | 37,796,929 | ||||||||||||
| Working capital | 39,553,790 | 32,102,384 | 43,650,451 | 28,842,003 | ||||||||||||
| Net income (loss) | (3,152,423 | ) | (17,515,539 | ) | 366,581 | (413,026 | ) | |||||||||
| Net profit (loss) per share basic and diluted | (0.01 | ) | (0.04 | ) | 0.00 | (0.00 | ) | |||||||||
| June 30, | March 31, | December 31, | September 30 | |||||||||||||
| 2023 | 2023 | 2022 | 2022 | |||||||||||||
| $ | $ | $ | $ | |||||||||||||
| Exploration and evaluation assets | 29,762,105 | 27,601,450 | 20,479,620 | 17,545,881 | ||||||||||||
| Working capital | 16,277,693 | 7,413,153 | 10,938,769 | 10,629,336 | ||||||||||||
| Net income (loss) | (2,736,278 | ) | 1,989,809 | (8,927,659 | ) | (501,532 | ) | |||||||||
| Net profit (loss) per share basic and diluted | (0.01 | ) | 0.01 | (0.03 | ) | (0.00 | ) | |||||||||
Net loss in the current quarter was affected by the recognition of flow-through share recovery of $737,233, recovery of mineral property rights of $517,843 and interest income of $402,070. The current quarter saw an increase in accretion expense, consulting and director fees, share-based compensation, marketing and wages to support increased exploration operations. Quarter to quarter variances are due to fluctuations corporate and exploration activity driven by cash timing of exploration programs and corporate initiatives. There will be continued volatility quarter to quarter in light of this.
Results of operations
The expenses incurred by the Company are typical of junior exploration and development companies that do not have established cash flows from mining operations. Changes in these expenditures from quarter to quarter are impacted directly by non-recurring activities or events.
Comparison of the three and twelve months ended June 30, 2024
The Company had a net loss of $3,152,423 and net loss of $17,561,985 for the three and twelve months ended June 30, 2024 compared to net loss of $2,736,278 and loss of $10,175,660 for the comparable prior periods. The change in net loss is primarily attributable to the following factors:
| ● | Recovery of flow through share premium for incurring eligible exploration expenditures in the previous quarter resulted in an overall reduction of net loss; and deferred income tax expense recognized as a result of the convertible debt measurement. |
| ● | Share-based compensation increased in the current period due to increased share activity. |
| ● | Consulting and directors’ fees, office and administration, and wages and benefits increased due to increased operating activity. |
| ● | Public relations and communication increased as a result of increasing shareholder awareness of the Company’s activities. |
| ● | Professional fees increased due to an overall ramp up of operating activity, and steps taken for the spin-out which completed on August 15, 2024. |
Page | 30
| F3
Uranium Corp. Management’s Discussion and Analysis For the year ended June 30, 2024 (Expressed in Canadian dollars, unless otherwise noted) |
|
Liquidity and capital resources
The Company is an exploration and evaluation stage company and has not yet determined whether its exploration and evaluation assets contain ore reserves that are economically recoverable. Recoverability of amounts shown for exploration and evaluation assets, including the acquisition costs, is dependent upon the existence of economically recoverable reserves, the ability of the Company to obtain necessary financing to complete the development of those reserves and upon future profitable production.
The condensed interim consolidated financial statements have been prepared on the basis of accounting principles applicable to a going concern which assumes that the Company will be able to realize its assets and discharge its liabilities in the normal course of business for the foreseeable future. The Company’s ability to continue as a going concern is dependent upon its ability to fund its operations through equity financing, joint ventures, option agreements or other means. As at June 30, 2024 the Company had cash and cash equivalents of $33,616,475 and a working capital balance of $39,553,790. Management estimates that the Company has sufficient funds to maintain its operations and activities for the upcoming year. The Company has no exploration agreements that require it to meet certain expenditures.
Convertible Debenture
On October 18, 2023, the Company closed a $15,000,000 convertible debenture (“Debentures”) with Denison Mines Corp. (“Denison”).
The Debentures carry a 9% coupon (the “Interest”), payable quarterly, have a maturity date of October 18, 2028, and are convertible at Denison’s option into common shares of the Company at a conversion price of $0.56 per share (the “Conversion Price”).
The Company, at its sole discretion, may pay up to one-third of the Interest in common shares of the Company issued at a price per common share equal to the volume-weighted average trading price of the Company’s common shares on the TSX Venture Exchange (the “TSXV”) for the 20 trading days ending on the day prior to the date on which such payment of Interest is due.
Transaction costs associated with the issuance of the Debenture totaled $749,365, which includes cash payments of $593,500 and the issuance of 380,518 common shares with a fair value of $155,865.
The Company will be entitled, on or after the third anniversary of the date of issuance of the Debentures, at any time the Company’s 20-day volume-weighted average price on the TSXV exceeds 130% of the Conversion Price, to redeem the Debentures at par plus accrued and unpaid Interest. Further, in the event of a change of control transaction, the Company may redeem the Debentures at par plus accrued and unpaid interest plus an amount equal to the greater of (i) 15% of the principal amount and (ii) the amount of remaining unpaid Interest that would be payable during the initial three-year term of the Debentures.
Private placements May 30, 2024
The Company closed a private placement for gross proceeds of $10,074,415, comprising 7,409,908 federal flow-through Units of the Company at a price of $0.5355 per unit, and 10,447,235 Saskatchewan flow-through units at a price $0.5845 per unit (together “FT Units”). Each FT Unit issued pursuant to the offering, comprises of one common share of the Company and one-half common share purchase warrant.
Each whole warrant entitles the holder to purchase one common share of the Company at a price of $0.56 at any time on or before May 30, 2026. The Company paid a cash finders’ fee and incurred other share issuance costs totalling $733,415 in connection with this private placement. In addition, the Company issued 957,589 brokers’ warrants which entitles the holder to purchase one common share of the Company at a price of $0.56 per share at any time on or before May 30, 2026.
Page | 31
| F3
Uranium Corp. Management’s Discussion and Analysis For the year ended June 30, 2024 (Expressed in Canadian dollars, unless otherwise noted) |
|
Liquidity and capital resources (continued)
September 12, 2023
The Company closed a private placement for gross proceeds of $20,000,000 comprising 41,237,113 charity flow-through shares of the Company (each, a “Charity FT Unit”) at a price of $0.485 per share.
Each Charity FT Unit is comprised of one common share of the Company to be issued as a “flow-through share” within the meaning of the Income Tax Act (Canada) (each, a “FT Share”) and one-half common share purchase warrant. Each whole warrant entitles the holder to purchase one common share of the Company at a price of $0.485 for a two year period. The Company paid a cash fee of $1,086,250 and incurred $78,580 in expenses in connection with this private placement.
The Company also issued 2,239,690 brokers’ warrants which entitles the holder to purchase a one common share of the Company at a price of $0.485 per share at any time on or before September 12, 2025.
The fair value of the brokers’ warrants was determined based on the closing trading price on September 12, 2023 and the fair value of warrants was determined using the Black-Scholes Option Pricing Model and $495,000 was recorded as share issuance costs using the following assumptions: a volatility of 106.28%; risk-free interest rate of 4.58%; expected life of 2 years; and a dividend rate of 0%.
May 26, 2023
On May 26, 2023, the Company closed a private placement for gross proceeds of $12,000,000 comprising:
| ● | 4,255,319 flow-through units of the Company (each, a “FT Unit”) at a price of $0.47 per FT Unit for gross proceeds of $2,000,000 from the sale of FT Units; and |
| ● | 21,276,596 FT Units to be sold to charitable buyers (each, a “Charity FT Unit”) at a price of $0.47 for gross proceeds of $10,000,000 from the sale of Charity FT Units. |
Each FT Unit issued pursuant to the offering is comprised of one common share of the Company and one-half common share purchase warrant. Each FT Unit is comprised of one common share of the Company to be issued as a “flow-through share” within the meaning of the Income Tax Act (Canada) (each, a “FT Share”) and one half of one warrant. Each whole warrant entitles the holder to purchase one common share of the Company at a price of $0.47 at any time on or before May 26, 2026. The Company paid cash finders’ fees of $712,500 and incurred $117,307 expenses in connection with this private placement which has been recorded as share issuance costs. The Company also issued 1,515,957 brokers’ warrants which entitles the holder to purchase one common share of the Company at a price of $0.35 at any time on or before May 26, 2025.
December 21, 2022
The Company closed a private placement for gross proceeds of $8,000,000, comprising 19,047,619 flow-through shares of the Company at a price of $0.42 per share.
The Company paid a cash finders’ fee of $450,000 and incurred $169,024 in expenses in connection with this private placement which has been recorded as share issuance costs. The Company also issued 1,071,427 brokers’ warrants which entitles the holder to purchase a one common share of the Company at a price of $0.42 per share at any time on or before December 21, 2024. The fair value of the brokers’ warrants was determined based on the closing trading price on December 21, 2022 and the fair value of warrants was determined using the Black-Scholes option pricing model. $137,000 was recorded as share issuance cost. The fair value of the warrants was determined using the Black-Scholes option pricing model using the following assumptions: a volatility of 110.80%; risk-free interest rate of 3.65%; expected life of 2 years; and a dividend rate of 0%.
Page | 32
| F3
Uranium Corp. Management’s Discussion and Analysis For the year ended June 30, 2024 (Expressed in Canadian dollars, unless otherwise noted) |
|
Related party transactions
The Company has identified the CEO, COO, CFO, VP Exploration, and the Company’s directors as its key management personnel.
| June 30, | June 30, | |||||||
| 2024 | 2023 | |||||||
| $ | $ | |||||||
| Compensation costs | ||||||||
| Wages, consulting and directors fees paid or accrued to key management personnel and companies controlled by key management personnel | 2,482,883 | 1,094,968 | ||||||
| Share-based compensation pursuant to the vesting schedule of options and RSUs granted to key management personnel | 6,682,178 | 4,375,167 | ||||||
| 9,165,061 | 5,470,135 | |||||||
| Exploration and evaluation expenditures | 913,750 | 600,529 | ||||||
| Total | 10,078,811 | 6,070,664 | ||||||
Included in accounts payable at June 30, 2024 is $85,398 (June 30, 2023 - $59,091) for expenses due to key management personnel and companies controlled by key management personnel. Amounts were non-interest bearing, unsecured and due on demand.
Outstanding share data
As at the date of this document, the Company has 493,719,610 common shares issued and outstanding, 42,254,541 incentive stock options outstanding with exercise prices ranging from $0.12 to $0.45 per share, 38,211,588 warrants outstanding with exercise prices ranging from $0.35 to $0.485 per share, and 33,249,425 restricted stock units outstanding.
Financial instruments
The Company classifies its financial instruments in the following categories: at fair value through profit and loss (“FVTPL”), at fair value through other comprehensive income (loss) (“FVTOCI”) or at amortized cost. The Company determines the classification of financial assets at initial recognition. The classification of debt instruments is driven by the Company’s business model for managing the financial assets and their contractual cash flow characteristics. Equity instruments that are held for trading are classified as FVTPL. For other equity instruments, on the day of acquisition the Company can make an irrevocable election (on an instrument-by-instrument basis) to designate them as at FVTOCI. Financial liabilities are measured at amortized cost, unless they are required to be measured at FVTPL (such as instruments held for trading or derivatives) or if the Company has opted to measure them at FVTPL.
Page | 33
| F3
Uranium Corp. Management’s Discussion and Analysis For the year ended June 30, 2024 (Expressed in Canadian dollars, unless otherwise noted) |
|
Financial instruments (continued)
The Company classifies its financial instruments as follows:
| Financial Instrument | Classification |
| Cash and cash equivalents | Amortized cost |
| Amounts receivable | Amortized cost |
| Marketable securities | FVTPL |
| Investment | FVTPL |
| Deposit | Amortized cost |
| Accounts payable and accrued liabilities | Amortized cost |
| Convertible debt | Amortized cost |
Measurement
Financial assets and liabilities at amortized cost are initially recognized at fair value plus or minus transaction costs, respectively, and subsequently carried at amortized cost less any impairment.
Financial assets and liabilities carried at FVTPL are initially recorded at fair value and transaction costs are expensed in the statements of loss. Realized and unrealized gains and losses arising from changes in the fair value of the financial assets and liabilities held at FVTPL are included in the statements of loss in the period in which they arise.
Selected investments in equity instruments at FVTOCI are initially recorded at fair value plus transaction costs. Subsequently they are measured at fair value, with gains and losses recognized in other comprehensive income (loss).
Financial instruments
IFRS 13, Fair Value Measurement, establishes a fair value hierarchy that reflects the significance of the inputs used in making the measurements. The fair value hierarchy has the following levels:
Level 1 – quoted prices (unadjusted) in active markets for identical assets or liabilities;
Level 2 – inputs other than quoted prices included in Level 1 that are observable for the asset or liability, either directly (i.e. as prices) or indirectly (i.e. derived from prices); and
Level 3 – inputs for the asset or liability that are not based on observable market data (unobservable inputs).
The Company’s financial instruments consist of cash and cash equivalents, marketable securities, accounts payable and accrued liabilities, convertible debt, and lease liability. Cash and cash equivalents and marketable securities are valued using quoted prices from an active market (Level 1). For the accounts payable and accrued liabilities, the carrying values are considered to be a reasonable approximation of fair value due to the short-term nature of these instruments.
The Company’s financial instruments are exposed to a number of financial and market risks, including credit, liquidity and foreign exchange risks. The Company does not currently have in place any active hedging or derivative trading policies to manage these risks since the Company’s management does not believe that the current size, scale and pattern of its operations warrant such hedging activities.
Risk management
| (a) | Credit risk |
Credit risk is the risk that a counterparty to a financial instrument will not discharge its obligations, resulting in a financial loss to the Company. The Company has procedures in place to minimize its exposure to credit risk. Company management evaluates credit risk on an ongoing basis including counterparty credit rating and other counterparty concentrations as measured by amount and percentage.
Page | 34
| F3
Uranium Corp. Management’s Discussion and Analysis For the year ended June 30, 2024 (Expressed in Canadian dollars, unless otherwise noted) |
|
Financial instruments (continued)
The primary sources of credit risk for the Company arise from cash and marketable securities.
The Company has not suffered any credit losses in the past, nor does it expect to have any credit losses in the future. As at June 30, 2024, the Company has no significant financial assets that are past due or impaired due to credit risk defaults. The Company’s maximum exposure to credit risk is limited to its cash and investment account balances.
| (b) | Liquidity risk |
Liquidity risk is the risk that the Company will not be able to meet its obligations with respect to financial liabilities as they fall due. The Company’s financial liabilities are comprised of accounts payable and accrued liabilities. The Company frequently assesses its liquidity position by reviewing the timing of amounts due and the Company’s current cash flow position to meet its obligations. The Company manages its liquidity risk by maintaining sufficient cash and cash equivalents and short-term investment balances to meet its anticipated operational needs.
The Company’s accounts payable and accrued liabilities arose as a result of exploration and development of its exploration and evaluation assets and other corporate expenses. Payment terms on these liabilities are typically 30 to 60 days from receipt of invoice and do not generally bear interest.
The following table summarizes the remaining contractual maturities of the Company’s financial liabilities.
| $ | $ | |||||||||
| Accounts payable and accrued liabilities | < 6 months | 3,248,073 | 1,715,361 | |||||||
| Convertibe debt | > 6 months | 10,910,275 | - | |||||||
| (c) | Interest rate risk |
From time-to-time, the Company invests excess cash in guaranteed investment certificates (“GICs”) at fixed or floating rates of interest and cash equivalents are to be maintained in floating rates of interest in order to maintain liquidity, while achieving a satisfactory return. As at June 30, 2024, the Company was exposed to nominal interest rate risk. The Company manages risk by monitoring changes in interest rates in comparison to prevailing market rates. The Company has no debt bearing variable interest rate.
| (c) | Market risk |
Market risk is the risk that the fair value of future cash flows of a financial instrument will fluctuate due to changes in market prices, other than those arising from interest rate risk or currency risk. The Company is exposed to other price risk on its marketable securities due to fluctuations in the current market prices and fluctuations in trading volumes of those securities. The Company’s exposure to market risk is limited to the fair value of its marketable securities.
Page | 35
| F3
Uranium Corp. Management’s Discussion and Analysis For the year ended June 30, 2024 (Expressed in Canadian dollars, unless otherwise noted) |
|
Financial instruments (continued)
| (d) | Commodity price risk |
The Company is exposed to price risk with respect to equity prices. Price risk as it relates to the Company is defined as the potential adverse impact on the Company’s ability to raise financing due to movements in individual equity prices or general movements in the level of the stock market. The Company closely monitors individual equity movements and the stock market to determine the appropriate course of action to be taken by the Company.
Key estimates and judgments
The key assumptions concerning the future and other key sources of estimation uncertainty at the reporting date, that have significant risk of causing a material adjustment to the carrying amounts of assets and liabilities within the next financial year, are described below. The Company based its assumptions and estimates on parameters available when the consolidated financial statements were prepared. Existing circumstances and assumptions about future developments, however, may change due to market changes or circumstances arising beyond the control of the Company. Such changes are reflected in the assumptions when they occur.
Judgements
| ● | the recoverability of mineral properties and exploration and evaluation expenditures incurred on its projects; the Company capitalizes acquisition, exploration and evaluation expenditures on its statement of financial position, and evaluates these amounts at least annually for indicators of impairment; |
| ● | the functional currency and reporting currency of the parent company, F3 Uranium Corp. and F4 Uranium Corp., is the Canadian Dollar. The functional currency Fission Energy Peru S.A.C. is the Peruvian Sol. The functional currency determination was conducted through an analysis of the consideration factors identified in IAS 21, The Effects of Changes in Foreign Exchange Rates. The determination of functional currency involves certain judgments to determine the primary economic environment and the Company reconsiders the functional currency if there are changes in events and conditions of the factors used in the determination of the primary economic environment; and |
| ● | the Company determines the flow-through share premium by allocating the total funds received between common share and flow-through premium liability by first assessing the fair value of the common shares issued, based on market price at issuance, with any excess considered being allocated to warrants (if any) and the flow-through premium. |
Estimates
| ● | the discount rate used to present value the lease liability related to the office rent was estimated to be 18% which was based off of the Company’s interest rate on their corporate credit cards as the Company does not have any other interest bearing debt; |
| ● | the inputs in accounting for share-based payment transactions in the statement of loss and comprehensive loss (using the Black-Scholes option pricing model) including volatility, probable life of options granted, time of exercise of the options and forfeiture rate; and |
| ● | the determination of deferred income tax assets or liabilities requires subjective assumptions regarding future income tax rates and the likelihood of utilizing tax carry-forwards. Changes in these assumptions could materially affect the recorded amounts, and therefore do not necessarily provide certainty as to their recorded values. |
Page | 36
| F3
Uranium Corp. Management’s Discussion and Analysis For the year ended June 30, 2024 (Expressed in Canadian dollars, unless otherwise noted) |
|
Key estimates and judgments (continued)
| ● | significant estimates are used to measure asset retirement obligations. Estimating future costs can be difficult and unpredictable as they are based principally on current legal and regulatory requirements and site closure plans that may change materially. The laws and regulations governing site closure and remediation in a particular jurisdiction are subject to review at any time and may be amended to impose additional requirements and conditions which may cause our provisions for environmental liabilities to be underestimated and could materially affect our financial position or results of operations. Estimates of future asset retirement obligation costs are also subject to operational risks such as acceptability of treatment techniques or other operational changes. |
Material accounting policy information
A summary of the Company’s material accounting policy information is included in Note 3 of the condensed interim consolidated financial statements for the year ended June 30, 2024.
Cautionary notes regarding forward-looking statements
Certain information contained in this MD&A constitutes “forward-looking statements” and “forward-looking information” within the meaning of Canadian legislation.
Generally, these forward-looking statements can be identified by the use of forward-looking terminology such as “plans”, “expects” or “does not expect”, “is expected”, “budget”, “scheduled”, “estimates”, “forecasts”, “intends”, “anticipates” or “does not anticipate”, or “believes”, or variations of such words and phrases or state that certain actions, events or results “may”, “could”, “would”, “might” or “will be taken”, “occur”, “be achieved” or “has the potential to”.
Forward looking statements are based on the opinions and estimates of management as of the date such statements are made, and they are subject to known and unknown risks, uncertainties and other factors that may cause the actual results, level of activity, performance or achievements of the Company to be materially different from those expressed or implied by such forward-looking statements. The Company believes that the expectations reflected in this forward-looking information are reasonable, but no assurance can be given that these expectations will prove to be correct and such forward-looking information included in this MD&A should not be unduly relied upon.
This information speaks only as of the date of this MD&A. In particular, this MD&A may contain forward-looking information pertaining to the following: the likelihood of completing and benefits to be derived from corporate transactions; estimated exploration and development expenditures; expectations of market prices and costs; supply and demand for uranium; possible impacts of litigation and regulatory actions on the Company; the ability for the Company to identify suitable joint venture partners; exploration, development and expansion plans and objectives; and receipt of regulatory approvals, permits and licences under governmental regulatory regimes.
There can be no assurance that such statements will prove to be accurate, as the Company’s actual results and future events could differ materially from those anticipated in this forward-looking information as a result of the factors discussed below in this MD&A under the heading “Risks and uncertainties”.
Accordingly, readers should not place undue reliance on forward-looking statements. These factors are not, and should not be construed as being exhaustive. Statements relating to “mineral resources” are deemed to be forward-looking information, as they involve the implied assessment, based on certain estimates and assumptions that the mineral resources described can be profitably produced in the future. The forward-looking information contained in this MD&A is expressly qualified by this cautionary statement. The Company does not undertake any obligation to publicly update or revise any forward-looking information after the date of this MD&A or to conform such information to actual results or to changes in the Company’s expectations except as otherwise required by applicable legislation.
Page | 37
| F3
Uranium Corp. Management’s Discussion and Analysis For the year ended June 30, 2024 (Expressed in Canadian dollars, unless otherwise noted) |
|
Risks and uncertainties
The Company is subject to a number of risks and uncertainties, including: uncertainties related to exploration and development; uncertainties related to the nuclear power industry; the ability to raise sufficient capital to fund exploration and development; changes in economic conditions or financial markets; increases in input costs; litigation, legislative, environmental and other judicial, regulatory, political and competitive developments; technological or operational difficulties or inability to obtain permits encountered in connection with exploration activities, labour relations matters, and economic issues that could materially affect uranium exploration and mining. The cost of conducting and continuing mineral exploration and development is significant, and there is no assurance that such activities will result in the discovery of new mineralization or that the discovery of a mineral deposit will be developed and advanced to commercial production. The Company continually seeks to minimize its exposure to these adverse risks and uncertainties, but by the nature of its business and exploration activities, it will always have some degree of risk.
Page | 38