
| Investment Company Act file number | 811-06441 | |||||||||||||||||||
| (Exact name of registrant as specified in charter) | ||||||||||||||||||||
| 4500 MAIN STREET, KANSAS CITY, MISSOURI | 64111 | |||||||||||||||||||
| (Address of principal executive offices) | (Zip Code) | |||||||||||||||||||
| JOHN PAK 4500 MAIN STREET, KANSAS CITY, MISSOURI 64111 | ||||||||||||||||||||
| (Name and address of agent for service) | ||||||||||||||||||||
| Registrant’s telephone number, including area code: | 816-531-5575 | |||||||||||||||||||
| Date of fiscal year end: | 10-31 | |||||||||||||||||||
| Date of reporting period: | ||||||||||||||||||||
| October 31, 2025 | |||||
What were the fund costs for the last year? (based on a hypothetical $10,000 investment) | ||||||||
Costs of a $10,000 investment | Costs paid as a percentage of a $10,000 investment | |||||||
| $ | ||||||||
| What were the key factors that affected the fund’s performance? | |||||
Emerging Markets Debt Fund | |||||
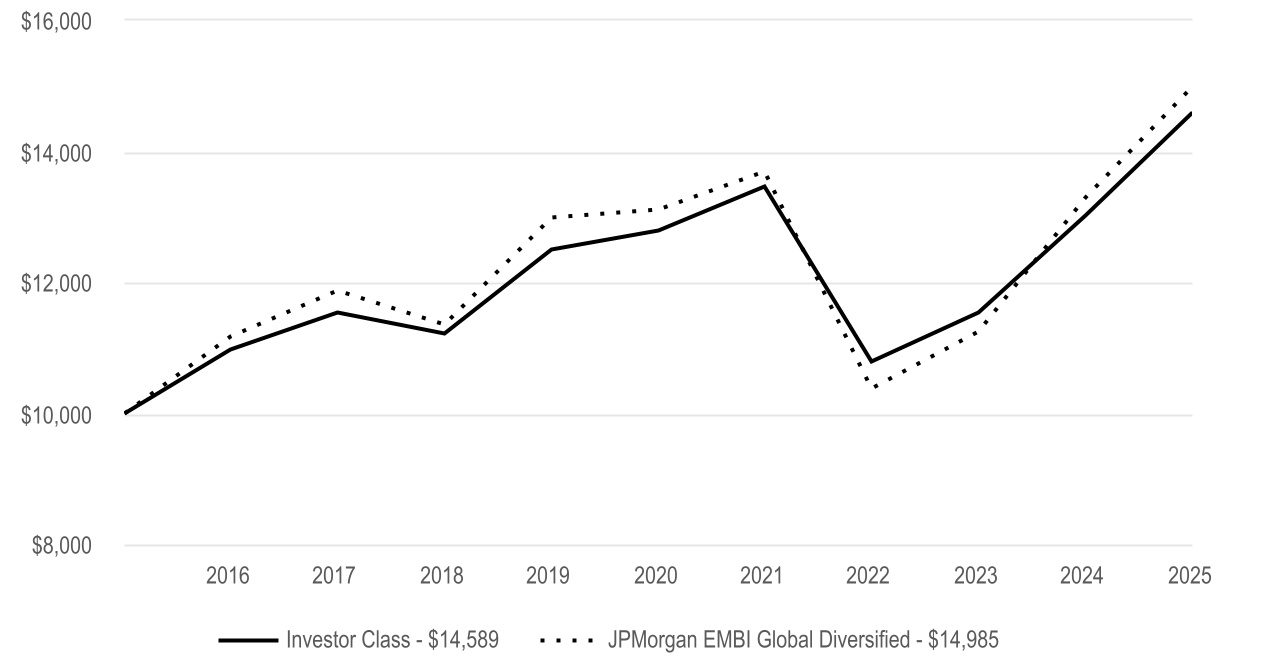
| The fund seeks total return. The commentary below refers to the fund’s performance compared to the JP Morgan EMBI Global Diversified Index. | |||||
• | During the reporting period, emerging markets bonds benefited from a supportive backdrop of resilient global growth combined with declining interest rates in several developed and emerging markets countries. Against this backdrop, emerging markets bonds broadly delivered gains. | ||||
• | The fund’s yield curve strategy, particularly in local markets, contributed to performance. As of the end of the reporting period, the portfolio’s duration was higher than the index, driven by our belief that emerging markets central banks are likely to continue cutting interest rates. | ||||
• | The portfolio’s exposure to out-of-benchmark local currency and local rates also contributed to performance. | ||||
• | On the other hand, the portfolio’s lower beta on external bonds relative to the index detracted from performance. | ||||
Cumulative Performance (based on an initial $10,000 investment) | ||
October 31, 2015 through October 31, 2025 | ||
Average Annual Total Returns | |||||||||||
| 1 Year | 5 Year | 10 Year | |||||||||
| Investor Class | |||||||||||
| JPMorgan EMBI Global Diversified | |||||||||||
Fund Statistics | |||||
| Net Assets | $ | ||||
| Management Fees (dollars paid during the reporting period) | $ | ||||
| Portfolio Turnover Rate | % | ||||
| Total Number of Portfolio Holdings | |||||
| Fund Holdings | ||
Types of Investments in Portfolio (as a % of net assets) | |||||
| Sovereign Governments and Agencies | |||||
| Corporate Bonds | |||||
| U.S. Treasury Securities | |||||
| Convertible Preferred Securities | |||||
| Short-Term Investments | |||||
| Other Assets and Liabilities | |||||
For additional information about the fund, including its Prospectus, Statement of Additional Information, financial statements, holdings and proxy voting information, scan the QR code or visit americancentury.com/docs. | ||

©2025 American Century Proprietary Holdings, Inc. All rights reserved. | ||
| October 31, 2025 | |||||
What were the fund costs for the last year? (based on a hypothetical $10,000 investment) | ||||||||
Costs of a $10,000 investment | Costs paid as a percentage of a $10,000 investment | |||||||
| $ | ||||||||
| What were the key factors that affected the fund’s performance? | |||||
Emerging Markets Debt Fund | |||||
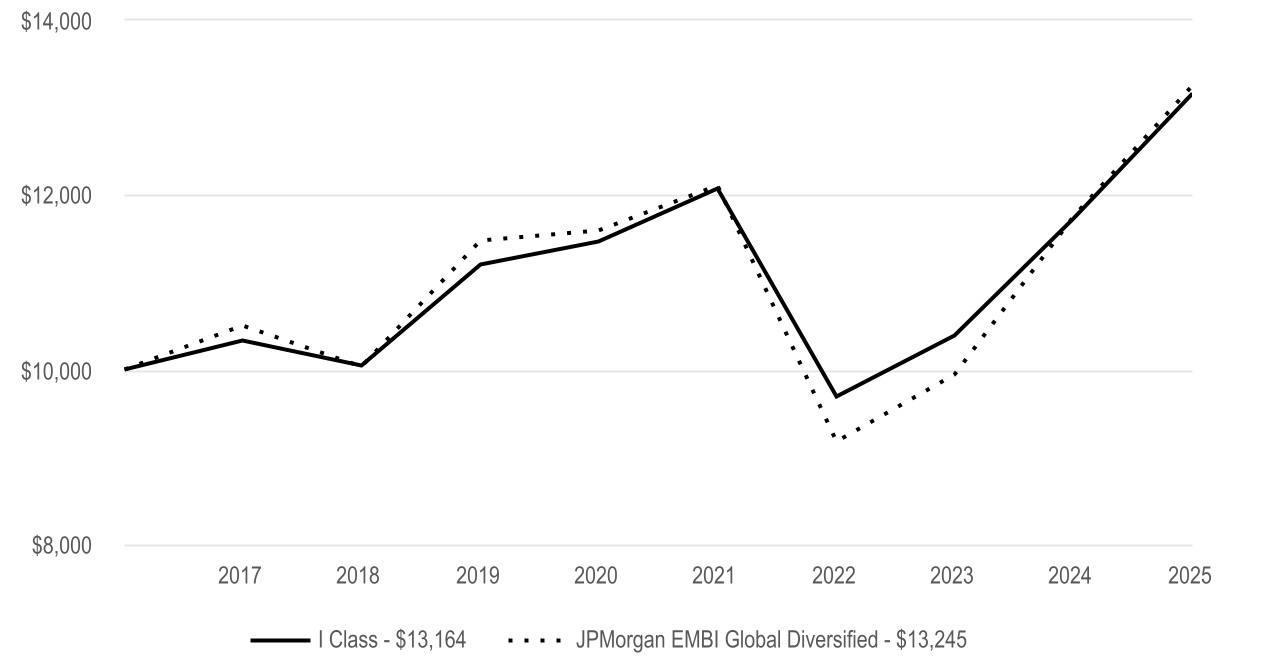
| The fund seeks total return. The commentary below refers to the fund’s performance compared to the JP Morgan EMBI Global Diversified Index. | |||||
• | During the reporting period, emerging markets bonds benefited from a supportive backdrop of resilient global growth combined with declining interest rates in several developed and emerging markets countries. Against this backdrop, emerging markets bonds broadly delivered gains. | ||||
• | The fund’s yield curve strategy, particularly in local markets, contributed to performance. As of the end of the reporting period, the portfolio’s duration was higher than the index, driven by our belief that emerging markets central banks are likely to continue cutting interest rates. | ||||
• | The portfolio’s exposure to out-of-benchmark local currency and local rates also contributed to performance. | ||||
• | On the other hand, the portfolio’s lower beta on external bonds relative to the index detracted from performance. | ||||
Cumulative Performance (based on an initial $10,000 investment) | ||
April 10, 2017 through October 31, 2025 | ||
Average Annual Total Returns | ||||||||||||||
| 1 Year | 5 Year | Since Inception | Inception Date | |||||||||||
| I Class | ||||||||||||||
| JPMorgan EMBI Global Diversified | — | |||||||||||||
Fund Statistics | |||||
| Net Assets | $ | ||||
| Management Fees (dollars paid during the reporting period) | $ | ||||
| Portfolio Turnover Rate | % | ||||
| Total Number of Portfolio Holdings | |||||
| Fund Holdings | ||
Types of Investments in Portfolio (as a % of net assets) | |||||
| Sovereign Governments and Agencies | |||||
| Corporate Bonds | |||||
| U.S. Treasury Securities | |||||
| Convertible Preferred Securities | |||||
| Short-Term Investments | |||||
| Other Assets and Liabilities | |||||
For additional information about the fund, including its Prospectus, Statement of Additional Information, financial statements, holdings and proxy voting information, scan the QR code or visit americancentury.com/docs. | ||
©2025 American Century Proprietary Holdings, Inc. All rights reserved. | ||
| October 31, 2025 | |||||
What were the fund costs for the last year? (based on a hypothetical $10,000 investment) | ||||||||
Costs of a $10,000 investment | Costs paid as a percentage of a $10,000 investment | |||||||
| $ | ||||||||
| What were the key factors that affected the fund’s performance? | |||||
Emerging Markets Debt Fund | |||||
| The fund seeks total return. The commentary below refers to the fund’s performance compared to the JP Morgan EMBI Global Diversified Index. | |||||
• | During the reporting period, emerging markets bonds benefited from a supportive backdrop of resilient global growth combined with declining interest rates in several developed and emerging markets countries. Against this backdrop, emerging markets bonds broadly delivered gains. | ||||
• | The fund’s yield curve strategy, particularly in local markets, contributed to performance. As of the end of the reporting period, the portfolio’s duration was higher than the index, driven by our belief that emerging markets central banks are likely to continue cutting interest rates. | ||||
• | The portfolio’s exposure to out-of-benchmark local currency and local rates also contributed to performance. | ||||
• | On the other hand, the portfolio’s lower beta on external bonds relative to the index detracted from performance. | ||||
Cumulative Performance (based on an initial $10,000 investment) | ||
April 10, 2017 through October 31, 2025 | ||

Average Annual Total Returns | ||||||||||||||
| 1 Year | 5 Year | Since Inception | Inception Date | |||||||||||
| Y Class | ||||||||||||||
| JPMorgan EMBI Global Diversified | — | |||||||||||||
Fund Statistics | |||||
| Net Assets | $ | ||||
| Management Fees (dollars paid during the reporting period) | $ | ||||
| Portfolio Turnover Rate | % | ||||
| Total Number of Portfolio Holdings | |||||
| Fund Holdings | ||
Types of Investments in Portfolio (as a % of net assets) | |||||
| Sovereign Governments and Agencies | |||||
| Corporate Bonds | |||||
| U.S. Treasury Securities | |||||
| Convertible Preferred Securities | |||||
| Short-Term Investments | |||||
| Other Assets and Liabilities | |||||
For additional information about the fund, including its Prospectus, Statement of Additional Information, financial statements, holdings and proxy voting information, scan the QR code or visit americancentury.com/docs. | ||
©2025 American Century Proprietary Holdings, Inc. All rights reserved. | ||
| October 31, 2025 | |||||
What were the fund costs for the last year? (based on a hypothetical $10,000 investment) | ||||||||
Costs of a $10,000 investment | Costs paid as a percentage of a $10,000 investment | |||||||
| $ | ||||||||
| What were the key factors that affected the fund’s performance? | |||||
Emerging Markets Debt Fund | |||||
| The fund seeks total return. The commentary below refers to the fund’s performance compared to the JP Morgan EMBI Global Diversified Index. | |||||
• | During the reporting period, emerging markets bonds benefited from a supportive backdrop of resilient global growth combined with declining interest rates in several developed and emerging markets countries. Against this backdrop, emerging markets bonds broadly delivered gains. | ||||
• | The fund’s yield curve strategy, particularly in local markets, contributed to performance. As of the end of the reporting period, the portfolio’s duration was higher than the index, driven by our belief that emerging markets central banks are likely to continue cutting interest rates. | ||||
• | The portfolio’s exposure to out-of-benchmark local currency and local rates also contributed to performance. | ||||
• | On the other hand, the portfolio’s lower beta on external bonds relative to the index detracted from performance. | ||||
Cumulative Performance (based on an initial $10,000 investment) | ||
October 31, 2015 through October 31, 2025 | ||
The initial investment is adjusted to reflect the maximum initial sales charge. | ||

Average Annual Total Returns | |||||||||||
| 1 Year | 5 Year | 10 Year | |||||||||
| A Class | |||||||||||
| A Class - with sales charge | |||||||||||
| JPMorgan EMBI Global Diversified | |||||||||||
A Class shares have a 4.50% maximum initial sales charge and may be subject to a maximum contingent deferred sales charge of 1.00%. | |||||||||||||||||
Fund Statistics | |||||
| Net Assets | $ | ||||
| Management Fees (dollars paid during the reporting period) | $ | ||||
| Portfolio Turnover Rate | % | ||||
| Total Number of Portfolio Holdings | |||||
| Fund Holdings | ||
Types of Investments in Portfolio (as a % of net assets) | |||||
| Sovereign Governments and Agencies | |||||
| Corporate Bonds | |||||
| U.S. Treasury Securities | |||||
| Convertible Preferred Securities | |||||
| Short-Term Investments | |||||
| Other Assets and Liabilities | |||||
For additional information about the fund, including its Prospectus, Statement of Additional Information, financial statements, holdings and proxy voting information, scan the QR code or visit americancentury.com/docs. | ||
©2025 American Century Proprietary Holdings, Inc. All rights reserved. | ||
| October 31, 2025 | |||||
What were the fund costs for the last year? (based on a hypothetical $10,000 investment) | ||||||||
Costs of a $10,000 investment | Costs paid as a percentage of a $10,000 investment | |||||||
| $ | ||||||||
| What were the key factors that affected the fund’s performance? | |||||
Emerging Markets Debt Fund | |||||
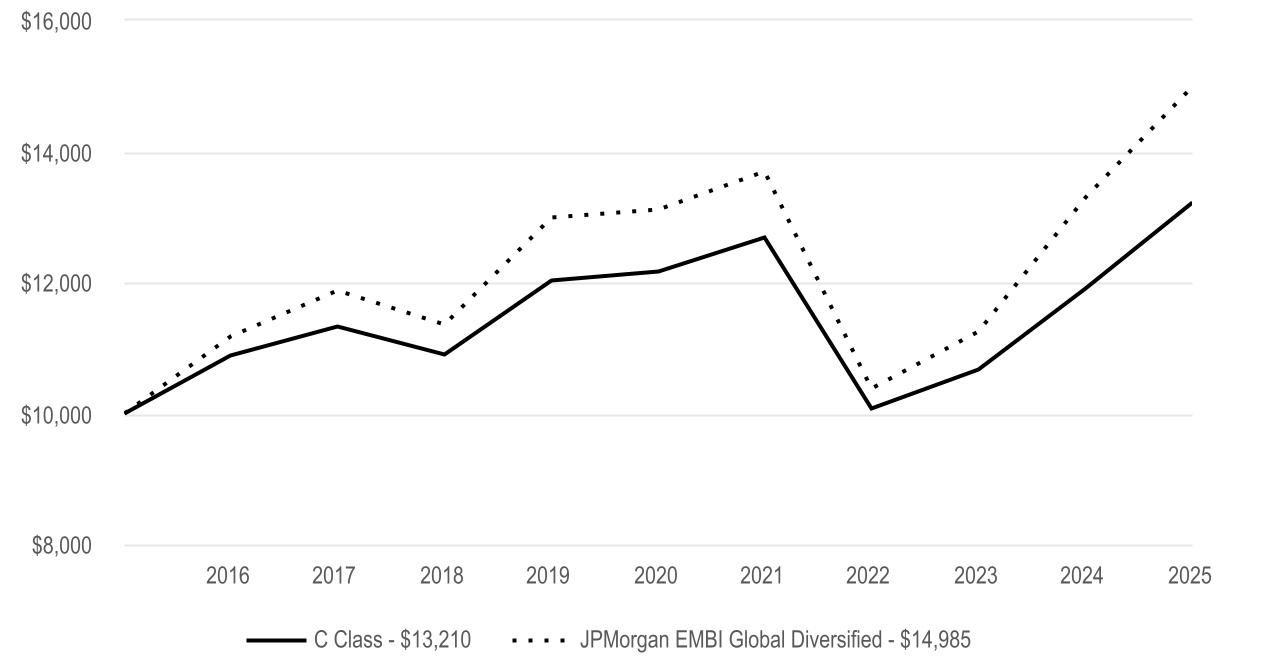
| The fund seeks total return. The commentary below refers to the fund’s performance compared to the JP Morgan EMBI Global Diversified Index. | |||||
• | During the reporting period, emerging markets bonds benefited from a supportive backdrop of resilient global growth combined with declining interest rates in several developed and emerging markets countries. Against this backdrop, emerging markets bonds broadly delivered gains. | ||||
• | The fund’s yield curve strategy, particularly in local markets, contributed to performance. As of the end of the reporting period, the portfolio’s duration was higher than the index, driven by our belief that emerging markets central banks are likely to continue cutting interest rates. | ||||
• | The portfolio’s exposure to out-of-benchmark local currency and local rates also contributed to performance. | ||||
• | On the other hand, the portfolio’s lower beta on external bonds relative to the index detracted from performance. | ||||
Cumulative Performance (based on an initial $10,000 investment) | ||
October 31, 2015 through October 31, 2025 | ||
Average Annual Total Returns | |||||||||||
| 1 Year | 5 Year | 10 Year | |||||||||
| C Class | |||||||||||
| JPMorgan EMBI Global Diversified | |||||||||||
| C Class shares will automatically convert to A Class shares after being held for approximately eight years. C Class average annual returns do not reflect this conversion. | |||||||||||||||||
Fund Statistics | |||||
| Net Assets | $ | ||||
| Management Fees (dollars paid during the reporting period) | $ | ||||
| Portfolio Turnover Rate | % | ||||
| Total Number of Portfolio Holdings | |||||
| Fund Holdings | ||
Types of Investments in Portfolio (as a % of net assets) | |||||
| Sovereign Governments and Agencies | |||||
| Corporate Bonds | |||||
| U.S. Treasury Securities | |||||
| Convertible Preferred Securities | |||||
| Short-Term Investments | |||||
| Other Assets and Liabilities | |||||
For additional information about the fund, including its Prospectus, Statement of Additional Information, financial statements, holdings and proxy voting information, scan the QR code or visit americancentury.com/docs. | ||
©2025 American Century Proprietary Holdings, Inc. All rights reserved. | ||
| October 31, 2025 | |||||
What were the fund costs for the last year? (based on a hypothetical $10,000 investment) | ||||||||
Costs of a $10,000 investment | Costs paid as a percentage of a $10,000 investment | |||||||
| $ | ||||||||
| What were the key factors that affected the fund’s performance? | |||||
Emerging Markets Debt Fund | |||||
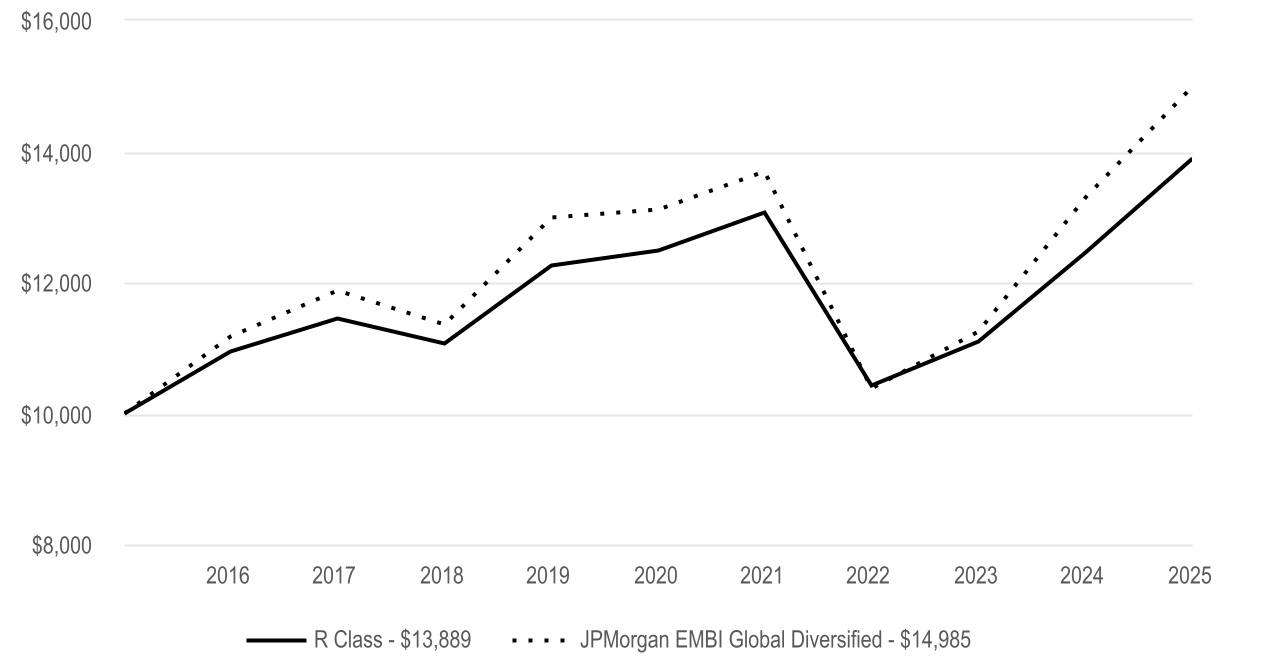
| The fund seeks total return. The commentary below refers to the fund’s performance compared to the JP Morgan EMBI Global Diversified Index. | |||||
• | During the reporting period, emerging markets bonds benefited from a supportive backdrop of resilient global growth combined with declining interest rates in several developed and emerging markets countries. Against this backdrop, emerging markets bonds broadly delivered gains. | ||||
• | The fund’s yield curve strategy, particularly in local markets, contributed to performance. As of the end of the reporting period, the portfolio’s duration was higher than the index, driven by our belief that emerging markets central banks are likely to continue cutting interest rates. | ||||
• | The portfolio’s exposure to out-of-benchmark local currency and local rates also contributed to performance. | ||||
• | On the other hand, the portfolio’s lower beta on external bonds relative to the index detracted from performance. | ||||
Cumulative Performance (based on an initial $10,000 investment) | ||
October 31, 2015 through October 31, 2025 | ||
Average Annual Total Returns | |||||||||||
| 1 Year | 5 Year | 10 Year | |||||||||
| R Class | |||||||||||
| JPMorgan EMBI Global Diversified | |||||||||||
Fund Statistics | |||||
| Net Assets | $ | ||||
| Management Fees (dollars paid during the reporting period) | $ | ||||
| Portfolio Turnover Rate | % | ||||
| Total Number of Portfolio Holdings | |||||
| Fund Holdings | ||
Types of Investments in Portfolio (as a % of net assets) | |||||
| Sovereign Governments and Agencies | |||||
| Corporate Bonds | |||||
| U.S. Treasury Securities | |||||
| Convertible Preferred Securities | |||||
| Short-Term Investments | |||||
| Other Assets and Liabilities | |||||
For additional information about the fund, including its Prospectus, Statement of Additional Information, financial statements, holdings and proxy voting information, scan the QR code or visit americancentury.com/docs. | ||
©2025 American Century Proprietary Holdings, Inc. All rights reserved. | ||
| October 31, 2025 | |||||
What were the fund costs for the last year? (based on a hypothetical $10,000 investment) | ||||||||
Costs of a $10,000 investment | Costs paid as a percentage of a $10,000 investment | |||||||
| $ | ||||||||
| What were the key factors that affected the fund’s performance? | |||||
Emerging Markets Debt Fund | |||||
| The fund seeks total return. The commentary below refers to the fund’s performance compared to the JP Morgan EMBI Global Diversified Index. | |||||
• | During the reporting period, emerging markets bonds benefited from a supportive backdrop of resilient global growth combined with declining interest rates in several developed and emerging markets countries. Against this backdrop, emerging markets bonds broadly delivered gains. | ||||
• | The fund’s yield curve strategy, particularly in local markets, contributed to performance. As of the end of the reporting period, the portfolio’s duration was higher than the index, driven by our belief that emerging markets central banks are likely to continue cutting interest rates. | ||||
• | The portfolio’s exposure to out-of-benchmark local currency and local rates also contributed to performance. | ||||
• | On the other hand, the portfolio’s lower beta on external bonds relative to the index detracted from performance. | ||||
Cumulative Performance (based on an initial $10,000 investment) | ||
October 31, 2015 through October 31, 2025 | ||
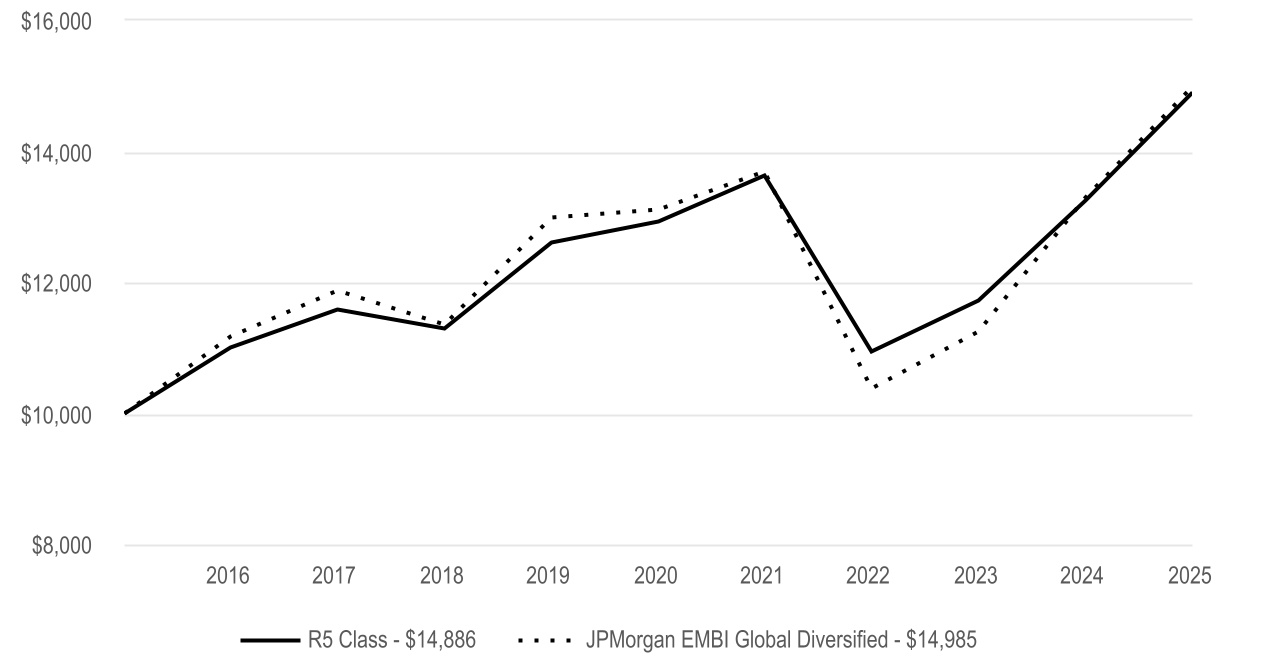
Average Annual Total Returns | |||||||||||
| 1 Year | 5 Year | 10 Year | |||||||||
| R5 Class | |||||||||||
| JPMorgan EMBI Global Diversified | |||||||||||
Fund Statistics | |||||
| Net Assets | $ | ||||
| Management Fees (dollars paid during the reporting period) | $ | ||||
| Portfolio Turnover Rate | % | ||||
| Total Number of Portfolio Holdings | |||||
| Fund Holdings | ||
Types of Investments in Portfolio (as a % of net assets) | |||||
| Sovereign Governments and Agencies | |||||
| Corporate Bonds | |||||
| U.S. Treasury Securities | |||||
| Convertible Preferred Securities | |||||
| Short-Term Investments | |||||
| Other Assets and Liabilities | |||||
For additional information about the fund, including its Prospectus, Statement of Additional Information, financial statements, holdings and proxy voting information, scan the QR code or visit americancentury.com/docs. | ||
©2025 American Century Proprietary Holdings, Inc. All rights reserved. | ||
| October 31, 2025 | |||||
What were the fund costs for the last year? (based on a hypothetical $10,000 investment) | ||||||||
Costs of a $10,000 investment | Costs paid as a percentage of a $10,000 investment | |||||||
| $ | ||||||||
| What were the key factors that affected the fund’s performance? | |||||
Emerging Markets Debt Fund | |||||
| The fund seeks total return. The commentary below refers to the fund’s performance compared to the JP Morgan EMBI Global Diversified Index. | |||||
• | During the reporting period, emerging markets bonds benefited from a supportive backdrop of resilient global growth combined with declining interest rates in several developed and emerging markets countries. Against this backdrop, emerging markets bonds broadly delivered gains. | ||||
• | The fund’s yield curve strategy, particularly in local markets, contributed to performance. As of the end of the reporting period, the portfolio’s duration was higher than the index, driven by our belief that emerging markets central banks are likely to continue cutting interest rates. | ||||
• | The portfolio’s exposure to out-of-benchmark local currency and local rates also contributed to performance. | ||||
• | On the other hand, the portfolio’s lower beta on external bonds relative to the index detracted from performance. | ||||
Cumulative Performance (based on an initial $10,000 investment) | ||
October 31, 2015 through October 31, 2025 | ||

Average Annual Total Returns | |||||||||||
| 1 Year | 5 Year | 10 Year | |||||||||
| R6 Class | |||||||||||
| JPMorgan EMBI Global Diversified | |||||||||||
Fund Statistics | |||||
| Net Assets | $ | ||||
| Management Fees (dollars paid during the reporting period) | $ | ||||
| Portfolio Turnover Rate | % | ||||
| Total Number of Portfolio Holdings | |||||
| Fund Holdings | ||
Types of Investments in Portfolio (as a % of net assets) | |||||
| Sovereign Governments and Agencies | |||||
| Corporate Bonds | |||||
| U.S. Treasury Securities | |||||
| Convertible Preferred Securities | |||||
| Short-Term Investments | |||||
| Other Assets and Liabilities | |||||
For additional information about the fund, including its Prospectus, Statement of Additional Information, financial statements, holdings and proxy voting information, scan the QR code or visit americancentury.com/docs. | ||
©2025 American Century Proprietary Holdings, Inc. All rights reserved. | ||
| October 31, 2025 | |||||
What were the fund costs for the last year? (based on a hypothetical $10,000 investment) | ||||||||
Costs of a $10,000 investment | Costs paid as a percentage of a $10,000 investment | |||||||
| $ | ||||||||
| What were the key factors that affected the fund’s performance? | |||||
Emerging Markets Debt Fund | |||||
| The fund seeks total return. The commentary below refers to the fund’s performance compared to the JP Morgan EMBI Global Diversified Index. | |||||
• | During the reporting period, emerging markets bonds benefited from a supportive backdrop of resilient global growth combined with declining interest rates in several developed and emerging markets countries. Against this backdrop, emerging markets bonds broadly delivered gains. | ||||
• | The fund’s yield curve strategy, particularly in local markets, contributed to performance. As of the end of the reporting period, the portfolio’s duration was higher than the index, driven by our belief that emerging markets central banks are likely to continue cutting interest rates. | ||||
• | The portfolio’s exposure to out-of-benchmark local currency and local rates also contributed to performance. | ||||
• | On the other hand, the portfolio’s lower beta on external bonds relative to the index detracted from performance. | ||||
Cumulative Performance (based on an initial $10,000 investment) | ||
November 14, 2017 through October 31, 2025 | ||
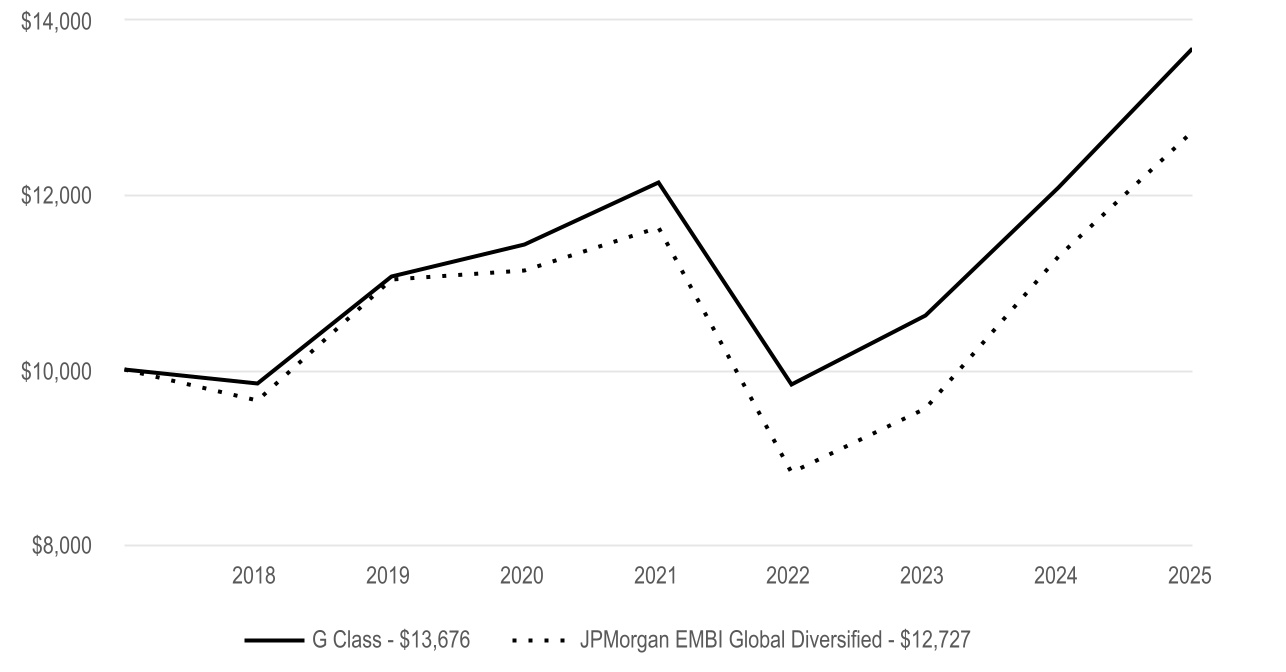
Average Annual Total Returns | ||||||||||||||
| 1 Year | 5 Year | Since Inception | Inception Date | |||||||||||
| G Class | ||||||||||||||
| JPMorgan EMBI Global Diversified | — | |||||||||||||
Fund Statistics | |||||
| Net Assets | $ | ||||
| Management Fees (dollars paid during the reporting period) | $ | ||||
| Portfolio Turnover Rate | % | ||||
| Total Number of Portfolio Holdings | |||||
| Fund Holdings | ||
Types of Investments in Portfolio (as a % of net assets) | |||||
| Sovereign Governments and Agencies | |||||
| Corporate Bonds | |||||
| U.S. Treasury Securities | |||||
| Convertible Preferred Securities | |||||
| Short-Term Investments | |||||
| Other Assets and Liabilities | |||||
For additional information about the fund, including its Prospectus, Statement of Additional Information, financial statements, holdings and proxy voting information, scan the QR code or visit americancentury.com/docs. | ||
©2025 American Century Proprietary Holdings, Inc. All rights reserved. | ||
| October 31, 2025 | |||||
What were the fund costs for the last year? (based on a hypothetical $10,000 investment) | ||||||||
Costs of a $10,000 investment | Costs paid as a percentage of a $10,000 investment | |||||||
| $ | ||||||||
| What were the key factors that affected the fund’s performance? | |||||
Global Bond Fund | |||||
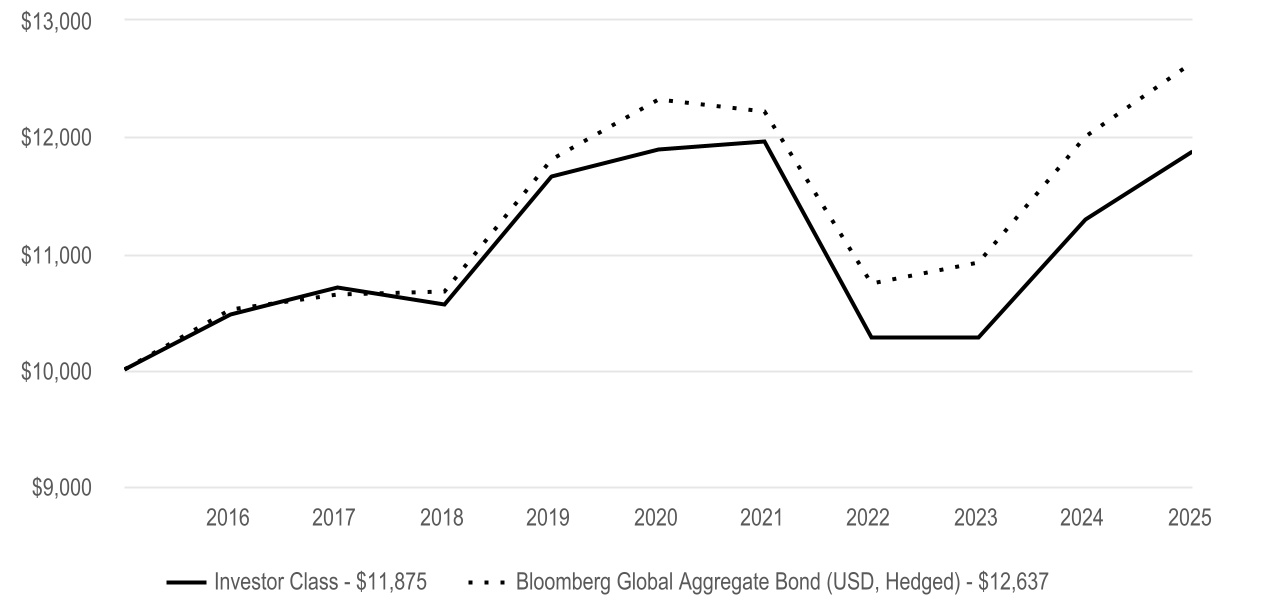
| The fund seeks long-term total return. The commentary below refers to the fund’s performance compared to the Bloomberg Global Aggregate Bond Index (USD Hedged). | |||||
• | During the reporting period, inflation continued to trend lower across most regions, which allowed several central banks to begin reducing interest rates. As government bond yields generally declined, global bonds broadly delivered gains. | ||||
• | Yield curves in most developed markets steepened during the period, reflecting expectations for stronger economic growth and rising inflation. Short-term rates generally declined, driven by accommodative monetary policy. Furthermore, the U.S. dollar weakened over the period. Against this backdrop, the fund’s yield curve and currency hedging strategies contributed modestly to performance. | ||||
• | Sector allocation was a key contributor to results, driven by positioning in cash and nominal governments, high-yield credit and securitized securities. | ||||
• | Hedging risk by purchasing CDX protection curtailed the updside potential gain from corporate credits. | ||||
Cumulative Performance (based on an initial $10,000 investment) | ||
October 31, 2015 through October 31, 2025 | ||
Average Annual Total Returns | |||||||||||
| 1 Year | 5 Year | 10 Year | |||||||||
| Investor Class | - | ||||||||||
| Bloomberg Global Aggregate Bond (USD, Hedged) | |||||||||||
Fund Statistics | |||||
| Net Assets | $ | ||||
| Management Fees (dollars paid during the reporting period) | $ | ||||
| Portfolio Turnover Rate | % | ||||
| Total Number of Portfolio Holdings | |||||
| Fund Holdings | ||
Types of Investments in Portfolio (as a % of net assets) | |||||
| Corporate Bonds | |||||
| Sovereign Governments and Agencies | |||||
| U.S. Government Agency Mortgage-Backed Securities | |||||
| Collateralized Mortgage Obligations | |||||
| Convertible Preferred Securities | |||||
| Asset-Backed Securities | |||||
| U.S. Treasury Securities | |||||
| Commercial Mortgage-Backed Securities | |||||
| Preferred Securities | |||||
| Collateralized Loan Obligations | |||||
| Municipal Securities | |||||
| U.S. Government Agency Securities | |||||
| Bank Loan Obligations | |||||
| Short-Term Investments | |||||
| Other Assets and Liabilities | |||||
For additional information about the fund, including its Prospectus, Statement of Additional Information, financial statements, holdings and proxy voting information, scan the QR code or visit americancentury.com/docs. | ||
©2025 American Century Proprietary Holdings, Inc. All rights reserved. | ||
| October 31, 2025 | |||||
What were the fund costs for the last year? (based on a hypothetical $10,000 investment) | ||||||||
Costs of a $10,000 investment | Costs paid as a percentage of a $10,000 investment | |||||||
| $ | ||||||||
| What were the key factors that affected the fund’s performance? | |||||
Global Bond Fund | |||||
| The fund seeks long-term total return. The commentary below refers to the fund’s performance compared to the Bloomberg Global Aggregate Bond Index (USD Hedged). | |||||
• | During the reporting period, inflation continued to trend lower across most regions, which allowed several central banks to begin reducing interest rates. As government bond yields generally declined, global bonds broadly delivered gains. | ||||
• | Yield curves in most developed markets steepened during the period, reflecting expectations for stronger economic growth and rising inflation. Short-term rates generally declined, driven by accommodative monetary policy. Furthermore, the U.S. dollar weakened over the period. Against this backdrop, the fund’s yield curve and currency hedging strategies contributed modestly to performance. | ||||
• | Sector allocation was a key contributor to results, driven by positioning in cash and nominal governments, high-yield credit and securitized securities. | ||||
• | Hedging risk by purchasing CDX protection curtailed the updside potential gain from corporate credits. | ||||
Cumulative Performance (based on an initial $10,000 investment) | ||
April 10, 2017 through October 31, 2025 | ||

Average Annual Total Returns | ||||||||||||||
| 1 Year | 5 Year | Since Inception | Inception Date | |||||||||||
| I Class | ||||||||||||||
| Bloomberg Global Aggregate Bond (USD, Hedged) | — | |||||||||||||
Fund Statistics | |||||
| Net Assets | $ | ||||
| Management Fees (dollars paid during the reporting period) | $ | ||||
| Portfolio Turnover Rate | % | ||||
| Total Number of Portfolio Holdings | |||||
| Fund Holdings | ||
Types of Investments in Portfolio (as a % of net assets) | |||||
| Corporate Bonds | |||||
| Sovereign Governments and Agencies | |||||
| U.S. Government Agency Mortgage-Backed Securities | |||||
| Collateralized Mortgage Obligations | |||||
| Convertible Preferred Securities | |||||
| Asset-Backed Securities | |||||
| U.S. Treasury Securities | |||||
| Commercial Mortgage-Backed Securities | |||||
| Preferred Securities | |||||
| Collateralized Loan Obligations | |||||
| Municipal Securities | |||||
| U.S. Government Agency Securities | |||||
| Bank Loan Obligations | |||||
| Short-Term Investments | |||||
| Other Assets and Liabilities | |||||
For additional information about the fund, including its Prospectus, Statement of Additional Information, financial statements, holdings and proxy voting information, scan the QR code or visit americancentury.com/docs. | ||
©2025 American Century Proprietary Holdings, Inc. All rights reserved. | ||
| October 31, 2025 | |||||
What were the fund costs for the last year? (based on a hypothetical $10,000 investment) | ||||||||
Costs of a $10,000 investment | Costs paid as a percentage of a $10,000 investment | |||||||
| $ | ||||||||
| What were the key factors that affected the fund’s performance? | |||||
Global Bond Fund | |||||
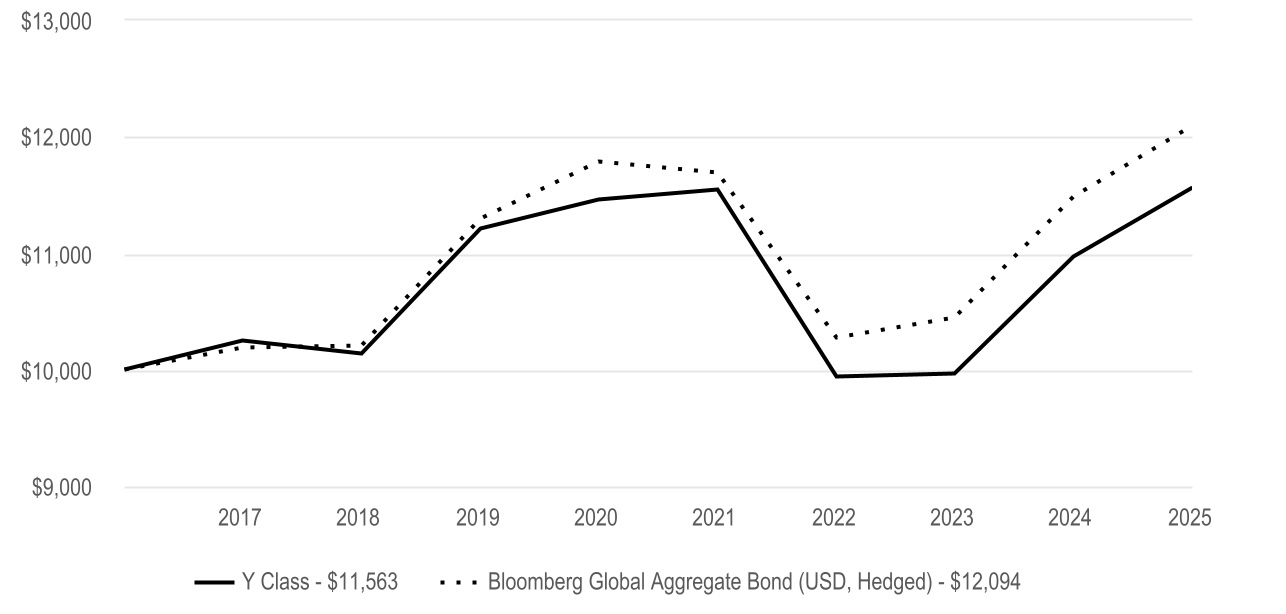
| The fund seeks long-term total return. The commentary below refers to the fund’s performance compared to the Bloomberg Global Aggregate Bond Index (USD Hedged). | |||||
• | During the reporting period, inflation continued to trend lower across most regions, which allowed several central banks to begin reducing interest rates. As government bond yields generally declined, global bonds broadly delivered gains. | ||||
• | Yield curves in most developed markets steepened during the period, reflecting expectations for stronger economic growth and rising inflation. Short-term rates generally declined, driven by accommodative monetary policy. Furthermore, the U.S. dollar weakened over the period. Against this backdrop, the fund’s yield curve and currency hedging strategies contributed modestly to performance. | ||||
• | Sector allocation was a key contributor to results, driven by positioning in cash and nominal governments, high-yield credit and securitized securities. | ||||
• | Hedging risk by purchasing CDX protection curtailed the updside potential gain from corporate credits. | ||||
Cumulative Performance (based on an initial $10,000 investment) | ||
April 10, 2017 through October 31, 2025 | ||
Average Annual Total Returns | ||||||||||||||
| 1 Year | 5 Year | Since Inception | Inception Date | |||||||||||
| Y Class | ||||||||||||||
| Bloomberg Global Aggregate Bond (USD, Hedged) | — | |||||||||||||
Fund Statistics | |||||
| Net Assets | $ | ||||
| Management Fees (dollars paid during the reporting period) | $ | ||||
| Portfolio Turnover Rate | % | ||||
| Total Number of Portfolio Holdings | |||||
| Fund Holdings | ||
Types of Investments in Portfolio (as a % of net assets) | |||||
| Corporate Bonds | |||||
| Sovereign Governments and Agencies | |||||
| U.S. Government Agency Mortgage-Backed Securities | |||||
| Collateralized Mortgage Obligations | |||||
| Convertible Preferred Securities | |||||
| Asset-Backed Securities | |||||
| U.S. Treasury Securities | |||||
| Commercial Mortgage-Backed Securities | |||||
| Preferred Securities | |||||
| Collateralized Loan Obligations | |||||
| Municipal Securities | |||||
| U.S. Government Agency Securities | |||||
| Bank Loan Obligations | |||||
| Short-Term Investments | |||||
| Other Assets and Liabilities | |||||
For additional information about the fund, including its Prospectus, Statement of Additional Information, financial statements, holdings and proxy voting information, scan the QR code or visit americancentury.com/docs. | ||
©2025 American Century Proprietary Holdings, Inc. All rights reserved. | ||
| October 31, 2025 | |||||
What were the fund costs for the last year? (based on a hypothetical $10,000 investment) | ||||||||
Costs of a $10,000 investment | Costs paid as a percentage of a $10,000 investment | |||||||
| $ | ||||||||
| What were the key factors that affected the fund’s performance? | |||||
Global Bond Fund | |||||
| The fund seeks long-term total return. The commentary below refers to the fund’s performance compared to the Bloomberg Global Aggregate Bond Index (USD Hedged). | |||||
• | During the reporting period, inflation continued to trend lower across most regions, which allowed several central banks to begin reducing interest rates. As government bond yields generally declined, global bonds broadly delivered gains. | ||||
• | Yield curves in most developed markets steepened during the period, reflecting expectations for stronger economic growth and rising inflation. Short-term rates generally declined, driven by accommodative monetary policy. Furthermore, the U.S. dollar weakened over the period. Against this backdrop, the fund’s yield curve and currency hedging strategies contributed modestly to performance. | ||||
• | Sector allocation was a key contributor to results, driven by positioning in cash and nominal governments, high-yield credit and securitized securities. | ||||
• | Hedging risk by purchasing CDX protection curtailed the updside potential gain from corporate credits. | ||||
Cumulative Performance (based on an initial $10,000 investment) | ||
October 31, 2015 through October 31, 2025 | ||
The initial investment is adjusted to reflect the maximum initial sales charge. | ||
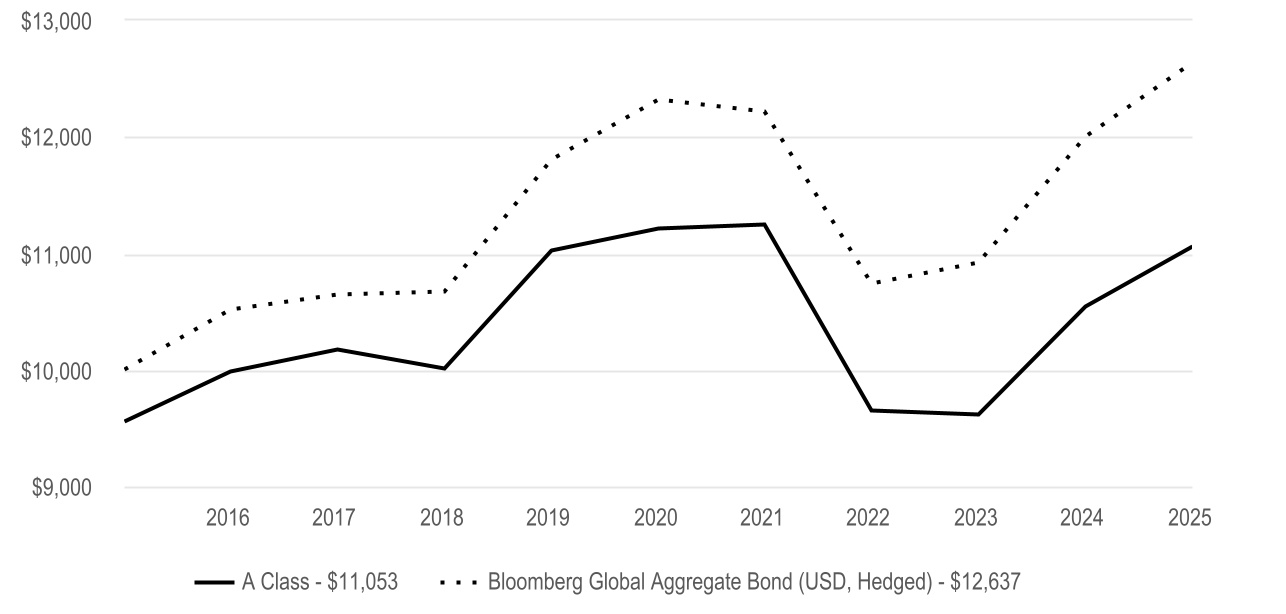
Average Annual Total Returns | |||||||||||
| 1 Year | 5 Year | 10 Year | |||||||||
| A Class | - | ||||||||||
| A Class - with sales charge | - | ||||||||||
| Bloomberg Global Aggregate Bond (USD, Hedged) | |||||||||||
A Class shares have a 4.50% maximum initial sales charge and may be subject to a maximum contingent deferred sales charge of 1.00%. | |||||||||||||||||
Fund Statistics | |||||
| Net Assets | $ | ||||
| Management Fees (dollars paid during the reporting period) | $ | ||||
| Portfolio Turnover Rate | % | ||||
| Total Number of Portfolio Holdings | |||||
| Fund Holdings | ||
Types of Investments in Portfolio (as a % of net assets) | |||||
| Corporate Bonds | |||||
| Sovereign Governments and Agencies | |||||
| U.S. Government Agency Mortgage-Backed Securities | |||||
| Collateralized Mortgage Obligations | |||||
| Convertible Preferred Securities | |||||
| Asset-Backed Securities | |||||
| U.S. Treasury Securities | |||||
| Commercial Mortgage-Backed Securities | |||||
| Preferred Securities | |||||
| Collateralized Loan Obligations | |||||
| Municipal Securities | |||||
| U.S. Government Agency Securities | |||||
| Bank Loan Obligations | |||||
| Short-Term Investments | |||||
| Other Assets and Liabilities | |||||
For additional information about the fund, including its Prospectus, Statement of Additional Information, financial statements, holdings and proxy voting information, scan the QR code or visit americancentury.com/docs. | ||
©2025 American Century Proprietary Holdings, Inc. All rights reserved. | ||
| October 31, 2025 | |||||
What were the fund costs for the last year? (based on a hypothetical $10,000 investment) | ||||||||
Costs of a $10,000 investment | Costs paid as a percentage of a $10,000 investment | |||||||
| $ | ||||||||
| What were the key factors that affected the fund’s performance? | |||||
Global Bond Fund | |||||
| The fund seeks long-term total return. The commentary below refers to the fund’s performance compared to the Bloomberg Global Aggregate Bond Index (USD Hedged). | |||||
• | During the reporting period, inflation continued to trend lower across most regions, which allowed several central banks to begin reducing interest rates. As government bond yields generally declined, global bonds broadly delivered gains. | ||||
• | Yield curves in most developed markets steepened during the period, reflecting expectations for stronger economic growth and rising inflation. Short-term rates generally declined, driven by accommodative monetary policy. Furthermore, the U.S. dollar weakened over the period. Against this backdrop, the fund’s yield curve and currency hedging strategies contributed modestly to performance. | ||||
• | Sector allocation was a key contributor to results, driven by positioning in cash and nominal governments, high-yield credit and securitized securities. | ||||
• | Hedging risk by purchasing CDX protection curtailed the updside potential gain from corporate credits. | ||||
Cumulative Performance (based on an initial $10,000 investment) | ||
October 31, 2015 through October 31, 2025 | ||
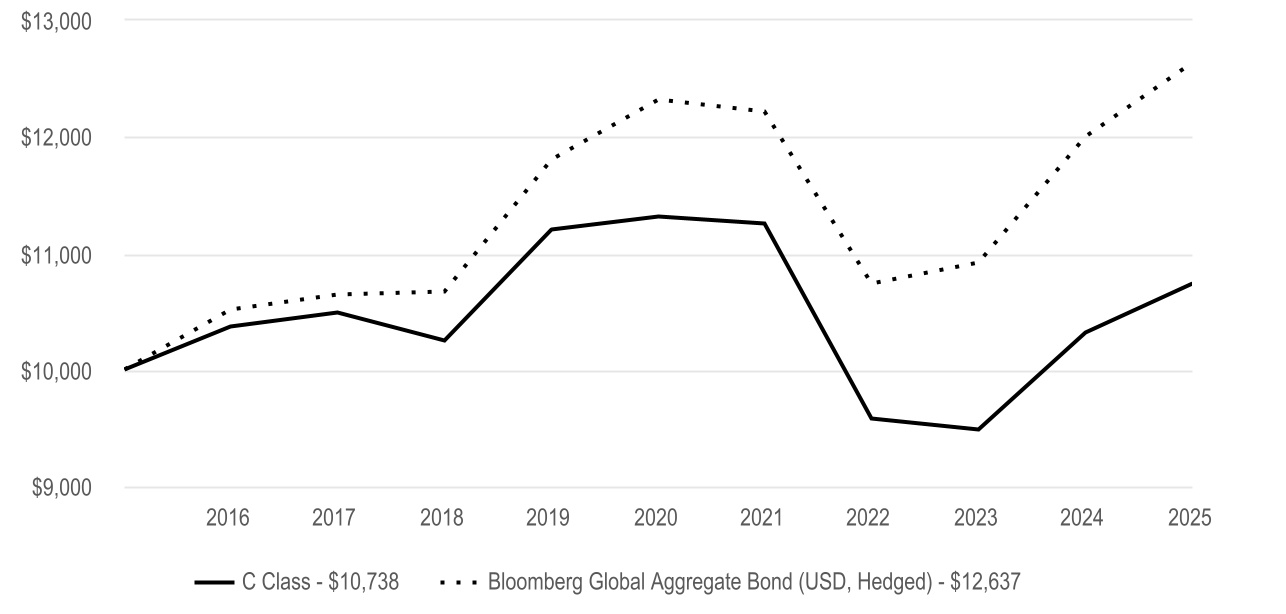
Average Annual Total Returns | |||||||||||
| 1 Year | 5 Year | 10 Year | |||||||||
| C Class | - | ||||||||||
| Bloomberg Global Aggregate Bond (USD, Hedged) | |||||||||||
| C Class shares will automatically convert to A Class shares after being held for approximately eight years. C Class average annual returns do not reflect this conversion. | |||||||||||||||||
Fund Statistics | |||||
| Net Assets | $ | ||||
| Management Fees (dollars paid during the reporting period) | $ | ||||
| Portfolio Turnover Rate | % | ||||
| Total Number of Portfolio Holdings | |||||
| Fund Holdings | ||
Types of Investments in Portfolio (as a % of net assets) | |||||
| Corporate Bonds | |||||
| Sovereign Governments and Agencies | |||||
| U.S. Government Agency Mortgage-Backed Securities | |||||
| Collateralized Mortgage Obligations | |||||
| Convertible Preferred Securities | |||||
| Asset-Backed Securities | |||||
| U.S. Treasury Securities | |||||
| Commercial Mortgage-Backed Securities | |||||
| Preferred Securities | |||||
| Collateralized Loan Obligations | |||||
| Municipal Securities | |||||
| U.S. Government Agency Securities | |||||
| Bank Loan Obligations | |||||
| Short-Term Investments | |||||
| Other Assets and Liabilities | |||||
For additional information about the fund, including its Prospectus, Statement of Additional Information, financial statements, holdings and proxy voting information, scan the QR code or visit americancentury.com/docs. | ||
©2025 American Century Proprietary Holdings, Inc. All rights reserved. | ||
| October 31, 2025 | |||||
What were the fund costs for the last year? (based on a hypothetical $10,000 investment) | ||||||||
Costs of a $10,000 investment | Costs paid as a percentage of a $10,000 investment | |||||||
| $ | ||||||||
| What were the key factors that affected the fund’s performance? | |||||
Global Bond Fund | |||||
| The fund seeks long-term total return. The commentary below refers to the fund’s performance compared to the Bloomberg Global Aggregate Bond Index (USD Hedged). | |||||
• | During the reporting period, inflation continued to trend lower across most regions, which allowed several central banks to begin reducing interest rates. As government bond yields generally declined, global bonds broadly delivered gains. | ||||
• | Yield curves in most developed markets steepened during the period, reflecting expectations for stronger economic growth and rising inflation. Short-term rates generally declined, driven by accommodative monetary policy. Furthermore, the U.S. dollar weakened over the period. Against this backdrop, the fund’s yield curve and currency hedging strategies contributed modestly to performance. | ||||
• | Sector allocation was a key contributor to results, driven by positioning in cash and nominal governments, high-yield credit and securitized securities. | ||||
• | Hedging risk by purchasing CDX protection curtailed the updside potential gain from corporate credits. | ||||
Cumulative Performance (based on an initial $10,000 investment) | ||
October 31, 2015 through October 31, 2025 | ||
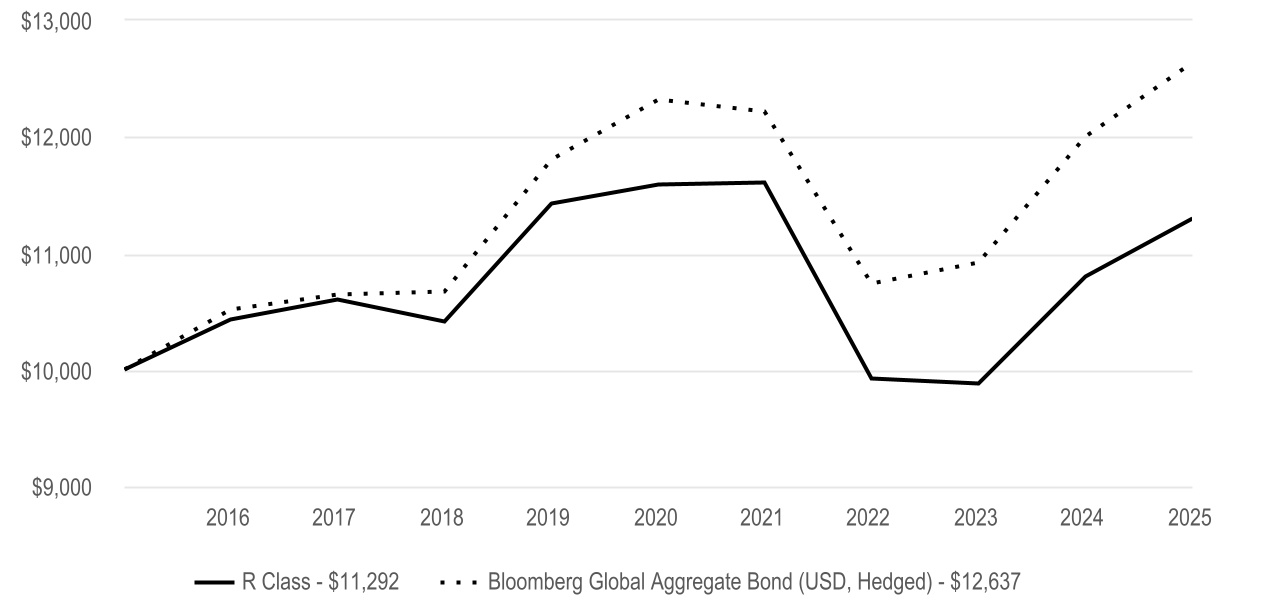
Average Annual Total Returns | |||||||||||
| 1 Year | 5 Year | 10 Year | |||||||||
| R Class | - | ||||||||||
| Bloomberg Global Aggregate Bond (USD, Hedged) | |||||||||||
Fund Statistics | |||||
| Net Assets | $ | ||||
| Management Fees (dollars paid during the reporting period) | $ | ||||
| Portfolio Turnover Rate | % | ||||
| Total Number of Portfolio Holdings | |||||
| Fund Holdings | ||
Types of Investments in Portfolio (as a % of net assets) | |||||
| Corporate Bonds | |||||
| Sovereign Governments and Agencies | |||||
| U.S. Government Agency Mortgage-Backed Securities | |||||
| Collateralized Mortgage Obligations | |||||
| Convertible Preferred Securities | |||||
| Asset-Backed Securities | |||||
| U.S. Treasury Securities | |||||
| Commercial Mortgage-Backed Securities | |||||
| Preferred Securities | |||||
| Collateralized Loan Obligations | |||||
| Municipal Securities | |||||
| U.S. Government Agency Securities | |||||
| Bank Loan Obligations | |||||
| Short-Term Investments | |||||
| Other Assets and Liabilities | |||||
For additional information about the fund, including its Prospectus, Statement of Additional Information, financial statements, holdings and proxy voting information, scan the QR code or visit americancentury.com/docs. | ||
©2025 American Century Proprietary Holdings, Inc. All rights reserved. | ||
| October 31, 2025 | |||||
What were the fund costs for the last year? (based on a hypothetical $10,000 investment) | ||||||||
Costs of a $10,000 investment | Costs paid as a percentage of a $10,000 investment | |||||||
| $ | ||||||||
| What were the key factors that affected the fund’s performance? | |||||
Global Bond Fund | |||||
| The fund seeks long-term total return. The commentary below refers to the fund’s performance compared to the Bloomberg Global Aggregate Bond Index (USD Hedged). | |||||
• | During the reporting period, inflation continued to trend lower across most regions, which allowed several central banks to begin reducing interest rates. As government bond yields generally declined, global bonds broadly delivered gains. | ||||
• | Yield curves in most developed markets steepened during the period, reflecting expectations for stronger economic growth and rising inflation. Short-term rates generally declined, driven by accommodative monetary policy. Furthermore, the U.S. dollar weakened over the period. Against this backdrop, the fund’s yield curve and currency hedging strategies contributed modestly to performance. | ||||
• | Sector allocation was a key contributor to results, driven by positioning in cash and nominal governments, high-yield credit and securitized securities. | ||||
• | Hedging risk by purchasing CDX protection curtailed the updside potential gain from corporate credits. | ||||
Cumulative Performance (based on an initial $10,000 investment) | ||
October 31, 2015 through October 31, 2025 | ||
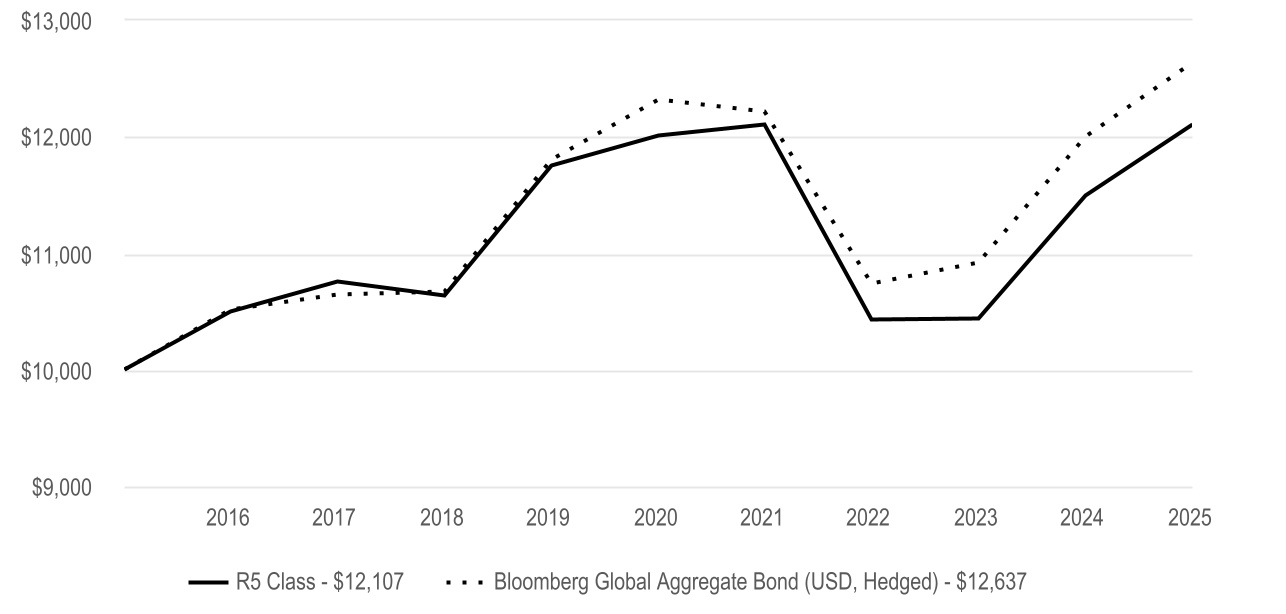
Average Annual Total Returns | |||||||||||
| 1 Year | 5 Year | 10 Year | |||||||||
| R5 Class | |||||||||||
| Bloomberg Global Aggregate Bond (USD, Hedged) | |||||||||||
Fund Statistics | |||||
| Net Assets | $ | ||||
| Management Fees (dollars paid during the reporting period) | $ | ||||
| Portfolio Turnover Rate | % | ||||
| Total Number of Portfolio Holdings | |||||
| Fund Holdings | ||
Types of Investments in Portfolio (as a % of net assets) | |||||
| Corporate Bonds | |||||
| Sovereign Governments and Agencies | |||||
| U.S. Government Agency Mortgage-Backed Securities | |||||
| Collateralized Mortgage Obligations | |||||
| Convertible Preferred Securities | |||||
| Asset-Backed Securities | |||||
| U.S. Treasury Securities | |||||
| Commercial Mortgage-Backed Securities | |||||
| Preferred Securities | |||||
| Collateralized Loan Obligations | |||||
| Municipal Securities | |||||
| U.S. Government Agency Securities | |||||
| Bank Loan Obligations | |||||
| Short-Term Investments | |||||
| Other Assets and Liabilities | |||||
For additional information about the fund, including its Prospectus, Statement of Additional Information, financial statements, holdings and proxy voting information, scan the QR code or visit americancentury.com/docs. | ||
©2025 American Century Proprietary Holdings, Inc. All rights reserved. | ||
| October 31, 2025 | |||||
What were the fund costs for the last year? (based on a hypothetical $10,000 investment) | ||||||||
Costs of a $10,000 investment | Costs paid as a percentage of a $10,000 investment | |||||||
| $ | ||||||||
| What were the key factors that affected the fund’s performance? | |||||
Global Bond Fund | |||||
| The fund seeks long-term total return. The commentary below refers to the fund’s performance compared to the Bloomberg Global Aggregate Bond Index (USD Hedged). | |||||
• | During the reporting period, inflation continued to trend lower across most regions, which allowed several central banks to begin reducing interest rates. As government bond yields generally declined, global bonds broadly delivered gains. | ||||
• | Yield curves in most developed markets steepened during the period, reflecting expectations for stronger economic growth and rising inflation. Short-term rates generally declined, driven by accommodative monetary policy. Furthermore, the U.S. dollar weakened over the period. Against this backdrop, the fund’s yield curve and currency hedging strategies contributed modestly to performance. | ||||
• | Sector allocation was a key contributor to results, driven by positioning in cash and nominal governments, high-yield credit and securitized securities. | ||||
• | Hedging risk by purchasing CDX protection curtailed the updside potential gain from corporate credits. | ||||
Cumulative Performance (based on an initial $10,000 investment) | ||
October 31, 2015 through October 31, 2025 | ||
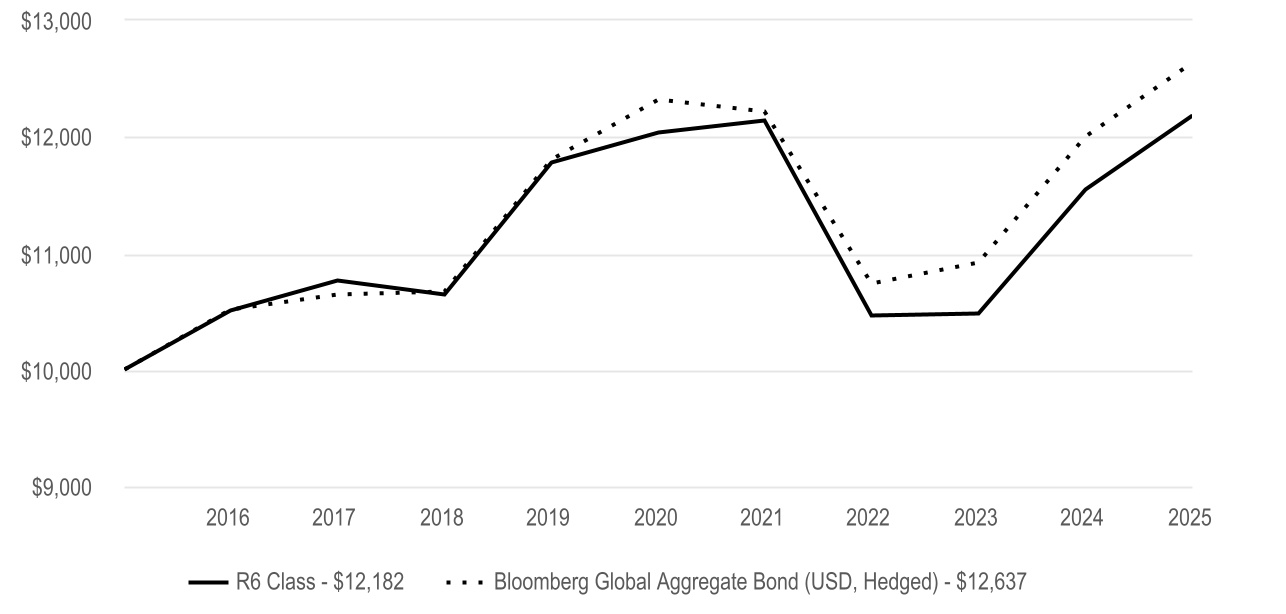
Average Annual Total Returns | |||||||||||
| 1 Year | 5 Year | 10 Year | |||||||||
| R6 Class | |||||||||||
| Bloomberg Global Aggregate Bond (USD, Hedged) | |||||||||||
Fund Statistics | |||||
| Net Assets | $ | ||||
| Management Fees (dollars paid during the reporting period) | $ | ||||
| Portfolio Turnover Rate | % | ||||
| Total Number of Portfolio Holdings | |||||
| Fund Holdings | ||
Types of Investments in Portfolio (as a % of net assets) | |||||
| Corporate Bonds | |||||
| Sovereign Governments and Agencies | |||||
| U.S. Government Agency Mortgage-Backed Securities | |||||
| Collateralized Mortgage Obligations | |||||
| Convertible Preferred Securities | |||||
| Asset-Backed Securities | |||||
| U.S. Treasury Securities | |||||
| Commercial Mortgage-Backed Securities | |||||
| Preferred Securities | |||||
| Collateralized Loan Obligations | |||||
| Municipal Securities | |||||
| U.S. Government Agency Securities | |||||
| Bank Loan Obligations | |||||
| Short-Term Investments | |||||
| Other Assets and Liabilities | |||||
For additional information about the fund, including its Prospectus, Statement of Additional Information, financial statements, holdings and proxy voting information, scan the QR code or visit americancentury.com/docs. | ||
©2025 American Century Proprietary Holdings, Inc. All rights reserved. | ||
| October 31, 2025 | |||||
What were the fund costs for the last year? (based on a hypothetical $10,000 investment) | ||||||||
Costs of a $10,000 investment | Costs paid as a percentage of a $10,000 investment | |||||||
| $ | ||||||||
| What were the key factors that affected the fund’s performance? | |||||
Global Bond Fund | |||||
| The fund seeks long-term total return. The commentary below refers to the fund’s performance compared to the Bloomberg Global Aggregate Bond Index (USD Hedged). | |||||
• | During the reporting period, inflation continued to trend lower across most regions, which allowed several central banks to begin reducing interest rates. As government bond yields generally declined, global bonds broadly delivered gains. | ||||
• | Yield curves in most developed markets steepened during the period, reflecting expectations for stronger economic growth and rising inflation. Short-term rates generally declined, driven by accommodative monetary policy. Furthermore, the U.S. dollar weakened over the period. Against this backdrop, the fund’s yield curve and currency hedging strategies contributed modestly to performance. | ||||
• | Sector allocation was a key contributor to results, driven by positioning in cash and nominal governments, high-yield credit and securitized securities. | ||||
• | Hedging risk by purchasing CDX protection curtailed the updside potential gain from corporate credits. | ||||
Cumulative Performance (based on an initial $10,000 investment) | ||
July 28, 2017 through October 31, 2025 | ||
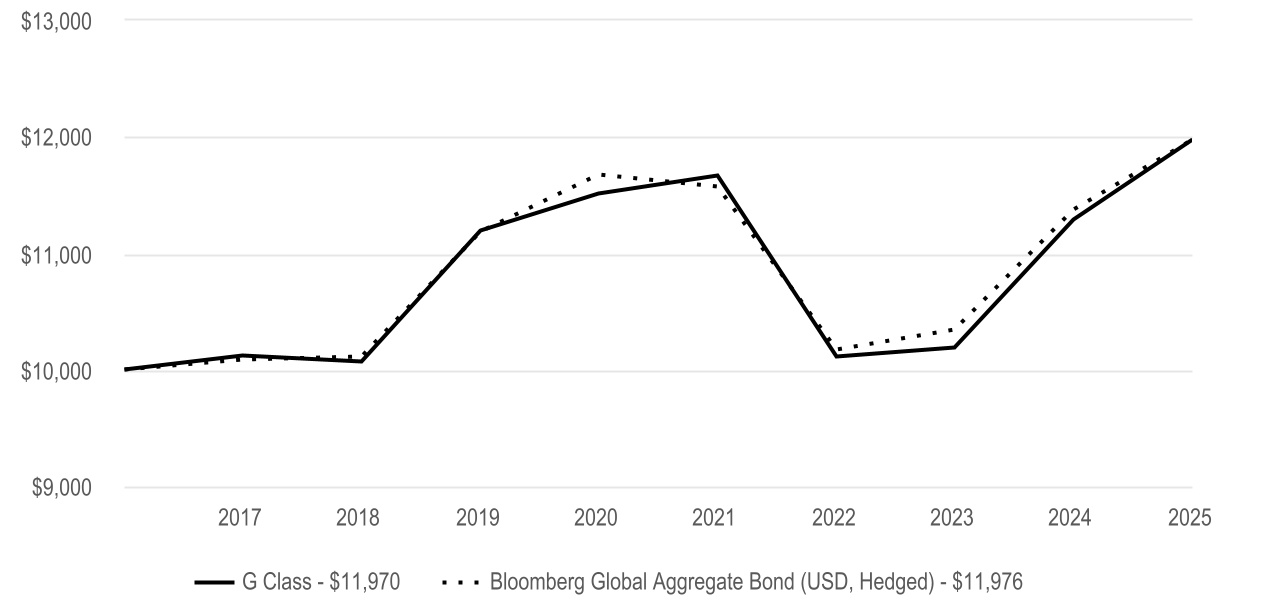
Average Annual Total Returns | ||||||||||||||
| 1 Year | 5 Year | Since Inception | Inception Date | |||||||||||
| G Class | ||||||||||||||
| Bloomberg Global Aggregate Bond (USD, Hedged) | — | |||||||||||||
Fund Statistics | |||||
| Net Assets | $ | ||||
| Management Fees (dollars paid during the reporting period) | $ | ||||
| Portfolio Turnover Rate | % | ||||
| Total Number of Portfolio Holdings | |||||
| Fund Holdings | ||
Types of Investments in Portfolio (as a % of net assets) | |||||
| Corporate Bonds | |||||
| Sovereign Governments and Agencies | |||||
| U.S. Government Agency Mortgage-Backed Securities | |||||
| Collateralized Mortgage Obligations | |||||
| Convertible Preferred Securities | |||||
| Asset-Backed Securities | |||||
| U.S. Treasury Securities | |||||
| Commercial Mortgage-Backed Securities | |||||
| Preferred Securities | |||||
| Collateralized Loan Obligations | |||||
| Municipal Securities | |||||
| U.S. Government Agency Securities | |||||
| Bank Loan Obligations | |||||
| Short-Term Investments | |||||
| Other Assets and Liabilities | |||||
For additional information about the fund, including its Prospectus, Statement of Additional Information, financial statements, holdings and proxy voting information, scan the QR code or visit americancentury.com/docs. | ||
©2025 American Century Proprietary Holdings, Inc. All rights reserved. | ||
| FY 2024: | $46,500 | ||||
| FY 2025: | $48,120 | ||||
| FY 2024: | $0 | |||||||
| FY 2025: | $0 | |||||||
| FY 2024: | $0 | |||||||
| FY 2025: | $0 | |||||||
| FY 2024: | $0 | |||||||
| FY 2025: | $0 | |||||||
| FY 2024: | $0 | |||||||
| FY 2025: | $0 | |||||||
| FY 2024: | $0 | |||||||
| FY 2025: | $0 | |||||||
| FY 2024: | $0 | |||||||
| FY 2025: | $0 | |||||||
| FY 2024: | $98,325 | ||||
| FY 2025: | $98,325 | ||||
| (i) | Not applicable. | ||||
| (j) | Not applicable. | ||||
| Annual Financial Statements and Other Information | |||||
| October 31, 2025 | |||||
| Emerging Markets Debt Fund | |||||
| Investor Class (AEDVX) | |||||
| I Class (AEHDX) | |||||
| Y Class (AEYDX) | |||||
| A Class (AEDQX) | |||||
| C Class (AEDHX) | |||||
| R Class (AEDWX) | |||||
| R5 Class (AEDJX) | |||||
| R6 Class (AEXDX) | |||||
| G Class (AEDGX) | |||||
| Global Bond Fund | |||||
| Investor Class (AGBVX) | |||||
| I Class (AGBHX) | |||||
| Y Class (AGBWX) | |||||
| A Class (AGBAX) | |||||
| C Class (AGBTX) | |||||
| R Class (AGBRX) | |||||
| R5 Class (AGBNX) | |||||
| R6 Class (AGBDX) | |||||
| G Class (AGBGX) | |||||
| Table of Contents | ||
| Schedules of Investments | |||||
| Statements of Assets and Liabilities | |||||
| Statements of Operations | |||||
| Statements of Changes in Net Assets | |||||
| Notes to Financial Statements | |||||
| Financial Highlights | |||||
| Report of Independent Registered Public Accounting Firm | |||||
| Approval of Management Agreement | |||||
Schedule of Investments - Emerging Markets Debt Fund | ||
Principal Amount/Shares | Value | ||||||||||
SOVEREIGN GOVERNMENTS AND AGENCIES — 73.6% | |||||||||||
Angola — 1.0% | |||||||||||
Angola Government International Bonds, 8.25%, 5/9/28(1) | $ | 2,700,000 | $ | 2,667,349 | |||||||
Angola Government International Bonds, 8.00%, 11/26/29(1) | 1,800,000 | 1,725,433 | |||||||||
Angola Government International Bonds, 9.125%, 11/26/49(1) | 1,200,000 | 1,009,217 | |||||||||
| 5,401,999 | |||||||||||
Argentina — 2.5% | |||||||||||
Argentina Republic Government International Bonds, VRN, 4.125%, 7/9/35 | 18,350,000 | 12,900,050 | |||||||||
Bahamas — 0.2% | |||||||||||
Bahamas Government International Bonds, 8.25%, 6/24/36(1) | 775,000 | 840,712 | |||||||||
Bahrain — 1.9% | |||||||||||
Bahrain Government International Bonds, 5.625%, 9/30/31(1) | 4,800,000 | 4,829,555 | |||||||||
Bahrain Government International Bonds, 7.50%, 2/12/36(1) | 1,000,000 | 1,103,926 | |||||||||
Bahrain Government International Bonds, 6.625%, 10/6/37(1) | 1,200,000 | 1,217,911 | |||||||||
Bahrain Government International Bonds, 6.00%, 9/19/44(1) | 2,700,000 | 2,513,716 | |||||||||
| 9,665,108 | |||||||||||
Brazil — 0.2% | |||||||||||
Brazil Government International Bonds, 7.125%, 5/13/54 | 1,000,000 | 1,016,750 | |||||||||
Chile — 2.4% | |||||||||||
Chile Government International Bonds, 4.34%, 3/7/42 | 13,700,000 | 12,293,010 | |||||||||
Colombia — 3.4% | |||||||||||
Colombia Government International Bonds, 5.00%, 9/19/32 | EUR | 3,500,000 | 3,956,369 | ||||||||
Colombia Government International Bonds, 7.75%, 11/7/36 | $ | 12,805,000 | 13,666,265 | ||||||||
| 17,622,634 | |||||||||||
Costa Rica — 0.7% | |||||||||||
Costa Rica Government International Bonds, 7.30%, 11/13/54(1) | 3,350,000 | 3,754,094 | |||||||||
Dominican Republic — 3.6% | |||||||||||
Dominican Republic International Bonds, 4.50%, 1/30/30 | 11,230,000 | 11,002,592 | |||||||||
Dominican Republic International Bonds, 6.95%, 3/15/37(1) | 4,800,000 | 5,127,120 | |||||||||
Dominican Republic International Bonds, 5.875%, 1/30/60(1) | 2,650,000 | 2,399,178 | |||||||||
| 18,528,890 | |||||||||||
Ecuador — 1.2% | |||||||||||
Ecuador Government International Bonds, VRN, 6.90%, 7/31/35 | 8,336,510 | 6,408,692 | |||||||||
Egypt — 2.3% | |||||||||||
Egypt Government International Bonds, 7.30%, 9/30/33(1) | 2,100,000 | 2,058,232 | |||||||||
Egypt Government International Bonds, 8.50%, 1/31/47(1) | 10,725,000 | 9,906,967 | |||||||||
| 11,965,199 | |||||||||||
El Salvador — 0.6% | |||||||||||
El Salvador Government International Bonds, 9.25%, 4/17/30(1) | 2,700,000 | 2,946,375 | |||||||||
Ghana — 0.9% | |||||||||||
Ghana Government International Bonds, 0.00%, 7/3/26(1)(2) | 107,200 | 104,252 | |||||||||
Ghana Government International Bonds, 0.00%, 1/3/30(1)(2) | 337,145 | 292,758 | |||||||||
Ghana Government International Bonds, VRN, 5.00%, 7/3/29(1) | 1,621,400 | 1,582,878 | |||||||||
Ghana Government International Bonds, VRN, 5.00%, 7/3/35(1) | 3,100,000 | 2,679,485 | |||||||||
| 4,659,373 | |||||||||||
Guatemala — 1.5% | |||||||||||
Guatemala Government Bonds, 4.375%, 6/5/27(1) | 1,900,000 | 1,890,500 | |||||||||
Guatemala Government Bonds, 7.05%, 10/4/32 | 3,620,000 | 4,011,412 | |||||||||
Guatemala Government Bonds, 6.125%, 6/1/50 | 1,600,000 | 1,577,080 | |||||||||
Guatemala Government Bonds, 6.875%, 8/15/55(1) | 500,000 | 540,205 | |||||||||
| 8,019,197 | |||||||||||
Schedule of Investments - Emerging Markets Debt Fund | ||
Principal Amount/Shares | Value | ||||||||||
Honduras — 0.2% | |||||||||||
Honduras Government International Bonds, 8.625%, 11/27/34(1) | $ | 1,000,000 | $ | 1,072,750 | |||||||
Hungary — 3.2% | |||||||||||
Hungary Government Bonds, 3.00%, 8/21/30 | HUF | 3,048,500,000 | 7,832,217 | ||||||||
Hungary Government International Bonds, 2.125%, 9/22/31(1) | $ | 7,900,000 | 6,829,248 | ||||||||
Hungary Government International Bonds, 6.00%, 9/26/35(1) | 2,000,000 | 2,105,060 | |||||||||
| 16,766,525 | |||||||||||
India — 1.0% | |||||||||||
India Government Bonds, 7.54%, 5/23/36 | INR | 420,000,000 | 4,999,551 | ||||||||
Indonesia — 1.2% | |||||||||||
Indonesia Government International Bonds, 3.75%, 10/16/33 | EUR | 3,100,000 | 3,603,419 | ||||||||
Indonesia Government International Bonds, 5.45%, 9/20/52 | $ | 2,390,000 | 2,410,844 | ||||||||
| 6,014,263 | |||||||||||
Iraq — 0.0% | |||||||||||
Iraq International Bonds, 5.80%, 1/15/28 | 250,000 | 249,593 | |||||||||
Ivory Coast — 0.9% | |||||||||||
Ivory Coast Government International Bonds, 8.08%, 4/1/36(1) | 2,700,000 | 2,854,383 | |||||||||
Ivory Coast Government International Bonds, 8.25%, 1/30/37(1) | 1,900,000 | 2,022,895 | |||||||||
| 4,877,278 | |||||||||||
Jordan — 0.4% | |||||||||||
Jordan Government International Bonds, 7.375%, 10/10/47(1) | 1,910,000 | 1,934,649 | |||||||||
Kazakhstan — 0.7% | |||||||||||
Kazakhstan Government International Bonds, 4.41%, 10/28/30(1) | 2,400,000 | 2,381,400 | |||||||||
Kazakhstan Government International Bonds, 5.50%, 7/1/37(1) | 1,300,000 | 1,332,420 | |||||||||
| 3,713,820 | |||||||||||
Kenya — 0.9% | |||||||||||
Republic of Kenya Government International Bonds, 9.75%, 2/16/31(1) | 1,390,000 | 1,498,538 | |||||||||
Republic of Kenya Government International Bonds, 9.50%, 3/5/36(1) | 3,100,000 | 3,183,765 | |||||||||
| 4,682,303 | |||||||||||
Lebanon — 0.3% | |||||||||||
Lebanon Government International Bonds, 6.65%, 11/3/28(3)(4) | 6,500,000 | 1,494,025 | |||||||||
Malaysia — 0.6% | |||||||||||
Malaysia Government Bonds, 3.83%, 7/5/34 | MYR | 12,500,000 | 3,050,887 | ||||||||
Mexico — 4.8% | |||||||||||
Eagle Funding Luxco SARL, 5.50%, 8/17/30(1) | $ | 3,659,000 | 3,721,752 | ||||||||
Mexico Bonos, 8.00%, 2/21/36 | MXN | 77,700,000 | 3,946,207 | ||||||||
Mexico Bonos, 7.75%, 11/13/42 | MXN | 61,700,000 | 2,867,091 | ||||||||
Mexico Bonos, 8.50%, 3/1/29 | MXN | 155,910,000 | 8,542,558 | ||||||||
Mexico Government International Bonds, 7.375%, 5/13/55 | $ | 5,000,000 | 5,624,213 | ||||||||
| 24,701,821 | |||||||||||
Mongolia — 0.3% | |||||||||||
Mongolia Government International Bonds, 6.625%, 2/25/30(1) | 1,500,000 | 1,539,847 | |||||||||
Nigeria — 2.0% | |||||||||||
Nigeria Government International Bonds, 7.375%, 9/28/33(1) | 10,700,000 | 10,368,436 | |||||||||
Oman — 1.4% | |||||||||||
Oman Government International Bonds, 6.75%, 1/17/48(1) | 6,600,000 | 7,418,818 | |||||||||
Pakistan — 1.4% | |||||||||||
Pakistan Government International Bonds, 6.875%, 12/5/27(1) | 7,515,000 | 7,523,373 | |||||||||
Panama — 2.8% | |||||||||||
Panama Government International Bonds, 3.16%, 1/23/30 | 3,030,000 | 2,845,625 | |||||||||
Panama Government International Bonds, 6.85%, 3/28/54 | 5,070,000 | 5,384,086 | |||||||||
Schedule of Investments - Emerging Markets Debt Fund | ||
Principal Amount/Shares | Value | ||||||||||
Panama Government International Bonds, 6.875%, 1/31/36 | $ | 6,049,000 | $ | 6,555,453 | |||||||
| 14,785,164 | |||||||||||
Paraguay — 0.6% | |||||||||||
Paraguay Government International Bonds, 6.65%, 3/4/55(1) | 2,850,000 | 3,076,717 | |||||||||
Peru — 3.4% | |||||||||||
Peru Government Bonds, 7.60%, 8/12/39(1) | PEN | 30,600,000 | 9,910,869 | ||||||||
Peru Government International Bonds, 5.375%, 2/8/35 | $ | 2,700,000 | 2,778,327 | ||||||||
Peru Government International Bonds, 6.20%, 6/30/55 | 1,600,000 | 1,684,000 | |||||||||
Peru Government International Bonds, 8.75%, 11/21/33 | 2,500,000 | 3,157,375 | |||||||||
| 17,530,571 | |||||||||||
Philippines — 2.3% | |||||||||||
Philippines Government International Bonds, 5.50%, 2/4/35 | 3,200,000 | 3,411,052 | |||||||||
Philippines Government International Bonds, 5.18%, 9/5/49 | 5,500,000 | 5,388,877 | |||||||||
ROP Sukuk Trust, 5.05%, 6/6/29 | 2,900,000 | 2,983,733 | |||||||||
| 11,783,662 | |||||||||||
Poland — 3.3% | |||||||||||
Bank Gospodarstwa Krajowego, 5.375%, 5/22/33(1) | 4,825,000 | 5,047,609 | |||||||||
Republic of Poland Government Bonds, 1.75%, 4/25/32 | PLN | 29,500,000 | 6,601,596 | ||||||||
Republic of Poland Government International Bonds, 5.375%, 2/12/35 | $ | 5,400,000 | 5,657,679 | ||||||||
| 17,306,884 | |||||||||||
Romania — 2.6% | |||||||||||
Romania Government International Bonds, 6.00%, 5/25/34(1) | 13,160,000 | 13,258,179 | |||||||||
Saudi Arabia — 1.4% | |||||||||||
Saudi Government International Bonds, 5.75%, 1/16/54(1) | 7,030,000 | 7,200,236 | |||||||||
Senegal — 1.1% | |||||||||||
Senegal Government International Bonds, 7.75%, 6/10/31 | 4,100,000 | 3,233,125 | |||||||||
Senegal Government International Bonds, 6.25%, 5/23/33(1) | 3,400,000 | 2,447,702 | |||||||||
| 5,680,827 | |||||||||||
Serbia — 0.6% | |||||||||||
Serbia International Bonds, 6.50%, 9/26/33(1) | 2,960,000 | 3,238,823 | |||||||||
South Africa — 2.4% | |||||||||||
Republic of South Africa Government Bonds, 8.50%, 1/31/37 | ZAR | 107,108,000 | 5,819,700 | ||||||||
Republic of South Africa Government Bonds, 8.75%, 1/31/44 | ZAR | 89,031,421 | 4,618,593 | ||||||||
Republic of South Africa Government International Bonds, 7.10%, 11/19/36(1) | $ | 1,000,000 | 1,076,612 | ||||||||
Republic of South Africa Government International Bonds, 6.30%, 6/22/48 | 800,000 | 727,392 | |||||||||
| 12,242,297 | |||||||||||
Sri Lanka — 1.6% | |||||||||||
Sri Lanka Government International Bonds, 4.00%, 4/15/28(1) | 1,864,090 | 1,794,187 | |||||||||
Sri Lanka Government International Bonds, VRN, 3.10%, 1/15/30(1) | 3,774,979 | 3,567,355 | |||||||||
Sri Lanka Government International Bonds, VRN, 3.35%, 3/15/33(1) | 3,677,739 | 3,214,200 | |||||||||
Sri Lanka Government International Bonds, VRN, 3.60%, 5/15/36(1) | 482 | 442 | |||||||||
| 8,576,184 | |||||||||||
Suriname — 0.4% | |||||||||||
Suriname Government International Bonds, 8.50%, 11/6/35(1)(5) | 2,000,000 | 2,062,500 | |||||||||
Trinidad and Tobago — 0.3% | |||||||||||
Trinidad & Tobago Government International Bonds, 5.95%, 1/14/31(1) | 1,825,000 | 1,822,263 | |||||||||
Turkey — 4.6% | |||||||||||
Turkiye Government Bonds, 30.00%, 9/12/29 | TRY | 262,000,000 | 5,740,470 | ||||||||
Turkiye Government International Bonds, 5.95%, 1/15/31 | $ | 8,000,000 | 8,010,925 | ||||||||
Turkiye Government International Bonds, 7.625%, 5/15/34 | 8,630,000 | 9,239,271 | |||||||||
Turkiye Government International Bonds, 6.95%, 9/16/35 | 400,000 | 405,677 | |||||||||
Schedule of Investments - Emerging Markets Debt Fund | ||
Principal Amount/Shares | Value | ||||||||||
Turkiye Government International Bonds, 6.00%, 1/14/41 | $ | 750,000 | $ | 669,581 | |||||||
| 24,065,924 | |||||||||||
Ukraine — 1.1% | |||||||||||
Ukraine Government International Bonds, VRN, 0.00%, 2/1/35(1) | 5,461,310 | 2,804,010 | |||||||||
Ukraine Government International Bonds, VRN, 4.50%, 2/1/35 | 762,972 | 425,689 | |||||||||
Ukraine Government International Bonds, VRN, 4.50%, 2/1/35(1) | 124,397 | 69,361 | |||||||||
Ukraine Government International Bonds, VRN, 4.50%, 2/1/36(1) | 3,177,710 | 1,752,434 | |||||||||
Ukraine Government International Bonds, VRN, 4.50%, 2/1/36 | 1,089,960 | 601,040 | |||||||||
| 5,652,534 | |||||||||||
Uruguay — 2.1% | |||||||||||
Oriental Republic of Uruguay, 5.25%, 9/10/60 | 4,700,000 | 4,526,758 | |||||||||
Uruguay Government International Bonds, 5.75%, 10/28/34 | 5,800,000 | 6,240,800 | |||||||||
| 10,767,558 | |||||||||||
Uzbekistan — 0.5% | |||||||||||
Republic of Uzbekistan International Bonds, 6.95%, 5/25/32(1) | 2,200,000 | 2,392,052 | |||||||||
Venezuela — 0.4% | |||||||||||
Venezuela Government International Bonds, 11.95%, 8/5/31(3)(4) | 7,500,000 | 2,205,750 | |||||||||
Zambia — 0.4% | |||||||||||
Zambia Government International Bonds, VRN, 5.75%, 6/30/33(1) | 2,121,180 | 2,043,212 | |||||||||
TOTAL SOVEREIGN GOVERNMENTS AND AGENCIES (Cost $352,579,094) | 382,121,359 | ||||||||||
CORPORATE BONDS — 17.5% | |||||||||||
Brazil — 0.4% | |||||||||||
Braskem Netherlands Finance BV, 4.50%, 1/31/30(1) | 3,255,000 | 1,312,058 | |||||||||
Yinson Bergenia Production BV, 8.50%, 1/31/45(1) | 580,000 | 609,469 | |||||||||
| 1,921,527 | |||||||||||
Chile — 1.0% | |||||||||||
Corp. Nacional del Cobre de Chile, 6.33%, 1/13/35(1) | 3,000,000 | 3,208,200 | |||||||||
Latam Airlines Group SA, 7.875%, 4/15/30(1)(6) | 1,645,000 | 1,703,233 | |||||||||
| 4,911,433 | |||||||||||
Colombia — 0.1% | |||||||||||
Grupo Energia Bogota SA ESP, 5.75%, 10/22/35(1) | 424,000 | 421,679 | |||||||||
El Salvador — 0.7% | |||||||||||
Comision Ejecutiva Hidroelectrica del Rio Lempa, 8.65%, 1/24/33(1) | 3,300,000 | 3,499,650 | |||||||||
Indonesia — 0.8% | |||||||||||
Pertamina Hulu Energi PT, 5.25%, 5/21/30(1) | 4,000,000 | 4,087,758 | |||||||||
Luxembourg — 0.3% | |||||||||||
PRIO Luxembourg Holding SARL, 6.75%, 10/15/30(1) | 1,441,000 | 1,416,484 | |||||||||
Malaysia — 1.5% | |||||||||||
Petronas Capital Ltd., 5.34%, 4/3/35(1) | 4,000,000 | 4,178,642 | |||||||||
Petronas Capital Ltd., 4.55%, 4/21/50 | 4,175,000 | 3,728,442 | |||||||||
| 7,907,084 | |||||||||||
Mexico — 4.4% | |||||||||||
BBVA Mexico SA Institucion De Banca Multiple Grupo Financiero BBVA Mexico, VRN, 5.125%, 1/18/33(1)(6) | 2,270,000 | 2,247,618 | |||||||||
FIEMEX Energia - Banco Actinver SA Institucion de Banca Multiple, 7.25%, 1/31/41(1) | 2,275,195 | 2,410,274 | |||||||||
Grupo Aeromexico SAB de CV, 8.25%, 11/15/29(1) | 3,000,000 | 3,030,000 | |||||||||
Petroleos Mexicanos, 6.84%, 1/23/30 | 10,000,000 | 10,270,890 | |||||||||
Petroleos Mexicanos, 5.95%, 1/28/31 | 5,200,000 | 5,089,765 | |||||||||
| 23,048,547 | |||||||||||
Morocco — 0.8% | |||||||||||
OCP SA, 6.75%, 5/2/34(1) | 3,800,000 | 4,131,263 | |||||||||
Schedule of Investments - Emerging Markets Debt Fund | ||
Principal Amount/Shares | Value | ||||||||||
Multinational — 0.2% | |||||||||||
Digicel International Finance Ltd./Difl U.S. LLC, 8.625%, 8/1/32(1) | $ | 1,200,000 | $ | 1,195,723 | |||||||
Peru — 0.2% | |||||||||||
Petroleos del Peru SA, 5.625%, 6/19/47(1) | 1,500,000 | 1,081,582 | |||||||||
Saudi Arabia — 2.5% | |||||||||||
Gaci First Investment Co., 5.25%, 1/29/30 | 8,680,000 | 8,951,022 | |||||||||
Saudi Arabian Oil Co., 4.25%, 4/16/39 | 4,480,000 | 4,110,803 | |||||||||
| 13,061,825 | |||||||||||
South Africa — 1.8% | |||||||||||
Eskom Holdings, 6.35%, 8/10/28(1) | 9,200,000 | 9,504,979 | |||||||||
United Arab Emirates — 2.3% | |||||||||||
Abu Dhabi Developmental Holding Co. PJSC, 4.50%, 5/6/30(1) | 3,000,000 | 3,044,376 | |||||||||
Abu Dhabi Developmental Holding Co. PJSC, 5.00%, 5/6/35(1) | 3,000,000 | 3,089,309 | |||||||||
Adnoc Murban Rsc Ltd., 5.125%, 9/11/54(1) | 2,600,000 | 2,518,031 | |||||||||
DP World Crescent Ltd., 5.50%, 5/8/35(1) | 3,000,000 | 3,131,450 | |||||||||
| 11,783,166 | |||||||||||
Venezuela — 0.5% | |||||||||||
Petroleos de Venezuela SA, 6.00%, 11/15/26(1)(3)(4) | 12,600,000 | 2,816,100 | |||||||||
TOTAL CORPORATE BONDS (Cost $88,112,060) | 90,788,800 | ||||||||||
U.S. TREASURY SECURITIES — 3.1% | |||||||||||
U.S. Treasury Notes, 1.625%, 10/31/26 | 7,111,000 | 6,965,844 | |||||||||
U.S. Treasury Notes, 1.875%, 2/15/32(7) | 8,881,000 | 7,916,059 | |||||||||
U.S. Treasury Notes, 3.375%, 5/15/33(7) | 1,105,000 | 1,065,591 | |||||||||
TOTAL U.S. TREASURY SECURITIES (Cost $16,438,440) | 15,947,494 | ||||||||||
CONVERTIBLE PREFERRED SECURITIES — 0.1% | |||||||||||
Banks — 0.1% | |||||||||||
Banco Mercantil del Norte SA, 8.375%(1) (Cost $400,000) | 400,000 | 429,049 | |||||||||
SHORT-TERM INVESTMENTS — 4.3% | |||||||||||
Money Market Funds — 0.3% | |||||||||||
State Street Institutional U.S. Government Money Market Fund, Premier Class | 76,084 | 76,084 | |||||||||
State Street Navigator Securities Lending Government Money Market Portfolio(8) | 1,523,610 | 1,523,610 | |||||||||
| 1,599,694 | |||||||||||
Repurchase Agreements — 4.0% | |||||||||||
Fixed Income Clearing Corp., (collateralized by various U.S. Treasury obligations, 4.75%, 8/15/55, valued at $20,763,127), at 4.15%, dated 10/31/25, due 11/3/25 (Delivery value $20,363,040) | 20,356,000 | ||||||||||
TOTAL SHORT-TERM INVESTMENTS (Cost $21,955,694) | 21,955,694 | ||||||||||
TOTAL INVESTMENT SECURITIES — 98.6% (Cost $479,485,288) | 511,242,396 | ||||||||||
OTHER ASSETS AND LIABILITIES — 1.4% | 7,443,724 | ||||||||||
TOTAL NET ASSETS — 100.0% | $ | 518,686,120 | |||||||||
Schedule of Investments - Emerging Markets Debt Fund | ||
Currency Purchased | Currency Sold | Counterparty | Settlement Date | Unrealized Appreciation (Depreciation) | ||||||||||||||||
BRL | 87,346,624 | USD | 16,202,975 | Bank of America NA | 12/17/25 | $ | (133,331) | |||||||||||||
BRL | 95,802,524 | USD | 17,292,469 | Citibank NA | 12/17/25 | 332,854 | ||||||||||||||
BRL | 55,581,086 | USD | 10,271,737 | Citibank NA | 12/17/25 | (46,175) | ||||||||||||||
BRL | 56,507,926 | USD | 10,184,324 | Citibank NA | 12/17/25 | 211,753 | ||||||||||||||
BRL | 27,653,334 | USD | 5,089,162 | Citibank NA | 12/17/25 | (1,624) | ||||||||||||||
BRL | 28,026,275 | USD | 5,153,594 | Citibank NA | 12/17/25 | 2,556 | ||||||||||||||
BRL | 27,874,806 | USD | 5,141,644 | Citibank NA | 12/17/25 | (13,361) | ||||||||||||||
BRL | 14,431,226 | USD | 2,641,654 | Goldman Sachs & Co. LLC | 12/17/25 | 13,338 | ||||||||||||||
BRL | 27,939,951 | USD | 5,136,757 | Goldman Sachs & Co. LLC | 12/17/25 | 3,511 | ||||||||||||||
BRL | 83,650,119 | USD | 15,385,939 | Goldman Sachs & Co. LLC | 12/17/25 | 3,638 | ||||||||||||||
BRL | 22,331,245 | USD | 4,052,858 | Morgan Stanley & Co. LLC | 12/17/25 | 55,546 | ||||||||||||||
BRL | 57,490,344 | USD | 10,549,268 | Morgan Stanley & Co. LLC | 12/17/25 | 27,550 | ||||||||||||||
BRL | 28,803,573 | USD | 5,275,573 | Morgan Stanley & Co. LLC | 12/17/25 | 23,580 | ||||||||||||||
BRL | 27,800,835 | USD | 5,134,705 | Morgan Stanley & Co. LLC | 12/17/25 | (20,031) | ||||||||||||||
BRL | 56,526,307 | USD | 10,166,053 | Morgan Stanley & Co. LLC | 12/17/25 | 233,405 | ||||||||||||||
BRL | 27,645,036 | USD | 5,061,617 | Morgan Stanley & Co. LLC | 12/17/25 | 24,393 | ||||||||||||||
BRL | 55,879,901 | USD | 10,272,985 | Morgan Stanley & Co. LLC | 12/17/25 | 7,551 | ||||||||||||||
BRL | 62,785,594 | USD | 11,530,808 | UBS AG(9) | 12/17/25 | 20,207 | ||||||||||||||
BRL | 28,921,330 | USD | 5,292,044 | UBS AG(9) | 12/17/25 | 28,773 | ||||||||||||||
BRL | 28,476,897 | USD | 5,248,273 | UBS AG(9) | 12/17/25 | (9,220) | ||||||||||||||
USD | 5,555,540 | BRL | 30,124,718 | Bank of America NA | 12/17/25 | 13,329 | ||||||||||||||
USD | 10,186,280 | BRL | 55,428,998 | Bank of America NA | 12/17/25 | (11,301) | ||||||||||||||
USD | 10,107,404 | BRL | 56,507,926 | Bank of America NA | 12/17/25 | (288,674) | ||||||||||||||
USD | 5,106,852 | BRL | 28,267,403 | Bank of America NA | 12/17/25 | (93,659) | ||||||||||||||
USD | 5,111,730 | BRL | 27,852,425 | Bank of America NA | 12/17/25 | (12,436) | ||||||||||||||
USD | 15,397,614 | BRL | 83,819,852 | Bank of America NA | 12/17/25 | (23,190) | ||||||||||||||
USD | 11,890,845 | BRL | 64,419,130 | Citibank NA | 12/17/25 | 39,300 | ||||||||||||||
USD | 11,518,475 | BRL | 62,785,594 | Citibank NA | 12/17/25 | (32,540) | ||||||||||||||
USD | 10,637,292 | BRL | 57,514,135 | Citibank NA | 12/17/25 | 56,097 | ||||||||||||||
USD | 2,718,079 | BRL | 14,824,050 | Citibank NA | 12/17/25 | (9,184) | ||||||||||||||
USD | 5,146,585 | BRL | 27,883,423 | Goldman Sachs & Co. LLC | 12/17/25 | 16,716 | ||||||||||||||
USD | 5,162,361 | BRL | 28,039,259 | Goldman Sachs & Co. LLC | 12/17/25 | 3,822 | ||||||||||||||
USD | 5,159,689 | BRL | 27,981,512 | Goldman Sachs & Co. LLC | 12/17/25 | 11,775 | ||||||||||||||
USD | 9,881,280 | BRL | 53,714,639 | JPMorgan Chase Bank NA | 12/17/25 | (900) | ||||||||||||||
USD | 15,378,355 | BRL | 83,624,418 | Morgan Stanley & Co. LLC | 12/17/25 | (6,494) | ||||||||||||||
USD | 16,151,543 | BRL | 87,322,833 | UBS AG(9) | 12/17/25 | 86,276 | ||||||||||||||
USD | 4,999,828 | BRL | 27,714,499 | UBS AG(9) | 12/17/25 | (98,963) | ||||||||||||||
CLP | 5,008,017,488 | USD | 5,200,380 | Bank of America NA | 12/17/25 | 113,738 | ||||||||||||||
CLP | 4,958,489,230 | USD | 5,209,592 | Bank of America NA | 12/17/25 | 51,970 | ||||||||||||||
CLP | 4,885,419,959 | USD | 5,144,063 | Bank of America NA | 12/17/25 | 39,963 | ||||||||||||||
CLP | 14,208,060,118 | USD | 14,766,223 | Citibank NA | 12/17/25 | 310,261 | ||||||||||||||
CLP | 4,827,013,539 | USD | 5,005,873 | Morgan Stanley & Co. LLC | 12/17/25 | 116,177 | ||||||||||||||
CLP | 9,845,129,586 | USD | 10,410,305 | Morgan Stanley & Co. LLC | 12/17/25 | 36,578 | ||||||||||||||
CLP | 4,916,239,187 | USD | 5,173,246 | Morgan Stanley & Co. LLC | 12/17/25 | 43,483 | ||||||||||||||
CLP | 2,819,906,072 | USD | 2,949,844 | UBS AG(9) | 12/17/25 | 42,421 | ||||||||||||||
CLP | 5,636,992,752 | USD | 5,881,227 | UBS AG(9) | 12/17/25 | 100,310 | ||||||||||||||
CLP | 5,131,124,671 | USD | 5,358,492 | UBS AG(9) | 12/17/25 | 86,257 | ||||||||||||||
CLP | 10,267,474,648 | USD | 10,716,941 | UBS AG(9) | 12/17/25 | 178,102 | ||||||||||||||
CLP | 9,894,054,335 | USD | 10,319,743 | UBS AG(9) | 12/17/25 | 179,056 | ||||||||||||||
CLP | 9,937,056,665 | USD | 10,320,793 | UBS AG(9) | 12/17/25 | 223,636 | ||||||||||||||
Schedule of Investments - Emerging Markets Debt Fund | ||
Currency Purchased | Currency Sold | Counterparty | Settlement Date | Unrealized Appreciation (Depreciation) | ||||||||||||||||
CLP | 9,788,292,954 | USD | 10,449,278 | UBS AG(9) | 12/17/25 | $ | (62,705) | |||||||||||||
CLP | 9,764,641,751 | USD | 10,367,050 | UBS AG(9) | 12/17/25 | (5,575) | ||||||||||||||
USD | 5,905,269 | CLP | 5,636,992,752 | Bank of America NA | 12/17/25 | (76,268) | ||||||||||||||
USD | 5,354,962 | CLP | 5,131,124,671 | Bank of America NA | 12/17/25 | (89,787) | ||||||||||||||
USD | 5,236,701 | CLP | 5,063,575,879 | Bank of America NA | 12/17/25 | (136,370) | ||||||||||||||
USD | 10,386,263 | CLP | 9,937,056,665 | Bank of America NA | 12/17/25 | (158,166) | ||||||||||||||
USD | 5,188,225 | CLP | 4,903,339,279 | Bank of America NA | 12/17/25 | (14,816) | ||||||||||||||
USD | 9,021,611 | CLP | 8,576,414,263 | Goldman Sachs & Co. LLC | 12/17/25 | (79,010) | ||||||||||||||
USD | 5,160,995 | CLP | 4,921,954,595 | Goldman Sachs & Co. LLC | 12/17/25 | (61,799) | ||||||||||||||
USD | 5,150,183 | CLP | 4,861,302,472 | Goldman Sachs & Co. LLC | 12/17/25 | (8,252) | ||||||||||||||
USD | 8,809,114 | CLP | 8,451,551,927 | Morgan Stanley & Co. LLC | 12/17/25 | (159,013) | ||||||||||||||
USD | 5,212,040 | CLP | 5,022,894,821 | Morgan Stanley & Co. LLC | 12/17/25 | (117,864) | ||||||||||||||
USD | 5,201,759 | CLP | 4,991,816,102 | Morgan Stanley & Co. LLC | 12/17/25 | (95,167) | ||||||||||||||
USD | 5,213,792 | CLP | 5,024,218,873 | Morgan Stanley & Co. LLC | 12/17/25 | (117,517) | ||||||||||||||
USD | 10,400,772 | CLP | 9,838,193,781 | Morgan Stanley & Co. LLC | 12/17/25 | (38,752) | ||||||||||||||
USD | 10,361,825 | CLP | 9,845,129,586 | UBS AG(9) | 12/17/25 | (85,058) | ||||||||||||||
USD | 10,247,762 | CLP | 9,894,054,335 | UBS AG(9) | 12/17/25 | (251,036) | ||||||||||||||
USD | 10,379,639 | CLP | 9,788,292,954 | UBS AG(9) | 12/17/25 | (6,934) | ||||||||||||||
COP | 41,922,452,389 | USD | 10,672,695 | Bank of America NA | 12/17/25 | 139,038 | ||||||||||||||
COP | 41,689,609,803 | USD | 10,563,264 | Citibank NA | 12/17/25 | 188,420 | ||||||||||||||
COP | 31,144,280,379 | USD | 7,884,628 | Citibank NA | 12/17/25 | 147,432 | ||||||||||||||
COP | 31,390,134,326 | USD | 7,950,895 | Citibank NA | 12/17/25 | 144,570 | ||||||||||||||
COP | 20,438,415,800 | USD | 5,236,860 | Citibank NA | 12/17/25 | 34,175 | ||||||||||||||
COP | 10,104,227,060 | USD | 2,643,321 | Goldman Sachs & Co. LLC | 12/17/25 | (37,457) | ||||||||||||||
COP | 19,991,188,833 | USD | 5,157,805 | Goldman Sachs & Co. LLC | 12/17/25 | (2,110) | ||||||||||||||
COP | 46,237,699,473 | USD | 11,768,552 | JPMorgan Chase Bank NA | 12/17/25 | 156,076 | ||||||||||||||
COP | 20,939,563,777 | USD | 5,300,082 | Morgan Stanley & Co. LLC | 12/17/25 | 100,198 | ||||||||||||||
COP | 20,595,940,034 | USD | 5,374,204 | Morgan Stanley & Co. LLC | 12/17/25 | (62,545) | ||||||||||||||
USD | 5,119,886 | COP | 20,120,895,334 | Bank of America NA | 12/17/25 | (69,261) | ||||||||||||||
USD | 5,116,457 | COP | 20,189,336,373 | Bank of America NA | 12/17/25 | (90,340) | ||||||||||||||
USD | 5,220,906 | COP | 20,702,616,565 | Bank of America NA | 12/17/25 | (118,265) | ||||||||||||||
USD | 5,233,426 | COP | 20,208,454,119 | Bank of America NA | 12/17/25 | 21,698 | ||||||||||||||
USD | 10,639,217 | COP | 41,922,452,389 | Citibank NA | 12/17/25 | (172,516) | ||||||||||||||
USD | 10,534,410 | COP | 41,689,609,803 | Citibank NA | 12/17/25 | (217,274) | ||||||||||||||
USD | 5,254,538 | COP | 20,844,804,902 | Goldman Sachs & Co. LLC | 12/17/25 | (121,304) | ||||||||||||||
USD | 11,696,538 | COP | 46,237,699,473 | JPMorgan Chase Bank NA | 12/17/25 | (228,091) | ||||||||||||||
USD | 10,568,705 | COP | 41,818,781,394 | JPMorgan Chase Bank NA | 12/17/25 | (216,291) | ||||||||||||||
USD | 5,245,202 | COP | 20,810,392,186 | Morgan Stanley & Co. LLC | 12/17/25 | (121,764) | ||||||||||||||
USD | 2,535,849 | COP | 9,971,592,770 | UBS AG(9) | 12/17/25 | (35,809) | ||||||||||||||
CZK | 243,936,555 | USD | 11,839,707 | Bank of America NA | 12/17/25 | (272,822) | ||||||||||||||
CZK | 218,237,309 | USD | 10,427,901 | Bank of America NA | 12/17/25 | (79,613) | ||||||||||||||
CZK | 224,696,774 | USD | 10,804,875 | Citibank NA | 12/17/25 | (150,295) | ||||||||||||||
CZK | 445,476,190 | USD | 21,539,527 | Citibank NA | 12/17/25 | (416,118) | ||||||||||||||
CZK | 106,257,788 | USD | 5,067,747 | Citibank NA | 12/17/25 | (29,259) | ||||||||||||||
CZK | 109,067,287 | USD | 5,212,004 | Citibank NA | 12/17/25 | (40,296) | ||||||||||||||
CZK | 223,709,085 | USD | 10,735,102 | Goldman Sachs & Co. LLC | 12/17/25 | (127,356) | ||||||||||||||
CZK | 366,405,733 | USD | 17,646,321 | Morgan Stanley & Co. LLC | 12/17/25 | (272,243) | ||||||||||||||
CZK | 122,136,426 | USD | 5,939,904 | UBS AG(9) | 12/17/25 | (148,489) | ||||||||||||||
CZK | 217,122,034 | USD | 10,290,314 | UBS AG(9) | 12/17/25 | 5,090 | ||||||||||||||
USD | 10,361,115 | CZK | 218,237,309 | Bank of America NA | 12/17/25 | 12,827 | ||||||||||||||
USD | 11,933,098 | CZK | 244,366,452 | Citibank NA | 12/17/25 | 345,829 | ||||||||||||||
Schedule of Investments - Emerging Markets Debt Fund | ||
Currency Purchased | Currency Sold | Counterparty | Settlement Date | Unrealized Appreciation (Depreciation) | ||||||||||||||||
USD | 5,958,641 | CZK | 122,039,281 | Citibank NA | 12/17/25 | $ | 171,832 | |||||||||||||
USD | 10,805,265 | CZK | 224,696,774 | Citibank NA | 12/17/25 | 150,684 | ||||||||||||||
USD | 10,730,180 | CZK | 223,167,688 | Citibank NA | 12/17/25 | 148,106 | ||||||||||||||
USD | 5,556,110 | CZK | 114,976,645 | Citibank NA | 12/17/25 | 104,194 | ||||||||||||||
USD | 5,187,287 | CZK | 107,331,857 | Citibank NA | 12/17/25 | 97,868 | ||||||||||||||
USD | 11,850,703 | CZK | 243,936,555 | Goldman Sachs & Co. LLC | 12/17/25 | 283,818 | ||||||||||||||
USD | 5,169,314 | CZK | 107,340,680 | Goldman Sachs & Co. LLC | 12/17/25 | 79,478 | ||||||||||||||
USD | 10,442,959 | CZK | 217,122,034 | Goldman Sachs & Co. LLC | 12/17/25 | 147,555 | ||||||||||||||
USD | 5,387,141 | CZK | 112,054,262 | Morgan Stanley & Co. LLC | 12/17/25 | 73,798 | ||||||||||||||
USD | 5,182,697 | CZK | 107,984,395 | Morgan Stanley & Co. LLC | 12/17/25 | 62,337 | ||||||||||||||
USD | 5,919,734 | CZK | 122,136,426 | UBS AG(9) | 12/17/25 | 128,319 | ||||||||||||||
USD | 5,426,269 | CZK | 111,654,823 | UBS AG(9) | 12/17/25 | 131,866 | ||||||||||||||
USD | 2,040,579 | EUR | 1,737,400 | JPMorgan Chase Bank NA | 12/17/25 | 33,079 | ||||||||||||||
USD | 2,057,733 | EUR | 1,746,500 | Morgan Stanley & Co. LLC | 12/17/25 | 39,718 | ||||||||||||||
USD | 583,120 | EUR | 499,930 | Morgan Stanley & Co. LLC | 12/17/25 | 5,470 | ||||||||||||||
USD | 3,036,034 | EUR | 2,603,900 | Morgan Stanley & Co. LLC | 12/17/25 | 27,326 | ||||||||||||||
HUF | 3,901,135,216 | USD | 11,735,893 | Bank of America NA | 12/17/25 | (172,344) | ||||||||||||||
HUF | 7,168,819,630 | USD | 21,395,840 | Bank of America NA | 12/17/25 | (146,386) | ||||||||||||||
HUF | 1,720,088,896 | USD | 5,156,258 | Bank of America NA | 12/17/25 | (57,657) | ||||||||||||||
HUF | 1,748,631,361 | USD | 5,159,626 | Citibank NA | 12/17/25 | 23,579 | ||||||||||||||
HUF | 1,739,719,521 | USD | 5,157,729 | Citibank NA | 12/17/25 | (940) | ||||||||||||||
HUF | 1,957,660,426 | USD | 5,892,574 | Goldman Sachs & Co. LLC | 12/17/25 | (89,776) | ||||||||||||||
HUF | 3,603,202,654 | USD | 10,677,408 | Goldman Sachs & Co. LLC | 12/17/25 | 3,024 | ||||||||||||||
HUF | 1,685,097,492 | USD | 4,967,989 | Goldman Sachs & Co. LLC | 12/17/25 | 26,893 | ||||||||||||||
HUF | 1,727,806,899 | USD | 5,133,749 | Goldman Sachs & Co. LLC | 12/17/25 | (12,271) | ||||||||||||||
HUF | 1,961,201,536 | USD | 5,918,393 | JPMorgan Chase Bank NA | 12/17/25 | (105,098) | ||||||||||||||
HUF | 2,319,922,603 | USD | 6,879,507 | UBS AG(9) | 12/17/25 | (2,909) | ||||||||||||||
HUF | 3,624,860,793 | USD | 10,766,676 | UBS AG(9) | 12/17/25 | (22,046) | ||||||||||||||
HUF | 3,515,542,268 | USD | 10,352,198 | UBS AG(9) | 12/17/25 | 68,395 | ||||||||||||||
HUF | 1,698,039,222 | USD | 5,045,525 | UBS AG(9) | 12/17/25 | (12,283) | ||||||||||||||
USD | 14,906,328 | HUF | 4,935,758,010 | Bank of America NA | 12/17/25 | 276,003 | ||||||||||||||
USD | 2,547,667 | HUF | 861,160,634 | Bank of America NA | 12/17/25 | (4,942) | ||||||||||||||
USD | 5,867,443 | HUF | 1,961,036,621 | Citibank NA | 12/17/25 | 54,637 | ||||||||||||||
USD | 10,745,031 | HUF | 3,612,314,008 | Citibank NA | 12/17/25 | 37,592 | ||||||||||||||
USD | 10,746,543 | HUF | 3,619,778,551 | Citibank NA | 12/17/25 | 16,978 | ||||||||||||||
USD | 10,668,483 | HUF | 3,595,145,568 | Goldman Sachs & Co. LLC | 12/17/25 | 11,933 | ||||||||||||||
USD | 5,145,792 | HUF | 1,717,678,937 | Goldman Sachs & Co. LLC | 12/17/25 | 54,334 | ||||||||||||||
USD | 10,308,437 | HUF | 3,518,470,826 | Goldman Sachs & Co. LLC | 12/17/25 | (120,837) | ||||||||||||||
USD | 10,399,394 | HUF | 3,486,958,340 | Goldman Sachs & Co. LLC | 12/17/25 | 63,528 | ||||||||||||||
USD | 5,008,421 | HUF | 1,685,166,287 | Goldman Sachs & Co. LLC | 12/17/25 | 13,336 | ||||||||||||||
USD | 5,905,949 | HUF | 1,961,201,536 | Morgan Stanley & Co. LLC | 12/17/25 | 92,654 | ||||||||||||||
USD | 10,687,390 | HUF | 3,583,395,319 | Morgan Stanley & Co. LLC | 12/17/25 | 65,670 | ||||||||||||||
USD | 5,130,124 | HUF | 1,720,088,896 | Morgan Stanley & Co. LLC | 12/17/25 | 31,523 | ||||||||||||||
USD | 2,563,232 | HUF | 865,725,608 | Morgan Stanley & Co. LLC | 12/17/25 | (2,908) | ||||||||||||||
USD | 5,167,180 | HUF | 1,736,913,433 | Morgan Stanley & Co. LLC | 12/17/25 | 18,709 | ||||||||||||||
USD | 5,161,415 | HUF | 1,735,365,320 | Morgan Stanley & Co. LLC | 12/17/25 | 17,533 | ||||||||||||||
USD | 11,754,865 | HUF | 3,910,126,410 | UBS AG(9) | 12/17/25 | 164,665 | ||||||||||||||
IDR | 339,738,290,975 | USD | 20,282,883 | Citibank NA | 12/17/25 | 130,401 | ||||||||||||||
IDR | 177,226,269,530 | USD | 10,618,710 | Goldman Sachs & Co. LLC | 12/17/25 | 29,987 | ||||||||||||||
IDR | 192,163,282,493 | USD | 11,656,454 | UBS AG(9) | 12/17/25 | (110,261) | ||||||||||||||
IDR | 96,052,361,951 | USD | 5,829,400 | UBS AG(9) | 12/17/25 | (58,063) | ||||||||||||||
Schedule of Investments - Emerging Markets Debt Fund | ||
Currency Purchased | Currency Sold | Counterparty | Settlement Date | Unrealized Appreciation (Depreciation) | ||||||||||||||||
IDR | 87,198,835,246 | USD | 5,242,076 | UBS AG(9) | 12/17/25 | $ | (2,706) | |||||||||||||
IDR | 178,242,061,426 | USD | 10,693,482 | UBS AG(9) | 12/17/25 | 16,249 | ||||||||||||||
IDR | 178,242,061,426 | USD | 10,699,355 | UBS AG(9) | 12/17/25 | 10,376 | ||||||||||||||
IDR | 176,738,514,463 | USD | 10,630,613 | UBS AG(9) | 12/17/25 | (11,223) | ||||||||||||||
IDR | 172,662,689,661 | USD | 10,364,871 | UBS AG(9) | 12/17/25 | 9,622 | ||||||||||||||
USD | 11,962,009 | IDR | 197,050,176,164 | Goldman Sachs & Co. LLC | 12/17/25 | 122,186 | ||||||||||||||
USD | 31,372,910 | IDR | 518,102,594,501 | UBS AG(9) | 12/17/25 | 242,550 | ||||||||||||||
USD | 10,637,799 | IDR | 178,242,061,426 | UBS AG(9) | 12/17/25 | (71,933) | ||||||||||||||
USD | 10,667,460 | IDR | 178,242,061,426 | UBS AG(9) | 12/17/25 | (42,271) | ||||||||||||||
USD | 10,608,978 | IDR | 177,226,269,530 | UBS AG(9) | 12/17/25 | (39,719) | ||||||||||||||
USD | 10,606,466 | IDR | 176,738,514,463 | UBS AG(9) | 12/17/25 | (12,924) | ||||||||||||||
USD | 10,394,329 | IDR | 172,662,689,661 | UBS AG(9) | 12/17/25 | 19,836 | ||||||||||||||
INR | 468,765,483 | USD | 5,266,200 | Morgan Stanley & Co. LLC | 12/17/25 | 1,892 | ||||||||||||||
INR | 783,577,700 | USD | 8,866,749 | UBS AG(9) | 12/17/25 | (60,728) | ||||||||||||||
INR | 263,186,329 | USD | 2,981,241 | UBS AG(9) | 12/17/25 | (23,494) | ||||||||||||||
INR | 428,407,290 | USD | 4,813,495 | UBS AG(9) | 12/17/25 | 1,042 | ||||||||||||||
INR | 446,434,277 | USD | 5,061,275 | UBS AG(9) | 12/17/25 | (44,146) | ||||||||||||||
USD | 5,144,436 | INR | 455,684,870 | Citibank NA | 12/17/25 | 23,347 | ||||||||||||||
USD | 1,071,415 | INR | 95,074,022 | UBS AG(9) | 12/17/25 | 2,952 | ||||||||||||||
KRW | 14,995,472,657 | USD | 10,737,743 | Bank of America NA | 12/17/25 | (225,547) | ||||||||||||||
KRW | 20,425,206,727 | USD | 14,795,299 | Citibank NA | 12/17/25 | (476,727) | ||||||||||||||
KRW | 14,786,076,728 | USD | 10,388,150 | Citibank NA | 12/17/25 | (22,746) | ||||||||||||||
KRW | 16,397,838,313 | USD | 11,862,812 | UBS AG(9) | 12/17/25 | (367,524) | ||||||||||||||
KRW | 14,995,472,657 | USD | 10,738,918 | UBS AG(9) | 12/17/25 | (226,722) | ||||||||||||||
KRW | 14,935,228,349 | USD | 10,489,147 | UBS AG(9) | 12/17/25 | (19,185) | ||||||||||||||
USD | 7,397,358 | KRW | 10,173,586,425 | Citibank NA | 12/17/25 | 265,424 | ||||||||||||||
USD | 7,454,098 | KRW | 10,251,620,302 | Citibank NA | 12/17/25 | 267,459 | ||||||||||||||
USD | 10,722,776 | KRW | 14,995,472,657 | Goldman Sachs & Co. LLC | 12/17/25 | 210,580 | ||||||||||||||
USD | 10,717,052 | KRW | 14,995,472,657 | Goldman Sachs & Co. LLC | 12/17/25 | 204,857 | ||||||||||||||
USD | 10,427,291 | KRW | 14,857,960,606 | Goldman Sachs & Co. LLC | 12/17/25 | 11,495 | ||||||||||||||
USD | 11,696,433 | KRW | 16,397,838,313 | UBS AG(9) | 12/17/25 | 201,145 | ||||||||||||||
USD | 10,664,197 | KRW | 14,935,228,349 | UBS AG(9) | 12/17/25 | 194,234 | ||||||||||||||
USD | 10,342,291 | KRW | 14,786,076,728 | UBS AG(9) | 12/17/25 | (23,113) | ||||||||||||||
MXN | 54,830,687 | USD | 2,941,802 | Bank of America NA | 12/17/25 | (3,771) | ||||||||||||||
MXN | 108,858,449 | USD | 5,862,601 | Goldman Sachs & Co. LLC | 12/17/25 | (29,563) | ||||||||||||||
MXN | 99,314,558 | USD | 5,369,670 | Goldman Sachs & Co. LLC | 12/17/25 | (48,029) | ||||||||||||||
MXN | 99,468,409 | USD | 5,339,676 | Goldman Sachs & Co. LLC | 12/17/25 | (9,790) | ||||||||||||||
MXN | 191,410,575 | USD | 10,328,392 | Goldman Sachs & Co. LLC | 12/17/25 | (71,904) | ||||||||||||||
MXN | 94,701,208 | USD | 5,138,569 | Goldman Sachs & Co. LLC | 12/17/25 | (64,128) | ||||||||||||||
MXN | 94,736,551 | USD | 5,083,945 | Goldman Sachs & Co. LLC | 12/17/25 | (7,610) | ||||||||||||||
MXN | 94,834,412 | USD | 5,123,265 | Goldman Sachs & Co. LLC | 12/17/25 | (41,686) | ||||||||||||||
MXN | 94,319,843 | USD | 5,109,862 | Goldman Sachs & Co. LLC | 12/17/25 | (55,856) | ||||||||||||||
MXN | 191,467,883 | USD | 10,337,138 | Goldman Sachs & Co. LLC | 12/17/25 | (77,580) | ||||||||||||||
MXN | 192,469,046 | USD | 10,339,923 | Goldman Sachs & Co. LLC | 12/17/25 | (26,719) | ||||||||||||||
MXN | 49,152,860 | USD | 2,653,731 | JPMorgan Chase Bank NA | 12/17/25 | (19,939) | ||||||||||||||
MXN | 68,760,411 | USD | 3,713,493 | JPMorgan Chase Bank NA | 12/17/25 | (29,055) | ||||||||||||||
MXN | 55,511,498 | USD | 2,976,823 | Morgan Stanley & Co. LLC | 12/17/25 | (2,311) | ||||||||||||||
MXN | 109,874,847 | USD | 5,883,174 | Morgan Stanley & Co. LLC | 12/17/25 | 4,327 | ||||||||||||||
MXN | 218,054,743 | USD | 11,802,050 | Morgan Stanley & Co. LLC | 12/17/25 | (117,870) | ||||||||||||||
MXN | 99,165,152 | USD | 5,321,707 | Morgan Stanley & Co. LLC | 12/17/25 | (8,071) | ||||||||||||||
MXN | 149,082,895 | USD | 8,010,365 | Morgan Stanley & Co. LLC | 12/17/25 | (21,951) | ||||||||||||||
Schedule of Investments - Emerging Markets Debt Fund | ||
Currency Purchased | Currency Sold | Counterparty | Settlement Date | Unrealized Appreciation (Depreciation) | ||||||||||||||||
MXN | 98,784,672 | USD | 5,329,876 | Morgan Stanley & Co. LLC | 12/17/25 | $ | (36,627) | |||||||||||||
MXN | 95,563,343 | USD | 5,161,123 | Morgan Stanley & Co. LLC | 12/17/25 | (40,485) | ||||||||||||||
MXN | 95,762,449 | USD | 5,146,194 | Morgan Stanley & Co. LLC | 12/17/25 | (14,887) | ||||||||||||||
MXN | 191,142,298 | USD | 10,257,528 | Morgan Stanley & Co. LLC | 12/17/25 | (15,415) | ||||||||||||||
MXN | 191,303,210 | USD | 10,321,419 | Morgan Stanley & Co. LLC | 12/17/25 | (70,684) | ||||||||||||||
MXN | 191,467,883 | USD | 10,319,385 | Morgan Stanley & Co. LLC | 12/17/25 | (59,826) | ||||||||||||||
MXN | 192,079,301 | USD | 10,291,449 | Morgan Stanley & Co. LLC | 12/17/25 | 872 | ||||||||||||||
USD | 5,889,528 | MXN | 108,674,253 | Bank of America NA | 12/17/25 | 66,359 | ||||||||||||||
USD | 10,264,785 | MXN | 192,110,466 | Bank of America NA | 12/17/25 | (29,205) | ||||||||||||||
USD | 10,325,797 | MXN | 191,935,128 | Bank of America NA | 12/17/25 | 41,202 | ||||||||||||||
USD | 11,997,004 | MXN | 221,846,826 | Citibank NA | 12/17/25 | 109,629 | ||||||||||||||
USD | 5,894,880 | MXN | 108,991,310 | Citibank NA | 12/17/25 | 54,722 | ||||||||||||||
USD | 5,606,240 | MXN | 104,128,117 | Citibank NA | 12/17/25 | 26,670 | ||||||||||||||
USD | 5,101,164 | MXN | 94,630,595 | Citibank NA | 12/17/25 | 30,507 | ||||||||||||||
USD | 5,150,202 | MXN | 95,252,545 | Citibank NA | 12/17/25 | 46,218 | ||||||||||||||
USD | 10,267,800 | MXN | 190,371,970 | Citibank NA | 12/17/25 | 66,965 | ||||||||||||||
USD | 3,958,419 | MXN | 74,372,463 | Goldman Sachs & Co. LLC | 12/17/25 | (26,733) | ||||||||||||||
USD | 11,749,799 | MXN | 217,997,270 | Goldman Sachs & Co. LLC | 12/17/25 | 68,698 | ||||||||||||||
USD | 5,382,714 | MXN | 99,901,184 | Goldman Sachs & Co. LLC | 12/17/25 | 29,638 | ||||||||||||||
USD | 2,747,531 | MXN | 51,046,999 | Goldman Sachs & Co. LLC | 12/17/25 | 12,243 | ||||||||||||||
USD | 5,154,849 | MXN | 95,162,261 | Goldman Sachs & Co. LLC | 12/17/25 | 55,703 | ||||||||||||||
USD | 10,252,606 | MXN | 191,213,164 | Goldman Sachs & Co. LLC | 12/17/25 | 6,696 | ||||||||||||||
USD | 5,971,745 | MXN | 111,593,779 | Morgan Stanley & Co. LLC | 12/17/25 | (7,863) | ||||||||||||||
USD | 5,916,500 | MXN | 109,680,197 | Morgan Stanley & Co. LLC | 12/17/25 | 39,429 | ||||||||||||||
USD | 5,356,337 | MXN | 99,577,914 | Morgan Stanley & Co. LLC | 12/17/25 | 20,584 | ||||||||||||||
USD | 5,170,958 | MXN | 95,847,233 | Morgan Stanley & Co. LLC | 12/17/25 | 35,109 | ||||||||||||||
USD | 10,297,757 | MXN | 191,394,842 | Morgan Stanley & Co. LLC | 12/17/25 | 42,113 | ||||||||||||||
USD | 5,156,810 | MXN | 95,480,155 | Morgan Stanley & Co. LLC | 12/17/25 | 40,629 | ||||||||||||||
USD | 5,114,547 | MXN | 95,220,800 | Morgan Stanley & Co. LLC | 12/17/25 | 12,264 | ||||||||||||||
USD | 5,101,496 | MXN | 94,712,623 | Morgan Stanley & Co. LLC | 12/17/25 | 26,443 | ||||||||||||||
USD | 5,236,104 | MXN | 97,622,118 | Morgan Stanley & Co. LLC | 12/17/25 | 5,149 | ||||||||||||||
USD | 10,308,940 | MXN | 191,467,883 | UBS AG(9) | 12/17/25 | 49,381 | ||||||||||||||
USD | 3,095,881 | MYR | 12,981,027 | Goldman Sachs & Co. LLC | 12/17/25 | (7,123) | ||||||||||||||
PEN | 34,945,591 | USD | 10,346,279 | Bank of America NA | 12/17/25 | 20,473 | ||||||||||||||
PEN | 17,305,644 | USD | 5,120,986 | UBS AG(9) | 12/17/25 | 12,804 | ||||||||||||||
USD | 10,261,660 | PEN | 34,874,250 | Bank of America NA | 12/17/25 | (83,928) | ||||||||||||||
USD | 9,602,011 | PEN | 33,627,202 | Citibank NA | 12/17/25 | (373,635) | ||||||||||||||
USD | 5,179,820 | PEN | 17,555,447 | Citibank NA | 12/17/25 | (28,074) | ||||||||||||||
USD | 5,189,167 | PEN | 17,672,595 | Goldman Sachs & Co. LLC | 12/17/25 | (53,481) | ||||||||||||||
USD | 5,157,250 | PEN | 17,583,537 | UBS AG(9) | 12/17/25 | (58,977) | ||||||||||||||
PHP | 617,506,296 | USD | 10,589,150 | Goldman Sachs & Co. LLC | 12/17/25 | (76,448) | ||||||||||||||
PHP | 53,490,787 | USD | 937,862 | JPMorgan Chase Bank NA | 12/17/25 | (27,211) | ||||||||||||||
USD | 11,733,631 | PHP | 670,997,083 | UBS AG(9) | 12/17/25 | 310,278 | ||||||||||||||
PLN | 38,580,877 | USD | 10,640,285 | Bank of America NA | 12/17/25 | (197,269) | ||||||||||||||
PLN | 53,335,967 | USD | 14,655,214 | Citibank NA | 12/17/25 | (218,311) | ||||||||||||||
PLN | 38,768,050 | USD | 10,698,743 | Citibank NA | 12/17/25 | (205,062) | ||||||||||||||
PLN | 37,660,478 | USD | 10,191,338 | Citibank NA | 12/17/25 | 2,547 | ||||||||||||||
PLN | 7,005,360 | USD | 1,948,235 | Goldman Sachs & Co. LLC | 12/17/25 | (52,034) | ||||||||||||||
PLN | 38,193,952 | USD | 10,382,814 | Goldman Sachs & Co. LLC | 12/17/25 | (44,529) | ||||||||||||||
PLN | 37,974,492 | USD | 10,399,781 | Goldman Sachs & Co. LLC | 12/17/25 | (120,900) | ||||||||||||||
PLN | 18,897,498 | USD | 5,143,391 | Morgan Stanley & Co. LLC | 12/17/25 | (28,243) | ||||||||||||||
Schedule of Investments - Emerging Markets Debt Fund | ||
Currency Purchased | Currency Sold | Counterparty | Settlement Date | Unrealized Appreciation (Depreciation) | ||||||||||||||||
PLN | 37,945,896 | USD | 10,478,795 | UBS AG(9) | 12/17/25 | $ | (207,654) | |||||||||||||
USD | 5,177,231 | PLN | 19,014,172 | Bank of America NA | 12/17/25 | 30,502 | ||||||||||||||
USD | 10,342,657 | PLN | 38,232,129 | Bank of America NA | 12/17/25 | (5,961) | ||||||||||||||
USD | 8,904,200 | PLN | 31,987,405 | Citibank NA | 12/17/25 | 245,895 | ||||||||||||||
USD | 5,251,120 | PLN | 19,102,394 | Citibank NA | 12/17/25 | 80,512 | ||||||||||||||
USD | 10,441,583 | PLN | 38,043,342 | Citibank NA | 12/17/25 | 144,065 | ||||||||||||||
USD | 10,329,131 | PLN | 37,672,085 | Citibank NA | 12/17/25 | 132,104 | ||||||||||||||
USD | 10,678,426 | PLN | 38,773,618 | Goldman Sachs & Co. LLC | 12/17/25 | 183,239 | ||||||||||||||
USD | 10,604,617 | PLN | 38,580,877 | Goldman Sachs & Co. LLC | 12/17/25 | 161,600 | ||||||||||||||
USD | 8,613,393 | PLN | 31,349,685 | UBS AG(9) | 12/17/25 | 127,705 | ||||||||||||||
USD | 5,942,264 | PLN | 21,342,088 | UBS AG(9) | 12/17/25 | 165,418 | ||||||||||||||
USD | 5,177,921 | PLN | 18,833,315 | UBS AG(9) | 12/17/25 | 80,146 | ||||||||||||||
THB | 344,292,456 | USD | 10,670,276 | Morgan Stanley & Co. LLC | 12/17/25 | 14,101 | ||||||||||||||
THB | 28,529,488 | USD | 902,523 | UBS AG(9) | 12/17/25 | (17,172) | ||||||||||||||
THB | 334,904,751 | USD | 10,375,828 | UBS AG(9) | 12/17/25 | 17,222 | ||||||||||||||
USD | 11,816,373 | THB | 372,821,944 | Citibank NA | 12/17/25 | 246,645 | ||||||||||||||
USD | 10,343,143 | THB | 334,904,751 | UBS AG(9) | 12/17/25 | (49,907) | ||||||||||||||
USD | 10,358,824 | THB | 335,314,086 | UBS AG(9) | 12/17/25 | (46,929) | ||||||||||||||
TWD | 356,981,484 | USD | 11,940,698 | Morgan Stanley & Co. LLC | 12/17/25 | (331,432) | ||||||||||||||
TWD | 323,898,247 | USD | 10,589,184 | UBS AG(9) | 12/17/25 | (55,806) | ||||||||||||||
USD | 11,901,366 | TWD | 356,981,484 | Goldman Sachs & Co. LLC | 12/17/25 | 292,100 | ||||||||||||||
USD | 10,320,149 | TWD | 316,353,833 | Goldman Sachs & Co. LLC | 12/17/25 | 32,120 | ||||||||||||||
USD | 10,689,686 | TWD | 323,898,247 | UBS AG(9) | 12/17/25 | 156,308 | ||||||||||||||
USD | 5,912,846 | ZAR | 103,268,074 | Bank of America NA | 12/17/25 | (25,913) | ||||||||||||||
USD | 10,729,056 | ZAR | 187,872,881 | Bank of America NA | 12/17/25 | (75,172) | ||||||||||||||
USD | 5,173,547 | ZAR | 89,629,484 | Bank of America NA | 12/17/25 | 19,118 | ||||||||||||||
USD | 5,161,426 | ZAR | 89,265,548 | Bank of America NA | 12/17/25 | 27,927 | ||||||||||||||
USD | 10,397,467 | ZAR | 180,647,062 | Bank of America NA | 12/17/25 | 8,782 | ||||||||||||||
USD | 5,161,472 | ZAR | 89,171,356 | Bank of America NA | 12/17/25 | 33,389 | ||||||||||||||
USD | 12,020,850 | ZAR | 210,267,673 | Citibank NA | 12/17/25 | (71,262) | ||||||||||||||
USD | 10,460,176 | ZAR | 179,543,143 | Citibank NA | 12/17/25 | 134,976 | ||||||||||||||
USD | 10,270,121 | ZAR | 177,454,571 | Citibank NA | 12/17/25 | 65,031 | ||||||||||||||
USD | 5,880,513 | ZAR | 102,395,403 | Goldman Sachs & Co. LLC | 12/17/25 | (8,060) | ||||||||||||||
USD | 10,227,411 | ZAR | 179,504,605 | Goldman Sachs & Co. LLC | 12/17/25 | (95,573) | ||||||||||||||
USD | 5,205,697 | ZAR | 90,736,874 | Goldman Sachs & Co. LLC | 12/17/25 | (12,416) | ||||||||||||||
USD | 2,617,903 | ZAR | 45,829,123 | Morgan Stanley & Co. LLC | 12/17/25 | (17,646) | ||||||||||||||
USD | 5,881,431 | ZAR | 102,894,626 | Morgan Stanley & Co. LLC | 12/17/25 | (35,851) | ||||||||||||||
USD | 5,489,727 | ZAR | 95,537,661 | Morgan Stanley & Co. LLC | 12/17/25 | (4,470) | ||||||||||||||
USD | 10,766,887 | ZAR | 187,028,924 | Morgan Stanley & Co. LLC | 12/17/25 | 11,193 | ||||||||||||||
USD | 5,175,179 | ZAR | 89,502,877 | Morgan Stanley & Co. LLC | 12/17/25 | 28,031 | ||||||||||||||
USD | 8,849,313 | ZAR | 154,756,599 | UBS AG(9) | 12/17/25 | (50,457) | ||||||||||||||
USD | 11,809,354 | ZAR | 206,279,862 | UBS AG(9) | 12/17/25 | (53,426) | ||||||||||||||
USD | 10,379,904 | ZAR | 178,342,712 | UBS AG(9) | 12/17/25 | 123,739 | ||||||||||||||
ZAR | 205,670,241 | USD | 11,757,105 | Bank of America NA | 12/17/25 | 70,617 | ||||||||||||||
ZAR | 186,560,546 | USD | 10,690,600 | Bank of America NA | 12/17/25 | 38,158 | ||||||||||||||
ZAR | 89,629,484 | USD | 5,177,384 | Bank of America NA | 12/17/25 | (22,955) | ||||||||||||||
ZAR | 178,993,100 | USD | 10,349,730 | Bank of America NA | 12/17/25 | (56,162) | ||||||||||||||
ZAR | 132,754,823 | USD | 7,605,264 | Bank of America NA | 12/17/25 | 29,224 | ||||||||||||||
ZAR | 89,171,356 | USD | 5,168,102 | Bank of America NA | 12/17/25 | (40,019) | ||||||||||||||
ZAR | 178,342,712 | USD | 10,337,719 | Bank of America NA | 12/17/25 | (81,554) | ||||||||||||||
ZAR | 134,308,281 | USD | 7,674,958 | Citibank NA | 12/17/25 | 48,867 | ||||||||||||||
Schedule of Investments - Emerging Markets Debt Fund | ||
Currency Purchased | Currency Sold | Counterparty | Settlement Date | Unrealized Appreciation (Depreciation) | ||||||||||||||||
ZAR | 177,913,913 | USD | 10,232,177 | Citibank NA | 12/17/25 | $ | (671) | |||||||||||||
ZAR | 102,395,403 | USD | 5,870,729 | Goldman Sachs & Co. LLC | 12/17/25 | 17,844 | ||||||||||||||
ZAR | 188,677,143 | USD | 10,760,336 | Goldman Sachs & Co. LLC | 12/17/25 | 90,144 | ||||||||||||||
ZAR | 231,106,735 | USD | 13,111,636 | Morgan Stanley & Co. LLC | 12/17/25 | 178,892 | ||||||||||||||
ZAR | 46,545,230 | USD | 2,663,639 | Morgan Stanley & Co. LLC | 12/17/25 | 13,093 | ||||||||||||||
ZAR | 102,484,941 | USD | 5,899,298 | Morgan Stanley & Co. LLC | 12/17/25 | (5,576) | ||||||||||||||
ZAR | 94,115,084 | USD | 5,422,202 | Morgan Stanley & Co. LLC | 12/17/25 | (9,814) | ||||||||||||||
ZAR | 89,173,149 | USD | 5,127,239 | Morgan Stanley & Co. LLC | 12/17/25 | 947 | ||||||||||||||
ZAR | 89,778,076 | USD | 5,152,087 | Morgan Stanley & Co. LLC | 12/17/25 | 10,887 | ||||||||||||||
ZAR | 52,074,363 | USD | 2,969,476 | UBS AG(9) | 12/17/25 | 25,226 | ||||||||||||||
ZAR | 7,257,914 | USD | 417,733 | UBS AG(9) | 12/17/25 | (344) | ||||||||||||||
ZAR | 178,342,712 | USD | 10,402,755 | UBS AG(9) | 12/17/25 | (146,589) | ||||||||||||||
| $ | 1,023,069 | |||||||||||||||||||
| FUTURES CONTRACTS PURCHASED | ||||||||||||||
| Reference Entity | Contracts | Expiration Date | Notional Amount | Unrealized Appreciation (Depreciation)^ | ||||||||||
| U.S. Treasury 2-Year Notes | 273 | December 2025 | $ | 56,850,117 | $ | (47,454) | ||||||||
| U.S. Treasury Ultra Bonds | 158 | December 2025 | 19,162,438 | 583,177 | ||||||||||
| $ | 76,012,555 | $ | 535,723 | |||||||||||
| FUTURES CONTRACTS SOLD | ||||||||||||||
| Reference Entity | Contracts | Expiration Date | Notional Amount | Unrealized Appreciation (Depreciation)^ | ||||||||||
| U.S. Treasury 10-Year Ultra Notes | 34 | December 2025 | $ | 3,926,469 | $ | 37,652 | ||||||||
| CENTRALLY CLEARED CREDIT DEFAULT SWAP AGREEMENTS | |||||||||||||||||||||||
| Reference Entity | Type | Fixed Rate Received (Paid) Quarterly | Termination Date | Notional Amount | Premiums Paid (Received) | Unrealized Appreciation (Depreciation) | Value^ | ||||||||||||||||
Chile Government International Bonds | Buy | (1.00)% | 6/20/29 | $ | 5,800,000 | $ | (81,071) | $ | (48,029) | $ | (129,100) | ||||||||||||
Markit CDX Emerging Markets Index Series 43 | Buy | (1.00)% | 6/20/30 | $ | 16,550,000 | 635,467 | (491,483) | 143,984 | |||||||||||||||
Mexico Government International Bonds | Buy | (1.00)% | 6/20/29 | $ | 15,960,000 | (28,831) | (181,160) | (209,991) | |||||||||||||||
| $ | 525,565 | $ | (720,672) | $ | (195,107) | ||||||||||||||||||
| INTEREST RATE SWAP AGREEMENTS | |||||||||||||||||||||||
| Counterparty | Floating Rate Index | Pay/Receive Floating Rate Index at Termination | Fixed Rate | Termination Date | Notional Amount | Value^ | |||||||||||||||||
| Bank of America NA | BZDIOVRA | Pay | 14.20 | % | 1/2/31 | BRL | 16,000,000 | $ | 163,653 | ||||||||||||||
| Bank of America NA | BZDIOVRA | Pay | 14.27 | % | 1/2/31 | BRL | 10,000,000 | 102,876 | |||||||||||||||
| Goldman Sachs & Co. LLC | BZDIOVRA | Pay | 15.00 | % | 1/2/29 | BRL | 55,000,000 | 755,965 | |||||||||||||||
| Goldman Sachs & Co. LLC | BZDIOVRA | Pay | 14.18 | % | 1/2/29 | BRL | 60,000,000 | 372,430 | |||||||||||||||
| Goldman Sachs & Co. LLC | BZDIOVRA | Pay | 14.01 | % | 1/2/31 | BRL | 20,000,000 | 146,818 | |||||||||||||||
| $ | 1,541,742 | ||||||||||||||||||||||
Schedule of Investments - Emerging Markets Debt Fund | ||
| NOTES TO SCHEDULE OF INVESTMENTS | ||||||||
| BRL | – | Brazilian Real | ||||||
| BZDIOVRA | – | Brazil Interbank Deposit Rate | ||||||
| CDX | – | Credit Derivatives Indexes | ||||||
| CLP | – | Chilean Peso | ||||||
| COP | – | Colombian Peso | ||||||
| CZK | – | Czech Koruna | ||||||
| EUR | – | Euro | ||||||
| HUF | – | Hungarian Forint | ||||||
| IDR | – | Indonesian Rupiah | ||||||
| INR | – | Indian Rupee | ||||||
| KRW | – | South Korean Won | ||||||
| MXN | – | Mexican Peso | ||||||
| MYR | – | Malaysian Ringgit | ||||||
| PEN | – | Peruvian Sol | ||||||
| PHP | – | Philippine Peso | ||||||
| PLN | – | Polish Zloty | ||||||
| THB | – | Thai Baht | ||||||
| TRY | – | Turkish Lira | ||||||
| TWD | – | Taiwanese Dollar | ||||||
| USD | – | United States Dollar | ||||||
| VRN | – | Variable Rate Note. The rate adjusts periodically based upon the terms set forth in the security’s offering documents. The rate shown is effective at the period end and the reference rate and spread, if any, is indicated. The security's effective maturity date may be shorter than the final maturity date shown. | ||||||
| ZAR | – | South African Rand | ||||||
Schedule of Investments - Emerging Markets Debt Fund | ||
| Level 1 | Level 2 | Level 3 | |||||||||
| Assets | |||||||||||
| Investment Securities | |||||||||||
| Sovereign Governments and Agencies | — | $ | 382,121,359 | — | |||||||
| Corporate Bonds | — | 90,788,800 | — | ||||||||
| U.S. Treasury Securities | — | 15,947,494 | — | ||||||||
| Convertible Preferred Securities | — | 429,049 | — | ||||||||
| Short-Term Investments | $ | 1,599,694 | 20,356,000 | — | |||||||
| $ | 1,599,694 | $ | 509,642,702 | — | |||||||
| Other Financial Instruments | |||||||||||
| Futures Contracts | $ | 620,829 | — | — | |||||||
| Swap Agreements | — | $ | 1,685,726 | — | |||||||
| Forward Foreign Currency Exchange Contracts | — | 13,048,762 | — | ||||||||
| $ | 620,829 | $ | 14,734,488 | — | |||||||
| Liabilities | |||||||||||
| Other Financial Instruments | |||||||||||
| Futures Contracts | $ | 47,454 | — | — | |||||||
| Swap Agreements | — | $ | 339,091 | — | |||||||
| Forward Foreign Currency Exchange Contracts | — | 12,025,693 | — | ||||||||
| $ | 47,454 | $ | 12,364,784 | — | |||||||
| Type of Risk Exposure | ||||||||||||||
| Credit | Foreign Currency | Interest Rate | Total | |||||||||||
| Asset Derivatives: | ||||||||||||||
| Unrealized appreciation on forward foreign currency exchange contracts | — | $ | 13,048,762 | — | $ | 13,048,762 | ||||||||
| Swap agreements | — | — | $ | 1,541,742 | 1,541,742 | |||||||||
| $ | 14,590,504 | |||||||||||||
| Liability Derivatives: | ||||||||||||||
| Payable for variation margin on futures contracts* | — | — | $ | 76,875 | $ | 76,875 | ||||||||
Payable for variation margin on swap agreements* | $ | 12,282 | — | — | 12,282 | |||||||||
| Unrealized depreciation on forward foreign currency exchange contracts | — | $ | 12,025,693 | — | 12,025,693 | |||||||||
| $ | 12,114,850 | |||||||||||||
Schedule of Investments - Emerging Markets Debt Fund | ||
| Type of Risk Exposure | ||||||||||||||
| Credit | Foreign Currency | Interest Rate | Total | |||||||||||
| Net realized gain (loss) on: | ||||||||||||||
| Forward foreign currency exchange transactions | — | $ | (11,175,341) | — | $ | (11,175,341) | ||||||||
| Futures contract transactions | — | — | $ | (958,467) | (958,467) | |||||||||
| Swap agreement transactions | $ | (831,364) | — | (1,805,019) | (2,636,383) | |||||||||
| $ | (14,770,191) | |||||||||||||
| Change in net unrealized appreciation (depreciation) on: | ||||||||||||||
| Forward foreign currency exchange contracts | — | $ | 1,550,787 | — | $ | 1,550,787 | ||||||||
| Futures contracts | — | — | $ | 1,063,844 | 1,063,844 | |||||||||
| Swap agreements | $ | (598,134) | — | 2,393,391 | 1,795,257 | |||||||||
| $ | 4,409,888 | |||||||||||||
| Counterparty | Gross Amount on Statement of Assets and Liabilities | Amount Eligible for Offset | Collateral | Net Exposure* | ||||||||||
| Assets | ||||||||||||||
| Bank of America NA | $ | 1,320,846 | $ | (1,320,846) | — | — | ||||||||
| Citibank NA | 4,740,701 | (2,526,070) | $ | (898,782) | $ | 1,315,849 | ||||||||
| Goldman Sachs & Co. LLC | 3,541,042 | (1,590,334) | (1,770,000) | 180,708 | ||||||||||
| JPMorgan Chase Bank NA | 189,155 | (189,155) | — | — | ||||||||||
| Morgan Stanley & Co. LLC | 1,589,154 | (1,589,154) | — | — | ||||||||||
| UBS AG | 3,209,606 | (2,542,300) | (437,961) | 229,345 | ||||||||||
| $ | 14,590,504 | $ | (9,757,859) | $ | (3,106,743) | $ | 1,725,902 | |||||||
| Liabilities | ||||||||||||||
| Bank of America NA | $ | 2,897,084 | $ | (1,320,846) | $ | (815,813) | $ | 760,425 | ||||||
| Citibank NA | 2,526,070 | (2,526,070) | — | — | ||||||||||
| Goldman Sachs & Co. LLC | 1,590,334 | (1,590,334) | — | — | ||||||||||
| JPMorgan Chase Bank NA | 626,585 | (189,155) | (296,578) | 140,852 | ||||||||||
| Morgan Stanley & Co. LLC | 1,843,320 | (1,589,154) | (254,166) | — | ||||||||||
| UBS AG | 2,542,300 | (2,542,300) | — | — | ||||||||||
| $ | 12,025,693 | $ | (9,757,859) | $ | (1,366,557) | $ | 901,277 | |||||||
Schedule of Investments - Global Bond Fund | ||
Principal Amount/Shares | Value | ||||||||||
CORPORATE BONDS — 31.7% | |||||||||||
Aerospace and Defense — 0.2% | |||||||||||
Boeing Co., 5.71%, 5/1/40 | $ | 2,025,000 | $ | 2,065,922 | |||||||
Textron, Inc., 4.95%, 3/15/36 | 1,677,000 | 1,660,907 | |||||||||
TransDigm, Inc., 4.625%, 1/15/29 | 1,165,000 | 1,146,766 | |||||||||
TransDigm, Inc., 4.875%, 5/1/29 | 1,330,000 | 1,319,031 | |||||||||
| 6,192,626 | |||||||||||
Air Freight and Logistics — 0.2% | |||||||||||
GXO Logistics, Inc., 6.25%, 5/6/29 | 3,385,000 | 3,559,124 | |||||||||
GXO Logistics, Inc., 6.50%, 5/6/34 | 355,000 | 381,216 | |||||||||
| 3,940,340 | |||||||||||
Automobiles — 0.3% | |||||||||||
American Honda Finance Corp., 4.95%, 1/9/26 | 650,000 | 650,703 | |||||||||
Ford Motor Credit Co. LLC, 6.05%, 11/5/31 | 3,740,000 | 3,824,976 | |||||||||
General Motors Financial Co., Inc., 5.60%, 6/18/31 | 1,150,000 | 1,196,572 | |||||||||
General Motors Financial Co., Inc., 6.15%, 7/15/35 | 1,660,000 | 1,751,422 | |||||||||
| 7,423,673 | |||||||||||
Banks — 6.6% | |||||||||||
Alpha Bank SA, VRN, 4.31%, 7/23/36 | EUR | 4,500,000 | 5,277,910 | ||||||||
Australia & New Zealand Banking Group Ltd., VRN, 2.57%, 11/25/35(1) | $ | 4,510,000 | 4,042,636 | ||||||||
Banco BPM SpA, 3.375%, 1/24/30 | EUR | 2,400,000 | 2,845,392 | ||||||||
Bank of America Corp., VRN, 5.51%, 1/24/36 | $ | 1,855,000 | 1,942,830 | ||||||||
Bank of Montreal, VRN, 7.70%, 5/26/84 | 2,899,000 | 3,076,593 | |||||||||
Bank of Nova Scotia, VRN, 8.625%, 10/27/82 | 3,953,000 | 4,192,615 | |||||||||
Bank of Nova Scotia, VRN, 8.00%, 1/27/84 | 3,560,000 | 3,802,144 | |||||||||
Bank of Nova Scotia, VRN, 6.875%, 10/27/85 | 1,800,000 | 1,817,720 | |||||||||
Banque Federative du Credit Mutuel SA, VRN, 4.00%, 1/15/35 | EUR | 3,000,000 | 3,529,381 | ||||||||
Barclays PLC, VRN, 4.92%, 8/8/30 | EUR | 3,100,000 | 3,825,923 | ||||||||
Barclays PLC, VRN, 8.41%, 11/14/32 | GBP | 2,100,000 | 2,954,181 | ||||||||
BBVA Mexico SA Institucion De Banca Multiple Grupo Financiero BBVA Mexico, VRN, 5.125%, 1/18/33(1) | $ | 4,360,000 | 4,317,010 | ||||||||
BNP Paribas SA, VRN, 2.00%, 5/24/31 | GBP | 3,200,000 | 4,137,683 | ||||||||
BPCE SA, VRN, 2.50%, 11/30/32 | GBP | 1,700,000 | 2,127,185 | ||||||||
BPCE SA, VRN, 4.125%, 3/8/33 | EUR | 1,600,000 | 1,916,396 | ||||||||
BPCE SA, VRN, 3.65%, 1/14/37(1) | $ | 4,405,000 | 4,000,967 | ||||||||
Caixa Geral de Depositos SA, VRN, 0.375%, 9/21/27 | EUR | 2,000,000 | 2,266,365 | ||||||||
Citigroup, Inc., VRN, 5.17%, 9/11/36 | $ | 2,030,000 | 2,056,050 | ||||||||
Citigroup, Inc., VRN, 5.61%, 3/4/56 | 1,345,000 | 1,366,100 | |||||||||
Comerica Bank, VRN, 5.33%, 8/25/33 | 595,000 | 597,805 | |||||||||
Credit Agricole Italia SpA, 3.50%, 1/15/30 | EUR | 9,000,000 | 10,737,973 | ||||||||
Credit Mutuel Arkea SA, VRN, 4.81%, 5/15/35 | EUR | 3,000,000 | 3,625,140 | ||||||||
European Union, 0.00%, 7/4/31(2) | EUR | 15,800,000 | 15,794,563 | ||||||||
HSBC Holdings PLC, VRN, 1.75%, 7/24/27 | GBP | 4,500,000 | 5,806,099 | ||||||||
Intesa Sanpaolo SpA, 6.625%, 5/31/33 | GBP | 3,200,000 | 4,585,674 | ||||||||
Intesa Sanpaolo SpA, VRN, 4.20%, 6/1/32(1) | $ | 5,941,000 | 5,633,850 | ||||||||
Intesa Sanpaolo SpA, VRN, 6.18%, 2/20/34 | EUR | 2,500,000 | 3,140,591 | ||||||||
JPMorgan Chase & Co., VRN, 5.10%, 4/22/31 | $ | 4,475,000 | 4,623,050 | ||||||||
JPMorgan Chase & Co., VRN, 4.26%, 10/22/31 | 2,025,000 | 2,018,382 | |||||||||
JPMorgan Chase & Co., VRN, 5.77%, 4/22/35 | 2,662,000 | 2,839,932 | |||||||||
La Banque Postale SA, VRN, 5.625%, 9/21/28 | GBP | 1,000,000 | 1,336,986 | ||||||||
mBank SA, VRN, 4.03%, 9/27/30 | EUR | 3,000,000 | 3,543,728 | ||||||||
Schedule of Investments - Global Bond Fund | ||
Principal Amount/Shares | Value | ||||||||||
Mizuho Financial Group, Inc., 2.10%, 4/8/32 | EUR | 6,565,000 | $ | 7,116,418 | |||||||
Morgan Stanley Private Bank NA, VRN, 4.73%, 7/18/31 | $ | 1,380,000 | 1,401,959 | ||||||||
NatWest Group PLC, VRN, 2.11%, 11/28/31 | GBP | 1,900,000 | 2,442,157 | ||||||||
NatWest Group PLC, VRN, 3.03%, 11/28/35 | $ | 3,416,000 | 3,127,987 | ||||||||
Novo Banco SA, VRN, 9.875%, 12/1/33 | EUR | 7,000,000 | 9,443,469 | ||||||||
Royal Bank of Canada, VRN, 4.31%, 11/3/31(3) | $ | 3,525,000 | 3,506,591 | ||||||||
Standard Chartered PLC, VRN, 1.20%, 9/23/31 | EUR | 1,585,000 | 1,801,506 | ||||||||
Sumitomo Mitsui Banking Corp., 2.74%, 2/18/30 | EUR | 6,000,000 | 6,928,530 | ||||||||
Toronto-Dominion Bank, VRN, 8.125%, 10/31/82 | $ | 7,030,000 | 7,434,106 | ||||||||
Wells Fargo & Co., VRN, 5.61%, 4/23/36 | 940,000 | 988,180 | |||||||||
Wells Fargo & Co., VRN, 5.01%, 4/4/51 | 1,190,000 | 1,111,475 | |||||||||
Zions Bancorp NA, VRN, 6.82%, 11/19/35 | 4,581,000 | 4,865,088 | |||||||||
| 173,946,320 | |||||||||||
Biotechnology — 0.2% | |||||||||||
Amgen, Inc., 5.65%, 3/2/53 | 1,425,000 | 1,423,117 | |||||||||
Biocon Biologics Global PLC, 6.67%, 10/9/29(1) | 4,735,000 | 4,684,139 | |||||||||
| 6,107,256 | |||||||||||
Building Products — 0.4% | |||||||||||
Builders FirstSource, Inc., 4.25%, 2/1/32(1) | 7,540,000 | 7,139,396 | |||||||||
Carlisle Cos., Inc., 5.55%, 9/15/40 | 1,233,000 | 1,253,652 | |||||||||
Standard Building Solutions, Inc., 6.50%, 8/15/32(1) | 1,253,000 | 1,289,352 | |||||||||
Standard Industries, Inc., 4.375%, 7/15/30(1) | 470,000 | 453,654 | |||||||||
| 10,136,054 | |||||||||||
Capital Markets — 1.7% | |||||||||||
Ares Strategic Income Fund, 5.70%, 3/15/28 | 1,270,000 | 1,285,301 | |||||||||
Blue Owl Capital Corp., 5.95%, 3/15/29 | 1,069,000 | 1,083,486 | |||||||||
Blue Owl Credit Income Corp., 7.75%, 1/15/29 | 1,745,000 | 1,859,875 | |||||||||
Blue Owl Technology Finance Corp., 6.10%, 3/15/28(1) | 6,659,000 | 6,712,453 | |||||||||
Blue Owl Technology Finance Corp., 6.75%, 4/4/29 | 2,595,000 | 2,653,774 | |||||||||
Citadel Finance LLC, 5.90%, 2/10/30(1) | 1,000,000 | 1,010,573 | |||||||||
Goldman Sachs Group, Inc., VRN, 6.48%, 10/24/29 | 300,000 | 318,829 | |||||||||
Goldman Sachs Group, Inc., VRN, 4.69%, 10/23/30 | 534,000 | 540,861 | |||||||||
Goldman Sachs Group, Inc., VRN, 4.37%, 10/21/31 | 3,000,000 | 2,987,735 | |||||||||
Golub Capital BDC, Inc., 7.05%, 12/5/28 | 1,318,000 | 1,383,150 | |||||||||
Golub Capital Private Credit Fund, 5.45%, 8/15/28(1) | 4,040,000 | 4,065,663 | |||||||||
HPS Corporate Lending Fund, 5.45%, 1/14/28 | 1,390,000 | 1,401,002 | |||||||||
HPS Corporate Lending Fund, 4.90%, 9/11/28(1) | 2,105,000 | 2,090,256 | |||||||||
LPL Holdings, Inc., 5.15%, 6/15/30 | 2,575,000 | 2,622,979 | |||||||||
Morgan Stanley, VRN, 6.63%, 11/1/34 | 2,650,000 | 2,971,222 | |||||||||
Morgan Stanley, VRN, 5.83%, 4/19/35 | 431,000 | 459,699 | |||||||||
Morgan Stanley, VRN, 4.89%, 10/22/36 | 1,205,000 | 1,198,841 | |||||||||
Morgan Stanley, VRN, 5.52%, 11/19/55 | 380,000 | 384,555 | |||||||||
Northern Trust Corp., VRN, 3.375%, 5/8/32 | 8,560,000 | 8,416,917 | |||||||||
| 43,447,171 | |||||||||||
Chemicals — 0.3% | |||||||||||
Braskem Netherlands Finance BV, 4.50%, 1/10/28(1) | 1,007,000 | 453,754 | |||||||||
Braskem Netherlands Finance BV, 4.50%, 1/31/30(1) | 8,636,000 | 3,481,085 | |||||||||
Celanese U.S. Holdings LLC, 6.67%, 7/15/27 | 1,485,000 | 1,525,343 | |||||||||
Orbia Advance Corp. SAB de CV, 2.875%, 5/11/31(1) | 522,000 | 429,870 | |||||||||
Solstice Advanced Materials, Inc., 5.625%, 9/30/33(1) | 3,278,000 | 3,282,950 | |||||||||
| 9,173,002 | |||||||||||
Schedule of Investments - Global Bond Fund | ||
Principal Amount/Shares | Value | ||||||||||
Communications Equipment — 0.0% | |||||||||||
Cisco Systems, Inc., 5.50%, 2/24/55 | $ | 994,000 | $ | 1,004,335 | |||||||
Construction Materials — 0.2% | |||||||||||
Quikrete Holdings, Inc., 6.375%, 3/1/32(1) | 1,655,000 | 1,717,844 | |||||||||
Quikrete Holdings, Inc., 6.75%, 3/1/33(1) | 3,846,000 | 4,005,409 | |||||||||
| 5,723,253 | |||||||||||
Consumer Finance — 0.6% | |||||||||||
Ally Financial, Inc., 8.00%, 11/1/31 | 2,363,000 | 2,691,201 | |||||||||
American Express Co., VRN, 4.80%, 10/24/36 | 3,958,000 | 3,914,187 | |||||||||
Capital One Financial Corp., VRN, 2.36%, 7/29/32 | 3,460,000 | 3,007,336 | |||||||||
OneMain Finance Corp., 6.125%, 5/15/30 | 1,040,000 | 1,052,880 | |||||||||
OneMain Finance Corp., 7.50%, 5/15/31 | 1,384,000 | 1,446,885 | |||||||||
PRA Group, Inc., 8.875%, 1/31/30(1) | 2,319,000 | 2,355,995 | |||||||||
| 14,468,484 | |||||||||||
Consumer Staples Distribution & Retail — 0.1% | |||||||||||
Albertsons Cos., Inc./Safeway, Inc./New Albertsons LP/Albertsons LLC, 4.625%, 1/15/27(1) | 2,510,000 | 2,507,412 | |||||||||
Albertsons Cos., Inc./Safeway, Inc./New Albertsons LP/Albertsons LLC, 5.75%, 3/31/34(1)(3) | 1,365,000 | 1,372,721 | |||||||||
| 3,880,133 | |||||||||||
Diversified Consumer Services — 0.1% | |||||||||||
Leland Stanford Junior University, 4.68%, 3/1/35 | 500,000 | 506,960 | |||||||||
Massachusetts Institute of Technology, 5.62%, 6/1/55 | 805,000 | 856,846 | |||||||||
| 1,363,806 | |||||||||||
Diversified REITs — 0.7% | |||||||||||
American Assets Trust LP, 3.375%, 2/1/31 | 2,410,000 | 2,197,828 | |||||||||
GLP Capital LP/GLP Financing II, Inc., 5.25%, 2/15/33 | 2,973,000 | 2,980,908 | |||||||||
Kilroy Realty LP, 3.05%, 2/15/30 | 1,440,000 | 1,327,704 | |||||||||
Kilroy Realty LP, 2.50%, 11/15/32 | 190,000 | 158,042 | |||||||||
Kilroy Realty LP, 2.65%, 11/15/33 | 511,000 | 417,867 | |||||||||
Piedmont Operating Partnership LP, 9.25%, 7/20/28 | 3,269,000 | 3,619,022 | |||||||||
Piedmont Operating Partnership LP, 6.875%, 7/15/29 | 531,000 | 562,685 | |||||||||
Prologis Targeted U.S. Logistics Fund LP, 4.25%, 1/15/31(1) | 890,000 | 883,901 | |||||||||
Prologis Targeted U.S. Logistics Fund LP, 4.75%, 1/15/36(1) | 2,000,000 | 1,959,468 | |||||||||
Trust Fibra Uno, 4.87%, 1/15/30(1) | 612,000 | 598,414 | |||||||||
Trust Fibra Uno, 8.25%, 1/23/37(1) | 3,690,000 | 4,186,783 | |||||||||
| 18,892,622 | |||||||||||
Diversified Telecommunication Services — 0.4% | |||||||||||
Frontier Communications Holdings LLC, 8.625%, 3/15/31(1) | 6,190,000 | 6,551,397 | |||||||||
Sprint Capital Corp., 6.875%, 11/15/28 | 2,559,000 | 2,749,846 | |||||||||
| 9,301,243 | |||||||||||
Electric Utilities — 1.8% | |||||||||||
Alliant Energy Corp., VRN, 5.75%, 4/1/56 | 4,196,000 | 4,214,127 | |||||||||
American Electric Power Co., Inc., VRN, 5.80%, 3/15/56 | 1,325,000 | 1,328,612 | |||||||||
American Electric Power Co., Inc., VRN, 6.05%, 3/15/56 | 1,325,000 | 1,342,921 | |||||||||
Commonwealth Edison Co., 5.30%, 2/1/53 | 967,000 | 943,632 | |||||||||
Commonwealth Edison Co., 5.95%, 6/1/55 | 845,000 | 902,913 | |||||||||
Duke Energy Corp., 4.95%, 9/15/35 | 980,000 | 975,062 | |||||||||
Duke Energy Progress LLC, 4.15%, 12/1/44 | 620,000 | 530,353 | |||||||||
Duke Energy Progress LLC, 5.55%, 3/15/55 | 3,360,000 | 3,393,349 | |||||||||
Electricite de France SA, 6.95%, 1/26/39(1) | 4,096,000 | 4,591,427 | |||||||||
Emera, Inc., Series 16-A, VRN, 6.75%, 6/15/76 | 7,400,000 | 7,458,919 | |||||||||
EUSHI Finance, Inc., VRN, 6.25%, 4/1/56 | 2,698,000 | 2,688,467 | |||||||||
Hawaiian Electric Co., Inc., 6.00%, 10/1/33(1) | 4,228,000 | 4,278,170 | |||||||||
Schedule of Investments - Global Bond Fund | ||
Principal Amount/Shares | Value | ||||||||||
Jersey Central Power & Light Co., 5.15%, 1/15/36(1) | $ | 1,744,000 | $ | 1,769,299 | |||||||
Kentucky Utilities Co., 5.85%, 8/15/55 | 616,000 | 636,141 | |||||||||
Louisville Gas & Electric Co., 5.85%, 8/15/55 | 616,000 | 635,165 | |||||||||
Niagara Mohawk Power Corp., 4.65%, 10/3/30(1) | 945,000 | 952,932 | |||||||||
Northern States Power Co., 5.10%, 5/15/53 | 1,035,000 | 992,688 | |||||||||
Northern States Power Co., 5.65%, 5/15/55 | 1,284,000 | 1,325,717 | |||||||||
NRG Energy, Inc., 2.00%, 12/2/25(1) | 1,850,000 | 1,844,131 | |||||||||
Palomino Funding Trust I, 7.23%, 5/17/28(1) | 1,380,000 | 1,461,238 | |||||||||
RWE Finance U.S. LLC, 5.125%, 9/18/35(1) | 992,000 | 979,132 | |||||||||
Southern Co. Gas Capital Corp., 5.10%, 9/15/35 | 2,649,000 | 2,665,911 | |||||||||
Union Electric Co., 5.45%, 3/15/53 | 1,045,000 | 1,031,909 | |||||||||
| 46,942,215 | |||||||||||
Electrical Equipment — 0.0% | |||||||||||
Hubbell, Inc., 4.80%, 11/15/35(3) | 930,000 | 926,578 | |||||||||
Electronic Equipment, Instruments and Components — 0.5% | |||||||||||
Amphenol Corp., 4.125%, 11/15/30(3) | 2,950,000 | 2,927,283 | |||||||||
Amphenol Corp., 4.40%, 2/15/33(3) | 2,430,000 | 2,403,638 | |||||||||
Amphenol Corp., 4.625%, 2/15/36(3) | 3,000,000 | 2,949,598 | |||||||||
Amphenol Corp., 5.30%, 11/15/55(3) | 1,320,000 | 1,285,498 | |||||||||
Keysight Technologies, Inc., 5.35%, 7/30/30 | 1,069,000 | 1,111,254 | |||||||||
TD SYNNEX Corp., 4.30%, 1/17/29 | 3,177,000 | 3,168,784 | |||||||||
| 13,846,055 | |||||||||||
Energy Equipment and Services — 0.1% | |||||||||||
Enerflex Ltd., 9.00%, 10/15/27(1) | 3,736,000 | 3,825,761 | |||||||||
Entertainment — 0.1% | |||||||||||
Warnermedia Holdings, Inc., 3.76%, 3/15/27 | 3,486,000 | 3,424,995 | |||||||||
Financial Services — 1.5% | |||||||||||
Antares Holdings LP, 6.35%, 10/23/29(1) | 2,485,000 | 2,536,613 | |||||||||
Atlas Warehouse Lending Co. LP, 6.25%, 1/15/30(1) | 3,612,000 | 3,784,389 | |||||||||
BPCE SFH SA, 0.125%, 12/3/30 | EUR | 3,000,000 | 3,041,300 | ||||||||
Cie de Financement Foncier SA, 1.20%, 4/29/31 | EUR | 3,300,000 | 3,492,844 | ||||||||
Credit Agricole Public Sector SCF SA, 0.125%, 12/8/32 | EUR | 1,000,000 | 979,584 | ||||||||
Credit Agricole Public Sector SCF SA, 0.125%, 12/8/32 | EUR | 1,000,000 | 979,546 | ||||||||
Essent Group Ltd., 6.25%, 7/1/29 | $ | 2,785,000 | 2,916,730 | ||||||||
Freedom Mortgage Holdings LLC, 9.25%, 2/1/29(1) | 2,530,000 | 2,658,132 | |||||||||
Nationwide Building Society, VRN, 4.125%, 10/18/32(1) | 2,299,000 | 2,275,463 | |||||||||
NMI Holdings, Inc., 6.00%, 8/15/29 | 3,345,000 | 3,453,043 | |||||||||
PennyMac Financial Services, Inc., 7.125%, 11/15/30(1) | 4,375,000 | 4,584,510 | |||||||||
PennyMac Financial Services, Inc., 6.875%, 2/15/33(1) | 1,188,000 | 1,230,201 | |||||||||
PennyMac Financial Services, Inc., 6.75%, 2/15/34(1) | 740,000 | 759,129 | |||||||||
Rocket Cos., Inc., 6.125%, 8/1/30(1) | 2,335,000 | 2,410,077 | |||||||||
Rocket Cos., Inc., 6.375%, 8/1/33(1) | 2,290,000 | 2,388,424 | |||||||||
UWM Holdings LLC, 6.25%, 3/15/31(1) | 2,405,000 | 2,402,177 | |||||||||
| 39,892,162 | |||||||||||
Food Products — 0.2% | |||||||||||
Flowers Foods, Inc., 5.75%, 3/15/35 | 1,375,000 | 1,390,956 | |||||||||
Mars, Inc., 5.20%, 3/1/35(1) | 989,000 | 1,015,468 | |||||||||
Mars, Inc., 5.65%, 5/1/45(1) | 2,245,000 | 2,289,599 | |||||||||
Mars, Inc., 5.70%, 5/1/55(1) | 1,313,000 | 1,336,927 | |||||||||
| 6,032,950 | |||||||||||
Gas Utilities — 0.1% | |||||||||||
Eastern Energy Gas Holdings LLC, 5.65%, 10/15/54 | 277,000 | 272,820 | |||||||||
Schedule of Investments - Global Bond Fund | ||
Principal Amount/Shares | Value | ||||||||||
Grupo Energia Bogota SA ESP, 5.75%, 10/22/35(1) | $ | 1,634,000 | $ | 1,625,054 | |||||||
Snam SpA, 6.50%, 5/28/55(1) | 1,677,000 | 1,807,898 | |||||||||
| 3,705,772 | |||||||||||
Ground Transportation — 0.1% | |||||||||||
Ashtead Capital, Inc., 5.95%, 10/15/33(1) | 1,483,000 | 1,568,787 | |||||||||
Health Care Equipment and Supplies — 0.4% | |||||||||||
Hologic, Inc., 3.25%, 2/15/29(1) | 2,610,000 | 2,578,262 | |||||||||
Medline Borrower LP/Medline Co-Issuer, Inc., 6.25%, 4/1/29(1) | 7,308,000 | 7,527,262 | |||||||||
| 10,105,524 | |||||||||||
Health Care Providers and Services — 1.3% | |||||||||||
Centene Corp., 4.625%, 12/15/29 | 2,060,000 | 1,999,691 | |||||||||
CVS Health Corp., 5.45%, 9/15/35 | 1,006,000 | 1,027,677 | |||||||||
CVS Health Corp., 6.00%, 6/1/44 | 1,175,000 | 1,190,991 | |||||||||
CVS Health Corp., VRN, 7.00%, 3/10/55 | 2,288,000 | 2,407,493 | |||||||||
Elevance Health, Inc., 5.00%, 1/15/36 | 1,080,000 | 1,076,062 | |||||||||
HCA, Inc., 4.90%, 11/15/35 | 3,947,000 | 3,901,760 | |||||||||
HCA, Inc., 5.70%, 11/15/55 | 2,763,000 | 2,697,130 | |||||||||
Icon Investments Six DAC, 6.00%, 5/8/34 | 441,000 | 462,881 | |||||||||
IQVIA, Inc., 5.00%, 5/15/27(1) | 3,910,000 | 3,911,373 | |||||||||
IQVIA, Inc., 6.25%, 2/1/29 | 1,265,000 | 1,333,547 | |||||||||
Kaiser Foundation Hospitals, 3.00%, 6/1/51 | 505,000 | 339,482 | |||||||||
Surgery Center Holdings, Inc., 7.25%, 4/15/32(1) | 1,166,000 | 1,201,169 | |||||||||
Tenet Healthcare Corp., 5.125%, 11/1/27 | 4,753,000 | 4,750,986 | |||||||||
Tenet Healthcare Corp., 6.125%, 10/1/28 | 1,665,000 | 1,668,187 | |||||||||
UnitedHealth Group, Inc., 5.30%, 6/15/35 | 2,872,000 | 2,973,917 | |||||||||
UnitedHealth Group, Inc., 5.50%, 7/15/44 | 1,286,000 | 1,291,219 | |||||||||
UnitedHealth Group, Inc., 5.05%, 4/15/53 | 1,465,000 | 1,345,841 | |||||||||
| 33,579,406 | |||||||||||
Hotels, Restaurants and Leisure — 1.0% | |||||||||||
Brightstar Lottery PLC, 5.25%, 1/15/29(1) | 5,440,000 | 5,429,772 | |||||||||
Caesars Entertainment, Inc., 4.625%, 10/15/29(1) | 4,673,000 | 4,399,432 | |||||||||
Carnival Corp., 4.00%, 8/1/28(1) | 1,960,000 | 1,929,346 | |||||||||
Carnival Corp., 5.125%, 5/1/29(1) | 2,731,000 | 2,766,469 | |||||||||
Hyatt Hotels Corp., 5.75%, 3/30/32 | 855,000 | 893,161 | |||||||||
Light & Wonder International, Inc., 7.25%, 11/15/29(1) | 4,005,000 | 4,111,409 | |||||||||
Royal Caribbean Cruises Ltd., 6.00%, 2/1/33(1) | 5,388,000 | 5,533,230 | |||||||||
| 25,062,819 | |||||||||||
Household Durables — 0.2% | |||||||||||
Ashton Woods USA LLC/Ashton Woods Finance Co., 6.875%, 8/1/33(1) | 2,627,000 | 2,635,580 | |||||||||
K Hovnanian Enterprises, Inc., 8.375%, 10/1/33(1) | 140,000 | 143,462 | |||||||||
KB Home, 4.80%, 11/15/29 | 2,866,000 | 2,852,738 | |||||||||
| 5,631,780 | |||||||||||
Independent Power and Renewable Electricity Producers — 0.3% | |||||||||||
FIEMEX Energia - Banco Actinver SA Institucion de Banca Multiple, 7.25%, 1/31/41(1) | 4,692,034 | 4,970,600 | |||||||||
Saavi Energia SARL, 8.875%, 2/10/35(1) | 3,545,000 | 3,815,306 | |||||||||
| 8,785,906 | |||||||||||
Industrial Conglomerates — 0.1% | |||||||||||
Siemens Financieringsmaatschappij NV, 1.20%, 3/11/26(1) | 1,505,000 | 1,489,890 | |||||||||
Insurance — 1.6% | |||||||||||
Athene Global Funding, 5.53%, 7/11/31(1) | 903,000 | 929,520 | |||||||||
Beacon Funding Trust, 6.27%, 8/15/54(1) | 710,000 | 730,911 | |||||||||
CNA Financial Corp., 5.20%, 8/15/35 | 3,724,000 | 3,733,919 | |||||||||
Schedule of Investments - Global Bond Fund | ||
Principal Amount/Shares | Value | ||||||||||
CNO Financial Group, Inc., 5.25%, 5/30/29 | $ | 3,880,000 | $ | 3,944,592 | |||||||
CNO Financial Group, Inc., 6.45%, 6/15/34 | 1,615,000 | 1,714,767 | |||||||||
Global Atlantic Fin Co., 7.95%, 6/15/33(1) | 6,435,000 | 7,391,766 | |||||||||
Liberty Mutual Group, Inc., VRN, 4.125%, 12/15/51(1) | 3,170,000 | 3,099,399 | |||||||||
Lincoln National Corp., 7.00%, 6/15/40 | 1,123,000 | 1,275,302 | |||||||||
MetLife Capital Trust IV, 7.875%, 12/15/67(1) | 2,891,000 | 3,253,685 | |||||||||
MetLife, Inc., 6.40%, 12/15/66 | 3,102,000 | 3,275,560 | |||||||||
Rothesay Life PLC, 7.73%, 5/16/33 | GBP | 6,080,000 | 8,879,927 | ||||||||
Wynnton Funding Trust II, 5.99%, 8/15/55(1) | $ | 2,444,000 | 2,512,757 | ||||||||
| 40,742,105 | |||||||||||
Interactive Media and Services — 0.6% | |||||||||||
Meta Platforms, Inc., 4.60%, 11/15/32(3) | 4,340,000 | 4,363,089 | |||||||||
Meta Platforms, Inc., 4.875%, 11/15/35(3) | 3,035,000 | 3,049,595 | |||||||||
Meta Platforms, Inc., 5.50%, 11/15/45(3) | 1,420,000 | 1,408,709 | |||||||||
Meta Platforms, Inc., 5.625%, 11/15/55(3) | 3,940,000 | 3,913,650 | |||||||||
Meta Platforms, Inc., 5.75%, 11/15/65(3) | 2,060,000 | 2,044,637 | |||||||||
| 14,779,680 | |||||||||||
IT Services — 0.3% | |||||||||||
CoreWeave, Inc., 9.25%, 6/1/30(1) | 4,120,000 | 4,165,736 | |||||||||
Kyndryl Holdings, Inc., 3.15%, 10/15/31 | 3,275,000 | 2,985,649 | |||||||||
| 7,151,385 | |||||||||||
Machinery — 0.4% | |||||||||||
AGCO Corp., 5.80%, 3/21/34 | 826,000 | 860,892 | |||||||||
Chart Industries, Inc., 7.50%, 1/1/30(1) | 6,440,000 | 6,724,332 | |||||||||
Nordson Corp., 4.50%, 12/15/29 | 1,245,000 | 1,255,850 | |||||||||
Weir Group, Inc., 5.35%, 5/6/30(1) | 2,195,000 | 2,252,575 | |||||||||
| 11,093,649 | |||||||||||
Marine Transportation — 0.2% | |||||||||||
Yinson Bergenia Production BV, 8.50%, 1/31/45(1) | 5,339,000 | 5,610,267 | |||||||||
Media — 1.4% | |||||||||||
Cox Communications, Inc., 5.70%, 6/15/33(1) | 1,887,000 | 1,923,012 | |||||||||
Discovery Communications LLC, 3.95%, 3/20/28 | 2,435,000 | 2,338,817 | |||||||||
Lamar Media Corp., 3.75%, 2/15/28 | 3,550,000 | 3,454,842 | |||||||||
Nexstar Media, Inc., 4.75%, 11/1/28(1) | 7,095,000 | 6,989,101 | |||||||||
Paramount Global, 4.375%, 3/15/43 | 3,313,000 | 2,510,508 | |||||||||
Paramount Global, VRN, 6.25%, 2/28/57 | 2,498,000 | 2,450,950 | |||||||||
Sirius XM Radio LLC, 3.125%, 9/1/26(1) | 2,685,000 | 2,664,936 | |||||||||
Sirius XM Radio LLC, 4.00%, 7/15/28(1) | 6,845,000 | 6,657,078 | |||||||||
TEGNA, Inc., 4.625%, 3/15/28 | 5,490,000 | 5,439,225 | |||||||||
Time Warner Cable LLC, 6.55%, 5/1/37 | 3,140,000 | 3,219,600 | |||||||||
Versant Media Group, Inc., 7.25%, 1/30/31(1) | 132,000 | 134,634 | |||||||||
| 37,782,703 | |||||||||||
Metals and Mining — 0.2% | |||||||||||
Glencore Funding LLC, 5.19%, 4/1/30(1) | 3,340,000 | 3,439,176 | |||||||||
Newmont Corp./Newcrest Finance Pty. Ltd., 5.35%, 3/15/34 | 679,000 | 706,703 | |||||||||
Rio Tinto Finance USA PLC, 5.75%, 3/14/55 | 570,000 | 590,034 | |||||||||
| 4,735,913 | |||||||||||
Mortgage Real Estate Investment Trusts (REITs) — 0.5% | |||||||||||
Ladder Capital Finance Holdings LLLP/Ladder Capital Finance Corp., 4.75%, 6/15/29(1) | 4,240,000 | 4,160,879 | |||||||||
Ladder Capital Finance Holdings LLLP/Ladder Capital Finance Corp., 7.00%, 7/15/31(1) | 9,600,000 | 10,091,626 | |||||||||
| 14,252,505 | |||||||||||
Schedule of Investments - Global Bond Fund | ||
Principal Amount/Shares | Value | ||||||||||
Multi-Utilities — 0.5% | |||||||||||
CenterPoint Energy, Inc., VRN, 5.95%, 4/1/56 | $ | 2,702,000 | $ | 2,721,587 | |||||||
NiSource, Inc., 5.35%, 7/15/35 | 2,661,000 | 2,716,363 | |||||||||
Sempra, VRN, 4.125%, 4/1/52 | 6,838,000 | 6,686,262 | |||||||||
| 12,124,212 | |||||||||||
Oil, Gas and Consumable Fuels — 2.2% | |||||||||||
Cheniere Energy, Inc., 4.625%, 10/15/28 | 1,065,000 | 1,062,940 | |||||||||
Ecopetrol SA, 7.75%, 2/1/32 | 2,535,000 | 2,622,280 | |||||||||
Enbridge, Inc., VRN, 6.00%, 1/15/77 | 6,880,000 | 6,912,453 | |||||||||
Energy Transfer LP, 6.55%, 12/1/33 | 2,145,000 | 2,345,368 | |||||||||
Energy Transfer LP, 6.125%, 12/15/45 | 1,185,000 | 1,183,675 | |||||||||
Eni SpA, 4.25%, 5/19/33 | EUR | 2,610,000 | 3,184,351 | ||||||||
Eni SpA, 5.95%, 5/15/54(1) | $ | 909,000 | 904,694 | ||||||||
Expand Energy Corp., 6.75%, 4/15/29(1) | 435,000 | 438,588 | |||||||||
Expand Energy Corp., 5.375%, 3/15/30 | 5,171,000 | 5,248,631 | |||||||||
Matador Resources Co., 6.50%, 4/15/32(1) | 2,010,000 | 2,030,361 | |||||||||
Occidental Petroleum Corp., 6.45%, 9/15/36 | 335,000 | 355,921 | |||||||||
Petroleos Mexicanos, 6.84%, 1/23/30 | 854,000 | 877,134 | |||||||||
Petroleos Mexicanos, 5.95%, 1/28/31 | 15,650,000 | 15,318,236 | |||||||||
PRIO Luxembourg Holding SARL, 6.75%, 10/15/30(1) | 1,915,000 | 1,882,420 | |||||||||
Repsol E&P Capital Markets U.S. LLC, 5.20%, 9/16/30(1) | 2,270,000 | 2,279,276 | |||||||||
Repsol E&P Capital Markets U.S. LLC, 5.98%, 9/16/35(1) | 1,336,000 | 1,360,060 | |||||||||
SM Energy Co., 6.75%, 9/15/26 | 3,547,000 | 3,552,579 | |||||||||
Sunoco LP, 7.00%, 5/1/29(1) | 2,116,000 | 2,207,384 | |||||||||
Sunoco LP, 5.875%, 3/15/34(1) | 2,566,000 | 2,567,234 | |||||||||
Venture Global Plaquemines LNG LLC, 6.75%, 1/15/36(1) | 2,486,000 | 2,634,529 | |||||||||
| 58,968,114 | |||||||||||
Paper and Forest Products — 0.1% | |||||||||||
Louisiana-Pacific Corp., 3.625%, 3/15/29(1) | 2,986,000 | 2,866,468 | |||||||||
Passenger Airlines — 1.1% | |||||||||||
American Airlines, Inc., 7.25%, 2/15/28(1) | 2,750,000 | 2,815,512 | |||||||||
American Airlines, Inc./AAdvantage Loyalty IP Ltd., 5.50%, 4/20/26(1) | 3,641,836 | 3,653,370 | |||||||||
Grupo Aeromexico SAB de CV, 8.25%, 11/15/29(1) | 4,875,000 | 4,923,750 | |||||||||
Latam Airlines Group SA, 7.875%, 4/15/30(1) | 3,907,000 | 4,045,308 | |||||||||
Southwest Airlines Co., 4.375%, 11/15/28(3) | 3,670,000 | 3,662,654 | |||||||||
United Airlines, Inc., 4.375%, 4/15/26(1) | 7,242,000 | 7,231,571 | |||||||||
United Airlines, Inc., 4.625%, 4/15/29(1) | 2,095,000 | 2,076,241 | |||||||||
| 28,408,406 | |||||||||||
Personal Care Products — 0.2% | |||||||||||
Coty, Inc./HFC Prestige Products, Inc./HFC Prestige International U.S. LLC, 5.60%, 1/15/31(1) | 3,975,000 | 3,991,619 | |||||||||
Pharmaceuticals — 0.1% | |||||||||||
Bristol-Myers Squibb Co., 5.55%, 2/22/54 | 1,000,000 | 995,737 | |||||||||
Merck & Co., Inc., 5.70%, 9/15/55 | 2,070,000 | 2,136,288 | |||||||||
| 3,132,025 | |||||||||||
Real Estate Management and Development — 0.1% | |||||||||||
Anywhere Real Estate Group LLC/Realogy Co-Issuer Corp., 9.75%, 4/15/30(1) | 1,661,000 | 1,809,711 | |||||||||
Semiconductors and Semiconductor Equipment — 0.5% | |||||||||||
Broadcom, Inc., 4.80%, 2/15/36 | 2,165,000 | 2,149,808 | |||||||||
Foundry JV Holdco LLC, 5.875%, 1/25/34(1) | 1,395,000 | 1,441,695 | |||||||||
Foundry JV Holdco LLC, 6.25%, 1/25/35(1) | 1,575,000 | 1,677,830 | |||||||||
Foundry JV Holdco LLC, 6.10%, 1/25/36(1) | 1,141,000 | 1,206,663 | |||||||||
Foundry JV Holdco LLC, 6.30%, 1/25/39(1) | 1,210,000 | 1,288,686 | |||||||||
Schedule of Investments - Global Bond Fund | ||
Principal Amount/Shares | Value | ||||||||||
Intel Corp., 5.15%, 2/21/34 | $ | 1,065,000 | $ | 1,081,520 | |||||||
Intel Corp., 5.60%, 2/21/54 | 711,000 | 680,472 | |||||||||
Micron Technology, Inc., 5.30%, 1/15/31 | 2,695,000 | 2,786,680 | |||||||||
| 12,313,354 | |||||||||||
Software — 0.8% | |||||||||||
AppLovin Corp., 5.125%, 12/1/29 | 438,000 | 447,211 | |||||||||
AppLovin Corp., 5.50%, 12/1/34 | 2,440,000 | 2,507,579 | |||||||||
Oracle Corp., 4.80%, 9/26/32 | 9,346,000 | 9,252,462 | |||||||||
Oracle Corp., 5.20%, 9/26/35 | 4,050,000 | 3,990,256 | |||||||||
Oracle Corp., 5.50%, 9/27/64 | 485,000 | 423,397 | |||||||||
Synopsys, Inc., 5.00%, 4/1/32 | 5,302,000 | 5,414,993 | |||||||||
| 22,035,898 | |||||||||||
Specialized REITs — 0.3% | |||||||||||
American Tower Corp., 5.35%, 3/15/35 | 3,535,000 | 3,634,810 | |||||||||
EPR Properties, 4.95%, 4/15/28 | 2,040,000 | 2,060,255 | |||||||||
EPR Properties, 3.75%, 8/15/29 | 500,000 | 481,799 | |||||||||
VICI Properties LP/VICI Note Co., Inc., 4.125%, 8/15/30(1) | 2,270,000 | 2,196,058 | |||||||||
| 8,372,922 | |||||||||||
Specialty Retail — 0.4% | |||||||||||
Advance Auto Parts, Inc., 7.00%, 8/1/30(1) | 321,000 | 324,150 | |||||||||
Advance Auto Parts, Inc., 7.375%, 8/1/33(1) | 2,935,000 | 2,974,476 | |||||||||
Lowe's Cos., Inc., 4.50%, 10/15/32 | 3,010,000 | 2,982,729 | |||||||||
Lowe's Cos., Inc., 4.85%, 10/15/35 | 4,360,000 | 4,307,154 | |||||||||
| 10,588,509 | |||||||||||
Technology Hardware, Storage and Peripherals — 0.2% | |||||||||||
Dell International LLC/EMC Corp., 4.50%, 2/15/31 | 3,790,000 | 3,780,494 | |||||||||
Dell International LLC/EMC Corp., 5.30%, 4/1/32 | 1,177,000 | 1,215,990 | |||||||||
| 4,996,484 | |||||||||||
Textiles, Apparel and Luxury Goods — 0.1% | |||||||||||
Gildan Activewear, Inc., 4.70%, 10/7/30(1) | 1,175,000 | 1,170,204 | |||||||||
Gildan Activewear, Inc., 5.40%, 10/7/35(1) | 1,965,000 | 1,958,079 | |||||||||
| 3,128,283 | |||||||||||
Trading Companies and Distributors — 0.1% | |||||||||||
Herc Holdings, Inc., 5.50%, 7/15/27(1) | 688,000 | 688,299 | |||||||||
Herc Holdings, Inc., 7.25%, 6/15/33(1) | 2,163,000 | 2,282,112 | |||||||||
| 2,970,411 | |||||||||||
Wireless Telecommunication Services — 0.1% | |||||||||||
T-Mobile USA, Inc., 6.70%, 12/15/33 | 2,203,000 | 2,465,070 | |||||||||
TOTAL CORPORATE BONDS (Cost $821,294,212) | 834,140,611 | ||||||||||
SOVEREIGN GOVERNMENTS AND AGENCIES — 22.1% | |||||||||||
Australia — 1.0% | |||||||||||
Australia Government Bonds, 1.75%, 6/21/51 | AUD | 4,300,000 | 1,507,355 | ||||||||
New South Wales Treasury Corp., 1.50%, 2/20/32 | AUD | 5,800,000 | 3,209,267 | ||||||||
New South Wales Treasury Corp., 2.00%, 3/8/33 | AUD | 6,000,000 | 3,311,608 | ||||||||
Queensland Treasury Corp., 4.50%, 8/22/35(1) | AUD | 18,850,000 | 11,964,164 | ||||||||
Treasury Corp. of Victoria, 4.25%, 12/20/32 | AUD | 3,600,000 | 2,320,878 | ||||||||
Treasury Corp. of Victoria, 2.25%, 9/15/33 | AUD | 6,900,000 | 3,804,106 | ||||||||
| 26,117,378 | |||||||||||
Belgium — 1.8% | |||||||||||
Kingdom of Belgium Government Bonds, 2.85%, 10/22/34(1) | EUR | 16,250,000 | 18,414,188 | ||||||||
Kingdom of Belgium Government Bonds, 5.00%, 3/28/35(1) | EUR | 15,220,000 | 20,238,791 | ||||||||
Schedule of Investments - Global Bond Fund | ||
Principal Amount/Shares | Value | ||||||||||
Kingdom of Belgium Government Bonds, 4.25%, 3/28/41(1) | EUR | 3,716,000 | $ | 4,596,198 | |||||||
Kingdom of Belgium Government Bonds, 1.60%, 6/22/47(1) | EUR | 4,086,000 | 3,139,771 | ||||||||
Kingdom of Belgium Government Bonds, 3.10%, 6/22/35(1) | EUR | 1,500,000 | 1,719,089 | ||||||||
| 48,108,037 | |||||||||||
Canada — 0.2% | |||||||||||
Canada Government Bonds, 2.00%, 12/1/51 | CAD | 2,180,000 | 1,139,326 | ||||||||
Province of Quebec, 3.50%, 12/1/48 | CAD | 7,300,000 | 4,511,994 | ||||||||
| 5,651,320 | |||||||||||
China — 3.9% | |||||||||||
China Government Bonds, 2.64%, 1/15/28 | CNY | 48,000,000 | 6,932,782 | ||||||||
China Government Bonds, 2.54%, 12/25/30 | CNY | 277,000,000 | 40,782,549 | ||||||||
China Government Bonds, 2.67%, 11/25/33 | CNY | 88,000,000 | 13,245,173 | ||||||||
China Government Bonds, 2.67%, 11/25/33 | CNY | 50,000,000 | 7,525,847 | ||||||||
China Government Bonds, 3.81%, 9/14/50 | CNY | 57,000,000 | 10,474,724 | ||||||||
China Government Bonds, 2.19%, 9/25/54 | CNY | 118,000,000 | 16,693,629 | ||||||||
China Government Bonds, 2.19%, 9/25/54 | CNY | 48,000,000 | 6,790,023 | ||||||||
| 102,444,727 | |||||||||||
Colombia — 0.1% | |||||||||||
Colombia Government International Bonds, 8.00%, 11/14/35 | $ | 880,000 | 961,400 | ||||||||
Colombia TES, 7.00%, 6/30/32 | COP | 11,500,000,000 | 2,371,781 | ||||||||
| 3,333,181 | |||||||||||
Czech Republic — 0.3% | |||||||||||
Czech Republic Government Bonds, 0.25%, 2/10/27 | CZK | 138,700,000 | 6,310,219 | ||||||||
Denmark — 0.2% | |||||||||||
Denmark Government Bonds, 0.50%, 11/15/29 | DKK | 35,000,000 | 5,102,087 | ||||||||
Finland — 0.3% | |||||||||||
Finland Government Bonds, 1.50%, 9/15/32(1) | EUR | 7,500,000 | 8,008,185 | ||||||||
Germany — 0.2% | |||||||||||
Bundesrepublik Deutschland Bundesanleihe, 1.25%, 8/15/48 | EUR | 1,200,000 | 959,521 | ||||||||
Bundesrepublik Deutschland Bundesanleihe, 1.80%, 8/15/53 | EUR | 3,330,000 | 2,861,447 | ||||||||
| 3,820,968 | |||||||||||
Indonesia — 0.4% | |||||||||||
Indonesia Treasury Bonds, 6.625%, 2/15/34 | IDR | 181,530,000,000 | 11,317,554 | ||||||||
Israel — 0.1% | |||||||||||
Israel Government Bonds - Fixed, 2.80%, 11/29/52 | ILS | 10,000,000 | 2,375,688 | ||||||||
Italy — 2.0% | |||||||||||
Italy Buoni Poliennali Del Tesoro, 0.90%, 4/1/31 | EUR | 10,000,000 | 10,497,763 | ||||||||
Italy Buoni Poliennali Del Tesoro, 0.60%, 8/1/31(1) | EUR | 10,000,000 | 10,226,000 | ||||||||
Italy Buoni Poliennali Del Tesoro, 3.85%, 7/1/34 | EUR | 17,700,000 | 21,419,558 | ||||||||
Italy Buoni Poliennali Del Tesoro, 1.80%, 3/1/41(1) | EUR | 1,500,000 | 1,332,654 | ||||||||
Italy Buoni Poliennali Del Tesoro, 4.75%, 9/1/44(1) | EUR | 7,519,000 | 9,631,832 | ||||||||
Italy Buoni Poliennali Del Tesoro, 1.70%, 9/1/51(1) | EUR | 500,000 | 359,808 | ||||||||
| 53,467,615 | |||||||||||
Japan — 3.8% | |||||||||||
Japan Government Forty Year Bonds, 1.40%, 3/20/55 | JPY | 625,000,000 | 2,754,946 | ||||||||
Japan Government Thirty Year Bonds, 2.40%, 3/20/37 | JPY | 231,950,000 | 1,595,090 | ||||||||
Japan Government Thirty Year Bonds, 2.00%, 9/20/41 | JPY | 1,234,500,000 | 7,703,333 | ||||||||
Japan Government Thirty Year Bonds, 1.40%, 12/20/45 | JPY | 1,673,400,000 | 8,812,216 | ||||||||
Japan Government Thirty Year Bonds, 0.40%, 3/20/50 | JPY | 700,000,000 | 2,564,972 | ||||||||
Japan Government Thirty Year Bonds, 0.70%, 6/20/51 | JPY | 716,000,000 | 2,733,521 | ||||||||
Japan Government Thirty Year Bonds, 0.70%, 9/20/51 | JPY | 1,350,000,000 | 5,116,040 | ||||||||
Japan Government Thirty Year Bonds, 0.70%, 12/20/51 | JPY | 1,790,000,000 | 6,739,804 | ||||||||
Schedule of Investments - Global Bond Fund | ||
Principal Amount/Shares | Value | ||||||||||
Japan Government Thirty Year Bonds, 1.00%, 3/20/52 | JPY | 297,300,000 | $ | 1,215,808 | |||||||
Japan Government Thirty Year Bonds, 1.30%, 6/20/52 | JPY | 380,000,000 | 1,680,677 | ||||||||
Japan Government Thirty Year Bonds, 1.60%, 12/20/52 | JPY | 300,000,000 | 1,423,845 | ||||||||
Japan Government Thirty Year Bonds, 1.40%, 3/20/53 | JPY | 657,000,000 | 2,951,418 | ||||||||
Japan Government Thirty Year Bonds, 1.20%, 6/20/53 | JPY | 1,853,500,000 | 7,852,873 | ||||||||
Japan Government Thirty Year Bonds, 1.80%, 9/20/53 | JPY | 1,000,000,000 | 4,946,161 | ||||||||
Japan Government Thirty Year Bonds, 1.80%, 3/20/54 | JPY | 1,120,000,000 | 5,514,799 | ||||||||
Japan Government Thirty Year Bonds, 2.20%, 6/20/54 | JPY | 680,000,000 | 3,675,991 | ||||||||
Japan Government Twenty Year Bonds, 0.60%, 9/20/37 | JPY | 1,222,000,000 | 6,858,368 | ||||||||
Japan Government Twenty Year Bonds, 0.50%, 6/20/38 | JPY | 931,000,000 | 5,059,455 | ||||||||
Japan Government Twenty Year Bonds, 0.70%, 9/20/38 | JPY | 906,000,000 | 5,021,752 | ||||||||
Japan Government Twenty Year Bonds, 0.30%, 12/20/39 | JPY | 1,078,800,000 | 5,447,050 | ||||||||
Japan Government Twenty Year Bonds, 0.50%, 12/20/41 | JPY | 831,000,000 | 4,082,642 | ||||||||
Japan Government Twenty Year Bonds, 1.10%, 9/20/42 | JPY | 835,000,000 | 4,464,732 | ||||||||
Japan Government Twenty Year Bonds, 1.10%, 6/20/43 | JPY | 500,000,000 | 2,629,220 | ||||||||
| 100,844,713 | |||||||||||
Malaysia — 0.3% | |||||||||||
Malaysia Government Bonds, 4.70%, 10/15/42 | MYR | 31,900,000 | 8,415,426 | ||||||||
Mexico — 0.8% | |||||||||||
Eagle Funding Luxco SARL, 5.50%, 8/17/30(1) | 13,000,000 | 13,222,950 | |||||||||
Mexico Bonos, 7.75%, 5/29/31 | MXN | 158,230,000 | 8,311,354 | ||||||||
| 21,534,304 | |||||||||||
New Zealand — 1.2% | |||||||||||
New Zealand Government Bonds, 1.75%, 5/15/41 | NZD | 6,040,000 | 2,359,632 | ||||||||
New Zealand Government Bonds, 4.50%, 5/15/35 | NZD | 49,350,000 | 29,207,570 | ||||||||
| 31,567,202 | |||||||||||
Norway — 0.0% | |||||||||||
Norway Government Bonds, 1.75%, 2/17/27(1) | NOK | 2,800,000 | 269,206 | ||||||||
Poland — 0.2% | |||||||||||
Republic of Poland Government Bonds, 1.75%, 4/25/32 | PLN | 16,300,000 | 3,647,662 | ||||||||
Saudi Arabia — 0.6% | |||||||||||
Saudi Government International Bonds, 3.375%, 3/5/32(1) | EUR | 14,250,000 | 16,568,884 | ||||||||
Singapore — 0.1% | |||||||||||
Singapore Government Bonds, 2.875%, 7/1/29 | SGD | 4,240,000 | 3,413,898 | ||||||||
Spain — 2.4% | |||||||||||
Spain Government Bonds, 0.80%, 7/30/29 | EUR | 10,500,000 | 11,441,710 | ||||||||
Spain Government Bonds, 2.70%, 1/31/30 | EUR | 10,000,000 | 11,660,773 | ||||||||
Spain Government Bonds, 0.10%, 4/30/31(1) | EUR | 10,000,000 | 10,093,311 | ||||||||
Spain Government Bonds, 3.10%, 7/30/31 | EUR | 10,000,000 | 11,819,043 | ||||||||
Spain Government Bonds, 3.15%, 4/30/33(1) | EUR | 7,000,000 | 8,232,183 | ||||||||
Spain Government Bonds, 1.85%, 7/30/35(1) | EUR | 2,200,000 | 2,274,823 | ||||||||
Spain Government Bonds, 2.70%, 10/31/48(1) | EUR | 7,100,000 | 6,829,657 | ||||||||
| 62,351,500 | |||||||||||
Sweden — 0.2% | |||||||||||
Sweden Government Bonds, 1.75%, 11/11/33 | SEK | 29,000,000 | 2,909,695 | ||||||||
Sweden Government Bonds, 3.50%, 3/30/39 | SEK | 15,600,000 | 1,785,968 | ||||||||
| 4,695,663 | |||||||||||
Thailand — 0.4% | |||||||||||
Thailand Government Bonds, 1.59%, 12/17/35 | THB | 306,000,000 | 9,338,044 | ||||||||
United Kingdom — 1.6% | |||||||||||
U.K. Gilts, 1.75%, 9/7/37 | GBP | 9,375,000 | 9,151,455 | ||||||||
U.K. Gilts, 3.75%, 1/29/38 | GBP | 20,000,000 | 24,018,157 | ||||||||
Schedule of Investments - Global Bond Fund | ||
Principal Amount/Shares | Value | ||||||||||
U.K. Gilts, 4.50%, 12/7/42 | GBP | 954,000 | $ | 1,188,873 | |||||||
U.K. Gilts, 4.25%, 12/7/49 | GBP | 3,720,000 | 4,299,110 | ||||||||
U.K. Gilts, 4.25%, 12/7/55 | GBP | 3,780,000 | 4,279,493 | ||||||||
| 42,937,088 | |||||||||||
TOTAL SOVEREIGN GOVERNMENTS AND AGENCIES (Cost $645,949,376) | 581,640,549 | ||||||||||
U.S. GOVERNMENT AGENCY MORTGAGE-BACKED SECURITIES — 12.4% | |||||||||||
Adjustable-Rate U.S. Government Agency Mortgage-Backed Securities — 0.0% | |||||||||||
FNMA, VRN, 3.17%, (1-year RFUCC plus 1.61%), 3/1/47 | $ | 467,695 | 468,022 | ||||||||
FNMA, VRN, 3.10%, (1-year RFUCC plus 1.61%), 4/1/47 | 304,168 | 304,102 | |||||||||
| 772,124 | |||||||||||
Fixed-Rate U.S. Government Agency Mortgage-Backed Securities — 12.4% | |||||||||||
FHLMC, 6.00%, 2/1/38 | 535 | 565 | |||||||||
FHLMC, 3.50%, 2/1/49 | 6,826,011 | 6,425,956 | |||||||||
FHLMC, 3.50%, 5/1/50 | 4,495,910 | 4,186,077 | |||||||||
FHLMC, 2.50%, 10/1/50 | 5,512,351 | 4,687,039 | |||||||||
FHLMC, 2.50%, 5/1/51 | 151,080 | 129,641 | |||||||||
FHLMC, 3.50%, 5/1/51 | 5,655,863 | 5,270,095 | |||||||||
FHLMC, 2.00%, 8/1/51 | 16,684,347 | 13,661,456 | |||||||||
FHLMC, 3.00%, 12/1/51 | 5,756,013 | 5,125,553 | |||||||||
FHLMC, 3.50%, 5/1/52 | 861,500 | 796,065 | |||||||||
FHLMC, 3.50%, 5/1/52 | 292,966 | 272,937 | |||||||||
FHLMC, 4.00%, 5/1/52 | 297,744 | 284,137 | |||||||||
| FHLMC, 5.00%, 8/1/52 | 5,724,215 | 5,749,504 | |||||||||
FHLMC, 6.00%, 11/1/52 | 5,420,233 | 5,589,101 | |||||||||
FHLMC, 6.00%, 1/1/53 | 4,001,270 | 4,119,845 | |||||||||
| FHLMC, 6.00%, 8/1/53 | 5,067,806 | 5,265,212 | |||||||||
FHLMC, 6.50%, 11/1/53 | 4,757,469 | 4,943,739 | |||||||||
FHLMC, 5.50%, 4/1/54 | 10,094,768 | 10,279,393 | |||||||||
FNMA, 3.50%, 10/1/40 | 665,616 | 641,103 | |||||||||
FNMA, 4.50%, 9/1/41 | 4,562 | 4,583 | |||||||||
FNMA, 3.50%, 5/1/42 | 13,659 | 13,096 | |||||||||
FNMA, 4.00%, 2/1/46 | 90,858 | 87,978 | |||||||||
FNMA, 4.00%, 3/1/50 | 6,631,781 | 6,340,886 | |||||||||
FNMA, 2.50%, 6/1/50 | 8,284,111 | 7,105,550 | |||||||||
FNMA, 4.00%, 3/1/51 | 9,025,299 | 8,684,897 | |||||||||
FNMA, 4.00%, 3/1/51 | 6,960,455 | 6,709,397 | |||||||||
FNMA, 2.50%, 12/1/51 | 5,278,312 | 4,536,126 | |||||||||
FNMA, 2.50%, 2/1/52 | 2,143,380 | 1,843,271 | |||||||||
FNMA, 3.00%, 2/1/52 | 5,249,208 | 4,709,219 | |||||||||
FNMA, 3.00%, 4/1/52 | 14,625,620 | 13,227,730 | |||||||||
FNMA, 3.50%, 4/1/52 | 183,541 | 169,690 | |||||||||
FNMA, 3.00%, 5/1/52 | 237,361 | 214,321 | |||||||||
FNMA, 3.50%, 5/1/52 | 8,826,946 | 8,172,912 | |||||||||
FNMA, 3.50%, 5/1/52 | 5,462,353 | 5,055,950 | |||||||||
FNMA, 3.50%, 5/1/52 | 533,129 | 499,749 | |||||||||
FNMA, 4.00%, 5/1/52 | 3,757,967 | 3,578,538 | |||||||||
FNMA, 3.00%, 6/1/52 | 13,284,210 | 11,911,509 | |||||||||
FNMA, 5.00%, 8/1/52 | 2,594,417 | 2,602,439 | |||||||||
FNMA, 5.00%, 10/1/52 | 9,361,092 | 9,409,350 | |||||||||
FNMA, 5.50%, 10/1/52 | 3,860,481 | 3,917,220 | |||||||||
FNMA, 5.00%, 1/1/53 | 10,915,897 | 10,946,839 | |||||||||
Schedule of Investments - Global Bond Fund | ||
Principal Amount/Shares | Value | ||||||||||
FNMA, 5.50%, 1/1/53 | $ | 4,589,928 | $ | 4,669,610 | |||||||
FNMA, 6.50%, 1/1/53 | 5,261,653 | 5,472,989 | |||||||||
FNMA, 5.50%, 3/1/53 | 11,367,234 | 11,614,138 | |||||||||
FNMA, 4.50%, 6/1/53 | 11,392,178 | 11,272,655 | |||||||||
FNMA, 4.50%, 8/1/53 | 3,305,913 | 3,255,592 | |||||||||
FNMA, 6.00%, 9/1/53 | 4,053,621 | 4,193,491 | |||||||||
FNMA, 6.00%, 9/1/53 | 1,631,475 | 1,673,969 | |||||||||
FNMA, 5.50%, 3/1/54 | 7,693,520 | 7,794,595 | |||||||||
FNMA, 4.50%, 4/1/54 | 4,968,344 | 4,860,767 | |||||||||
FNMA, 6.00%, 5/1/54 | 5,533,253 | 5,671,273 | |||||||||
GNMA, 5.00%, TBA | 5,891,000 | 5,873,784 | |||||||||
GNMA, 6.00%, 7/15/33 | 1,260 | 1,295 | |||||||||
GNMA, 4.50%, 10/15/39 | 1,699 | 1,705 | |||||||||
GNMA, 5.00%, 10/15/39 | 3,049 | 3,135 | |||||||||
GNMA, 4.50%, 1/15/40 | 2,487 | 2,500 | |||||||||
GNMA, 4.00%, 12/15/40 | 2,744 | 2,649 | |||||||||
GNMA, 4.50%, 12/15/40 | 8,571 | 8,582 | |||||||||
GNMA, 3.50%, 6/20/42 | 1,521,230 | 1,449,156 | |||||||||
GNMA, 3.00%, 5/20/50 | 1,040,333 | 937,403 | |||||||||
GNMA, 3.00%, 7/20/50 | 2,748,897 | 2,480,410 | |||||||||
GNMA, 3.50%, 6/20/51 | 2,344,020 | 2,162,457 | |||||||||
GNMA, 3.00%, 7/20/51 | 6,352,787 | 5,718,389 | |||||||||
GNMA, 2.00%, 12/20/51 | 12,818,472 | 10,674,702 | |||||||||
GNMA, 4.00%, 9/20/52 | 6,948,552 | 6,629,865 | |||||||||
GNMA, 4.50%, 9/20/52 | 4,329,849 | 4,259,333 | |||||||||
GNMA, 4.50%, 10/20/52 | 7,866,306 | 7,736,982 | |||||||||
GNMA, 4.00%, 4/20/54 | 15,781,595 | 14,987,150 | |||||||||
GNMA, 5.00%, 12/20/54 | 4,341,055 | 4,338,887 | |||||||||
UMBS, 5.00%, TBA | 10,159,000 | 10,109,438 | |||||||||
| 325,025,569 | |||||||||||
TOTAL U.S. GOVERNMENT AGENCY MORTGAGE-BACKED SECURITIES (Cost $323,799,132) | 325,797,693 | ||||||||||
COLLATERALIZED MORTGAGE OBLIGATIONS — 10.3% | |||||||||||
Private Sponsor Collateralized Mortgage Obligations — 10.0% | |||||||||||
Chase Home Lending Mortgage Trust, Series 2024-10, Class A4, VRN, 6.00%, 10/25/55(1) | 6,869,109 | 6,958,989 | |||||||||
Chase Home Lending Mortgage Trust, Series 2024-2, Class A4A, SEQ, VRN, 6.00%, 2/25/55(1) | 3,007,013 | 3,042,842 | |||||||||
Chase Home Lending Mortgage Trust, Series 2024-3, Class A4, SEQ, VRN, 6.00%, 2/25/55(1) | 7,876,287 | 7,988,591 | |||||||||
Chase Home Lending Mortgage Trust, Series 2024-9, Class A4, VRN, 5.50%, 9/25/55(1) | 7,002,170 | 7,021,655 | |||||||||
Chase Home Lending Mortgage Trust, Series 2024-9, Class A6, SEQ, VRN, 5.50%, 9/25/55(1) | 2,561,120 | 2,561,001 | |||||||||
Chase Home Lending Mortgage Trust, Series 2025-10, Class A4A, VRN, 5.50%, 7/25/56(1) | 10,102,318 | 10,187,159 | |||||||||
Citigroup Mortgage Loan Trust, Inc., Series 2024-1, Class A7A, VRN, 6.00%, 7/25/54(1) | 6,807,841 | 6,895,805 | |||||||||
Deephaven Residential Mortgage Trust, Series 2020-2, Class B1, VRN, 6.40%, 5/25/65(1) | 4,482,000 | 4,513,067 | |||||||||
GCAT Trust, Series 2024-INV3, Class A6, SEQ, VRN, 5.50%, 9/25/54(1) | 11,243,409 | 11,333,447 | |||||||||
GS Mortgage-Backed Securities Trust, Series 2024-PJ5, Class A15, SEQ, VRN, 6.00%, 9/25/54(1) | 7,093,387 | 7,169,397 | |||||||||
GS Mortgage-Backed Securities Trust, Series 2024-PJ7, Class A7, SEQ, VRN, 5.50%, 11/25/54(1) | 7,702,309 | 7,700,594 | |||||||||
GS Mortgage-Backed Securities Trust, Series 2025-PJ5, Class A5, VRN, 5.50%, 10/25/55(1) | 13,520,985 | 13,607,387 | |||||||||
GS Mortgage-Backed Securities Trust, Series 2025-PJ6, Class A4, VRN, 6.00%, 11/25/55(1) | 7,178,102 | 7,286,291 | |||||||||
JP Morgan Mortgage Trust, Series 2023-7, Class A4A, SEQ, VRN, 5.50%, 2/25/54(1) | 8,843,347 | 8,896,014 | |||||||||
JP Morgan Mortgage Trust, Series 2023-8, Class A4, SEQ, VRN, 6.00%, 2/25/54(1) | 3,060,000 | 3,094,350 | |||||||||
JP Morgan Mortgage Trust, Series 2024-10, Class A4, VRN, 5.50%, 3/25/55(1) | 6,794,866 | 6,824,606 | |||||||||
JP Morgan Mortgage Trust, Series 2024-10, Class A6, SEQ, VRN, 5.50%, 3/25/55(1) | 4,692,611 | 4,700,071 | |||||||||
JP Morgan Mortgage Trust, Series 2024-11, Class A4, VRN, 6.00%, 4/25/55(1) | 10,413,055 | 10,556,953 | |||||||||
Schedule of Investments - Global Bond Fund | ||
Principal Amount/Shares | Value | ||||||||||
JP Morgan Mortgage Trust, Series 2024-11, Class A6, SEQ, VRN, 6.00%, 4/25/55(1) | $ | 4,051,084 | $ | 4,081,771 | |||||||
JP Morgan Mortgage Trust, Series 2024-12, Class A4, VRN, 6.00%, 6/25/55(1) | 6,885,878 | 6,971,277 | |||||||||
JP Morgan Mortgage Trust, Series 2024-5, Class A6, SEQ, VRN, 6.00%, 11/25/54(1) | 4,672,394 | 4,692,369 | |||||||||
JP Morgan Mortgage Trust, Series 2024-8, Class A6A, SEQ, VRN, 5.50%, 1/25/55(1) | 5,116,816 | 5,124,215 | |||||||||
JP Morgan Mortgage Trust, Series 2024-CCM1, Class A4A, SEQ, VRN, 5.50%, 4/25/55(1) | 5,221,584 | 5,258,602 | |||||||||
JP Morgan Mortgage Trust, Series 2024-INV1, Class A4, SEQ, VRN, 6.00%, 4/25/55(1) | 6,483,675 | 6,579,928 | |||||||||
JP Morgan Mortgage Trust, Series 2025-5MPR, Class A1D, 5.50%, 11/25/55(1) | 6,813,929 | 6,844,041 | |||||||||
JP Morgan Mortgage Trust, Series 2025-CCM1, Class A4, SEQ, VRN, 5.50%, 6/25/55(1) | 10,497,758 | 10,563,211 | |||||||||
Morgan Stanley Residential Mortgage Loan Trust, Series 2023-4, Class A4, VRN, 6.00%, 11/25/53(1) | 3,258,408 | 3,272,179 | |||||||||
Morgan Stanley Residential Mortgage Loan Trust, Series 2024-3, Class A2, VRN, 6.00%, 7/25/54(1) | 4,437,956 | 4,464,062 | |||||||||
OBX Trust, Series 2024-J1, Class A5, SEQ, VRN, 5.50%, 9/25/54(1) | 3,980,859 | 3,994,303 | |||||||||
OBX Trust, Series 2025-J1, Class A5, SEQ, VRN, 5.50%, 5/25/55(1) | 7,703,865 | 7,757,281 | |||||||||
PMT Loan Trust, Series 2025-J2, Class A9, VRN, 5.50%, 8/25/56(1) | 16,029,148 | 16,148,591 | |||||||||
Provident Funding Mortgage Trust, Series 2025-2, Class A4, SEQ, VRN, 5.50%, 6/25/55(1) | 8,786,773 | 8,843,486 | |||||||||
Rate Mortgage Trust, Series 2024-J3, Class A8, SEQ, VRN, 5.50%, 10/25/54(1) | 2,385,613 | 2,389,381 | |||||||||
Rate Mortgage Trust, Series 2025-J1, Class A4, VRN, 6.00%, 3/25/55(1) | 6,922,966 | 7,031,807 | |||||||||
Sequoia Mortgage Trust, Series 2024-10, Class A11, VRN, 5.50%, 11/25/54(1) | 2,658,838 | 2,661,359 | |||||||||
Sequoia Mortgage Trust, Series 2024-10, Class A5, SEQ, VRN, 5.50%, 11/25/54(1) | 3,926,775 | 3,944,734 | |||||||||
Sequoia Mortgage Trust, Series 2024-8, Class A11, SEQ, VRN, 5.50%, 9/25/54(1) | 5,772,735 | 5,771,275 | |||||||||
Sequoia Mortgage Trust, Series 2024-8, Class A5, SEQ, VRN, 5.50%, 9/25/54(1) | 8,319,355 | 8,350,257 | |||||||||
Sequoia Mortgage Trust, Series 2024-9, Class A5, SEQ, VRN, 5.50%, 10/25/54(1) | 5,468,940 | 5,493,434 | |||||||||
Verus Securitization Trust, Series 2023-8, Class A2, 6.66%, 12/25/68(1) | 2,037,810 | 2,059,615 | |||||||||
| 262,635,397 | |||||||||||
U.S. Government Agency Collateralized Mortgage Obligations — 0.3% | |||||||||||
FNMA, Series 2022-R09, Class 2M1, VRN, 6.68%, (30-day average SOFR plus 2.50%), 9/25/42(1) | 1,193,528 | 1,209,455 | |||||||||
FNMA, Series 2023-R05, Class 1M1, VRN, 6.08%, (30-day average SOFR plus 1.90%), 6/25/43(1) | 4,410,597 | 4,454,770 | |||||||||
FNMA, Series 2024-R01, Class 1M1, VRN, 5.23%, (30-day average SOFR plus 1.05%), 1/25/44(1) | 3,378,844 | 3,380,046 | |||||||||
| 9,044,271 | |||||||||||
TOTAL COLLATERALIZED MORTGAGE OBLIGATIONS (Cost $270,163,753) | 271,679,668 | ||||||||||
CONVERTIBLE PREFERRED SECURITIES — 8.8% | |||||||||||
Banks — 7.4% | |||||||||||
ABN AMRO Bank NV, 4.75% | 6,000,000 | 6,964,472 | |||||||||
Australia & New Zealand Banking Group Ltd., 6.75%(1) | 7,870,000 | 7,994,716 | |||||||||
Banco Bilbao Vizcaya Argentaria SA, 6.125% | 7,000,000 | 7,032,004 | |||||||||
Banco de Sabadell SA, 5.00% | 3,000,000 | 3,504,024 | |||||||||
Banco Mercantil del Norte SA, 5.875%(1) | 3,537,000 | 3,510,470 | |||||||||
Banco Mercantil del Norte SA, 7.50%(1) | 1,774,000 | 1,821,304 | |||||||||
Banco Santander SA, 4.75% | 14,400,000 | 14,199,434 | |||||||||
Barclays PLC, 6.375% | 2,090,000 | 2,755,070 | |||||||||
Barclays PLC, 8.00% | 7,523,000 | 8,033,225 | |||||||||
BNP Paribas SA, 8.50%(1) | 12,253,000 | 12,986,416 | |||||||||
BNP Paribas SA, 7.375% | 2,400,000 | 3,034,895 | |||||||||
Commerzbank AG, 4.25% | 7,000,000 | 8,017,638 | |||||||||
Cooperatieve Rabobank UA, 3.25% | 5,000,000 | 5,718,504 | |||||||||
Credit Agricole SA, 7.25% | 4,900,000 | 6,099,024 | |||||||||
Danske Bank AS, 4.375% | 11,100,000 | 11,053,031 | |||||||||
HSBC Holdings PLC, 6.00% | 6,847,000 | 6,904,706 | |||||||||
HSBC Holdings PLC, 6.875% | 1,973,000 | 2,043,059 | |||||||||
ING Groep NV, 5.75% | 7,410,000 | 7,446,472 | |||||||||
ING Groep NV, 7.50% | 7,125,000 | 7,451,334 | |||||||||
La Banque Postale SA, 3.875% | 4,400,000 | 5,063,445 | |||||||||
Schedule of Investments - Global Bond Fund | ||
Principal Amount/Shares | Value | ||||||||||
Lloyds Banking Group PLC, 6.75% | 3,919,000 | $ | 3,952,076 | ||||||||
Macquarie Bank Ltd., 6.125%(1) | 5,354,000 | 5,459,126 | |||||||||
NatWest Group PLC, 5.125% | 1,585,000 | 2,071,548 | |||||||||
Nordea Bank Abp, 6.625%(1) | 14,035,000 | 14,145,933 | |||||||||
Skandinaviska Enskilda Banken AB, 6.875% | 7,200,000 | 7,388,507 | |||||||||
Societe Generale SA, 4.75%(1) | 1,207,000 | 1,202,142 | |||||||||
Societe Generale SA, 9.375%(1) | 7,760,000 | 8,337,507 | |||||||||
Societe Generale SA, 7.875% | 1,600,000 | 1,999,760 | |||||||||
Standard Chartered PLC, 7.75%(1) | 2,118,000 | 2,203,067 | |||||||||
Svenska Handelsbanken AB, 4.375% | 7,400,000 | 7,312,801 | |||||||||
UniCredit SpA, 3.875% | 7,255,000 | 8,286,765 | |||||||||
| 193,992,475 | |||||||||||
Capital Markets — 0.9% | |||||||||||
Deutsche Bank AG, 7.125% | 6,500,000 | 8,568,721 | |||||||||
Deutsche Bank AG, 4.625% | 4,600,000 | 5,271,159 | |||||||||
UBS Group AG, 9.25%(1) | 9,505,000 | 10,371,143 | |||||||||
| 24,211,023 | |||||||||||
Financial Services — 0.3% | |||||||||||
Nationwide Building Society, 5.75% | 6,600,000 | 8,702,252 | |||||||||
Insurance — 0.2% | |||||||||||
CNP Assurances SA, 4.75% | 3,500,000 | 4,075,412 | |||||||||
TOTAL CONVERTIBLE PREFERRED SECURITIES (Cost $224,343,460) | 230,981,162 | ||||||||||
ASSET-BACKED SECURITIES — 3.2% | |||||||||||
Blackbird Capital II Aircraft Lease Ltd., Series 2021-1A, Class A, SEQ, 2.44%, 7/15/46(1) | $ | 3,145,108 | 2,981,216 | ||||||||
Capital Automotive REIT, Series 2024-2A, Class A2, SEQ, 5.25%, 5/15/54(1) | 6,753,255 | 6,726,094 | |||||||||
Cologix Data Centers U.S. Issuer LLC, Series 2021-1A, Class A2, SEQ, 3.30%, 12/26/51(1) | 1,746,000 | 1,706,568 | |||||||||
CyrusOne Data Centers Issuer I LLC, Series 2024-2A, Class A2, SEQ, 4.50%, 5/20/49(1) | 6,300,000 | 6,207,584 | |||||||||
Elara HGV Timeshare Issuer LLC, Series 2025-A, Class A, SEQ, 4.54%, 1/25/40(1) | 12,776,124 | 12,781,548 | |||||||||
Flexential Issuer, Series 2021-1A, Class A2, SEQ, 3.25%, 11/27/51(1) | 8,675,000 | 8,632,735 | |||||||||
Goodgreen Trust, Series 2018-1A, Class A, VRN, 3.93%, 10/15/53(1) | 1,008,095 | 930,815 | |||||||||
New Economy Assets - Phase 1 Sponsor LLC, Series 2021-1, Class B1, 2.41%, 10/20/61(1) | 12,500,000 | 8,196,944 | |||||||||
Pagaya AI Debt Grantor Trust, Series 2025-6, Class B, 4.88%, 4/15/33(1) | 5,118,733 | 5,118,104 | |||||||||
SEB Funding LLC, Series 2024-1A, Class A2, SEQ, 7.39%, 4/30/54(1) | 7,383,000 | 7,568,095 | |||||||||
Sierra Timeshare Receivables Funding LLC, Series 2021-8, Class D, 3.17%, 11/20/37(1) | 259,154 | 258,053 | |||||||||
Stack Infrastructure Issuer LLC, Series 2021-1A, Class A2, SEQ, 1.88%, 3/26/46(1) | 3,634,000 | 3,590,833 | |||||||||
Switch ABS Issuer LLC, Series 2024-2A, Class A2, SEQ, 5.44%, 6/25/54(1) | 4,800,000 | 4,820,509 | |||||||||
Trinity Rail Leasing LLC, Series 2025-1A, Class A, SEQ, 5.09%, 10/19/55(1) | 6,267,000 | 6,268,392 | |||||||||
Vertical Bridge CC LLC, Series 2025-1A, Class A, SEQ, 5.16%, 8/16/55(1) | 7,444,627 | 7,455,489 | |||||||||
TOTAL ASSET-BACKED SECURITIES (Cost $83,777,482) | 83,242,979 | ||||||||||
U.S. TREASURY SECURITIES — 2.7% | |||||||||||
U.S. Treasury Notes, 1.625%, 10/31/26(4) | 20,395,000 | 19,978,680 | |||||||||
U.S. Treasury Notes, 4.00%, 5/31/30(4) | 50,350,000 | 51,012,811 | |||||||||
TOTAL U.S. TREASURY SECURITIES (Cost $70,261,604) | 70,991,491 | ||||||||||
COMMERCIAL MORTGAGE-BACKED SECURITIES — 2.3% | |||||||||||
Bank, Series 2018-BN15, Class D, 3.00%, 11/15/61(1) | 2,505,000 | 2,058,880 | |||||||||
BBCMS Mortgage Trust, Series 2019-C3, Class D, 3.00%, 5/15/52(1) | 3,000,000 | 2,372,046 | |||||||||
BBCMS Mortgage Trust, Series 2019-C4, Class D, 3.25%, 8/15/52(1) | 3,359,000 | 2,119,664 | |||||||||
BBCMS Mortgage Trust, Series 2024-5C27, Class AS, SEQ, VRN, 6.41%, 7/15/57 | 10,991,000 | 11,548,429 | |||||||||
Benchmark Mortgage Trust, Series 2019-B13, Class D, 2.50%, 8/15/57(1) | 2,514,000 | 1,483,880 | |||||||||
Benchmark Mortgage Trust, Series 2020-B16, Class D, 2.50%, 2/15/53(1) | 5,544,000 | 4,180,580 | |||||||||
Schedule of Investments - Global Bond Fund | ||
Principal Amount/Shares | Value | ||||||||||
Benchmark Mortgage Trust, Series 2021-B31, Class D, 2.25%, 12/15/54(1) | $ | 2,618,000 | $ | 1,738,376 | |||||||
GS Mortgage Securities Trust, Series 2019-GC42, Class D, 2.80%, 9/10/52(1) | 5,175,784 | 3,803,077 | |||||||||
GS Mortgage Securities Trust, Series 2019-GSA1, Class E, 2.80%, 11/10/52(1) | 5,990,000 | 4,731,320 | |||||||||
Morgan Stanley Capital I Trust, Series 2018-H3, Class D, 3.00%, 7/15/51(1) | 2,392,000 | 2,002,858 | |||||||||
Morgan Stanley Capital I Trust, Series 2018-L1, Class D, 3.00%, 10/15/51(1) | 4,192,000 | 3,503,360 | |||||||||
ONNI Commerical Mortgage Trust, Series 2024-APT, Class A, SEQ, VRN, 5.57%, 7/15/39(1) | 11,242,000 | 11,471,719 | |||||||||
UBS Commercial Mortgage Trust, Series 2018-C15, Class D, VRN, 5.14%, 12/15/51(1) | 2,008,000 | 1,833,219 | |||||||||
WB Commercial Mortgage Trust, Series 2024-HQ, Class A, SEQ, VRN, 5.94%, 3/15/40(1) | 4,250,000 | 4,260,928 | |||||||||
Wells Fargo Commercial Mortgage Trust, Series 2017-C41, Class D, VRN, 2.60%, 11/15/50(1) | 2,067,000 | 1,747,309 | |||||||||
Wells Fargo Commercial Mortgage Trust, Series 2020-C55, Class D, 2.50%, 2/15/53(1) | 2,458,000 | 1,651,551 | |||||||||
TOTAL COMMERCIAL MORTGAGE-BACKED SECURITIES (Cost $57,556,291) | 60,507,196 | ||||||||||
PREFERRED SECURITIES — 2.2% | |||||||||||
Banks — 0.7% | |||||||||||
Citigroup, Inc., 3.875% | 7,483,000 | 7,445,503 | |||||||||
Citigroup, Inc., 6.25% | 4,430,000 | 4,472,900 | |||||||||
JPMorgan Chase & Co., 3.65% | 2,702,000 | 2,671,999 | |||||||||
M&T Bank Corp., 5.125% | 163,000 | 162,920 | |||||||||
Wells Fargo & Co., 3.90% | 3,985,000 | 3,961,268 | |||||||||
| 18,714,590 | |||||||||||
Capital Markets — 0.1% | |||||||||||
Charles Schwab Corp., 4.00% | 4,064,000 | 4,031,858 | |||||||||
Diversified Telecommunication Services — 0.1% | |||||||||||
Telefonica Europe BV, 2.88% | 1,600,000 | 1,814,329 | |||||||||
Oil, Gas and Consumable Fuels — 0.7% | |||||||||||
Energy Transfer LP, 6.625% | 4,235,000 | 4,234,522 | |||||||||
Energy Transfer LP, 6.50% | 6,722,000 | 6,759,468 | |||||||||
Eni SpA, 3.375% | 3,295,000 | 3,783,141 | |||||||||
Sunoco LP, 7.875%(1) | 2,525,000 | 2,566,069 | |||||||||
| 17,343,200 | |||||||||||
Trading Companies and Distributors — 0.6% | |||||||||||
Air Lease Corp., 4.65% | 5,590,000 | 5,536,509 | |||||||||
Aircastle Ltd., 5.25%(1) | 11,364,000 | 11,309,099 | |||||||||
| 16,845,608 | |||||||||||
TOTAL PREFERRED SECURITIES (Cost $57,355,878) | 58,749,585 | ||||||||||
COLLATERALIZED LOAN OBLIGATIONS — 2.0% | |||||||||||
Arbor Realty Commercial Real Estate Notes Ltd., Series 2021-FL4, Class A, VRN, 5.50%, (1-month SOFR plus 1.46%), 11/15/36(1) | $ | 2190983 | 2,192,077 | ||||||||
Cerberus Loan Funding XXXIX LP, Series 2022-3A, Class AR, VRN, 5.30%, (3-month SOFR plus 1.40%), 1/15/33(1) | 3,952,263 | 3,957,116 | |||||||||
Dryden 65 CLO Ltd., Series 2018-65A, Class C, VRN, 6.25%, (3-month SOFR plus 2.36%), 7/18/30(1) | 6,800,000 | 6,820,354 | |||||||||
Elmwood CLO 24 Ltd., Series 2023-3A, Class CR, VRN, 5.63%, (3-month SOFR plus 1.75%), 1/17/38(1) | 7,625,000 | 7,637,331 | |||||||||
LoanCore Issuer Ltd., Series 2021-CRE5, Class AS, VRN, 5.90%, (1-month SOFR plus 1.86%), 7/15/36(1) | 4,913,654 | 4,910,635 | |||||||||
Magnetite XLI Ltd., Series 2024-41A, Class C, VRN, 5.64%, (3-month SOFR plus 1.78%), 1/25/38(1) | 3,525,000 | 3,532,642 | |||||||||
Magnetite XXV Ltd., Series 2020-25A, Class C, VRN, 6.22%, (3-month SOFR plus 2.36%), 1/25/32(1) | 5,200,000 | 5,215,768 | |||||||||
Magnetite XXVIII Ltd., Series 2020-28A, Class CRR, VRN, 5.65%, (3-month SOFR plus 1.75%), 1/15/38(1) | 7,975,000 | 7,988,356 | |||||||||
MF1 Ltd., Series 2020-FL4, Class A, VRN, 5.85%, (1-month SOFR plus 1.81%), 12/15/35(1) | 1,142,056 | 1,142,646 | |||||||||
Mountain View CLO LLC, Series 2017-2A, Class B, VRN, 5.86%, (3-month SOFR plus 1.96%), 1/16/31(1) | 907,570 | 906,465 | |||||||||
Reese Park CLO Ltd., Series 2020-1A, Class CRR, VRN, 5.80%, (3-month SOFR plus 1.90%), 1/15/38(1) | 8,100,000 | 8,126,041 | |||||||||
TOTAL COLLATERALIZED LOAN OBLIGATIONS (Cost $51,933,905) | 52,429,431 | ||||||||||
MUNICIPAL SECURITIES — 0.5% | |||||||||||
California State University Rev., 2.98%, 11/1/51 | 825,000 | 574,189 | |||||||||
Schedule of Investments - Global Bond Fund | ||
Principal Amount/Shares | Value | ||||||||||
Commonwealth of Massachusetts GO, 2.66%, 9/1/39 | $ | 241,438 | $ | 205,142 | |||||||
Escambia County Health Facilities Authority Rev., (Baptist Hospital, Inc. Obligated Group), 3.61%, 8/15/40 (AG) | 725,000 | 601,548 | |||||||||
Golden State Tobacco Securitization Corp. Rev., 2.75%, 6/1/34 | 2,125,000 | 1,942,111 | |||||||||
Los Angeles Community College District GO, 6.75%, 8/1/49 | 800,000 | 906,898 | |||||||||
Los Angeles Department of Airports Rev., 6.58%, 5/15/39 | 255,000 | 277,957 | |||||||||
Michigan Strategic Fund Rev., (Flint Water Advocacy Fund), 3.23%, 9/1/47 | 1,600,000 | 1,243,504 | |||||||||
Missouri Highway & Transportation Commission Rev., 5.45%, 5/1/33 | 275,000 | 284,991 | |||||||||
New Jersey Turnpike Authority Rev., 7.10%, 1/1/41 | 270,000 | 316,111 | |||||||||
Ohio Turnpike & Infrastructure Commission Rev., 3.22%, 2/15/48 | 830,000 | 626,586 | |||||||||
Port Authority of New York & New Jersey Rev., 4.93%, 10/1/51 | 450,000 | 431,830 | |||||||||
Regents of the University of California Medical Center Pooled Rev., 3.26%, 5/15/60 | 450,000 | 296,479 | |||||||||
State of California GO, 4.60%, 4/1/28, Prerefunded at 100% of Par(5) | 120,000 | 122,472 | |||||||||
State of California GO, 7.60%, 11/1/40 | 20,000 | 24,767 | |||||||||
Sumter Landing Community Development District Rev., 5.57%, 10/1/40 (AG) | 470,000 | 489,143 | |||||||||
Sumter Landing Community Development District Rev., 5.74%, 10/1/45 (AG) | 710,000 | 732,281 | |||||||||
Sumter Landing Community Development District Rev., 5.82%, 10/1/54 (AG) | 1,295,000 | 1,328,620 | |||||||||
Texas Natural Gas Securitization Finance Corp. Rev., SEQ, 5.17%, 4/1/41 | 230,000 | 236,518 | |||||||||
United Nations Development Corp. Rev., (City of New York), Series A, 6.54%, 8/1/55 | 455,000 | 488,656 | |||||||||
University of California Rev., 3.07%, 5/15/51 | 670,000 | 465,435 | |||||||||
TOTAL MUNICIPAL SECURITIES (Cost $13,203,809) | 11,595,238 | ||||||||||
U.S. GOVERNMENT AGENCY SECURITIES — 0.1% | |||||||||||
FHLMC, 6.25%, 7/15/32 (Cost $2,467,928) | 2,000,000 | 2,275,848 | |||||||||
BANK LOAN OBLIGATIONS(6) — 0.1% | |||||||||||
Aerospace and Defense — 0.1% | |||||||||||
TransDigm, Inc., 2025 Term Loan K, 6.25%, (3-month SOFR plus 2.25%), 3/22/30 (Cost $1,822,634) | 1,814,221 | 1,817,741 | |||||||||
SHORT-TERM INVESTMENTS — 1.5% | |||||||||||
Money Market Funds — 0.0% | |||||||||||
State Street Institutional U.S. Government Money Market Fund, Premier Class | 108,489 | 108,489 | |||||||||
Repurchase Agreements — 1.5% | |||||||||||
Fixed Income Clearing Corp., (collateralized by various U.S. Treasury obligations, 4.50%, 11/15/54, valued at $40,989,769), at 4.15%, dated 10/31/25, due 11/3/25 (Delivery value $40,199,898) | 40,186,000 | ||||||||||
TOTAL SHORT-TERM INVESTMENTS (Cost $40,294,489) | 40,294,489 | ||||||||||
TOTAL INVESTMENT SECURITIES — 99.9% (Cost $2,664,223,953) | 2,626,143,681 | ||||||||||
OTHER ASSETS AND LIABILITIES — 0.1% | 3,161,924 | ||||||||||
TOTAL NET ASSETS — 100.0% | $ | 2,629,305,605 | |||||||||
Schedule of Investments - Global Bond Fund | ||
Currency Purchased | Currency Sold | Counterparty | Settlement Date | Unrealized Appreciation (Depreciation) | ||||||||||||||||
USD | 25,899,155 | AUD | 38,926,956 | UBS AG(7) | 12/17/25 | $ | 417,254 | |||||||||||||
USD | 3,859,565 | CAD | 5,321,100 | Citibank NA | 12/17/25 | 57,103 | ||||||||||||||
CNY | 743,339,348 | USD | 104,872,933 | Morgan Stanley & Co. LLC | 11/5/25 | (343,430) | ||||||||||||||
USD | 104,660,305 | CNY | 743,339,348 | Citibank NA | 11/5/25 | 130,802 | ||||||||||||||
USD | 101,255,931 | CNY | 717,195,761 | Morgan Stanley & Co. LLC | 12/3/25 | 90,566 | ||||||||||||||
USD | 2,303,464 | COP | 9,132,384,207 | Citibank NA | 12/17/25 | (51,763) | ||||||||||||||
USD | 6,305,372 | CZK | 130,894,614 | Goldman Sachs & Co. LLC | 12/17/25 | 98,665 | ||||||||||||||
USD | 5,136,696 | DKK | 32,514,596 | JPMorgan Chase Bank NA | 12/17/25 | 103,759 | ||||||||||||||
EUR | 4,306,000 | USD | 5,131,338 | JPMorgan Chase Bank NA | 12/17/25 | (155,918) | ||||||||||||||
EUR | 1,179,912 | USD | 1,394,968 | Morgan Stanley & Co. LLC | 12/17/25 | (31,623) | ||||||||||||||
EUR | 5,376,077 | USD | 6,402,119 | Morgan Stanley & Co. LLC | 12/17/25 | (190,266) | ||||||||||||||
EUR | 250,064 | USD | 297,596 | Morgan Stanley & Co. LLC | 12/17/25 | (8,657) | ||||||||||||||
EUR | 2,733,465 | USD | 3,256,980 | Morgan Stanley & Co. LLC | 12/17/25 | (98,564) | ||||||||||||||
EUR | 21,521,597 | USD | 25,602,187 | Morgan Stanley & Co. LLC | 12/17/25 | (734,795) | ||||||||||||||
EUR | 22,596,627 | USD | 26,894,989 | Morgan Stanley & Co. LLC | 12/17/25 | (785,441) | ||||||||||||||
EUR | 6,505,096 | USD | 7,672,106 | Morgan Stanley & Co. LLC | 12/17/25 | (155,715) | ||||||||||||||
EUR | 6,684,617 | USD | 7,789,402 | Morgan Stanley & Co. LLC | 12/17/25 | (65,580) | ||||||||||||||
EUR | 6,452,247 | USD | 7,635,034 | UBS AG(7) | 12/17/25 | (179,707) | ||||||||||||||
EUR | 1,813,173 | USD | 2,151,401 | UBS AG(7) | 12/17/25 | (56,348) | ||||||||||||||
EUR | 3,624,539 | USD | 4,221,747 | UBS AG(7) | 12/17/25 | (33,729) | ||||||||||||||
USD | 134,560 | EUR | 115,638 | Goldman Sachs & Co. LLC | 12/17/25 | 945 | ||||||||||||||
USD | 414,554,923 | EUR | 352,020,668 | JPMorgan Chase Bank NA | 12/17/25 | 7,808,353 | ||||||||||||||
USD | 21,916,167 | EUR | 18,494,328 | JPMorgan Chase Bank NA | 12/17/25 | 546,671 | ||||||||||||||
USD | 8,164,380 | EUR | 6,889,882 | JPMorgan Chase Bank NA | 12/17/25 | 203,382 | ||||||||||||||
USD | 5,520,674 | EUR | 4,619,289 | Morgan Stanley & Co. LLC | 12/17/25 | 183,261 | ||||||||||||||
USD | 4,089,889 | EUR | 3,464,919 | Morgan Stanley & Co. LLC | 12/17/25 | 86,306 | ||||||||||||||
USD | 444,071 | EUR | 382,316 | Morgan Stanley & Co. LLC | 12/17/25 | 2,319 | ||||||||||||||
USD | 1,793,355 | EUR | 1,538,338 | Morgan Stanley & Co. LLC | 12/17/25 | 15,864 | ||||||||||||||
USD | 2,302,750 | EUR | 1,975,381 | Morgan Stanley & Co. LLC | 12/17/25 | 20,272 | ||||||||||||||
GBP | 642,225 | USD | 873,560 | Citibank NA | 12/17/25 | (29,823) | ||||||||||||||
GBP | 206,995 | USD | 281,754 | Goldman Sachs & Co. LLC | 12/17/25 | (9,810) | ||||||||||||||
GBP | 210,278 | USD | 286,931 | JPMorgan Chase Bank NA | 12/17/25 | (10,673) | ||||||||||||||
GBP | 605,030 | USD | 825,306 | JPMorgan Chase Bank NA | 12/17/25 | (30,434) | ||||||||||||||
GBP | 1,126,226 | USD | 1,539,363 | Morgan Stanley & Co. LLC | 12/17/25 | (59,759) | ||||||||||||||
GBP | 1,319,475 | USD | 1,766,770 | UBS AG(7) | 12/17/25 | (33,282) | ||||||||||||||
GBP | 1,678,552 | USD | 2,247,488 | UBS AG(7) | 12/17/25 | (42,255) | ||||||||||||||
USD | 8,967,718 | GBP | 6,699,442 | Citibank NA | 12/17/25 | 166,182 | ||||||||||||||
USD | 24,160,718 | GBP | 17,872,368 | JPMorgan Chase Bank NA | 12/17/25 | 680,508 | ||||||||||||||
USD | 68,138,734 | GBP | 50,282,766 | Morgan Stanley & Co. LLC | 12/17/25 | 2,078,663 | ||||||||||||||
USD | 4,718,558 | GBP | 3,544,414 | Morgan Stanley & Co. LLC | 12/17/25 | 62,007 | ||||||||||||||
USD | 10,998,219 | IDR | 181,628,211,664 | UBS AG(7) | 12/17/25 | 85,029 | ||||||||||||||
USD | 2,253,036 | ILS | 7,491,319 | Bank of America NA | 12/17/25 | (46,136) | ||||||||||||||
USD | 105,341,773 | JPY | 15,410,793,426 | JPMorgan Chase Bank NA | 12/17/25 | 4,912,108 | ||||||||||||||
USD | 8,126,446 | MXN | 152,683,136 | Goldman Sachs & Co. LLC | 12/17/25 | (54,882) | ||||||||||||||
USD | 8,609,626 | MYR | 36,100,160 | Goldman Sachs & Co. LLC | 12/17/25 | (19,809) | ||||||||||||||
NZD | 9,967,320 | USD | 5,719,906 | UBS AG(7) | 12/17/25 | (5,671) | ||||||||||||||
USD | 38,590,695 | NZD | 64,629,771 | Morgan Stanley & Co. LLC | 12/17/25 | 1,538,641 | ||||||||||||||
USD | 3,349,568 | PLN | 12,191,235 | UBS AG(7) | 12/17/25 | 49,662 | ||||||||||||||
USD | 4,753,322 | SEK | 44,187,416 | Citibank NA | 12/17/25 | 90,120 | ||||||||||||||
USD | 3,376,516 | SGD | 4,303,100 | Morgan Stanley & Co. LLC | 12/17/25 | 59,699 | ||||||||||||||
USD | 9,858,014 | THB | 311,033,145 | Citibank NA | 12/17/25 | 205,768 | ||||||||||||||
| $ | 16,459,839 | |||||||||||||||||||
Schedule of Investments - Global Bond Fund | ||
| FUTURES CONTRACTS PURCHASED | ||||||||||||||
| Reference Entity | Contracts | Expiration Date | Notional Amount | Unrealized Appreciation (Depreciation)^ | ||||||||||
| Canadian 10-Year Government Bonds | 687 | December 2025 | $ | 60,130,562 | $ | 1,472,650 | ||||||||
| Euro-Bund 10-Year Bonds | 748 | December 2025 | 111,557,760 | 1,404,439 | ||||||||||
| Euro-OAT 10-Year Bonds | 814 | December 2025 | 115,002,179 | 2,339,437 | ||||||||||
| Japanese 10-Year Government Bonds | 23 | December 2025 | 20,303,160 | (12,089) | ||||||||||
| Japanese 10-Year Mini Government Bonds | 165 | December 2025 | 14,561,028 | (81,953) | ||||||||||
| Korean Treasury 10-Year Bonds | 450 | December 2025 | 36,739,077 | (746,026) | ||||||||||
| U.K. Gilt 10-Year Bonds | 933 | December 2025 | 114,748,328 | 3,844,972 | ||||||||||
| U.S. Treasury 5-Year Notes | 95 | December 2025 | 10,375,039 | (5,381) | ||||||||||
| U.S. Treasury Ultra Bonds | 211 | December 2025 | 25,590,344 | 1,029,707 | ||||||||||
| $ | 509,007,477 | $ | 9,245,756 | |||||||||||
| FUTURES CONTRACTS SOLD | ||||||||||||||
| Reference Entity | Contracts | Expiration Date | Notional Amount | Unrealized Appreciation (Depreciation)^ | ||||||||||
| Euro-Schatz 2-Year Bonds | 1,527 | December 2025 | $ | 188,471,148 | $ | (2,552) | ||||||||
| U.S. Treasury 2-Year Notes | 289 | December 2025 | 60,181,992 | 231,991 | ||||||||||
| U.S. Treasury 10-Year Notes | 1,431 | December 2025 | 161,233,453 | (225,798) | ||||||||||
| U.S. Treasury 10-Year Ultra Notes | 176 | December 2025 | 20,325,250 | 137,563 | ||||||||||
| $ | 430,211,843 | $ | 141,204 | |||||||||||
| CENTRALLY CLEARED CREDIT DEFAULT SWAP AGREEMENTS | ||||||||||||||||||||||||||
| Reference Entity | Type‡ | Fixed Rate Received (Paid) Quarterly | Termination Date | Notional Amount | Premiums Paid (Received) | Unrealized Appreciation (Depreciation) | Value^ | |||||||||||||||||||
| Markit CDX North America High Yield Index Series 44 | Buy | (5.00)% | 6/20/30 | $ | 23,300,000 | $ | (1,603,996) | $ | (283,038) | $ | (1,887,034) | |||||||||||||||
| Markit iTraxx Europe Senior Financial Index Series 44 | Sell | 1.00% | 12/20/30 | EUR | 79,600,000 | 1,756,761 | 174,120 | 1,930,881 | ||||||||||||||||||
| $ | 152,765 | $ | (108,918) | $ | 43,847 | |||||||||||||||||||||
Schedule of Investments - Global Bond Fund | ||
CENTRALLY CLEARED INTEREST RATE SWAP AGREEMENTS | ||||||||||||||||||||||||||
Floating Rate Index | Pay/Receive Floating Rate Index Semiannually | Fixed Rate | Termination Date | Notional Amount | Premiums Paid (Received) | Unrealized Appreciation (Depreciation) | Value | |||||||||||||||||||
6-month BBSW | Pay | 4.53% | 1/17/35 | AUD | 10,000 | $ | 393 | $ | (255) | $ | 138 | |||||||||||||||
| NOTES TO SCHEDULE OF INVESTMENTS | ||||||||
| AG | – | Assured Guaranty, Inc. | ||||||
| AUD | – | Australian Dollar | ||||||
| BBSW | – | Bank Bill Swap Rates | ||||||
| CAD | – | Canadian Dollar | ||||||
| CDX | – | Credit Derivatives Indexes | ||||||
| CNY | – | Chinese Yuan | ||||||
| COP | – | Colombian Peso | ||||||
| CZK | – | Czech Koruna | ||||||
| DKK | – | Danish Krone | ||||||
| EUR | – | Euro | ||||||
| FHLMC | – | Federal Home Loan Mortgage Corp. | ||||||
| FNMA | – | Federal National Mortgage Association | ||||||
| GBP | – | British Pound | ||||||
| GNMA | – | Government National Mortgage Association | ||||||
| GO | – | General Obligation | ||||||
| IDR | – | Indonesian Rupiah | ||||||
| ILS | – | Israeli Shekel | ||||||
| JPY | – | Japanese Yen | ||||||
| MXN | – | Mexican Peso | ||||||
| MYR | – | Malaysian Ringgit | ||||||
| NOK | – | Norwegian Krone | ||||||
| NZD | – | New Zealand Dollar | ||||||
| PLN | – | Polish Zloty | ||||||
| RFUCC | – | FTSE USD IBOR Consumer Cash Fallbacks | ||||||
| SEK | – | Swedish Krona | ||||||
| SEQ | – | Sequential Payer | ||||||
| SGD | – | Singapore Dollar | ||||||
| SOFR | – | Secured Overnight Financing Rate | ||||||
| TBA | – | To-Be-Announced. Security was purchased on a forward commitment basis with an approximate principal amount and maturity date. Actual principal amount and maturity date will be determined upon settlement. | ||||||
| THB | – | Thai Baht | ||||||
| UMBS | – | Uniform Mortgage-Backed Securities | ||||||
| USD | – | United States Dollar | ||||||
| VRN | – | Variable Rate Note. The rate adjusts periodically based upon the terms set forth in the security’s offering documents. The rate shown is effective at the period end and the reference rate and spread, if any, is indicated. The security's effective maturity date may be shorter than the final maturity date shown. | ||||||
Schedule of Investments - Global Bond Fund | ||
| Level 1 | Level 2 | Level 3 | |||||||||
| Assets | |||||||||||
| Investment Securities | |||||||||||
| Corporate Bonds | — | $ | 834,140,611 | — | |||||||
| Sovereign Governments and Agencies | — | 581,640,549 | — | ||||||||
| U.S. Government Agency Mortgage-Backed Securities | — | 325,797,693 | — | ||||||||
| Collateralized Mortgage Obligations | — | 271,679,668 | — | ||||||||
| Convertible Preferred Securities | — | 230,981,162 | — | ||||||||
| Asset-Backed Securities | — | 83,242,979 | — | ||||||||
| U.S. Treasury Securities | — | 70,991,491 | — | ||||||||
| Commercial Mortgage-Backed Securities | — | 60,507,196 | — | ||||||||
| Preferred Securities | — | 58,749,585 | — | ||||||||
| Collateralized Loan Obligations | — | 52,429,431 | — | ||||||||
| Municipal Securities | — | 11,595,238 | — | ||||||||
| U.S. Government Agency Securities | — | 2,275,848 | — | ||||||||
| Bank Loan Obligations | — | 1,817,741 | — | ||||||||
| Short-Term Investments | $ | 108,489 | 40,186,000 | — | |||||||
| $ | 108,489 | $ | 2,626,035,192 | — | |||||||
| Other Financial Instruments | |||||||||||
| Futures Contracts | $ | 1,399,261 | $ | 9,061,498 | — | ||||||
| Swap Agreements | — | 1,931,019 | — | ||||||||
| Forward Foreign Currency Exchange Contracts | — | 19,693,909 | — | ||||||||
| $ | 1,399,261 | $ | 30,686,426 | — | |||||||
| Liabilities | |||||||||||
| Other Financial Instruments | |||||||||||
| Futures Contracts | $ | 231,179 | $ | 842,620 | — | ||||||
| Swap Agreements | — | 1,887,034 | — | ||||||||
| Forward Foreign Currency Exchange Contracts | — | 3,234,070 | — | ||||||||
| $ | 231,179 | $ | 5,963,724 | — | |||||||
| Type of Risk Exposure | ||||||||||||||
| Credit | Foreign Currency | Interest Rate | Total | |||||||||||
| Asset Derivatives: | ||||||||||||||
| Receivable for variation margin on futures contracts* | — | — | $ | 25,572 | $ | 25,572 | ||||||||
| Unrealized appreciation on forward foreign currency exchange contracts | — | $ | 19,693,909 | — | 19,693,909 | |||||||||
| $ | 19,719,481 | |||||||||||||
| Liability Derivatives: | ||||||||||||||
| Payable for variation margin on futures contracts* | — | — | $ | 346,539 | $ | 346,539 | ||||||||
Payable for variation margin on swap agreements* | $ | 26,321 | — | 388 | 26,709 | |||||||||
| Unrealized depreciation on forward foreign currency exchange contracts | — | $ | 3,234,070 | — | 3,234,070 | |||||||||
| $ | 3,607,318 | |||||||||||||
Schedule of Investments - Global Bond Fund | ||
| Type of Risk Exposure | ||||||||||||||
| Credit | Foreign Currency | Interest Rate | Total | |||||||||||
| Net realized gain (loss) on: | ||||||||||||||
| Forward foreign currency exchange transactions | — | $ | 6,462,921 | — | $ | 6,462,921 | ||||||||
| Futures contract transactions | — | — | $ | (29,546,058) | (29,546,058) | |||||||||
| Swap agreement transactions | $ | (2,997,906) | — | (35) | (2,997,941) | |||||||||
| $ | (26,081,078) | |||||||||||||
| Change in net unrealized appreciation (depreciation) on: | ||||||||||||||
| Forward foreign currency exchange contracts | — | $ | (12,280,701) | — | $ | (12,280,701) | ||||||||
| Futures contracts | — | — | $ | 20,331,695 | 20,331,695 | |||||||||
| Swap agreements | $ | 2,552,355 | — | (255) | 2,552,100 | |||||||||
| $ | 10,603,094 | |||||||||||||
| Statements of Assets and Liabilities | ||
| OCTOBER 31, 2025 | ||||||||
| Emerging Markets Debt Fund | Global Bond Fund | |||||||
| Assets | ||||||||
| Investment securities, at value | $ | 509,718,786 | $ | 2,626,143,681 | ||||
| Investment made with cash collateral received for securities on loan, at value | 1,523,610 | — | ||||||
| Cash | 2,668,782 | 105,064 | ||||||
| Foreign currency holdings, at value | — | 221,037 | ||||||
| Receivable for investments sold | 1,634,145 | 13,028,928 | ||||||
| Receivable for capital shares sold | 19,659 | 71,549 | ||||||
| Receivable for variation margin on futures contracts | — | 25,572 | ||||||
| Unrealized appreciation on forward foreign currency exchange contracts | 13,048,762 | 19,693,909 | ||||||
| Swap agreements, at value | 1,541,742 | — | ||||||
| Interest and dividends receivable | 8,167,687 | 27,047,552 | ||||||
| Securities lending receivable | 771 | — | ||||||
| 538,323,944 | 2,686,337,292 | |||||||
| Liabilities | ||||||||
| Payable for collateral received for forward foreign currency exchange contracts | 1,328,782 | — | ||||||
| Payable for collateral received for swap agreements | 1,340,000 | — | ||||||
| Payable for collateral received for securities on loan | 1,523,610 | — | ||||||
| Payable for investments purchased | 3,221,725 | 52,088,599 | ||||||
| Payable for capital shares redeemed | 17,685 | 851,956 | ||||||
| Payable for variation margin on futures contracts | 76,875 | 346,539 | ||||||
| Payable for variation margin on swap agreements | 12,282 | 26,709 | ||||||
| Unrealized depreciation on forward foreign currency exchange contracts | 12,025,693 | 3,234,070 | ||||||
| Accrued management fees | 90,975 | 445,641 | ||||||
| Distribution and service fees payable | 197 | 445 | ||||||
| Accrued foreign taxes | — | 37,728 | ||||||
| 19,637,824 | 57,031,687 | |||||||
| Net Assets | $ | 518,686,120 | $ | 2,629,305,605 | ||||
| Net Assets Consist of: | ||||||||
| Capital paid in | $ | 589,123,277 | $ | 2,909,759,761 | ||||
| Distributable earnings (loss) | (70,437,157) | (280,454,156) | ||||||
| $ | 518,686,120 | $ | 2,629,305,605 | |||||
| Investment securities, at cost | $ | 477,961,678 | $ | 2,664,223,953 | ||||
| Investment securities on loan, at value | $ | 1,472,949 | — | |||||
| Investment made with cash collateral received for securities on loan, at cost | $ | 1,523,610 | — | |||||
| Foreign currency holdings, at cost | — | $ | 221,662 | |||||
| Statements of Assets and Liabilities | ||
| Fund/Class | Net Assets | Shares Outstanding | Net Asset Value Per Share | ||||||||
| Emerging Markets Debt Fund | |||||||||||
| Investor Class | $93,034,307 | 9,826,474 | $9.47 | ||||||||
| I Class | $3,291,933 | 347,405 | $9.48 | ||||||||
| Y Class | $34,438,072 | 3,637,292 | $9.47 | ||||||||
| A Class | $269,817 | 28,545 | $9.45 | ||||||||
| Maximum Offering Price Per Share (Net asset value divide by 0.955) | $9.90 | ||||||||||
| C Class | $65,575 | 6,960 | $9.42 | ||||||||
| R Class | $182,685 | 19,342 | $9.44 | ||||||||
| R5 Class | $48,266 | 5,098 | $9.47 | ||||||||
| R6 Class | $832 | 88 | $9.46 | ||||||||
| G Class | $387,354,633 | 40,881,573 | $9.48 | ||||||||
| Global Bond Fund | |||||||||||
| Investor Class | $366,370,322 | 41,428,045 | $8.84 | ||||||||
| I Class | $205,536,690 | 23,147,070 | $8.88 | ||||||||
| Y Class | $105,857,092 | 11,903,785 | $8.89 | ||||||||
| A Class | $1,292,854 | 147,220 | $8.78 | ||||||||
| Maximum Offering Price Per Share (Net asset value divide by 0.955) | $9.19 | ||||||||||
| C Class | $66,883 | 7,787 | $8.59 | ||||||||
| R Class | $264,868 | 30,372 | $8.72 | ||||||||
| R5 Class | $596,657 | 67,259 | $8.87 | ||||||||
| R6 Class | $6,608,859 | 744,875 | $8.87 | ||||||||
| G Class | $1,942,711,380 | 218,321,842 | $8.90 | ||||||||
| Statements of Operations | ||
| YEAR ENDED OCTOBER 31, 2025 | ||||||||
| Emerging Markets Debt Fund | Global Bond Fund | |||||||
| Investment Income (Loss) | ||||||||
| Income: | ||||||||
| Interest | $ | 41,064,747 | $ | 141,662,629 | ||||
| Dividends | — | 1,099,052 | ||||||
| Securities lending, net | 9,239 | — | ||||||
| Less foreign taxes withheld | (367,229) | (43,969) | ||||||
| 40,706,757 | 142,717,712 | |||||||
| Expenses: | ||||||||
| Management fees | 4,391,098 | 18,406,357 | ||||||
| Interest expenses | 136,944 | 288,140 | ||||||
| Distribution and service fees: | ||||||||
| A Class | 608 | 3,339 | ||||||
| C Class | 584 | 645 | ||||||
| R Class | 966 | 1,249 | ||||||
| Trustees' fees and expenses | 37,733 | 191,041 | ||||||
| 4,567,933 | 18,890,771 | |||||||
| Fees waived | (3,325,241) | (13,304,523) | ||||||
| 1,242,692 | 5,586,248 | |||||||
| Net investment income (loss) | 39,464,065 | 137,131,464 | ||||||
| Realized and Unrealized Gain (Loss) | ||||||||
| Net realized gain (loss) on: | ||||||||
| Investment transactions* | 17,796,452 | (985,301) | ||||||
| Forward foreign currency exchange contract transactions | (11,175,341) | 6,462,921 | ||||||
| Futures contract transactions | (958,467) | (29,546,058) | ||||||
| Swap agreement transactions | (2,636,383) | (2,997,941) | ||||||
| Foreign currency translation transactions | (1,773,156) | 707,367 | ||||||
| 1,253,105 | (26,359,012) | |||||||
| Change in net unrealized appreciation (depreciation) on: | ||||||||
| Investments** | 22,945,789 | 44,730,849 | ||||||
| Forward foreign currency exchange contracts | 1,550,787 | (12,280,701) | ||||||
| Futures contracts | 1,063,844 | 20,331,695 | ||||||
| Swap agreements | 1,795,257 | 2,552,100 | ||||||
| Translation of assets and liabilities in foreign currencies | 1,422,704 | 182,095 | ||||||
| 28,778,381 | 55,516,038 | |||||||
| Net realized and unrealized gain (loss) | 30,031,486 | 29,157,026 | ||||||
| Net Increase (Decrease) in Net Assets Resulting from Operations | $ | 69,495,551 | $ | 166,288,490 | ||||
| *Net of foreign tax expenses paid (refunded) | $ | 320,009 | $ | 1,412 | ||||
| **Includes (increase) decrease in accrued foreign taxes | $ | 4,812 | $ | (16,066) | ||||
| Statements of Changes in Net Assets | ||
| YEARS ENDED OCTOBER 31, 2025 AND OCTOBER 31, 2024 | ||||||||||||||
| Emerging Markets Debt Fund | Global Bond Fund | |||||||||||||
| Increase (Decrease) in Net Assets | October 31, 2025 | October 31, 2024 | October 31, 2025 | October 31, 2024 | ||||||||||
| Operations | ||||||||||||||
| Net investment income (loss) | $ | 39,464,065 | $ | 40,386,499 | $ | 137,131,464 | $ | 136,769,092 | ||||||
| Net realized gain (loss) | 1,253,105 | (15,660,216) | (26,359,012) | (77,996,337) | ||||||||||
| Change in net unrealized appreciation (depreciation) | 28,778,381 | 56,388,887 | 55,516,038 | 235,033,512 | ||||||||||
| Net increase (decrease) in net assets resulting from operations | 69,495,551 | 81,115,170 | 166,288,490 | 293,806,267 | ||||||||||
| Distributions to Shareholders | ||||||||||||||
| From earnings: | ||||||||||||||
| Investor Class | (4,868,791) | (4,772,930) | (14,619,460) | (9,255,870) | ||||||||||
| I Class | (194,888) | (272,234) | (8,118,092) | (4,749,501) | ||||||||||
| Y Class | (1,802,191) | (1,606,202) | (4,220,193) | (2,415,070) | ||||||||||
| A Class | (12,598) | (13,525) | (49,884) | (32,399) | ||||||||||
| C Class | (2,591) | (362) | (1,839) | (2,772) | ||||||||||
| R Class | (10,069) | (9,161) | (8,059) | (3,325) | ||||||||||
| R5 Class | (2,557) | (3,892) | (99,026) | (155,833) | ||||||||||
| R6 Class | (2,439) | (16,683) | (282,437) | (188,465) | ||||||||||
| G Class | (28,882,987) | (33,272,440) | (116,391,902) | (81,644,781) | ||||||||||
| Decrease in net assets from distributions | (35,779,111) | (39,967,429) | (143,790,892) | (98,448,016) | ||||||||||
| Capital Share Transactions | ||||||||||||||
Net increase (decrease) in net assets from capital share transactions (Note 5) | (147,717,806) | (15,773,755) | (622,531,789) | 516,224,826 | ||||||||||
| Net increase (decrease) in net assets | (114,001,366) | 25,373,986 | (600,034,191) | 711,583,077 | ||||||||||
| Net Assets | ||||||||||||||
| Beginning of period | 632,687,486 | 607,313,500 | 3,229,339,796 | 2,517,756,719 | ||||||||||
| End of period | $ | 518,686,120 | $ | 632,687,486 | $ | 2,629,305,605 | $ | 3,229,339,796 | ||||||
| Notes to Financial Statements | ||
| Emerging Markets Debt Fund | Investor, I, Y, A, C, R, R5, R6, G | ||||
| Global Bond Fund | Investor, I, Y, A, C, R, R5, R6, G | ||||
| Emerging Markets Debt Fund | Annual Management Fee | Effective Annual Management Fee After Waiver | Management Fee Waived | ||||||||
| Investor Class | 0.96% | 0.92% | $37,969 | ||||||||
| I Class | 0.86% | 0.82% | $1,488 | ||||||||
| Y Class | 0.76% | 0.72% | $13,574 | ||||||||
| A Class | 0.96% | 0.92% | $102 | ||||||||
| C Class | 0.96% | 0.92% | $25 | ||||||||
| R Class | 0.96% | 0.92% | $86 | ||||||||
| R5 Class | 0.76% | 0.72% | $20 | ||||||||
| R6 Class | 0.71% | 0.67% | $19 | ||||||||
| G Class | 0.71% | 0.00% | $3,271,958 | ||||||||
| Global Bond Fund | Annual Management Fee | Management Fee Waived | ||||||
| Investor Class | 0.83% | — | ||||||
| I Class | 0.73% | — | ||||||
| Y Class | 0.63% | — | ||||||
| A Class | 0.83% | — | ||||||
| C Class | 0.83% | — | ||||||
| R Class | 0.83% | — | ||||||
| R5 Class | 0.63% | — | ||||||
| R6 Class | 0.58% | — | ||||||
| G Class | 0.00%(1) | $13,304,523 | ||||||
| Related Party | % of Outstanding Shares | |||||||
| Emerging Markets Debt Fund | American Century Asset Allocation Portfolios, Inc | 54% | ||||||
| Global Bond Fund | American Century Asset Allocation Portfolios, Inc | 52% | ||||||
| Emerging Markets Debt Fund | Global Bond Fund | |||||||
| Purchases of U.S. Treasury and Government Agency obligations | $ | 30,139,903 | $ | 1,752,438,562 | ||||
| Purchases of other investment securities | 547,990,952 | 2,440,919,110 | ||||||
| Total Purchases | $ | 578,130,855 | $ | 4,193,357,672 | ||||
| Sales of U.S. Treasury and Government Agency obligations | $ | 21,287,893 | $ | 1,924,501,250 | ||||
| Sales of other investment securities | 701,092,714 | 2,892,772,327 | ||||||
| Total Sales | $ | 722,380,607 | $ | 4,817,273,577 | ||||
Year ended October 31, 2025 | Year ended October 31, 2024 | |||||||||||||
| Shares | Amount | Shares | Amount | |||||||||||
| Emerging Markets Debt Fund | ||||||||||||||
| Investor Class | ||||||||||||||
| Sold | 554,220 | $ | 4,911,263 | 681,361 | $ | 6,024,489 | ||||||||
| Issued in reinvestment of distributions | 533,140 | 4,839,348 | 536,727 | 4,763,657 | ||||||||||
| Redeemed | (1,122,559) | (10,066,573) | (1,732,963) | (15,302,986) | ||||||||||
| (35,199) | (315,962) | (514,875) | (4,514,840) | |||||||||||
| I Class | ||||||||||||||
| Sold | 514,098 | 4,627,187 | 493,137 | 4,381,400 | ||||||||||
| Issued in reinvestment of distributions | 21,506 | 194,888 | 30,644 | 272,234 | ||||||||||
| Redeemed | (657,347) | (5,919,266) | (680,621) | (6,041,541) | ||||||||||
| (121,743) | (1,097,191) | (156,840) | (1,387,907) | |||||||||||
| Y Class | ||||||||||||||
| Sold | 876,902 | 7,852,593 | 773,260 | 6,851,071 | ||||||||||
| Issued in reinvestment of distributions | 198,356 | 1,801,912 | 180,999 | 1,606,202 | ||||||||||
| Redeemed | (726,176) | (6,531,316) | (559,402) | (4,972,808) | ||||||||||
| 349,082 | 3,123,189 | 394,857 | 3,484,465 | |||||||||||
| A Class | ||||||||||||||
| Sold | 12,597 | 116,049 | 5,479 | 49,453 | ||||||||||
| Issued in reinvestment of distributions | 1,392 | 12,598 | 1,526 | 13,525 | ||||||||||
| Redeemed | (16,131) | (145,621) | (4,981) | (44,650) | ||||||||||
| (2,142) | (16,974) | 2,024 | 18,328 | |||||||||||
| C Class | ||||||||||||||
| Sold | 2,197 | 19,000 | 3,734 | 34,166 | ||||||||||
| Issued in reinvestment of distributions | 285 | 2,591 | 41 | 362 | ||||||||||
| Redeemed | (172) | (1,525) | — | — | ||||||||||
| 2,310 | 20,066 | 3,775 | 34,528 | |||||||||||
| R Class | ||||||||||||||
| Sold | 10,299 | 93,025 | 8,102 | 71,703 | ||||||||||
| Issued in reinvestment of distributions | 1,109 | 10,069 | 1,033 | 9,161 | ||||||||||
| Redeemed | (15,313) | (139,282) | (4,258) | (37,527) | ||||||||||
| (3,905) | (36,188) | 4,877 | 43,337 | |||||||||||
| R5 Class | ||||||||||||||
| Sold | 39 | 357 | 39 | 351 | ||||||||||
| Issued in reinvestment of distributions | 282 | 2,557 | 439 | 3,892 | ||||||||||
| Redeemed | (17) | (155) | (3,147) | (28,810) | ||||||||||
| 304 | 2,759 | (2,669) | (24,567) | |||||||||||
| R6 Class | ||||||||||||||
| Sold | 503 | 4,415 | 2,535 | 22,359 | ||||||||||
| Issued in reinvestment of distributions | 277 | 2,439 | 1,880 | 16,683 | ||||||||||
| Redeemed | (32,532) | (288,613) | (3,824) | (34,231) | ||||||||||
| (31,752) | (281,759) | 591 | 4,811 | |||||||||||
| G Class | ||||||||||||||
| Sold | 2,937,017 | 26,452,252 | 4,551,568 | 40,593,552 | ||||||||||
| Issued in reinvestment of distributions | 3,194,441 | 28,882,987 | 3,748,656 | 33,272,440 | ||||||||||
| Redeemed | (22,378,412) | (204,450,985) | (9,757,224) | (87,297,902) | ||||||||||
| (16,246,954) | (149,115,746) | (1,457,000) | (13,431,910) | |||||||||||
| Net increase (decrease) | (16,089,999) | $ | (147,717,806) | (1,725,260) | $ | (15,773,755) | ||||||||
Year ended October 31, 2025 | Year ended October 31, 2024 | |||||||||||||
| Shares | Amount | Shares | Amount | |||||||||||
| Global Bond Fund | ||||||||||||||
| Investor Class | ||||||||||||||
| Sold | 646,875 | $ | 5,670,286 | 11,642,038 | $ | 100,142,761 | ||||||||
| Issued in reinvestment of distributions | 1,678,848 | 14,614,518 | 1,074,300 | 9,254,857 | ||||||||||
| Redeemed | (2,586,954) | (22,500,017) | (2,634,939) | (22,740,003) | ||||||||||
| (261,231) | (2,215,213) | 10,081,399 | 86,657,615 | |||||||||||
| I Class | ||||||||||||||
| Sold | 2,546,444 | 22,350,747 | 2,436,201 | 21,093,197 | ||||||||||
| Issued in reinvestment of distributions | 928,884 | 8,117,418 | 549,368 | 4,748,144 | ||||||||||
| Redeemed | (2,046,495) | (17,886,510) | (1,905,943) | (16,619,619) | ||||||||||
| 1,428,833 | 12,581,655 | 1,079,626 | 9,221,722 | |||||||||||
| Y Class | ||||||||||||||
| Sold | 2,844,382 | 24,989,573 | 5,260,089 | 45,669,134 | ||||||||||
| Issued in reinvestment of distributions | 482,237 | 4,219,587 | 279,120 | 2,415,070 | ||||||||||
| Redeemed | (2,324,219) | (20,411,168) | (1,615,581) | (14,071,641) | ||||||||||
| 1,002,400 | 8,797,992 | 3,923,628 | 34,012,563 | |||||||||||
| A Class | ||||||||||||||
| Sold | 21,078 | 182,675 | 23,941 | 205,859 | ||||||||||
| Issued in reinvestment of distributions | 5,696 | 49,241 | 3,746 | 32,054 | ||||||||||
| Redeemed | (43,334) | (375,885) | (24,594) | (210,440) | ||||||||||
| (16,560) | (143,969) | 3,093 | 27,473 | |||||||||||
| C Class | ||||||||||||||
| Sold | 200 | 1,700 | 1,799 | 15,069 | ||||||||||
| Issued in reinvestment of distributions | 217 | 1,839 | 326 | 2,736 | ||||||||||
| Redeemed | (3,038) | (25,822) | (14,024) | (116,998) | ||||||||||
| (2,621) | (22,283) | (11,899) | (99,193) | |||||||||||
| R Class | ||||||||||||||
| Sold | 21,081 | 180,695 | 20,087 | 170,503 | ||||||||||
| Issued in reinvestment of distributions | 937 | 8,059 | 392 | 3,325 | ||||||||||
| Redeemed | (15,615) | (134,471) | (11,789) | (100,280) | ||||||||||
| 6,403 | 54,283 | 8,690 | 73,548 | |||||||||||
| R5 Class | ||||||||||||||
| Sold | 238 | 2,088 | 728 | 6,384 | ||||||||||
| Issued in reinvestment of distributions | 11,364 | 99,026 | 18,047 | 155,833 | ||||||||||
| Redeemed | (573,531) | (5,002,082) | (91,968) | (794,513) | ||||||||||
| (561,929) | (4,900,968) | (73,193) | (632,296) | |||||||||||
| R6 Class | ||||||||||||||
| Sold | 126,026 | 1,102,096 | 197,161 | 1,709,096 | ||||||||||
| Issued in reinvestment of distributions | 32,357 | 282,437 | 21,832 | 188,465 | ||||||||||
| Redeemed | (218,159) | (1,911,521) | (202,624) | (1,748,815) | ||||||||||
| (59,776) | (526,988) | 16,369 | 148,746 | |||||||||||
| G Class | ||||||||||||||
| Sold | 28,789,421 | 253,765,299 | 82,649,973 | 716,847,635 | ||||||||||
| Issued in reinvestment of distributions | 13,308,913 | 116,391,902 | 9,436,747 | 81,644,781 | ||||||||||
| Redeemed | (114,124,295) | (1,006,313,499) | (47,219,846) | (411,677,768) | ||||||||||
| (72,025,961) | (636,156,298) | 44,866,874 | 386,814,648 | |||||||||||
| Net increase (decrease) | (70,490,442) | $ | (622,531,789) | 59,894,587 | $ | 516,224,826 | ||||||||
| Emerging Markets Debt Fund | $ | 43,343,333 | |||
| Global Bond Fund | $ | 144,751,289 | |||
| Emerging Markets Debt Fund | $ | 2,114,507,832 | |||
| Global Bond Fund | $ | 1,133,525,005 | |||
Futures Contracts Purchased | Futures Contracts Sold | |||||||
| Emerging Markets Debt Fund | $ | 71,033,449 | $ | 31,138,930 | ||||
| Global Bond Fund | $ | 654,411,375 | $ | 420,591,807 | ||||
| Emerging Markets Debt Fund | $ | 25,895,676 | |||
| Global Bond Fund | $ | 6,423 | |||
The tax character of distributions paid during the years ended October 31, 2025 and October 31, 2024 were as follows: | ||||||||||||||
| 2025 | 2024 | |||||||||||||
| Distributions Paid From: | Distributions Paid From: | |||||||||||||
| Ordinary Income | Long-term Capital Gains | Ordinary Income | Long-term Capital Gains | |||||||||||
| Emerging Markets Debt Fund | $ | 35,779,111 | — | $ | 39,967,429 | — | ||||||||
| Global Bond Fund | $ | 143,790,892 | — | $ | 98,448,016 | — | ||||||||
| Emerging Markets Debt Fund | Global Bond Fund | |||||||
| Federal tax cost of investments | $ | 479,005,389 | $ | 2,665,054,734 | ||||
| Gross tax appreciation of investments | $ | 36,432,276 | $ | 56,468,111 | ||||
| Gross tax depreciation of investments | (4,195,269) | (95,379,164) | ||||||
| Net tax appreciation (depreciation) of investments | 32,237,007 | (38,911,053) | ||||||
| Net tax appreciation (depreciation) on derivatives and translation of assets and liabilities in foreign currencies | 225,340 | (627,702) | ||||||
| Net tax appreciation (depreciation) | $ | 32,462,347 | $ | (39,538,755) | ||||
| Other book-to-tax adjustments | $ | (895,627) | $ | (382,665) | ||||
| Undistributed ordinary income | $ | 1,690,181 | $ | 34,530,661 | ||||
| Accumulated short-term capital losses | $ | (57,394,741) | $ | (82,155,063) | ||||
| Accumulated long-term capital losses | $ | (46,299,317) | $ | (192,908,334) | ||||
| Financial Highlights | ||
| For a Share Outstanding Throughout the Years Ended October 31 (except as noted) | |||||||||||||||||||||||||||||||||||||||||
| Per-Share Data | Ratios and Supplemental Data | ||||||||||||||||||||||||||||||||||||||||
| Income From Investment Operations*: | Ratio to Average Net Assets of†: | ||||||||||||||||||||||||||||||||||||||||
Net Asset Value, Beginning of Period | Net Investment Income (Loss)(1) | Net Realized and Unrealized Gain (Loss) | Total From Investment Operations | Distributions From Net Investment Income | Net Asset Value, End of Period | Total Return(2) | Operating Expenses | Operating Expenses (before expense waiver) | Net Investment Income (Loss) | Net Investment Income (Loss) (before expense waiver) | Portfolio Turnover Rate | Net Assets, End of Period (in thousands) | |||||||||||||||||||||||||||||
| Emerging Markets Debt Fund | |||||||||||||||||||||||||||||||||||||||||
| Investor Class | |||||||||||||||||||||||||||||||||||||||||
| 2025 | $8.92 | 0.54 | 0.51 | 1.05 | (0.50) | $9.47 | 12.16% | 0.95% | 0.99% | 6.01% | 5.97% | 105% | $93,034 | ||||||||||||||||||||||||||||
| 2024 | $8.36 | 0.50 | 0.56 | 1.06 | (0.50) | $8.92 | 12.78% | 0.95% | 0.98% | 5.60% | 5.57% | 98% | $88,007 | ||||||||||||||||||||||||||||
| 2023 | $8.22 | 0.48 | 0.10 | 0.58 | (0.44) | $8.36 | 6.95% | 1.00% | 1.01% | 5.54% | 5.53% | 66% | $86,778 | ||||||||||||||||||||||||||||
| 2022 | $10.48 | 0.43 | (2.49) | (2.06) | (0.20) | $8.22 | (19.89)% | 0.98% | 0.98% | 4.70% | 4.70% | 125% | $85,456 | ||||||||||||||||||||||||||||
| 2021 | $10.32 | 0.40 | 0.15 | 0.55 | (0.39) | $10.48 | 5.29% | 0.97% | 0.97% | 3.77% | 3.77% | 51% | $103,626 | ||||||||||||||||||||||||||||
| I Class | |||||||||||||||||||||||||||||||||||||||||
| 2025 | $8.93 | 0.55 | 0.51 | 1.06 | (0.51) | $9.48 | 12.26% | 0.85% | 0.89% | 6.11% | 6.07% | 105% | $3,292 | ||||||||||||||||||||||||||||
| 2024 | $8.37 | 0.51 | 0.55 | 1.06 | (0.50) | $8.93 | 12.88% | 0.85% | 0.88% | 5.70% | 5.67% | 98% | $4,190 | ||||||||||||||||||||||||||||
| 2023 | $8.22 | 0.49 | 0.11 | 0.60 | (0.45) | $8.37 | 7.19% | 0.90% | 0.91% | 5.64% | 5.63% | 66% | $5,237 | ||||||||||||||||||||||||||||
| 2022 | $10.47 | 0.44 | (2.48) | (2.04) | (0.21) | $8.22 | (19.74)% | 0.88% | 0.88% | 4.80% | 4.80% | 125% | $4,887 | ||||||||||||||||||||||||||||
| 2021 | $10.32 | 0.41 | 0.14 | 0.55 | (0.40) | $10.47 | 5.30% | 0.87% | 0.87% | 3.87% | 3.87% | 51% | $12,356 | ||||||||||||||||||||||||||||
| Y Class | |||||||||||||||||||||||||||||||||||||||||
| 2025 | $8.92 | 0.56 | 0.51 | 1.07 | (0.52) | $9.47 | 12.38% | 0.75% | 0.79% | 6.21% | 6.17% | 105% | $34,438 | ||||||||||||||||||||||||||||
| 2024 | $8.36 | 0.51 | 0.56 | 1.07 | (0.51) | $8.92 | 13.01% | 0.75% | 0.78% | 5.80% | 5.77% | 98% | $29,345 | ||||||||||||||||||||||||||||
| 2023 | $8.22 | 0.50 | 0.10 | 0.60 | (0.46) | $8.36 | 7.17% | 0.80% | 0.81% | 5.74% | 5.73% | 66% | $24,197 | ||||||||||||||||||||||||||||
| 2022 | $10.47 | 0.45 | (2.48) | (2.03) | (0.22) | $8.22 | (19.67)% | 0.78% | 0.78% | 4.90% | 4.90% | 125% | $21,008 | ||||||||||||||||||||||||||||
| 2021 | $10.32 | 0.42 | 0.14 | 0.56 | (0.41) | $10.47 | 5.40% | 0.77% | 0.77% | 3.97% | 3.97% | 51% | $26,539 | ||||||||||||||||||||||||||||
| A Class | |||||||||||||||||||||||||||||||||||||||||
| 2025 | $8.91 | 0.52 | 0.50 | 1.02 | (0.48) | $9.45 | 11.88% | 1.20% | 1.24% | 5.76% | 5.72% | 105% | $270 | ||||||||||||||||||||||||||||
| 2024 | $8.35 | 0.47 | 0.56 | 1.03 | (0.47) | $8.91 | 12.52% | 1.20% | 1.23% | 5.35% | 5.32% | 98% | $273 | ||||||||||||||||||||||||||||
| 2023 | $8.21 | 0.46 | 0.10 | 0.56 | (0.42) | $8.35 | 6.70% | 1.25% | 1.26% | 5.29% | 5.28% | 66% | $239 | ||||||||||||||||||||||||||||
| 2022 | $10.47 | 0.41 | (2.49) | (2.08) | (0.18) | $8.21 | (20.09)% | 1.23% | 1.23% | 4.45% | 4.45% | 125% | $203 | ||||||||||||||||||||||||||||
| 2021 | $10.31 | 0.38 | 0.14 | 0.52 | (0.36) | $10.47 | 5.03% | 1.22% | 1.22% | 3.52% | 3.52% | 51% | $271 | ||||||||||||||||||||||||||||
| C Class | |||||||||||||||||||||||||||||||||||||||||
| 2025 | $8.88 | 0.44 | 0.51 | 0.95 | (0.41) | $9.42 | 10.95% | 1.95% | 1.99% | 5.01% | 4.97% | 105% | $66 | ||||||||||||||||||||||||||||
| 2024 | $8.32 | 0.42 | 0.55 | 0.97 | (0.41) | $8.88 | 11.72% | 1.95% | 1.98% | 4.60% | 4.57% | 98% | $41 | ||||||||||||||||||||||||||||
| 2023 | $8.18 | 0.39 | 0.10 | 0.49 | (0.35) | $8.32 | 5.92% | 2.00% | 2.01% | 4.54% | 4.53% | 66% | $7 | ||||||||||||||||||||||||||||
| 2022 | $10.45 | 0.34 | (2.48) | (2.14) | (0.13) | $8.18 | (20.67)% | 1.98% | 1.98% | 3.70% | 3.70% | 125% | $17 | ||||||||||||||||||||||||||||
| 2021 | $10.29 | 0.30 | 0.14 | 0.44 | (0.28) | $10.45 | 4.25% | 1.97% | 1.97% | 2.77% | 2.77% | 51% | $36 | ||||||||||||||||||||||||||||
| For a Share Outstanding Throughout the Years Ended October 31 (except as noted) | |||||||||||||||||||||||||||||||||||||||||
| Per-Share Data | Ratios and Supplemental Data | ||||||||||||||||||||||||||||||||||||||||
| Income From Investment Operations*: | Ratio to Average Net Assets of†: | ||||||||||||||||||||||||||||||||||||||||
Net Asset Value, Beginning of Period | Net Investment Income (Loss)(1) | Net Realized and Unrealized Gain (Loss) | Total From Investment Operations | Distributions From Net Investment Income | Net Asset Value, End of Period | Total Return(2) | Operating Expenses | Operating Expenses (before expense waiver) | Net Investment Income (Loss) | Net Investment Income (Loss) (before expense waiver) | Portfolio Turnover Rate | Net Assets, End of Period (in thousands) | |||||||||||||||||||||||||||||
| Emerging Markets Debt Fund | |||||||||||||||||||||||||||||||||||||||||
| R Class | |||||||||||||||||||||||||||||||||||||||||
| 2025 | $8.90 | 0.49 | 0.51 | 1.00 | (0.46) | $9.44 | 11.61% | 1.45% | 1.49% | 5.51% | 5.47% | 105% | $183 | ||||||||||||||||||||||||||||
| 2024 | $8.34 | 0.45 | 0.56 | 1.01 | (0.45) | $8.90 | 12.12% | 1.45% | 1.48% | 5.10% | 5.07% | 98% | $207 | ||||||||||||||||||||||||||||
| 2023 | $8.20 | 0.44 | 0.10 | 0.54 | (0.40) | $8.34 | 6.56% | 1.50% | 1.51% | 5.04% | 5.03% | 66% | $153 | ||||||||||||||||||||||||||||
| 2022 | $10.46 | 0.39 | (2.49) | (2.10) | (0.16) | $8.20 | (20.29)% | 1.48% | 1.48% | 4.20% | 4.20% | 125% | $148 | ||||||||||||||||||||||||||||
| 2021 | $10.30 | 0.35 | 0.14 | 0.49 | (0.33) | $10.46 | 4.67% | 1.47% | 1.47% | 3.27% | 3.27% | 51% | $161 | ||||||||||||||||||||||||||||
| R5 Class | |||||||||||||||||||||||||||||||||||||||||
| 2025 | $8.92 | 0.56 | 0.51 | 1.07 | (0.52) | $9.47 | 12.38% | 0.75% | 0.79% | 6.21% | 6.17% | 105% | $48 | ||||||||||||||||||||||||||||
| 2024 | $8.36 | 0.51 | 0.56 | 1.07 | (0.51) | $8.92 | 13.01% | 0.75% | 0.78% | 5.80% | 5.77% | 98% | $43 | ||||||||||||||||||||||||||||
| 2023 | $8.22 | 0.50 | 0.10 | 0.60 | (0.46) | $8.36 | 7.17% | 0.80% | 0.81% | 5.74% | 5.73% | 66% | $62 | ||||||||||||||||||||||||||||
| 2022 | $10.48 | 0.46 | (2.50) | (2.04) | (0.22) | $8.22 | (19.75)% | 0.78% | 0.78% | 4.90% | 4.90% | 125% | $7 | ||||||||||||||||||||||||||||
| 2021 | $10.32 | 0.42 | 0.15 | 0.57 | (0.41) | $10.48 | 5.49% | 0.77% | 0.77% | 3.97% | 3.97% | 51% | $8 | ||||||||||||||||||||||||||||
| R6 Class | |||||||||||||||||||||||||||||||||||||||||
| 2025 | $8.93 | 0.62 | 0.44 | 1.06 | (0.53) | $9.46 | 12.32% | 0.70% | 0.74% | 6.26% | 6.22% | 105% | $1 | ||||||||||||||||||||||||||||
| 2024 | $8.36 | 0.52 | 0.57 | 1.09 | (0.52) | $8.93 | 12.93% | 0.70% | 0.73% | 5.85% | 5.82% | 98% | $284 | ||||||||||||||||||||||||||||
| 2023 | $8.22 | 0.51 | 0.09 | 0.60 | (0.46) | $8.36 | 7.35% | 0.75% | 0.76% | 5.79% | 5.78% | 66% | $261 | ||||||||||||||||||||||||||||
| 2022 | $10.48 | 0.46 | (2.50) | (2.04) | (0.22) | $8.22 | (19.71)% | 0.73% | 0.73% | 4.95% | 4.95% | 125% | $267 | ||||||||||||||||||||||||||||
| 2021 | $10.32 | 0.43 | 0.14 | 0.57 | (0.41) | $10.48 | 5.56% | 0.72% | 0.72% | 4.02% | 4.02% | 51% | $350 | ||||||||||||||||||||||||||||
| G Class | |||||||||||||||||||||||||||||||||||||||||
| 2025 | $8.93 | 0.63 | 0.51 | 1.14 | (0.59) | $9.48 | 13.20% | 0.03% | 0.74% | 6.93% | 6.22% | 105% | $387,355 | ||||||||||||||||||||||||||||
| 2024 | $8.37 | 0.58 | 0.56 | 1.14 | (0.58) | $8.93 | 13.82% | 0.02% | 0.73% | 6.53% | 5.82% | 98% | $510,297 | ||||||||||||||||||||||||||||
| 2023 | $8.23 | 0.57 | 0.09 | 0.66 | (0.52) | $8.37 | 7.97% | 0.05% | 0.76% | 6.49% | 5.78% | 66% | $490,377 | ||||||||||||||||||||||||||||
| 2022 | $10.47 | 0.52 | (2.48) | (1.96) | (0.28) | $8.23 | (19.02)% | 0.02% | 0.73% | 5.66% | 4.95% | 125% | $433,025 | ||||||||||||||||||||||||||||
| 2021 | $10.32 | 0.50 | 0.14 | 0.64 | (0.49) | $10.47 | 6.20% | 0.01% | 0.72% | 4.73% | 4.02% | 51% | $578,327 | ||||||||||||||||||||||||||||
| Notes to Financial Highlights | ||
| For a Share Outstanding Throughout the Years Ended October 31 (except as noted) | |||||||||||||||||||||||||||||||||||||||||||||||
| Per-Share Data | Ratios and Supplemental Data | ||||||||||||||||||||||||||||||||||||||||||||||
| Income From Investment Operations*: | Distributions From: | Ratio to Average Net Assets of†: | |||||||||||||||||||||||||||||||||||||||||||||
Net Asset Value, Beginning of Period | Net Investment Income (Loss)(1) | Net Realized and Unrealized Gain (Loss) | Total From Investment Operations | Net Investment Income | Net Realized Gains | Total Distributions | Net Asset Value, End of Period | Total Return(2) | Operating Expenses | Operating Expenses (before expense waiver) | Net Investment Income (Loss) | Net Investment Income (Loss) (before expense waiver) | Portfolio Turnover Rate | Net Assets, End of Period (in thousands) | |||||||||||||||||||||||||||||||||
| Global Bond Fund | |||||||||||||||||||||||||||||||||||||||||||||||
| Investor Class | |||||||||||||||||||||||||||||||||||||||||||||||
| 2025 | $8.76 | 0.35 | 0.08 | 0.43 | (0.35) | — | (0.35) | $8.84 | 5.20% | 0.85% | 0.85% | 3.97% | 3.97% | 145% | $366,370 | ||||||||||||||||||||||||||||||||
| 2024 | $8.18 | 0.31 | 0.49 | 0.80 | (0.22) | — | (0.22) | $8.76 | 9.83% | 0.85% | 0.85% | 3.59% | 3.59% | 103% | $365,036 | ||||||||||||||||||||||||||||||||
| 2023 | $8.67 | 0.25 | (0.24) | 0.01 | (0.50) | — | (0.50) | $8.18 | 0.03% | 0.81% | 0.84% | 2.96% | 2.93% | 83% | $258,405 | ||||||||||||||||||||||||||||||||
| 2022 | $10.43 | 0.17 | (1.60) | (1.43) | (0.26) | (0.07) | (0.33) | $8.67 | (14.05)% | 0.80% | 0.84% | 1.81% | 1.77% | 97% | $252,306 | ||||||||||||||||||||||||||||||||
| 2021 | $10.40 | 0.15 | (0.09) | 0.06 | — | (0.03) | (0.03) | $10.43 | 0.59% | 0.80% | 0.84% | 1.46% | 1.42% | 119% | $298,790 | ||||||||||||||||||||||||||||||||
| I Class | |||||||||||||||||||||||||||||||||||||||||||||||
| 2025 | $8.79 | 0.36 | 0.10 | 0.46 | (0.37) | — | (0.37) | $8.88 | 5.31% | 0.75% | 0.75% | 4.07% | 4.07% | 145% | $205,537 | ||||||||||||||||||||||||||||||||
| 2024 | $8.21 | 0.32 | 0.49 | 0.81 | (0.23) | — | (0.23) | $8.79 | 9.87% | 0.75% | 0.75% | 3.69% | 3.69% | 103% | $190,966 | ||||||||||||||||||||||||||||||||
| 2023 | $8.70 | 0.28 | (0.26) | 0.02 | (0.51) | — | (0.51) | $8.21 | 0.13% | 0.71% | 0.74% | 3.06% | 3.03% | 83% | $169,387 | ||||||||||||||||||||||||||||||||
| 2022 | $10.46 | 0.18 | (1.60) | (1.42) | (0.27) | (0.07) | (0.34) | $8.70 | (13.93)% | 0.70% | 0.74% | 1.91% | 1.87% | 97% | $5,919 | ||||||||||||||||||||||||||||||||
| 2021 | $10.42 | 0.17 | (0.10) | 0.07 | —(3) | (0.03) | (0.03) | $10.46 | 0.70% | 0.70% | 0.74% | 1.56% | 1.52% | 119% | $18,975 | ||||||||||||||||||||||||||||||||
| Y Class | |||||||||||||||||||||||||||||||||||||||||||||||
| 2025 | $8.81 | 0.37 | 0.09 | 0.46 | (0.38) | — | (0.38) | $8.89 | 5.44% | 0.65% | 0.65% | 4.17% | 4.17% | 145% | $105,857 | ||||||||||||||||||||||||||||||||
| 2024 | $8.22 | 0.33 | 0.49 | 0.82 | (0.23) | — | (0.23) | $8.81 | 10.07% | 0.65% | 0.65% | 3.79% | 3.79% | 103% | $96,014 | ||||||||||||||||||||||||||||||||
| 2023 | $8.71 | 0.27 | (0.24) | 0.03 | (0.52) | — | (0.52) | $8.22 | 0.23% | 0.61% | 0.64% | 3.16% | 3.13% | 83% | $57,340 | ||||||||||||||||||||||||||||||||
| 2022 | $10.48 | 0.19 | (1.61) | (1.42) | (0.28) | (0.07) | (0.35) | $8.71 | (13.91)% | 0.60% | 0.64% | 2.01% | 1.97% | 97% | $53,201 | ||||||||||||||||||||||||||||||||
| 2021 | $10.44 | 0.18 | (0.10) | 0.08 | (0.01) | (0.03) | (0.04) | $10.48 | 0.80% | 0.60% | 0.64% | 1.66% | 1.62% | 119% | $62,274 | ||||||||||||||||||||||||||||||||
| A Class | |||||||||||||||||||||||||||||||||||||||||||||||
| 2025 | $8.69 | 0.32 | 0.10 | 0.42 | (0.33) | — | (0.33) | $8.78 | 4.90% | 1.10% | 1.10% | 3.72% | 3.72% | 145% | $1,293 | ||||||||||||||||||||||||||||||||
| 2024 | $8.12 | 0.29 | 0.48 | 0.77 | (0.20) | — | (0.20) | $8.69 | 9.57% | 1.10% | 1.10% | 3.34% | 3.34% | 103% | $1,423 | ||||||||||||||||||||||||||||||||
| 2023 | $8.62 | 0.23 | (0.25) | (0.02) | (0.48) | — | (0.48) | $8.12 | (0.34)% | 1.06% | 1.09% | 2.71% | 2.68% | 83% | $1,305 | ||||||||||||||||||||||||||||||||
| 2022 | $10.36 | 0.15 | (1.59) | (1.44) | (0.23) | (0.07) | (0.30) | $8.62 | (14.17)% | 1.05% | 1.09% | 1.56% | 1.52% | 97% | $1,144 | ||||||||||||||||||||||||||||||||
| 2021 | $10.36 | 0.13 | (0.10) | 0.03 | — | (0.03) | (0.03) | $10.36 | 0.30% | 1.05% | 1.09% | 1.21% | 1.17% | 119% | $1,450 | ||||||||||||||||||||||||||||||||
| C Class | |||||||||||||||||||||||||||||||||||||||||||||||
| 2025 | $8.49 | 0.25 | 0.09 | 0.34 | (0.24) | — | (0.24) | $8.59 | 4.11% | 1.85% | 1.85% | 2.97% | 2.97% | 145% | $67 | ||||||||||||||||||||||||||||||||
| 2024 | $7.95 | 0.21 | 0.48 | 0.69 | (0.15) | — | (0.15) | $8.49 | 8.76% | 1.85% | 1.85% | 2.59% | 2.59% | 103% | $88 | ||||||||||||||||||||||||||||||||
| 2023 | $8.46 | 0.16 | (0.23) | (0.07) | (0.44) | — | (0.44) | $7.95 | (1.01)% | 1.81% | 1.84% | 1.96% | 1.93% | 83% | $177 | ||||||||||||||||||||||||||||||||
| 2022 | $10.18 | 0.07 | (1.56) | (1.49) | (0.16) | (0.07) | (0.23) | $8.46 | (14.89)% | 1.80% | 1.84% | 0.81% | 0.77% | 97% | $256 | ||||||||||||||||||||||||||||||||
| 2021 | $10.26 | 0.05 | (0.10) | (0.05) | — | (0.03) | (0.03) | $10.18 | (0.48)% | 1.80% | 1.84% | 0.46% | 0.42% | 119% | $571 | ||||||||||||||||||||||||||||||||
| For a Share Outstanding Throughout the Years Ended October 31 (except as noted) | |||||||||||||||||||||||||||||||||||||||||||||||
| Per-Share Data | Ratios and Supplemental Data | ||||||||||||||||||||||||||||||||||||||||||||||
| Income From Investment Operations*: | Distributions From: | Ratio to Average Net Assets of†: | |||||||||||||||||||||||||||||||||||||||||||||
Net Asset Value, Beginning of Period | Net Investment Income (Loss)(1) | Net Realized and Unrealized Gain (Loss) | Total From Investment Operations | Net Investment Income | Net Realized Gains | Total Distributions | Net Asset Value, End of Period | Total Return(2) | Operating Expenses | Operating Expenses (before expense waiver) | Net Investment Income (Loss) | Net Investment Income (Loss) (before expense waiver) | Portfolio Turnover Rate | Net Assets, End of Period (in thousands) | |||||||||||||||||||||||||||||||||
| Global Bond Fund | |||||||||||||||||||||||||||||||||||||||||||||||
| R Class | |||||||||||||||||||||||||||||||||||||||||||||||
| 2025 | $8.63 | 0.30 | 0.09 | 0.39 | (0.30) | — | (0.30) | $8.72 | 4.60% | 1.35% | 1.35% | 3.47% | 3.47% | 145% | $265 | ||||||||||||||||||||||||||||||||
| 2024 | $8.07 | 0.27 | 0.48 | 0.75 | (0.19) | — | (0.19) | $8.63 | 9.30% | 1.35% | 1.35% | 3.09% | 3.09% | 103% | $207 | ||||||||||||||||||||||||||||||||
| 2023 | $8.56 | 0.20 | (0.23) | (0.03) | (0.46) | — | (0.46) | $8.07 | (0.47)% | 1.31% | 1.34% | 2.46% | 2.43% | 83% | $123 | ||||||||||||||||||||||||||||||||
| 2022 | $10.30 | 0.12 | (1.58) | (1.46) | (0.21) | (0.07) | (0.28) | $8.56 | (14.47)% | 1.30% | 1.34% | 1.31% | 1.27% | 97% | $260 | ||||||||||||||||||||||||||||||||
| 2021 | $10.32 | 0.10 | (0.09) | 0.01 | — | (0.03) | (0.03) | $10.30 | 0.11% | 1.30% | 1.34% | 0.96% | 0.92% | 119% | $287 | ||||||||||||||||||||||||||||||||
| R5 Class | |||||||||||||||||||||||||||||||||||||||||||||||
| 2025 | $8.79 | 0.37 | 0.09 | 0.46 | (0.38) | — | (0.38) | $8.87 | 5.33% | 0.65% | 0.65% | 4.17% | 4.17% | 145% | $597 | ||||||||||||||||||||||||||||||||
| 2024 | $8.20 | 0.33 | 0.49 | 0.82 | (0.23) | — | (0.23) | $8.79 | 10.09% | 0.65% | 0.65% | 3.79% | 3.79% | 103% | $5,529 | ||||||||||||||||||||||||||||||||
| 2023 | $8.70 | 0.27 | (0.25) | 0.02 | (0.52) | — | (0.52) | $8.20 | 0.12% | 0.61% | 0.64% | 3.16% | 3.13% | 83% | $5,760 | ||||||||||||||||||||||||||||||||
| 2022 | $10.46 | 0.19 | (1.60) | (1.41) | (0.28) | (0.07) | (0.35) | $8.70 | (13.84)% | 0.60% | 0.64% | 2.01% | 1.97% | 97% | $11,116 | ||||||||||||||||||||||||||||||||
| 2021 | $10.42 | 0.17 | (0.09) | 0.08 | (0.01) | (0.03) | (0.04) | $10.46 | 0.80% | 0.60% | 0.64% | 1.66% | 1.62% | 119% | $15,136 | ||||||||||||||||||||||||||||||||
| R6 Class | |||||||||||||||||||||||||||||||||||||||||||||||
| 2025 | $8.79 | 0.37 | 0.09 | 0.46 | (0.38) | — | (0.38) | $8.87 | 5.52% | 0.60% | 0.60% | 4.22% | 4.22% | 145% | $6,609 | ||||||||||||||||||||||||||||||||
| 2024 | $8.20 | 0.33 | 0.49 | 0.82 | (0.23) | — | (0.23) | $8.79 | 10.13% | 0.60% | 0.60% | 3.84% | 3.84% | 103% | $7,073 | ||||||||||||||||||||||||||||||||
| 2023 | $8.70 | 0.27 | (0.25) | 0.02 | (0.52) | — | (0.52) | $8.20 | 0.17% | 0.56% | 0.59% | 3.21% | 3.18% | 83% | $6,465 | ||||||||||||||||||||||||||||||||
| 2022 | $10.46 | 0.20 | (1.61) | (1.41) | (0.28) | (0.07) | (0.35) | $8.70 | (13.79)% | 0.55% | 0.59% | 2.06% | 2.02% | 97% | $6,179 | ||||||||||||||||||||||||||||||||
| 2021 | $10.42 | 0.18 | (0.09) | 0.09 | (0.02) | (0.03) | (0.05) | $10.46 | 0.86% | 0.55% | 0.59% | 1.71% | 1.67% | 119% | $7,319 | ||||||||||||||||||||||||||||||||
| G Class | |||||||||||||||||||||||||||||||||||||||||||||||
| 2025 | $8.83 | 0.42 | 0.10 | 0.52 | (0.45) | — | (0.45) | $8.90 | 6.03% | 0.02% | 0.60% | 4.80% | 4.22% | 145% | $1,942,711 | ||||||||||||||||||||||||||||||||
| 2024 | $8.22 | 0.38 | 0.50 | 0.88 | (0.27) | — | (0.27) | $8.83 | 10.83% | 0.02% | 0.60% | 4.42% | 3.84% | 103% | $2,563,003 | ||||||||||||||||||||||||||||||||
| 2023 | $8.72 | 0.32 | (0.25) | 0.07 | (0.57) | — | (0.57) | $8.22 | 0.72% | 0.01% | 0.59% | 3.76% | 3.18% | 83% | $2,018,795 | ||||||||||||||||||||||||||||||||
| 2022 | $10.48 | 0.25 | (1.61) | (1.36) | (0.33) | (0.07) | (0.40) | $8.72 | (13.30)% | 0.01% | 0.59% | 2.60% | 2.02% | 97% | $1,596,902 | ||||||||||||||||||||||||||||||||
| 2021 | $10.46 | 0.24 | (0.10) | 0.14 | (0.09) | (0.03) | (0.12) | $10.48 | 1.35% | 0.01% | 0.59% | 2.25% | 1.67% | 119% | $2,089,178 | ||||||||||||||||||||||||||||||||
| Notes to Financial Highlights | ||
| Report of Independent Registered Public Accounting Firm | ||
| Approval of Management Agreement | ||
| Contact Us | americancentury.com | |||||||
| Automated Information Line | 1-800-345-8765 | |||||||
| Investor Services Representative | 1-800-345-2021 or 816-531-5575 | |||||||
| Banks and Trust Companies, Broker-Dealers, Financial Professionals, Insurance Companies | 1-800-345-6488 | |||||||
| This report and the statements it contains are submitted for the general information of our shareholders. The report is not authorized for distribution to prospective investors unless preceded or accompanied by an effective prospectus. | ||||||||
| ©2025 American Century Proprietary Holdings, Inc. All rights reserved. CL-ANN-90984 2512 | ||||||||
A statement regarding the basis for the board of directors’ approval of the investment advisory contract is included as part of the financial statements and other information filed under Item 7 of this Form. | ||
| Registrant: | American Century International Bond Funds | ||||||||||
| By: | /s/ Patrick Bannigan | ||||||||||
| Name: | Patrick Bannigan | ||||||||||
| Title: | President | ||||||||||
| Date: | December 23, 2025 | ||||||||||
| By: | /s/ Patrick Bannigan | |||||||
| Name: | Patrick Bannigan | |||||||
| Title: | President | |||||||
| (principal executive officer) | ||||||||
| Date: | December 23, 2025 | |||||||
| By: | /s/ R. Wes Campbell | |||||||
| Name: | R. Wes Campbell | |||||||
| Title: | Treasurer and | |||||||
| Chief Financial Officer | ||||||||
| (principal financial officer) | ||||||||
| Date: | December 23, 2025 | |||||||