The bar chart and accompanying table shown below provide an indication of the risks of investing in the Fund by showing the total return of its Institutional shares for each full calendar year, and by showing how its average annual returns compare over time with those of a broad-based market index. How the Fund has performed in the past (before and after taxes) is not necessarily an indication of how it will perform in the future. Updated performance information is available at no cost by calling 1-800-253-0412.
Prior to December 31, 2025, the Fund was managed by a different sub-advisor with different investment strategies and policies. The performance data below for periods prior to December 31, 2025 reflects a different investment strategy. Consequently, the performance record may be less pertinent for investors considering whether to purchase shares of the Fund. The Fund’s performance may have been different if the Fund’s portfolio was managed under the current investment objective, strategies and policies.
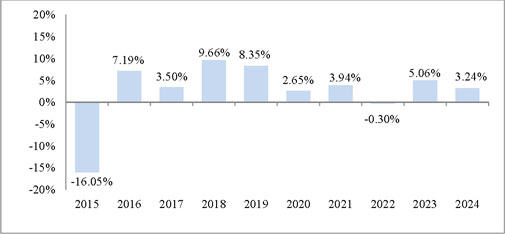
During the period shown in the bar chart, the highest return for a quarter was 12.07% (quarter ended September 30, 2017), and the lowest return for a quarter was (11.56)% (quarter ended September 30, 2015).
The Fund’s Institutional shares year-to-date return as of September 30, 2025, was 2.69%.
| 1 Year | 5 Years | 10 Years | |
| Institutional Shares | |||
| Return Before Taxes | 3.24% | 2.90% | 2.47% |
| Return After Taxes on Distributions | 1.51% | 1.88% | 0.87% |
| Return After Taxes on Distributions and Sale of Fund Shares | 1.99% | 1.96% | 1.22% |
| Class A Shares | |||
| Return Before Taxes | (1.87)% | 1.68% | 1.84% |
| S&P 500 Total Return Index® (reflects no deduction for fees, expenses or taxes) | 25.02% | 14.53% | 13.10% |
| 1 Year | 5 Years | Since
Class C Inception (5/31/2016) | |
| Class C Shares | |||
| Return Before Taxes | 2.25% | 1.91% | 3.90% |
| S&P 500 Total Return Index® (reflects no deduction for fees, expenses or taxes) | 25.02% | 14.53% | 14.76% |
After-tax returns are calculated using the highest historical individual federal marginal income tax rate and do not reflect the impact of state and local taxes. Actual after-tax returns depend on a shareholder’s tax situation and may differ from those shown. After-tax returns are not relevant for shareholders who hold Fund shares in tax-advantaged accounts or to shares held by non-taxable entities. After-tax returns are only shown for Institutional shares. After-tax returns for other share classes will vary.