Exhibit 99.49
 |
 |
DATE AND SIGNATURE PAGE
This report entitled NI 43-101 Technical Report, Soracaya Project, effective as of January 1, 2024, was prepared and signed by the following authors:
Original document signed and sealed by:
| “original signed and sealed by Garth Kirkham, P.Geo.” | October 4, 2024 |
| Garth Kirkham, P.Geo. | Date Signed |
Original document signed and sealed by:
| “original signed and sealed by Tad Crowie, P.Eng.” | October 4, 2024 |
| Tad Crowie, P.Eng. | Date Signed |
SORACAYA PROJECT | NI 43-101 TECHNICAL REPORT | i |
|
|
NOTICE
Kirkham Geosystems Ltd. prepared this National Instrument 43-101 Technical Report, in accordance with Form 43-101F1, for Santacruz Silver Mining Ltd. The quality of information, conclusions and estimates contained herein is based on: (i) information available at the time of preparation; (ii) data supplied by outside sources, and (iii) the assumptions, conditions, and qualifications set forth in this report.
Santacruz Silver Mining Ltd. filed this Technical Report with the Canadian Securities Regulatory Authorities pursuant to provincial securities legislation. Except for the purposes legislated under provincial securities law, any other use of this report by any third party is at that party’s sole risk.
SORACAYA PROJECT | NI 43-101 TECHNICAL REPORT | ii |
|
|
TABLE OF CONTENTS
| 1 | Executive Summary | 1-1 | ||
| 1.1 | Introduction | 1-1 | ||
| 1.2 | Ownership | 1-1 | ||
| 1.3 | Location | 1-1 | ||
| 1.4 | Ownership and History | 1-2 | ||
| 1.5 | Geology and Mineralization | 1-2 | ||
| 1.6 | Mineral Processing and Metallurgy | 1-3 | ||
| 1.7 | Mineral Resource Estimate | 1-4 | ||
| 1.8 | Infrastructure | 1-4 | ||
| 1.9 | Environment and Permitting | 1-5 | ||
| 1.9.1 | Environmental Considerations | 1-5 | ||
| 1.9.2 | Regulatory and Permitting | 1-5 | ||
| 1.9.3 | Community Relations | 1-6 | ||
| 1.10 | Risks, Opportunities and Recommendations | 1-6 | ||
| 1.10.1 | Risks | 1-6 | ||
| 1.10.2 | Opportunities | 1-7 | ||
| 1.10.3 | Recommendations | 1-7 | ||
| 2 | Introduction | 2-1 | ||
| 2.1 | Terms of Reference | 2-1 | ||
| 2.2 | Qualifications and Responsibilities | 2-1 | ||
| 2.3 | Site Visit | 2-2 | ||
| 2.4 | Units, Currency and Rounding | 2-2 | ||
| 2.5 | Sources of Information | 2-2 | ||
| 3 | Reliance on Other Experts | 3-1 | ||
| 4 | Property Description and Location | 4-1 | ||
| 4.1 | Location | 4-1 | ||
| 4.2 | Property Description and Tenure | 4-2 | ||
| 4.3 | Environmental, Permitting and Social Impacts | 4-4 | ||
| 4.3.1 | Regulatory Framework | 4-5 | ||
| 4.3.2 | Community and Socio-Economic Development | 4-6 | ||
| 4.3.3 | Environmental Management | 4-7 | ||
SORACAYA PROJECT | NI 43-101 TECHNICAL REPORT | iii |
|
|
| 5 | Accessibility, Climate, Local Resources, Infrastructure and Physiography | 5-1 | ||
| 5.1 | Accessibility | 5-1 | ||
| 5.2 | Climate and Physiography | 5-3 | ||
| 5.3 | Infrastructure | 5-4 | ||
| 5.3.1 | Power | 5-4 | ||
| 6 | History | 6-1 | ||
| 6.1 | Management and Ownership | 6-1 | ||
| 6.2 | Historical Exploration | 6-1 | ||
| 7 | Geological Setting and Mineralization | 7-1 | ||
| 7.1 | Introduction | 7-1 | ||
| 7.2 | Geological Tectonic and Lithological Framework | 7-1 | ||
| 7.2.1 | Eastern Cordillera | 7-4 | ||
| 7.2.2 | Tacsarian Cycle (Upper Cambrian to Ordovician) | 7-10 | ||
| 7.2.3 | The Cordilleran Cycle (Late Ordovician to Late Devonian) | 7-10 | ||
| 7.2.4 | Subandean (Gondwana) Cycle (Upper Paleozoic) | 7-11 | ||
| 7.2.5 | The Mesozoic to Cenozoic Andean Cycle: The Serere, Puca and Corcoro Supersequences | 7-12 | ||
| 7.2.6 | The Andean Orogeny | 7-13 | ||
| 7.2.7 | Mesozoic to Cenozoic Magmatism | 7-13 | ||
| 7.3 | Regional Geology | 7-14 | ||
| 7.3.1 | Regional, local, and property geology | 7-14 | ||
| 7.4 | Local Geology | 7-15 | ||
| 7.4.1 | Lithology | 7-15 | ||
| 7.4.2 | Structural Geology | 7-16 | ||
| 7.5 | Mineralization | 7-17 | ||
| 7.5.1 | Alteration | 7-18 | ||
| 7.5.2 | Mineralized Veins | 7-19 | ||
| 8 | Deposit Types | 8-1 | ||
| 9 | Exploration | 9-1 | ||
| 10 | Drilling | 10-1 | ||
| 10.1 | Drilling Summary | 10-1 | ||
| 10.2 | Drilling Programs | 10-11 | ||
| 11 | Sample Preparation, Analyses and Security | 11-1 | ||
| 11.1 | Drillhole and Sub-Surface Sampling and Security | 11-1 | ||
SORACAYA PROJECT | NI 43-101 TECHNICAL REPORT | iv |
|
|
| 11.1.1 | Drill Core Logging, Photography, Sampling and Security | 11-1 | ||
| 11.1.2 | Sub-Surface Sampling and Logging | 11-7 | ||
| 11.2 | Sample Preparation and Analysis | 11-12 | ||
| 11.3 | QA/QC Procedures and Discussion of Results | 11-15 | ||
| 11.3.1 | Blanks | 11-16 | ||
| 11.4 | Standards | 11-18 | ||
| 11.4.1 | Duplicates | 11-22 | ||
| 11.5 | QP Statement | 11-26 | ||
| 12 | Data Verification | 12-1 | ||
| 12.1 | Verifications by the Authors of this Technical Report | 12-1 | ||
| 12.2 | Geology and Resources | 12-1 | ||
| 12.2.1 | Site Visit & Verification | 12-1 | ||
| 12.2.2 | Sample Database Verification | 12-2 | ||
| 12.2.3 | Independent Sampling | 12-2 | ||
| 12.2.4 | Geological Model Verification | 12-5 | ||
| 12.2.5 | Conclusions | 12-5 | ||
| 13 | Mineral Processing and Metallurgical Testing | 13-1 | ||
| 13.1 | Laboratory Bench Scale Testing | 13-1 | ||
| 13.2 | Pilot Plant Operations | 13-4 | ||
| 13.3 | San Vicente Comparative Analysis | 13-5 | ||
| 13.4 | Recovery Recommendation | 13-5 | ||
| 14 | Mineral Resource Estimates | 14-1 | ||
| 14.1 | Introduction | 14-1 | ||
| 14.2 | Data | 14-1 | ||
| 14.3 | Geology Model | 14-2 | ||
| 14.4 | Data Analysis | 14-3 | ||
| 14.5 | Composites | 14-8 | ||
| 14.6 | Evaluation of Outlier Assay Values | 14-14 | ||
| 14.7 | Specific Gravity Estimation | 14-19 | ||
| 14.8 | ZnEq and Cut-off Grade Calculation | 14-19 | ||
| 14.9 | Mined Out Development Volumes | 14-20 | ||
| 14.10 | Block Model Definition | 14-21 | ||
| 14.11 | Resource Estimation Methodology | 14-21 | ||
SORACAYA PROJECT | NI 43-101 TECHNICAL REPORT | v |
|
|
| 14.12 | Mineral Resource Classification | 14-24 | |
| 14.13 | Reasonable Prospect of Eventual Economic Extraction | 14-25 | |
| 14.14 | Resource Validation | 14-27 | |
| 14.15 | Mineral Resource Statement | 14-28 | |
| 14.16 | Sensitivity of the Block Model to Selection Cut-off Grade | 14-29 | |
| 14.17 | Discussion with Respect to Potential Material Risks to the Resources | 14-30 | |
| 15 | Mineral Reserve Estimate | 15-1 | |
| 16 | Mining Methods | 16-1 | |
| 17 | Process Description and Recovery Methods | 17-1 | |
| 18 | Project Infrastructure and Services | 18-1 | |
| 19 | Market Studies and Contracts | 19-1 | |
| 20 | Environmental Studies, Permitting and Social or Community Impacts | 20-1 | |
| 21 | Capital and Operating Costs | 21-1 | |
| 22 | Economic Analysis | 22-1 | |
| 23 | Adjacent Properties | 23-1 | |
| 24 | Other Relevant Data and Information | 24-1 | |
| 25 | Interpretations and Conclusions | 25-1 | |
| 25.1 | Observations | 25-1 | |
| 25.2 | Risks | 25-3 | |
| 25.3 | Opportunities | 25-4 | |
| 26 | Recommendations | 26-1 | |
| 27 | References | 27-1 | |
| 28 | Units of Measure, Abbreviations, Acronyms, and Glossary of Spanish Terms | 28-1 | |
SORACAYA PROJECT | NI 43-101 TECHNICAL REPORT | vi |
|
|
LIST OF TABLES
| Table 1-1: Recovery Factors | 1-3 |
| Table 1-2: Base-Case Total Mineral Resources at 10.0% ZnEq Cut-off | 1-4 |
| Table 1-3: Environmental Licenses Held by Santacruz | 1-5 |
| Table 2-1: QP Responsibilities | 2-2 |
| Table 2-2: QP Site Visits | 2-2 |
| Table 4-1: Sinchi Wayra Concessions | 4-3 |
| Table 5-1: Routes to Sinchi Wayra from La Paz | 5-2 |
| Table 7-1: La Dulce Vein Sampling | 7-23 |
| Table 7-2: Carlita Vein Sampling | 7-25 |
| Table 7-3: Pormetedor Vein Sampling | 7-25 |
| Table 7-4: Española Vein Sampling | 7-26 |
| Table 10-1: Soracaya Drilling Programs from 1999 through 2018 | 10-1 |
| Table 10-2: Soracaya Drilling Programs from 1999 through 2008 | 10-3 |
| Table 10-3: Soracaya Drilling Programs from 2008 through 2021 | 10-4 |
| Table 10-4: Significant Results from Soracaya Drilling Programs from 1999 through 2008 | 10-5 |
| Table 10-5: Significant Results Soracaya Drilling Programs from 2005 through 2008 | 10-9 |
| Table 10-6: Significant Results Soracaya Drilling Programs from 2008 through 2021 | 10-10 |
| Table 10-7: Soracaya Drilling Program Operations | 10-11 |
| Table 11-1: Underground Sample Locations | 11-8 |
| Table 11-2: Assay Results for the Soracaya Underground Channel Sampling | 11-10 |
| Table 11-3: QA/QC Sample Insertion Rates | 11-15 |
| Table 11-4: Quantity of Control Samples by Type | 11-16 |
| Table 11-5: Recommended Metal Concentrations of Standards Used at Soracaya | 11-18 |
| Table 12-1: Soracaya Independent Verification Sampling | 12-2 |
| Table 13-1: Summary of Results from Lab Flotation Test | 13-3 |
| Table 13-2: Recovery Factors | 13-5 |
| Table 14-1: Vein Codes and Descriptions for the Soracaya Deposit | 14-3 |
| Table 14-2: Statistics Silver, Lead and Zinc for the Soracaya Deposit by Vein | 14-4 |
| Table 14-3: Iron Statistics for the Soracaya Deposit by Vein | 14-6 |
| Table 14-4: Statistics Assay Interval Lengths for the Soracaya Deposit by Vein | 14-7 |
| Table 14-5: Composite Statistics for the Soracaya Deposit by Vein | 14-10 |
| Table 14-6: Outlier Cutting Analysis for the Soracaya Deposit | 14-14 |
| Table 14-7: Outlier Cutting Analysis for the Soracaya Deposit | 14-17 |
| Table 14-8: Base Case Total Mineral Resources at 10% ZnEq Cut-off | 14-28 |
| Table 14-9: Base Case Total Mineral Resources at 10% ZnEq Cut-off Split by Area | 14-29 |
| Table 14-10: Sensitivity Analyses at Various ZnEq Cut-off Grades for the Inferred Resources | 14-30 |
| Table 23-1: 2023 Resources and Reserves for San Vicente | 23-1 |
| Table 25-1: Base-Case Total Mineral Resources at 10% ZnEq Cut-off | 25-3 |
SORACAYA PROJECT | NI 43-101 TECHNICAL REPORT | vii |
|
|
LIST OF FIGURES
| Figure 4-1: Project Location Map | 4-1 |
| Figure 4-2: Soracaya Project Site | 4-2 |
| Figure 4-3: Santa Cruz Soracaya Exploration Tenements | 4-4 |
| Figure 4-4: Communities Affected by Potential Development of the Soracaya Project | 4-6 |
| Figure 4-5: Soracaya Water Sampling | 4-7 |
| Figure 5-1: Access Routes to Soracaya | 5-2 |
| Figure 5-2: Location of High-Voltage Lines in Proximity to Soracaya | 5-4 |
| Figure 6-1: Geophysical Survey Results – Soracaya | 6-3 |
| Figure 6-2: Geological Mapping at Soracaya | 6-4 |
| Figure 7-1: Regional Geology Setting | 7-1 |
| Figure 7-2: Regional Geology Setting with Deposit Types | 7-2 |
| Figure 7-3: Plate Tectonic Reconstructions of the Neoproterozoic Subcontinent and the Late Precambrian Supercontinent after the Opening of the Southern Iapetus Ocean | 7-5 |
| Figure 7-4: Plate Tectonic Reconstructions of the Neoproterozoic and Late Precambrian Subcontinents | 7-6 |
| Figure 7-5: Paleogeography of SW Gondwana Margin in the Early Ordovician | 7-7 |
| Figure 7-6: The Famatinian – Taconic Orogen in the Middle Ordovician | 7-8 |
| Figure 7-7: The Ordovician of the Central Andes (Cunningham et al., 1994b) | 7-9 |
| Figure 7-8: Regional Geology Map at Soracaya | 7-15 |
| Figure 7-9: Sectors Map at Soracaya | 7-20 |
| Figure 8-1: Conceptual Model of the San Vicente and Soracaya Deposits (blue dashed = faults, red dashed = veins) | 8-1 |
| Figure 10-1: Plan View of Drillhole Locations at Soracaya | 10-2 |
| Figure 10-2: Plan View of Drillhole Locations at Soracaya with Vein and Topographic Contours | 10-2 |
| Figure 11-1: Example of Core Box Photography | 11-2 |
| Figure 11-2: Example of Core Marked for Splitting | 11-3 |
| Figure 11-3: Core Splitting Facilities | 11-4 |
| Figure 11-4: Samples Prepared for Analysis Transport | 11-5 |
| Figure 11-5: Sample Submission Form | 11-6 |
| Figure 11-6: Drill Core Storage Facilities | 11-7 |
| Figure 11-7: Assay Methods Employed at the Soracaya Project | 11-13 |
| Figure 11-8: Example of Don Diego Laboratory Assay Certificate | 11-14 |
SORACAYA PROJECT | NI 43-101 TECHNICAL REPORT | viii |
|
|
| Figure 11-9: Plot of Ag g/t Values for Blanks | 11-16 |
| Figure 11-10: Plot of Pb% Values for Blanks | 11-17 |
| Figure 11-11: Plot of Zn% Values for Blanks | 11-17 |
| Figure 11-12: Plot of Ag g/t Values for Standards ME-017 | 11-19 |
| Figure 11-13: Plot of Pb% Values for Standards ME-017 | 11-19 |
| Figure 11-14: Plot of Pb% Values for Standards ME-017 | 11-20 |
| Figure 11-15: Plot of Ag g/t Values for Standards ME-1402 | 11-20 |
| Figure 11-16: Plot of Pb% Values for Standards ME-1402 | 11-21 |
| Figure 11-17: Plot of Zn% Values for Standards ME-1402 | 11-21 |
| Figure 11-18: Plot of Coarse Reject Duplicates – Ag g/t | 11-22 |
| Figure 11-19: Plot of Coarse Reject Duplicates – Pb% | 11-23 |
| Figure 11-20: Plot of Coarse Reject Duplicates – Zn% | 11-23 |
| Figure 11-21: Plot of Pulp Duplicates – Ag g/t | 11-24 |
| Figure 11-22: Plot of Pulp Duplicates – Pb% | 11-25 |
| Figure 11-23: Plot of Pulp Duplicates – Zn% | 11-25 |
| Figure 12-1: Results of Independent Verification Sampling for Ag g/t | 12-3 |
| Figure 12-2: Results of Independent Verification Sampling for Pb% | 12-4 |
| Figure 12-3: Results of Independent Verification Sampling for Zn% | 12-4 |
| Figure 12-4: Results of Independent Verification Sampling for Fe% | 12-5 |
| Figure 12-5: Results of Independent Verification Sampling for Cu% | 12-5 |
| Figure 13-1: Lab Flotation Testwork Flowsheet | 13-2 |
| Figure 13-2: Pilot Plant Testwork Flowsheet | 13-4 |
| Figure 14-1: Plan View of Soracaya Drillholes | 14-1 |
| Figure 14-2: Plan View of Soracaya Mineralized Zones and Drillholes | 14-2 |
| Figure 14-3: Section View of Soracaya Mineralized Zones and Drillholes Looking Southwest with Topography | 14-2 |
| Figure 14-4: Long Section View of Soracaya Mineralized Zones and Drillholes Looking Northwest | 14-3 |
| Figure 14-5: Assay Interval Lengths | 14-7 |
| Figure 14-6: Assay Interval Length vs. Silver Grades | 14-8 |
| Figure 14-7: Long Section View of the Underground Channel Samples | 14-9 |
| Figure 14-8: Long Section of the Manually Declustered Underground Channel Samples | 14-9 |
| Figure 14-9: Composite Interval Lengths vs. Silver Grades | 14-12 |
| Figure 14-10: Box Plot of Zn% Composites for the Soracaya Deposit | 14-12 |
SORACAYA PROJECT | NI 43-101 TECHNICAL REPORT | ix |
|
|
| Figure 14-11: Box Plot of Pb% Composites for the Soracaya Deposit | 14-13 |
| Figure 14-12: Box Plot of Ag g/t Composites for the Soracaya Deposit | 14-13 |
| Figure 14-13: Box Plot of Cu% Composites for the Soracaya Deposit | 14-14 |
| Figure 14-14: Cumulative Probability Plot of Zn% Composites for the Soracaya Deposit | 14-15 |
| Figure 14-15: Cumulative Probability of Pb% Composites for the Soracaya Deposit | 14-15 |
| Figure 14-16: Cumulative Probability of Ag g/t Composites for the Soracaya Deposit | 14-16 |
| Figure 14-17: Cumulative Probability of Cu% Composites for the Soracaya Deposit | 14-16 |
| Figure 14-18: Calculated Density Model | 14-19 |
| Figure 14-19: Plan View of Mined Out Development (Blue) | 14-20 |
| Figure 14-20: Long Section View of Mined Out Development (Blue) | 14-20 |
| Figure 14-21: Dimensions, Origin and Orientation for the Soracaya Block Model | 14-21 |
| Figure 14-22: Long Section View of Block Model for the Esperansa Vein showing ZnEq% Cutoff Grades | 14-22 |
| Figure 14-23: Long Section View of Block Model for the Esperansa Vein showing Zn% Cutoff Grades | 14-22 |
| Figure 14-24: Long Section View of Block Model for the Esperansa Vein showing Ag g/t Cutoff Grades | 14-23 |
| Figure 14-25: Long Section View of Block Model for the Esperansa Vein showing Pb% Cutoff Grades | 14-23 |
| Figure 14-26: Long Section View of Block Model for the Esperansa Vein showing Cu% Cutoff Grades | 14-24 |
| Figure 14-27: Cross Section View of ZnEq Cutoff Grades for the Soracaya Block Model, Drillholes and Topography | 14-24 |
| Figure 14-28: Long Section View of Inferred Resources (blue) and Unclassified Resources (red) | 14-26 |
| Figure 14-29: Long Section View of Stopes | 14-27 |
| Figure 14-30: Long Section View of Inferred Blocks with ZnEq% Cutoff Grades along within Optimized Stopes | 14-27 |
SORACAYA PROJECT | NI 43-101 TECHNICAL REPORT | x |
|
|
| 1 | EXECUTIVE SUMMARY |
| 1.1 | Introduction |
Kirkham Geosystems Ltd. (KGL) was commissioned by Santacruz Silver Mining Ltd. (Santacruz or the Company) to prepare a Technical Report in accordance with the Canadian Securities Administrators’ National Instrument 43-101 and Form 43-101F1, collectively referred to as National Instrument (NI) 43-101 for the Soracaya Project (Soracaya or the Project) located in the Department of Potosí, Bolivia.
This report is the first declaration of resources for the Soracaya Project which has a reasonable prospect of eventual economic extraction via underground mining methods The project is fully permitted for exploration and development. The effective date of the resource estimate is January 1, 2024.
| 1.2 | Ownership |
On October 11, 2021, Santacruz entered into the Definitive Agreement with Glencore whereby Santacruz agreed to acquire a portfolio of Bolivian silver assets from Glencore, including the following: (a) a 45% interest in the Soracaya Project and the Porco Mine, held through an unincorporated joint venture between Glencore’s wholly-owned subsidiary Contrato de Asociación Sociedad Minera Illapa S.A. (Illapa) and COMIBOL, a Bolivian state-owned entity; (b) a 100% interest in the Sinchi Wayra S.A. (Sinchi Wayra) business, which includes the producing Caballo Blanco mining complex; (c) the Soracaya exploration project; and (d) the San Lucas ore sourcing and trading business.
On March 21, 2022, Santacruz completed this purchase, including Glencore’s interest in the Soracaya Project.
Santacruz thus owns 100% of the two Bolivian operating companies Illapa and Sinchi Wayra, which in turn own 45% of the Soracaya Project, 45% of the Porco Mine, and 100% of the Caballo Blanco mining complex.
Sinchi Wayra is the operating company for all three active mining operations, including the Soracaya Project.
| 1.3 | Location |
The Soracaya Project is located in the province of Sud-Chicas, in the department of Potosí in Bolivia. The Project has UTM WGS-84 coordinates of 784,896E; 7,645,567N at an elevation of 4,421 meters above sea level (masl). Paved and gravel roads connect the Soracaya Project to the capital city La Paz (676 km), the town of Uyumi (132 km) and the San Vicente mine site (12 km).
SORACAYA PROJECT | NI 43-101 TECHNICAL REPORT | 1-1 |
|
|
| 1.4 | Ownership and History |
The Soracaya site has been worked since colonial times by the Spanish population, this argument is corroborated by the ruins of population and mining activity found in the sector. The quantification of silver production in the past is difficult to establish, however we can assume that in the years when the price of silver, lead and zinc were very important, mining activities were restarted. The first written records of mining activity are from approximately 1820, when the area was named Minas Guernica. The name Soracaya derives from the native Quechua language “Surikhoya”, which in Spanish means “mine with ostriches”.
Soracaya has been experienced modern mineral exploration since 1992 initiated by Compañía Minera del Sur S.A. (COMSUR S.A.).
In 2005, COMSUR S.A. sold Soracaya to Glencore which formed Sinchi Wayra S.A.
On October 11, 2021, Santacruz entered into the Definitive Agreement with Glencore whereby Santacruz agreed to acquire a portfolio of Bolivian silver assets from Glencore, including the following: (a) a 45% interest in the Bolivar Mine and the Porco Mine, held through an unincorporated joint venture between Glencore’s wholly-owned subsidiary Contrato de Asociación Sociedad Minera Illapa S.A. (Illapa) and COMIBOL, a Bolivian state-owned entity; (b) a 100% interest in the Sinchi Wayra S.A. (Sinchi Wayra) business, which includes the producing Caballo Blanco mining complex; (c) the Soracaya exploration project; and (d) the San Lucas ore sourcing and trading business (the Assets).
On May 10, 2023, Santacruz and Glencore entered into a framework agreement to amend certain terms of the transaction documents pertaining to the acquisition of the assets. On March 28, 2024, Santacruz and Glencore entered into the binding term sheet which amends the terms of certain deferred consideration and ancillary documents pertaining to the acquisition of the Assets.
Santacruz thus currently owns 100% of the Soracaya Project.
| 1.5 | Geology and Mineralization |
Regionally, the Paleozoic basement forms anticlines and synclines with preferential north-west orientation. The Soracaya property is located approximately 8 km west of the prominent north-south striking San Vicente thrust fault, which forms the eastern limit of the intermountain Bolivian Altiplano basin. Low-angle faults, parallel to the folded structures, confirm the presence of compressive stresses in an easterly direction and this is the case for the San Vicente fault, which causes the Ordovician sedimentary package to overlie the polymictic conglomerates of the San Vicente formation. As a result of the tensile phases which are reactivated, high-angle, typically mineralized, faulting and veining occurs in an east-west preferential direction.
The lithology comprises an alternation of shale-slate, followed by siltstone-sandstone and finally laminated sandstones. In the extreme west, outcrops of reddish conglomerates are observed, which are in discordant contact with Ordovician rocks bounded by a regional fault called the San Vicente fault.
Structurally, a series of anticlinal and synclinal folds with an almost north-south direction can be observed. The mineralization-filled fractures have a NEE strike and a second system transverse to the former but related to the vicinity of the Soracaya volcanic complex.
The predominant alteration is argillic followed by propylitization and/or chloritization. Alteration in sedimentary rocks is restricted to areas of possible mineralization. Most of the rocks are fresh.
SORACAYA PROJECT | NI 43-101 TECHNICAL REPORT | 1-2 |
|
|
Mineralization in the Soracaya deposit is structurally controlled, while lithological control plays a minimal role. Pre-existing faults, fractures, and zones of weakness served as conduits for the mineralizing solutions. Structural preparation is very important for the passage of mineralizing solutions. From what has been observed in the Project, the control for mineralization is basically structural and probably lithological in the Tuna Rumi sector.
In the deposit, there are two generations of mineralization; Polymetallic mineralization of the Philonian type, i.e. fissure and/or fracture filled with local dissemination of syngenetic pyrite transformed into iron oxides of probably meteoric character, located in the areas of (Potos Orkho, Tuna Rumi, Sud de Tuna Rumi and Cerro Evangelista).
Another low-grade, high-volume mineralization system where mineralization is likely to be in disseminated form, limonitic box work from pyrite and limonitic stockwork; this type of mineralization could be found in Cerro Evangelista and in volcanic breccia that outcrops in the form of a process on the hill (Potos Orkho) and could be important targets for exploration with drilling.
Surface mineralization is represented by oxides such as Limonite, Hematite, Jarosite; Sectors with barite and quartz, are generally observed in the traces of structures and point sectors dissemination of pyrite also related to nearby structures. The structures identified at the surface were recognized at depth as massive structures, branched with pyrite, possibly silver (tetrahedrite) and copper ores within the pyrite mass and chalcopyrite veins.
| 1.6 | Mineral Processing and Metallurgy |
Based on the test data and comparison to San Vicente results, the following recovery factors are assumed as shown in Table 1-1.
Table 1-1: Recovery Factors
| Recovery | |||
| Report | Zn | Pb | Ag |
| Calculated Lab Test Rougher Recovery | 87.46 | 50.44 | 82.52 |
| Lab Test (Reported) | 90.43 | 62.41 | 86.63 |
| Pilot Plant (Reported) | 79.81 | 68.27 | 83.85 |
| San Vicente | 76.3 | 79.43 | 91.4 |
| Recovery Recommendation | 85 | 65 | 85 |
Source: Sinchi Wayra (2024)
SORACAYA PROJECT | NI 43-101 TECHNICAL REPORT | 1-3 |
|
|
| 1.7 | Mineral Resource Estimate |
The mineral resources were estimated in conformity with CIM’s “Estimation of Mineral Resources and Mineral Reserves Best Practices Guidelines” (December 2019) and are reported in accordance with NI 43-101 guidelines.
Mineral resources are classified under the inferred category according to CIM guidelines. The author evaluated the resource in order to ensure that it meets the condition of “reasonable prospects of eventual economic extraction” as suggested under NI 43-101. The criteria considered were confidence, continuity and economic cut-off in addition to considering constraining the resources within an underground mining volumes.
Using a cut-off grade of 10.0% ZnEq, the Soracaya Project resources are presented in Table 1-2.
Table 1-2: Base-Case Total Mineral Resources at 10.0% ZnEq Cut-off
| Tonnes | ZnEq | Zn | Ag | Pb | Cu | NSR |
| 4,137,000 | 31.62 | 1.23 | 259.76 | 7.23 | 0.09 | 248.82 |
Notes:
| 1) | The current Resource Estimate was prepared by Garth Kirkham, P.Geo., of Kirkham Geosystems Ltd. |
| 2) | All mineral resources have been estimated in accordance with Canadian Institute of Mining and Metallurgy and Petroleum (“CIM”) definitions, as required under National Instrument 43-101 (“NI43-101”). |
| 3) | The Mineral Resource Estimate was prepared using a 10% zinc equivalent cut-off grade. Cut-off grades were derived from $3.65/lb. copper, $21.00/oz silver, $1.15/lb. zinc and $1.00/lb. lead. This cut-off grade was based on current smelter agreements and total OPEX costs of $156.00/t based on 2023 actual costs derived from the Porco mine data, with process recoveries of 70.0% for copper, 80.0% for zinc, 70.0% for lead, and 85% for silver. All prices are stated in $USD. |
| 4) | An Inferred Mineral Resource has a lower level of confidence than that applying to an Indicated Mineral Resource and must not be converted to a Mineral Reserve. It is reasonably expected that the majority of Inferred Mineral Resources could be upgraded to Indicated Mineral Resources with continued exploration. |
| 5) | Mineral resources are not mineral reserves until they have demonstrated economic viability. Mineral resource estimates do not account for a resource’s mineability, selectivity, mining loss, or dilution. All figures are rounded to reflect the relative accuracy of the estimate and therefore numbers may not appear to add precisely. . |
| 1.8 | Infrastructure |
The Soracaya site is that of a typical exploration project with the existence of office, storage facilities and workspaces. In addition, the site has the underground portal along with small ore and waste stockpiles.
There is a relatively significant road network for site access and drilling.
There are three high voltage lines that may be potential sources of power at Soracaya. The closest connects to the 34.5 kV transmission line at the San Vicente mine currently terminates at 3.3 km NWW of Soracaya camp atop Pupusani hill, which is the location of the ENTEL communications antenna.
SORACAYA PROJECT | NI 43-101 TECHNICAL REPORT | 1-4 |
|
|
| 1.9 | Environment and Permitting |
| 1.9.1 | Environmental Considerations |
Responsible environmental management is a critical part of Santacruz’s license to operate and our responsible, compliant operation of Bolivian assets has continued for the last 30 years. Environmental Compliance with national laws and regulations is the basis of Santacruz’s environmental management system and is governed by a framework of oversight by the relevant Environmental Authority. Its environmental commitments are reported to the authorities annually in an Environmental Monitoring Report, which summarizes environmental management of its operations under applicable laws and regulations.
Environmental Licenses have been formally granted to allow operation for all mining activity, by the Ministry of Environment and Water. Table 1-3 shows the licenses held by Santacruz:
Table 1-3: Environmental Licenses Held by Santacruz
| Operation | License |
| Soracaya | 050801-02-CD-C3-002/2017 |
Source: Santacruz (2024)
| 1.9.1.1 | Water Management |
The streams that feed into the Soracaya basin have permanent water, although in the dry season the flow tends to be infrequent and intermittent.
The Soracaya River is the main waterway which several streams contribute. One is a creek that is adjacent, transecting the Soracaya camp that exits the underground mine development. The other stream descends from a ravine that comes down from Cerro Pupusani. Both of these water egresses join to the main Soracaya ravine and stream. There is a third contributor to the ravine water input which is a spring that exits at the foot of Cerro Evangelista.
| 1.9.2 | Regulatory and Permitting |
Bolivia’s central statute governing environment protection is Law 1333, of April 27, 1992; specific regulations for which are set out in Regulation of Environmental Prevention and Control, December 8, 1995. Special Decree No. 24782 of July 31, 1997 sets out specific environmental requirements related to mining. Breaching environmental obligations can result in criminal liability under the Bolivian Constitution, in addition to other administrative penalties (such as a loss of mining rights).
An Environmental Impact Assessment (EIA) would be required for a project on the scale of a mining and processing operation. As well, public consultation with any potentially affected indigenous communities and local populations may also be necessary. The granting of the operating permit allows the proponent to obtain the appropriate operating licenses, which must be updated with any relevant changes during the life of the operation.
Specialized environmental authorities control compliance. As required under the license, any impact on the environment must be reported to these authorities. Remediation measures and rehabilitation projects are compulsory, and financial reserve funds are maintained annually to cover closure costs. A final closing study on the effect on the environment will also be required, and restitution met.
SORACAYA PROJECT | NI 43-101 TECHNICAL REPORT | 1-5 |
|
|
The Soracaya Project is still an exploration stage project and as such does not yet require an operating permit or operating license.
The Project area includes land with no agricultural activity and only the presence of auchenids and small cattle. It is assumed that the potential environmental impacts of exploration work will be minimal; however, to carry out the exploratory activities, the Company has a Dispensation Certificate, dated June 6, 2005, issued by the Prefecture of the Department of Potosí. According to this certificate, the exploratory activities in Soracaya are classified as Category III, therefore it is exempt from the EIA.
Although to date there is only one environmental license for exploration, Sinchi Wayra has commenced the procedures for an environmental license for mineral extraction and development including creation of water treatment pits along with clearing of areas for potential mine development.
| 1.9.3 | Community Relations |
The communities that will likely be affected or otherwise impacted in Soracaya going forward, are organized within the structure of the “San Vicente Regional Committee”. The small communities that are part of this committee are the following: San Vicente, Chilco, Portugalete, Vetillas, Cieneguillas, Loma Colorada, Cocani, Viacha, Uyuni K, Guadalupe, Villa Loma and Cerrillos. These small communities are made up of family units that range from 10 to 30 families. The communities in closest proximity to Soracaya are Chilco, Vetillas, San Vicente and Cieneguillas.
| 1.10 | Risks, Opportunities and Recommendations |
| 1.10.1 | Risks |
The Soracaya Project is subject to all the risks normally associated with an operating mine, and some unique to its situation. These include:
| ■ | The current political and socio-economic climate in Bolivia poses risks and uncertainties that could delay or even stop development as reported within the Fraser Institute Annual Report 2022 where Bolivia ranks very low in many non-technical metrics. Bolivia has been ranked consistently low for the past five years and ranks in the lower quartile on all metrics that gauge risk and uncertainty. It is difficult to gauge or qualify the level or extents of the risks however, all companies working in Bolivia must continue to be aware of the potential risks and develop mitigation strategies. A significant risk related to the Santacruz Bolivian mineral assets, in particular the mineral resources and mineral reserves, is the significant artisanal activity that continues to exist. This activity is not only a socio-economic risk but also affects access to resources and reserves along with potential sterilization of mineral resources; | |
| ■ | Geological interpretations may be subjective and may result in the location and extent of some of the mineralized structure to change although as the Soracaya Project is comprised of well constrained veins, this risk is minimal; |
SORACAYA PROJECT | NI 43-101 TECHNICAL REPORT | 1-6 |
|
|
| ■ | As vein thicknesses are narrow, resources may be sensitive to dilution although the relative high grades that exist at the Soracaya Project are successful at mitigating such risks to date; | |
| ■ | Information and data that documents the location and amount of material extracted during colonial times is limited, therefore accounting for lose of this material n the resource is not precise; | |
| ■ | Varying resource classification methods and criteria may vary as more data is considered; | |
| ■ | There is no guarantee that further drilling will result in additional resources or increased classification; | |
| ■ | Lower commodity prices could change size and grade of the potential targets; | |
| ■ | Further work may disprove previous models and therefore result in condemnation of targets and potential negative economic outcomes; and | |
| ■ | Maintenance of permits. |
| 1.10.2 | Opportunities |
Project opportunities include:
| ■ | A systematic exploration program could provide an excellent opportunity for successfully uncovering new discoveries; | |
| ■ | An increased understanding and derivation of alternative theories may result in further discovery and expansion for the Project; | |
| ■ | A hydrogeological study could help the operation to better characterize and understand water inflows, aiding design work and planning to reduce the impact of major seasonal inflows; | |
| ■ | Higher commodity prices will change size and grade of the potential targets; and | |
| ■ | Potential for expansion and classification upgrade of resources as mining activities progress. |
| 1.10.3 | Recommendations |
To advance the Soracaya Project and further evaluate the potential additional veins and increase resources thereby displacing depletion due to ongoing mining activities, the following is recommended:
| ■ | Regional exploration for identification of new veins; | |
| ■ | Incorporate structural interpretations to assist regional understanding; | |
| ■ | Review and improve QA/QC program; | |
| ■ | Investigate source of anomalous lead values experienced with the field blanks; | |
| ■ | Incorporate externally certified blanks and standards into the QA/QC program; | |
| ■ | Insert QA/QC samples throughout at a rate of 1 in 20 for blanks, standards and duplicates; | |
| ■ | Analyze thickness and grade-thickness profiles for resource targeting and predictive dilution study; | |
| ■ | Investigate geo-metallurgical characteristics; |
| ■ | Run a metallurgical program to develop an understanding of the Soracaya mineralization. The program should include the assembly of a composite that is representative of the Soracaya mineralized structures. | |
| ■ | Metallurgical study composed of a testwork program that should include mineralogy, comminution and flotation along with settling and filtration testwork; | |
| ■ | Economic study to test the economic viability of the Soracaya Project to understand sensitivities to varying metal prices, costs, mining and processing methods; | |
| ■ | Hydrogeological study and modelling should be done to better understand water inflows and minimize their impact on production; and | |
| ■ | Extensive surface drilling for near surface targets along with underground drilling for resource delineation and extension. |
These recommendations have not been costed, as they represent changes to current practices that can be funded by existing operating budgets.
SORACAYA PROJECT | NI 43-101 TECHNICAL REPORT | 1-7 |
|
|
| 2 | INTRODUCTION |
| 2.1 | Terms of Reference |
Kirkham Geosystems Ltd. (KGL) was commissioned by Santacruz Silver Mining Ltd. (Santacruz or the Company) to prepare a Technical Report in accordance with the Canadian Securities Administrators’ National Instrument 43-101 and Form 43-101F1, collectively referred to as National Instrument (NI) 43-101 for the Soracaya Project (Soracaya or the Project) located in the Department of Potosí, Bolivia.
Santacruz is based in Vancouver, British Columbia and is engaged in the operation, acquisition, exploration and development of mineral properties in Latin America, with a primary focus on silver and zinc. Santacruz was incorporated on January 24, 2011, under the laws of British Columbia and is listed on the TSX Venture Exchange under the trading symbol “SCZ”.
On October 11, 2021, Santacruz entered into the Definitive Agreement with Glencore whereby Santacruz agreed to acquire a portfolio of Bolivian silver assets from Glencore, including the following: (a) a 45% interest in the Soracaya Project and the Porco Mine, held through an unincorporated joint venture between Glencore’s wholly-owned subsidiary Contrato de Asociación Sociedad Minera Illapa S.A. (Illapa) and COMIBOL, a Bolivian state-owned entity; (b) a 100% interest in the Sinchi Wayra S.A. (Sinchi Wayra) business, which includes the producing Caballo Blanco mining complex; (c) the Soracaya exploration project; and (d) the San Lucas ore sourcing and trading business.
On March 21, 2022, Santacruz completed this purchase, including Glencore’s interest in the Soracaya Project.
Santacruz thus owns 100% of the two Bolivian operating companies Illapa and Sinchi Wayra, which in turn own 45% of the Soracaya Project, 45% of the Porco Mine, and 100% of the Caballo Blanco mining complex. Sinchi Wayra is the operating company for all three active mining operations, including the Soracaya Project.
This report is the first declaration of resources for the Soracaya Project by Santacruz. The effective date of the resource is January 1, 2024.
| 2.2 | Qualifications and Responsibilities |
The Qualified Persons (QPs) preparing this report are specialists in the fields of geology, exploration, mineral resource estimation, metallurgy and mining.
None of the QPs or any associates employed in the preparation of this report has any beneficial interest in Santacruz and neither are any insiders, associates, or affiliates. The results of this report are not dependent upon any prior agreements concerning the conclusions to be reached, nor are there any undisclosed understandings concerning any future business dealings between Santacruz and the QPs. The QPs are being paid a fee for their work in accordance with normal professional consulting practice.
SORACAYA PROJECT | NI 43-101 TECHNICAL REPORT | 2-1 |
|
|
The following individuals, by virtue of their education, experience and professional association, are considered QPs as defined in the NI 43-101, and are members in good standing of appropriate professional institutions / associations. The QPs are responsible for the specific report sections as listed in Table 2-1.
Table 2-1: QP Responsibilities
| Qualified Person | Company | QP Responsibility / Role | Report Section(s) |
| Garth Kirkham, P.Geo. | Kirkham Geosystems Inc. | Geology, QA/QC, Data Verification, Drilling, Resource Estimate | All sections with the exception of 13 |
| Tad Crowie, P.Eng. | JDS Energy & Mining Inc. | Metallurgy | 13 |
| 2.3 | Site Visit |
In accordance with NI 43-101 guidelines, site visits are summarized in Table 2-2. Sinchi Wayra staff and management were cooperative and helpful during the course of each visit. Access to all requested information and physical sites was provided voluntarily.
Table 2-2: QP Site Visits
| Qualified Person | Company | Date | Description of Inspection |
Garth Kirkham, P.Geo. |
Kirkham Geosystems Inc. |
March 28-30, 2023 |
Soracaya deposit and project site; including outcrops and trenches, the Potosí professional offices, Don Diego Mill Complex and assay laboratory, sample storage facilities, La Paz company offices, discussions with site and company personnel. |
| 2.4 | Units, Currency and Rounding |
The units of measure used in this report are as per the International System of Units (SI) or metric, except for Imperial units that are commonly used in industry (e.g., ounces (oz.) and pounds (lb.) for the mass of precious and base metals).
All dollar figures quoted in this report refer to United States dollars (US$ or $) unless otherwise noted.
Frequently used abbreviations and acronyms can be found in Section 28. This report includes technical information that required subsequent calculations to derive subtotals, totals and weighted averages. Such calculations inherently involve a degree of rounding and consequently introduce a margin of error. Where these occur, the QPs do not consider them to be material.
This report may include technical information that requires subsequent calculations to derive sub-totals, totals and weighted averages. Such calculations inherently involve a degree of rounding and consequently introduce a margin of error. Where these occur, JDS Energy & Mining Inc. (JDS) and KGL do not consider them to be material.
| 2.5 | Sources of Information |
This report is based on information collected by the QP during their site visits performed on March 28-30, 2023 (Garth Kirkham, P.Geo.) and on additional information provided by Santacruz and Sinchi Wayra throughout the course of the QPs investigations. Other information was obtained from the public domain. The QPs conducted adequate verification of the information and took responsibility for the information provided by Santacruz.
SORACAYA PROJECT | NI 43-101 TECHNICAL REPORT | 2-2 |
|
|
| 3 | RELIANCE ON OTHER EXPERTS |
The QPs have relied on information provided by Santacruz on claims, ownership, property agreements, royalties, environmental liabilities, and permits as described in Section 4. The information appears reasonable but has not independently verified beyond the information that is publicly available.
The QPs have relied upon a legal opinion provided by Enrique Barrios of the firm Dentons Guevara & Gutierrez S.C., located in La Paz, Bolivia, in the documents “Local Counsel Legal Opinion on the Porco Mine”, “Local Counsel Legal Opinion on the Caballo Blanco Project”, “Local Counsel Legal Opinion on Empresa Minera San Lucas S.A.”, “Local Counsel Legal Opinion on Sociedad Minero Metalúrgica Reserva Ltda.”, “Local Counsel Legal Opinion on Sociedad Minera Illapa S.A.”, “Local Counsel Legal Opinion on Sinchi Wayra S.A.”, and “Local Counsel Legal Opinion on the Illapa Joint Venture”, all dated March 18, 2022 with regards to the Project’s location, title, and environmental licenses described in Section 4 of this report.
In accordance with the procedure and legal framework of the Mining Rights Adjustment Regulation approved by Ministerial Resolution No. 0294/2016 dated December 5, 2016, and Law No. 535 dated May 28, 2024, Sinchi Wayra has signed mining administrative contracts for five areas that together constitute the Sector called “Soracaya”:
| 1. | Testimony No. 541/2021. regarding “public writing of a minute mining administrative contract for adequacy” corresponding to the Evangelista Area with Unique Code 1500081 and National Register No. 508 – 09517. | |
| 2. | Testimony No. 539/2021. regarding “public writing of a minute mining administrative contract for adequacy” corresponding to the Intilaqhayay II Area with Unique Code 1500080 and Nation Register No. 508 – 09516. | |
| 3. | Testimony No. 540/2021. regarding “public writing of a minute mining administrative contract for adequacy” corresponding to the Monica Area with Unique Code 1500083 and National Register No. 508 – 09519. | |
| 4. | Testimony No. 542/2021. regarding “public writing of a minute mining administrative contract for adequacy” corresponding to the LEALTAD Lealtad Area with Unique Code 15000079 and National Register No. 508 – 09515. | |
| 5. | Testimony No. 538/2021. regarding “public writing of a minute mining administrative contract for adequacy” corresponding to the Sol de Manana Area with Unique Code 1500082 and National Register No. 508 – 09518. |
SORACAYA PROJECT | NI 43-101 TECHNICAL REPORT | 3-1 |
|
|
| 4 | PROPERTY DESCRIPTION AND LOCATION |
| 4.1 | Location |
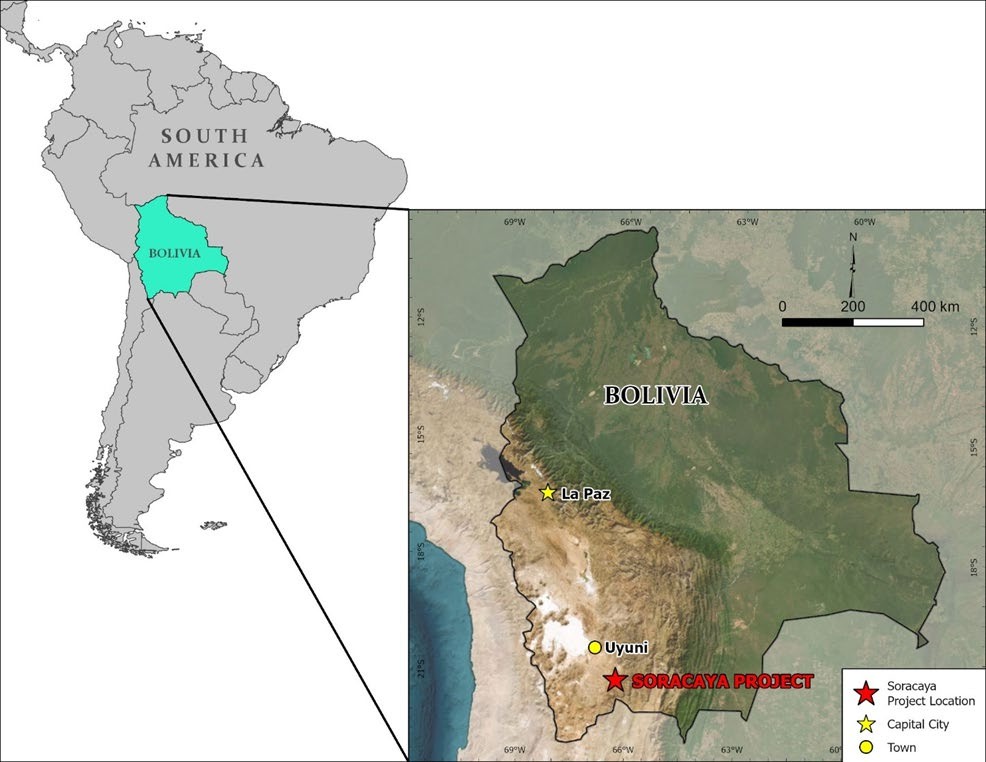
The Soracaya Project (Figure 4-1) is located in the province of Sud-Chicas, in the department of Potosí in Bolivia. The Project has UTM WGS-84 coordinates of 784,896E; 7,645,567N at an elevation of 4,421 meters above sea level (masl). Paved and gravel roads connect the Soracaya Project to the capital city La Paz (676 km), the town of Uyumi (132 km) and the San Vicente mine site (12 km).
Figure 4-1: Project Location Map
Source: KGL (2024)
SORACAYA PROJECT | NI 43-101 TECHNICAL REPORT | 4-1 |
|
|
| 4.2 | Property Description and Tenure |
The Soracaya site has been worked since colonial times initiated by the Spanish, which is confirmed through the existence of archeological artifacts and evidence of mining activity found in the vicinity. No records exist that quantify or otherwise identify the silver and base metal production in the area.
The Soracaya property has been the subject of modern exploration activities by COMSUR S.A. from 1992 through 2005 with Sinchi Wayra S.A. performing mineral exploration and development activities from 2005 to present.
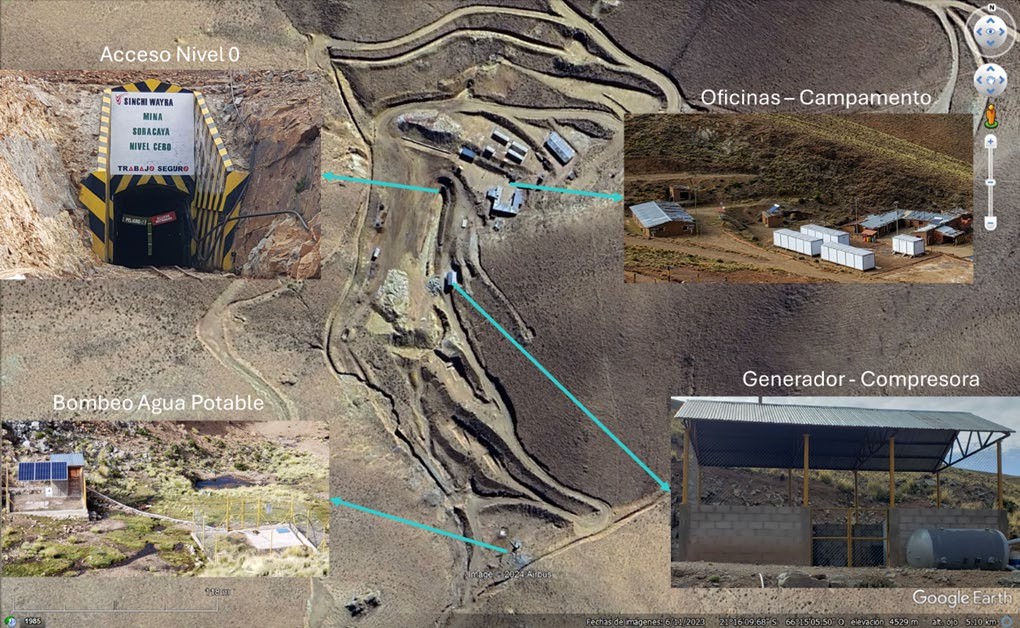
The Soracaya site, as shown in Figure 4-2, is typical for an early-stage exploration property with access and drill roads, limited infrastructure which includes offices, living quarters and related facilities, power generation and electrical distribution, water treatment, core logging and temporary warehousing facilities. In addition, an underground exploration drift and portal has been developed, but is not currently accessible for safety reasons. Surface exploration trenches have also been developed and remain open and accessible. Furthermore, there are small stockpiles of mineralized material and waste that have been extracted from the underground workings.
Figure 4-2: Soracaya Project Site
Source: Sinchi Wayra (2024)
SORACAYA PROJECT | NI 43-101 TECHNICAL REPORT | 4-2 |
|
|
On October 11, 2021, Santacruz entered into the Definitive Agreement with Glencore whereby Santacruz agreed to acquire a portfolio of Bolivian silver assets from Glencore, including the following: (a) a 45% interest in the Bolivar Mine and the Porco Mine, held through an unincorporated joint venture between Glencore’s wholly-owned subsidiary Illapa and COMIBOL, a Bolivian state-owned entity; (b) a 100% interest in the Sinchi Wayra business, which includes the producing Caballo Blanco mining complex; (c) the Soracaya exploration project; and (d) the San Lucas ore sourcing and trading business (the Assets).
On May 10, 2023, Santacruz and Glencore entered into a framework agreement to amend certain terms of the transaction documents pertaining to the acquisition of the Assets. On March 28, 2024, Santacruz and Glencore entered into the binding Term Sheet which amends the terms of certain deferred consideration and ancillary documents pertaining to the acquisition of the Assets.
Santacruz thus owns 100% of the two Bolivian operating companies Illapa and Sinchi Wayra, which in turn own 45% of the Bolivar Mine, 45% of the Porco Mine, 100% of the Caballo Blanco mining complex and 100% of Soracaya.
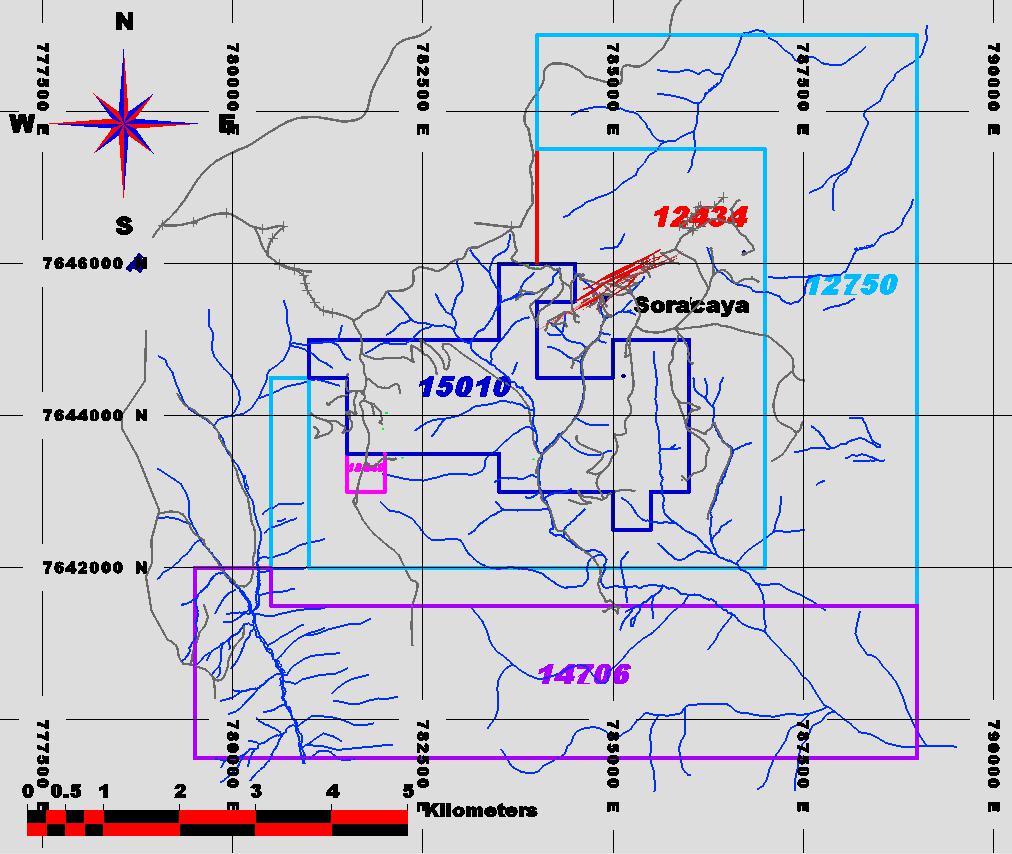
There are currently six mining concessions at Soracaya owned by Sinchi Wayra, as listed in Table 4-1 and shown in Figure 4-3.
Table 4-1: Sinchi Wayra Concessions
| Number | Name of Concession (ATE) | Owner | Area (hectares) | Expiry Date |
| 12434 | INTIILAQUAYAY | SINCHI WAYRA S.A. | 70 | August 10, 2051 |
| 12750 | MONICA | SINCHI WAYRA S.A. | 96 | August 10, 2051 |
| 15010 | LEALTAD | SINCHI WAYRA S.A. | 71 | August 10, 2051 |
| 14706 | SOL DE MAÑANA | SINCHI WAYRA S.A. | 95 | August 10, 2051 |
| 18440 | EVANGELISTA | SINCHI WAYRA S.A. | 1 | August 10, 2051 |
| Total | 8,325 Ha. |
Source: Sinchi Wayra (2024)
SORACAYA PROJECT | NI 43-101 TECHNICAL REPORT | 4-3 |
|
|
Figure 4-3: Santa Cruz Soracaya Exploration Tenements
Source: Sinchi Wayra (2024)
| 4.3 | Environmental, Permitting and Social Impacts |
Santacruz continues to manage its operations using a sustainability approach consistent with international standards. From the 2022 Sustainability Report:
We are: “A leading Business Group in the mining industry in Bolivia, sustainable, committed to the safety, health, and well-being of our Human Capital, and the preservation of the environment, with an entrepreneurial spirit, openness to change and innovation, and we strive to generate value and positive impact for society as a whole.”
This integrative approach is employed throughout all of the Santacruz Bolivian operations including Soracaya where the following key areas are addressed and monitored:
SORACAYA PROJECT | NI 43-101 TECHNICAL REPORT | 4-4 |
|
|
| ■ | Employees Wellbeing; | |
| ■ | Occupational Health & Safety; | |
| ■ | Governance and Compliance; | |
| ■ | Stakeholder Engagement; | |
| ■ | Contributing to Community; | |
| ■ | Environmental Protection; and | |
| ■ | Product Stewardship & Material Handling. |
| 4.3.1 | Regulatory Framework |
Bolivia’s central statute governing environment protection is Law 1333, of April 27, 1992; specific regulations for which are set out in Regulation of Environmental Prevention and Control, December 8, 1995. Special Decree No. 24782 of July 31, 1997 sets out specific environmental requirements related to mining. Breaching environmental obligations can result in criminal liability under the Bolivian Constitution, in addition to other administrative penalties (such as a loss of mining rights).
An Environmental Impact Assessment (EIA) would be required for a project on the scale of a mining and processing operation. As well, public consultation with any potentially affected indigenous communities and local populations may also be necessary. The granting of the operating permit allows the proponent to obtain the appropriate operating licenses, which must be updated with any relevant changes during the life of the operation.
Specialized environmental authorities control compliance. As required under the license, any impact on the environment must be reported to these authorities. Remediation measures and rehabilitation projects are compulsory, and financial reserve funds are maintained annually to cover closure costs. A final closing study on the effect on the environment will also be required, and restitution met.
The Soracaya Project is still an exploration stage project and as such does not yet require an operating permit or operating license.
The Project area includes land with no agricultural activity and only the presence of auchenids and small cattle. It is assumed that the potential environmental impacts of exploration work will be minimal; however, to carry out the exploratory activities, the Company has a Dispensation Certificate, dated June 6, 2005, issued by the Prefecture of the Department of Potosí. According to this certificate, the exploratory activities in Soracaya are classified as Category III, therefore it is exempt from the EIA.
Although to date there is only one environmental license for exploration, Sinchi Wayra has commenced the procedures for an environmental license for mineral extraction and development including creation of water treatment pits along with clearing of areas for potential mine development.
SORACAYA PROJECT | NI 43-101 TECHNICAL REPORT | 4-5 |
|
|
| 4.3.2 | Community and Socio-Economic Development |
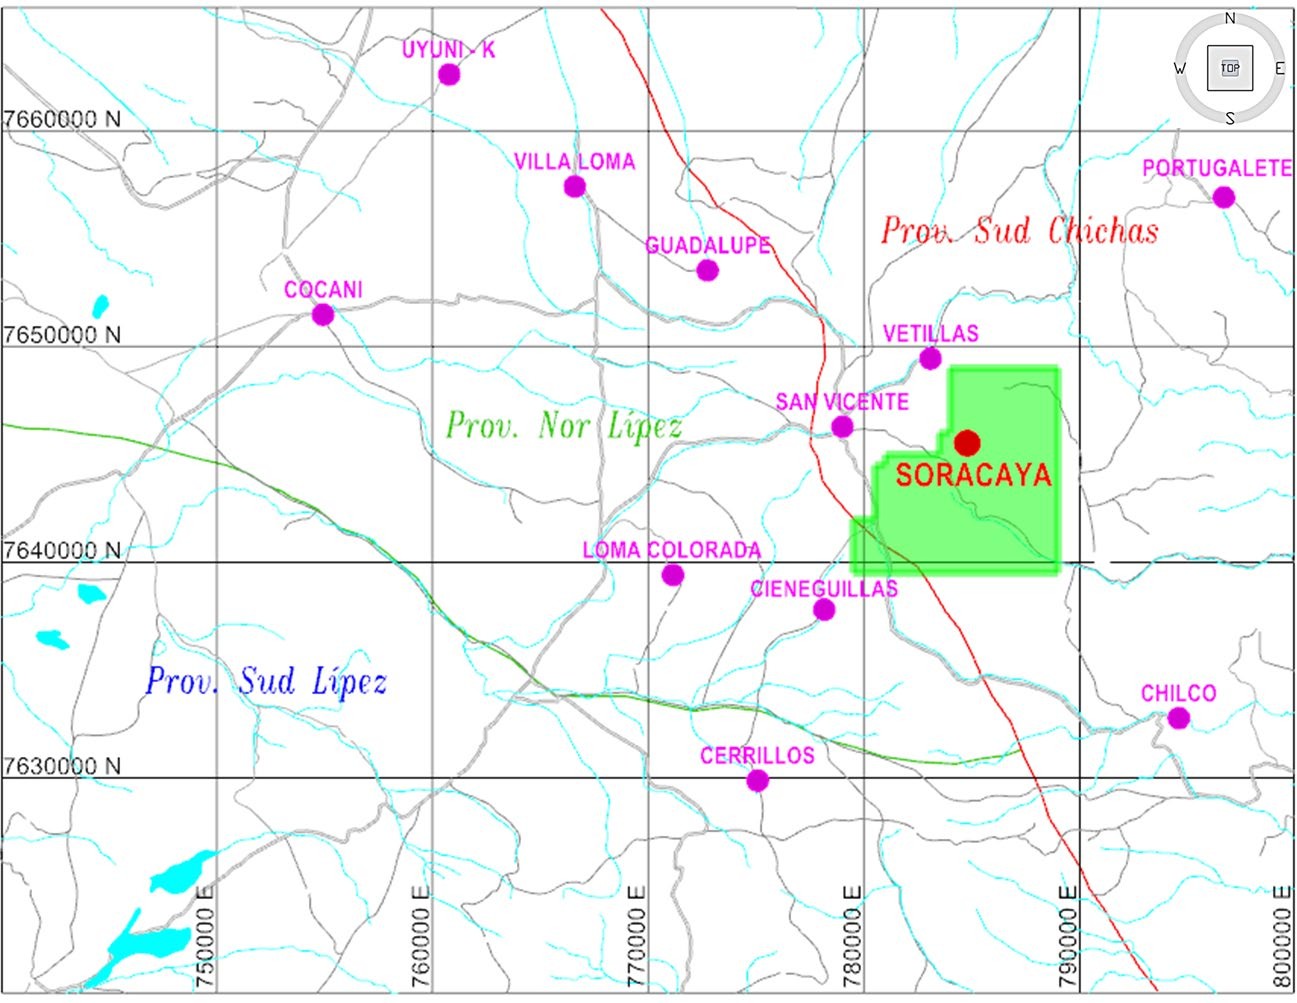
The communities that will likely be affected or otherwise impacted in Soracaya going forward, are organized within the structure of the “San Vicente Regional Committee”. The small communities that are part of this committee are the following: San Vicente, Chilco, Portugalete, Vetillas, Cieneguillas, Loma Colorada, Cocani, Viacha, Uyuni K, Guadalupe, Villa Loma and Cerrillos. These small communities are made up of family units that range from 10 to 30 families. The communities in closest proximity to Soracaya are Chilco, Vetillas, San Vicente and Cieneguillas as shown in Figure 4-4.
Figure 4-4: Communities Affected by Potential Development of the Soracaya Project
Source: Sinchi Wayra (2024)
The region is home to a population that includes a labor force with both skilled and unskilled workers. This is due to Soracaya being adjacent to the San Vicente mine in addition to the sector being home to the Tatasi-Portugalete Mine. Chilcobija, Abaroa, and Chorolque are important mining centers, therefore the availability of sourcing human resources with significant experience in exploration and mining activities, who have mining construction and operations experience, is readily available. In particular, the community of Chilco, has actively advocated the desire to supply labor and supporting services for exploration and mining activities.
SORACAYA PROJECT | NI 43-101 TECHNICAL REPORT | 4-6 |
|
|
| 4.3.3 | Environmental Management |
The streams that feed into the Soracaya basin have permanent water, although in the dry season the flow tends to be infrequent and intermittent.
The Soracaya River is the main waterway which several streams contribute. One is a creek that is adjacent, transecting the Soracaya camp that exits the underground mine development. The other stream descends from a ravine that comes down from Cerro Pupusani. Both of these water egresses join to the main Soracaya ravine and stream. There is a third contributor to the ravine water input which is a spring that exits at the foot of Cerro Evangelista.
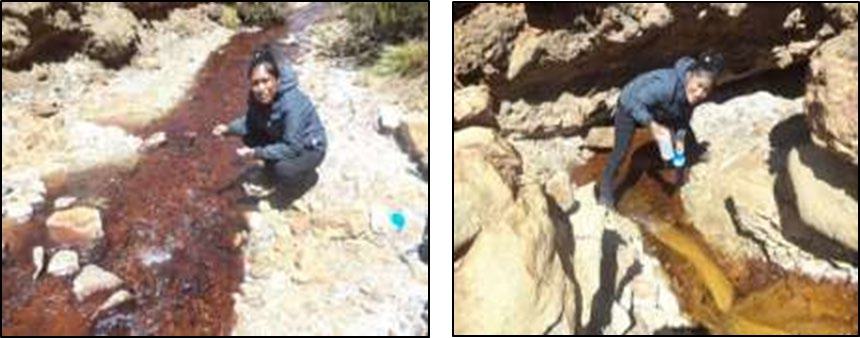
Measurements of flow rate have been taken and documented (Figure 4-5). In addition, a small number of measurements of pH of the water have been taken, which were sent to the Don Diego Laboratory for analysis and tests to determine the amount lime that may be expected for acid neutralization.
For the four water samples, pH values showed the water to be acidic with pH ranging from 3 to 4 therefore the application of lime will be necessary for the required water treatment. Preliminary results illustrated that approximately 1 kilogram (kg) of lime may be required per cubic meter of water needing treatment.
Figure 4-5: Soracaya Water Sampling
Source: Sinchi Wayra (2024)
The QP is not aware of any other significant factors and risks that may affect access, title, or the right or ability to perform the proposed work program on the property.
SORACAYA PROJECT | NI 43-101 TECHNICAL REPORT | 4-7 |
|
|
| 5 | ACCESSIBILITY, CLIMATE, LOCAL RESOURCES, INFRASTRUCTURE AND PHYSIOGRAPHY |
| 5.1 | Accessibility |
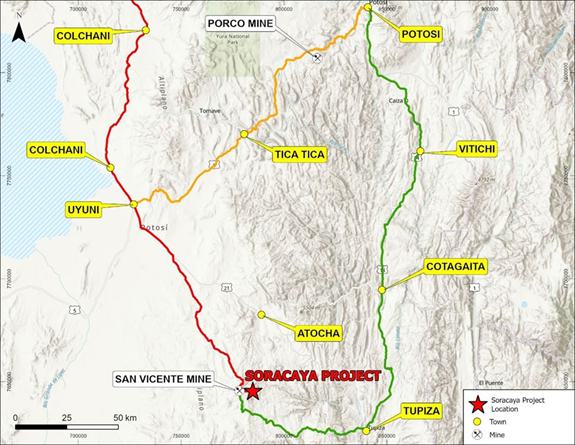
The optimal routes for driving are via the capital city of La Paz, Bolivia in the north, or from Arica, Chile or Antofagasta, Chile to the west (Figure 5-1 and Table 5-1).
From La Paz, a paved highway leads south to Potosí (approximately 550 km) via Highway 1. Once at Potosí, head south on Highway 14 to Tupiza (approximately 265 km). From Potosí, take Highway 14 to Tupiza which is approximately 265 km to the south. Once in Tupiza, turn right at the Arandia exit across river bridge approximately 400 m to Avenida La Paz and head north approximately 500 m to the Puente de Villa Fatima bridge and continue north for approximately Avenida Los Alamos for 1.6 km. At this point take a left and head west on the Tupiza-San Vicente Road for approximately 120 km to the San Vicente mine.
An alternative route from La Paz is to take Highway 1 south to Oruco and continue south to the town of Challapata (approximately 350 km), then head south on Highway 30 to Uyuni. From Uyuni head south on Highway 21 for approximately 110 km (13 km south of Villa Providencia) to a three-way intersection at the junction of Highway 21 the San Vicente gravel access road. Care must be taken as the exit is not clearly marked. From the junction the San Vicente mine is accessed via a two lane, maintained, packed gravel road approximately 126 km south of the town of Uyuni.
Additionally, one may arrive in Uyuni via either Antofagasta, Chile or Arcia, Chile. From Antofagasta, take Chilean Highways 5 to Highway 25 north to Highway 21 north until crossing the Bolivian border which turns to Bolivian Highway 701 north and then Highway 5 north to Uyuni.
However, from Arica head north on Chilean Highway 5 until the Highway 11 junction and proceed east. Follow Highway 11 over the border to Bolivia where the highway becomes Bolivian Highway 27 and head east to Highway 601 south which connects to Highway 430 and proceed south on 430 to the junction or Highway 603 heading. At the intersection of Highway 603 and Highway 30, head south on Highway 30 to Uyuni and from there follow the same directions as per those detailed above.
All potential and possible routes listed above bring those wishing to access Soracaya to the San Vicente mine. So once at the San Vicente mine, Soracaya is accessible by way of a 12-km one lane, loose gravel extension road to the San Vicente mine access road. The road is maintained however during the rainy season and when snow is present, access may be difficult or even impassable due and safe travel practices must be exercised.
SORACAYA PROJECT | NI 43-101 TECHNICAL REPORT | 5-1 |
|
|
Figure 5-1: Access Routes to Soracaya

Source: Kirkham 2024
Table 5-1: Routes to Sinchi Wayra from La Paz
| Route | Distance |
| Red Route | |
| La Paz – Oruro - Huari (paved) | 347 km |
| Huari - Rio Mulatos -Uyuni (paved) | 191 km |
| Uyuni - Cocani Crossing - San Vicente (maintained packed gravel) | 126 km |
| San Vicente - Soracaya (tertiary one-lane loose gravel) | 12 km |
| TOTAL | 676 km |
| Orange Route | |
| La Paz - Potosí (paved) | 552 km |
| Potosí - Uyuni (paved) | 166 km / 240 km |
| Uyuni - Cocani Crossing - San Vicente (maintained packed gravel) | 126 km |
SORACAYA PROJECT | NI 43-101 TECHNICAL REPORT | 5-2 |
|
|
| Route | Distance |
| San Vicente - Soracaya (tertiary one-lane loose gravel) | 12 km |
| TOTAL | 924 km |
| Green Route | |
| La Paz - Potosí (paved) | 552 km |
| Potosí - Tupiza (paved) | 265 km |
| Tupiza -San Vicente (maintained packed gravel) | 250 km |
| San Vicente - Soracaya (tertiary one-lane loose gravel) | 120 km |
| TOTAL | 949 km |
Source: Sinchi Wayra (2024)
Daily commercial flights operate between Uyuni and La Paz. Both Uyuni and Tupiza are connected to the rail system, which serves Bolivia and connects with the ports of Arica and Antofagasta, Chile. The closest railway stations to the Project are Tupiza, Atocha and Uyuni.
Santacruz has its primary office located in the city of La Paz and has regional offices in Potosí where the majority of the purchasing and logistics are arranged.
For potential future ore extraction at Soracaya, there is an access road that is 2.5 m wide and 6.5 km in length that would require rehabilitation and widening. In addition, there is the potential for the construction of a 7-km access road that would connect the San Vicente mine to the Chilcobija-Tupiza road.
| 5.2 | Climate and Physiography |
Soracaya is located in a high plateau known as the Altiplano, which is characterized by its high elevation and arid climate. The topography is rugged and lies approximately 4,400 masl. Vegetation is sparse and the only use of the land, other than for mining activities, is as wild pasture for llamas.
Daytime temperatures range from 4°C in winter and 14°C in the summer. In the winter, nighttime temperatures are frequently below zero with extremes of -15°C. The average annual rainfall is 190 mm, with little to no rain falling between May and September as the rainy season takes place from December to March when up to 20 mm of rain can fall in a single day.
The region occupies one of the western foothills of the Cordillera Oriental. Geomorphologically, it is characterized by arid and steep terrain with elevations that vary between 4,700 masl and 4,000 masl formed into young valleys with steep slopes.
Year-round exploration activities are possible for the Soracaya Project.
SORACAYA PROJECT | NI 43-101 TECHNICAL REPORT | 5-3 |
|
|
| 5.3 | Infrastructure |
| 5.3.1 | Power |
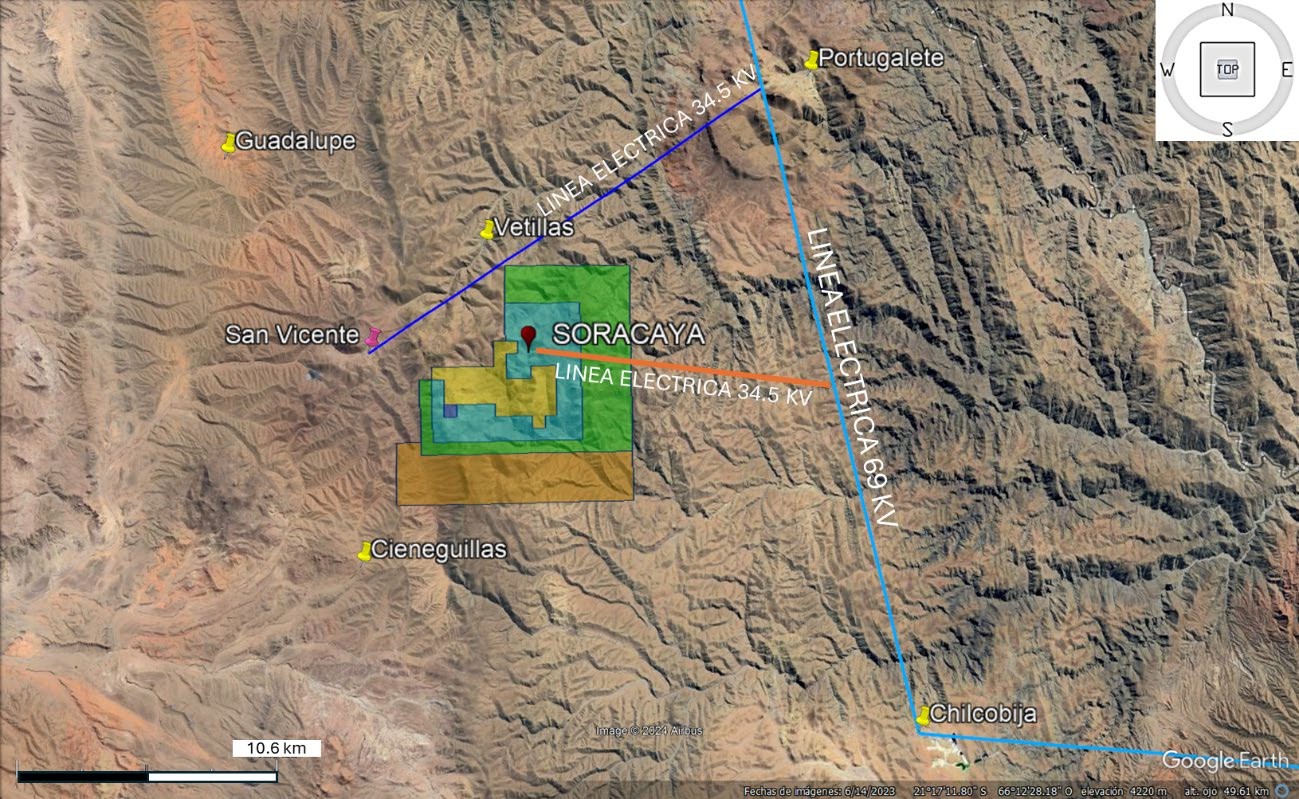
There are three high voltage lines that may be potential sources of power at Soracaya. The closest connects to the 34.5 kV transmission line at the San Vicente mine currently terminates at 3.3 km NWW of Soracaya camp atop Pupusani hill, which is the location of the ENTEL communications antenna.
A power transmission line approximately 20 km in length connects the mine to the Bolivian national power grid at Portugalete which is 69 kV and supplies sufficient power for the plant and mining operations.
Alternatively, is a 34.5 kV transmission line which connects the San Vicente mine to Portusalete and the Tatasi mine. The line passes through Vetillas which is the location of a sub-station for connectivity located
5.2 km NNE of Soracaya.
Finally, a third option is a 34.5 kV transmission line located 10 km east of Soracaya. This line connects Telamayu with the Chilcobija mine however a substation for connectivity would require installation. The location and the potential high-voltage power sources are shown in Figure 5-2.
Figure 5-2: Location of High-Voltage Lines in Proximity to Soracaya
Source: Sinchi Wayra (2024)
SORACAYA PROJECT | NI 43-101 TECHNICAL REPORT | 5-4 |
|
|
| 6 | HISTORY |
The Soracaya site has been worked since colonial times by the Spanish population, this argument is corroborated by the ruins of population and mining activity found in the sector. The quantification of silver production in the past is difficult to establish, however we can assume that in the years when the price of silver, lead and zinc were very important, mining activities were restarted. The first written records of mining activity are from approximately 1820, when the area was named Minas Guernica. The name Soracaya derives from the native Quechua language “Surikhoya”, which in Spanish means “mine with ostriches”.
| 6.1 | Management and Ownership |
Soracaya has been experienced modern mineral exploration since 1992 initiated by Compañía Minera del Sur S.A. (COMSUR S.A.).
In 2005, COMSUR S.A. sold Soracaya to Glencore which formed Sinchi Wayra S.A.
On October 11, 2021, Santacruz entered into the Definitive Agreement with Glencore whereby Santacruz agreed to acquire a portfolio of Bolivian silver assets from Glencore, including the following: (a) a 45% interest in the Bolivar Mine and the Porco Mine, held through an unincorporated joint venture between Glencore’s wholly-owned subsidiary Illapa and COMIBOL, a Bolivian state-owned entity; (b) a 100% interest in the Sinchi Wayra business, which includes the producing Caballo Blanco mining complex; (c) the Soracaya exploration project; and (d) the San Lucas ore sourcing and trading business (the Assets).
On May 10, 2023, Santacruz and Glencore entered into a framework agreement to amend certain terms of the transaction documents pertaining to the acquisition of the assets. On March 28, 2024, Santacruz and Glencore entered into the binding term sheet which amends the terms of certain deferred consideration and ancillary documents pertaining to the acquisition of the Assets.
Santacruz thus currently owns 100% of the Soracaya Project.
| 6.2 | Historical Exploration |
Modern exploration activities have been performed on the Soracaya property since 1992, initiated by COMSUR S.A., which consisted of geological mapping and geochemical sampling of the main structures including the Esperanza and España veins within the historically explored areas. This resulted in anomalous silver, zinc and lead values.
In 1992, COMSUR S.A. carried out a systematic sampling of veins and rocks within the historic mining openings level-0 located near the Soracaya camp. The Esperanza mineralized structure was encountered and systematically sampled every 2 m. The most significant interceptions on this structure were 156 m of 525 g/t Ag, 38 m of 5.5% Pb, 52 m of 536 g/t Ag, 74 m of 968 g/t Ag, 34 m of 3.8% Pb and 22 m of 5.45% Zn. There is no database nor documentation available to validate and verify this information. A “Qualified Person” as per NI 43-101 has not done sufficient work to validate or verify this information and results. Santacruz is not treating this information however believes it to be relevant as a historical reference and illustrates location, extent and tenure of the deposit and mineralization. Twin drilling would be required to verify these results.
SORACAYA PROJECT | NI 43-101 TECHNICAL REPORT | 6-1 |
|
|
Exploration programs were suspended in 1993 due to depressed metal prices.
From 1995 to 1996, 72 samples of stream sediments were collected throughout the Soracaya Project area resulting in several gold and silver anomalies. In addition, geochemical sampling was performed on 645 soil samples that were collected throughout the area. For the most part, the program was focused on targeting low-grade but high-volume argentiferous and auriferous mineralization, primarily at and around Cerro Evangelista. This work resulted in the identification of an approximately 240 m long by 40 m wide, anomalous zone which was then investigated via excavated trenches as a precursor to drilling. The samples were only analyzed silver, zinc and lead. No records of the assay results are available.
In 1998, COMSUR S.A. restarted exploration activities, with the objective of evaluating the potential of extending the mineralization to depth which had been identified on the surface during the 1995 to 1996 campaign. This included a 36-hole diamond drillhole program totaling 8,896.7 m of drilling. Operations were again suspended in 2001 due to reduction of exploration budgets and depressed metals prices, particularly zinc. However, results from the exploration program were positive culminating in a preliminary resource estimate in addition to establishing the exploration potential in the adjacent Tuna Rumi and Cerro Evangelista sectors. The Cerro Evangelista sector had been previously prospected between 1995 and 1996, where work included regional mapping in addition to soil, stream sediment and rock sampling.
Furthermore, a 13.8 line-km induced polarization (IP) dipole-dipole geophysical survey was performed, however the results were not encouraging. In addition, a ground magnetic survey was performed on the Cerro Evangelista, which resulted in the interpreted location of the contact between the Paleozoic and the volcanic complex, the identification of structures which have a preferential EW and NS orientation and the classification of an intrusive as an apophysis of a major intrusion. No records of the raw data are available.
Between 1998 and 2001, sampling was carried out throughout the Soracaya property, mainly within the Tuna Rumi, Potos Orkho and Cerro Evangelista sectors. This work was primarily focused on exploring the extensions of the main structures, namely the Esperanza, España and 10 de Febrero veins. Trenching was performed followed by systematic sampling of mineralized material and vein structures. A total of 244 rock and/or vein splinter samples were taken, covering the central and eastern areas of the Soracaya property. No records of the assay results are available.
In 2005, COMSUR S.A. sold Soracaya to Glencore which formed Sinchi Wayra. From 2005 through 2008, exploration activities were resumed at Soracaya, including detailed geological mapping of the property particularly the volcanics, 41 trenches were created 495 surface samples being collected, performing a detailed 42.3 km2 topographic survey, and performing a 33.2 km2 geophysical survey including IP and ground magnetics.
Results of the sampling program showed anomalous gold, greater than 0.20 g/t, within the Cerro Evangelista sector and the breccias within the central areas of the Tuna Rumi sector. Anomalous silver values, greater than 81 g/t, were encountered at Cerro Evangelista which is the location of the Candelaria vein, Tuna Rumi which has the La Dulce, Española veins and south of Cerro Evangelista which is the location of the Carlita and Prometedora veins. Anomalous zinc values have only been encountered in the south-west sector of Cerro Evangelista. Anomalous lead throughout correlate with the anomalous silver.
SORACAYA PROJECT | NI 43-101 TECHNICAL REPORT | 6-2 |
|
|
In 2006, a topographic survey was performed that entailed the georeferencing of six geodetic points for horizontal control at the Soracaya Project. These points were tied into the CM-24 reference station, belonging to the Mining Geodetic Network of the National Technical Service of Mines (SETMIN). With these reference points, the 42.3 km2 topographic survey was performed, along with surveying 35 geophysical lines totaling 141.1 km.
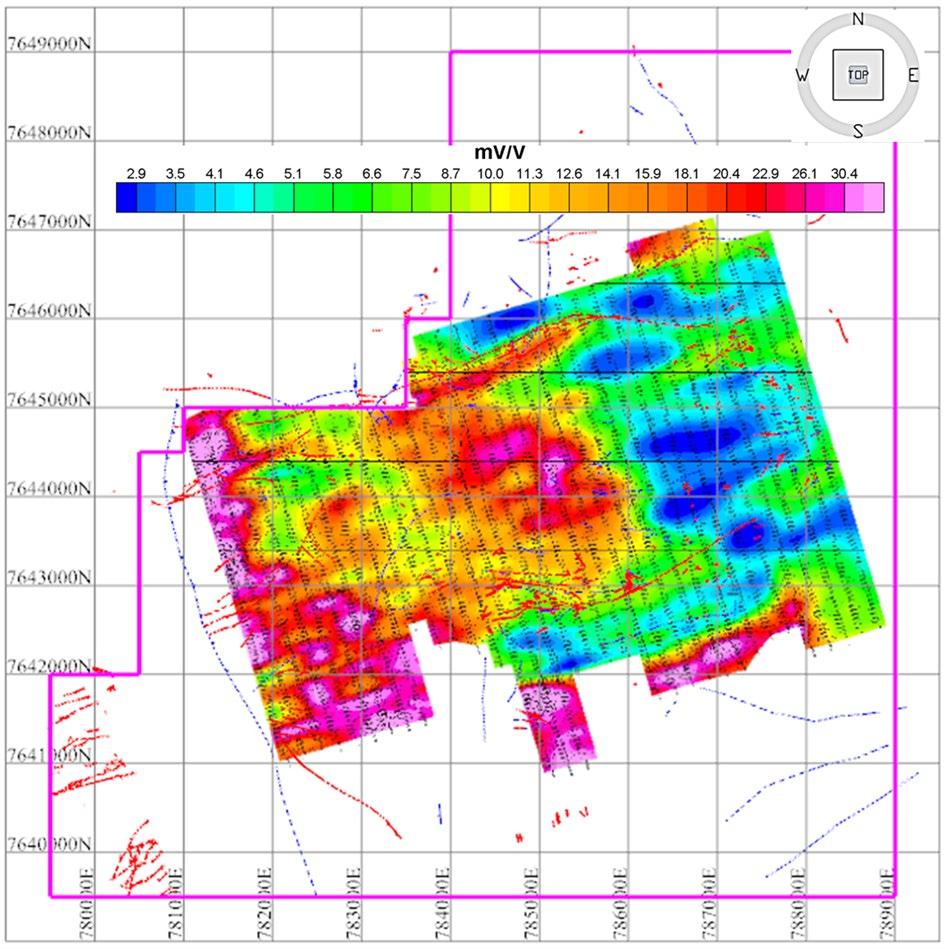
In 2005, COMSUR S.A. contracted Arce Geofísica del Perú of Lima, Peru to carry out a 33.18 km2 IP geophysical survey. This program resulted in the identification of anomalous zones with possible sulfide mineralization. Figure 6-1 illustrates the results from the 2005 geophysical survey which identified anomalies which indicated potential mineralization at Cerro Evangelista and the volcanic and siliceous brecciated areas identified from the geological mapping in the Tuna Rumi sector.
Figure 6-1: Geophysical Survey Results – Soracaya
Source: Sinchi Wayra (2024)
SORACAYA PROJECT | NI 43-101 TECHNICAL REPORT | 6-3 |
|
|
In addition, two diamond drilling programs were implemented, the first in 2005 to 2006 which resulted in the completion of 14 drillholes totaling 4,903 m which was focused on targeting geophysical anomalies. A second program was performed in 2008 which resulted in the completion of nine drillholes totaling 2,605.6 m.
The outcomes of the first program were not particularly encouraging, however the results of the second program were the discovery of massive and disseminated structures with significant gold mineralization in the Cerro Evangelista area.
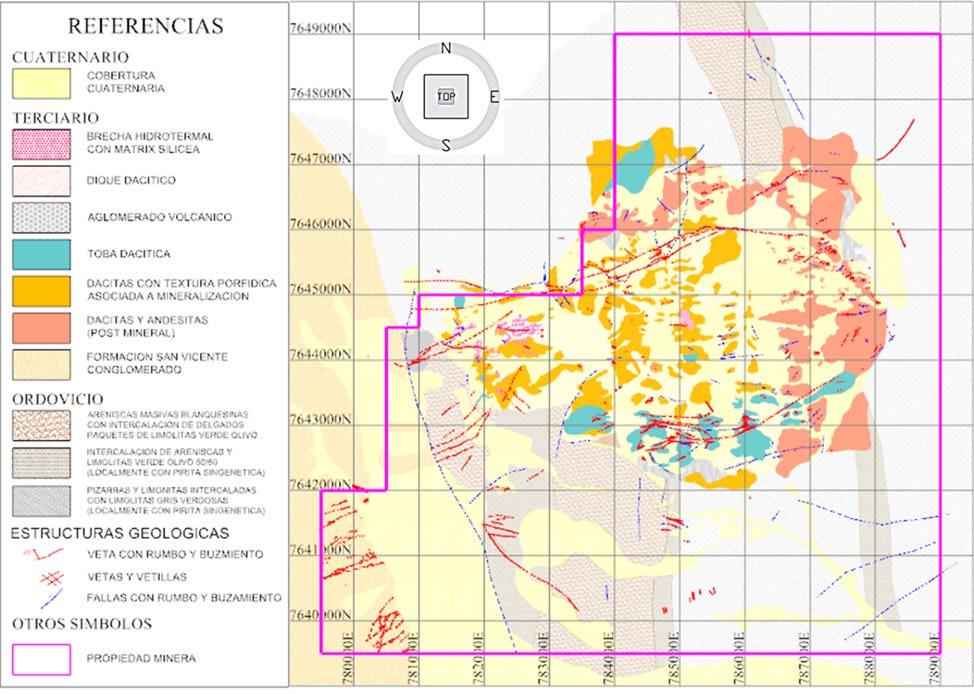
The detailed geological survey and mapping (Figure 6-2) that occurred during this phase of the program within the deposit area was carried out, placing more emphasis on volcanics within the Potos Orkh, Tuna Rumi and Cerro Evangelista. Within the Potos Orkho sector mapping was focused on the Esperanza vein system along with the España and 10 de Febrero structures; the San Vicente, Reyes, La Dulce veins and Tuna Rumi veins within the Tuna Rumi sector; and investigation of hydrothermal high sulfidation siliceous and radial structures within the Cerro Evangelista sector.
Figure 6-2: Geological Mapping at Soracaya
Source: Sinchi Wayra 2024
In the 2015 to 2016 period, exploration work resumed.
SORACAYA PROJECT | NI 43-101 TECHNICAL REPORT | 6-4 |
|
|
| 7 | GEOLOGICAL SETTING AND MINERALIZATION |
| 7.1 | Introduction |
The regional geological setting and tectonic framework detailed herein, is primarily referenced from the definitive publications for Bolivian geology such as Redwood (2021) and Arce-Burgoa (2009). The local and property geology including structure and mineralization is sourced through local and site knowledge along with Company documentation.
| 7.2 | Geological Tectonic and Lithological Framework |
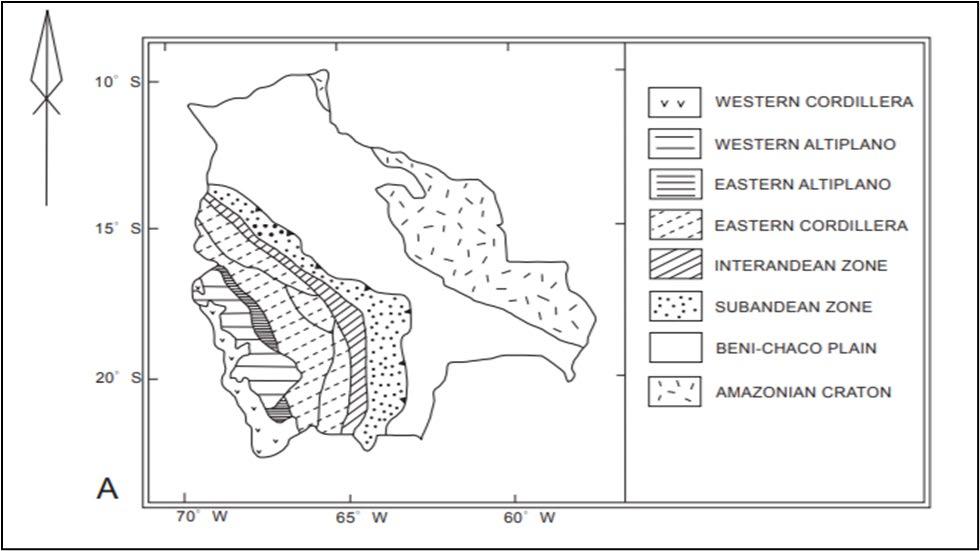
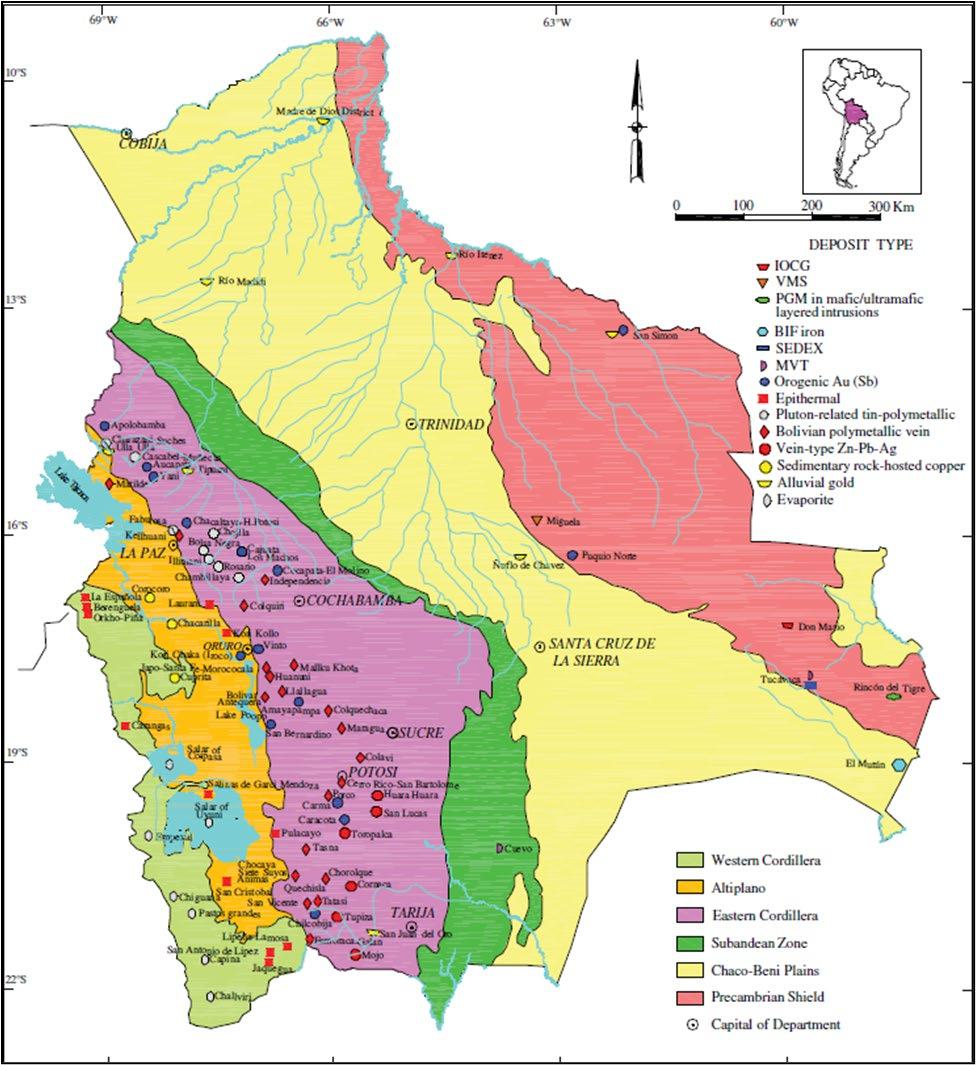
The geologic-tectonic framework of Bolivia can be divided into six physiographic provinces. From east to west (Figure 7-1), these are the Precambrian Shield, the Chaco-Beni Plains, the Sub Andean zone, the Eastern Cordillera (or Cordillera Oriental), the Altiplano, and the Western Cordillera (or Cordillera Occidental). The latter four provinces are elements of the Mesozoic-Cenozoic Andean orogen in Bolivia (Arce-Burgoa, 2002, 2007), which hosts an abundance of mineral deposits (Figure 7-2). The landward Precambrian Shield, exposed far to the east of the Andes, represents an area of great mineral potential, but has had limited exploration.
Figure 7-1: Regional Geology Setting
Source: Arce-Burgoa (2009)
SORACAYA PROJECT | NI 43-101 TECHNICAL REPORT | 7-1 |
|
|
Figure 7-2: Regional Geology Setting with Deposit Types
Source: Arce-Burgoa (2009)
Rocks of the Precambrian Shield in easternmost Bolivia have commonly been hypothesized to represent the southwestern part of the Amazon craton, covering an area of approximately 200,000 km2, or 18% of Bolivia. The lithological units are mainly Mesoproterozoic medium and high-grade metasedimentary and meta-igneous rocks, which have been covered by Tertiary laterites and Quaternary alluvial basin deposits.
SORACAYA PROJECT | NI 43-101 TECHNICAL REPORT | 7-2 |
|
|
Earlier studies have referred to this as the Guaporé craton, but Santos et al. (2008) proposed that are not basement rocks belonging to the craton proper but rather, that they represent the 1.45–1.10 Ga Sunsas orogen, formed along the craton margin. Major tectonic events in the orogen are dated 1465– 1420, 1370– 1320, and 1180–1110 Ma. The subsequent Brazilian tectonism (ca. 600–500 Ma) only had minor effects on the orogen (Litherland et al., 1986, 1989). Subsequent Brazilian tectonism (ca. 600–500 Ma) had only minor effects on the orogen (Litherland et al., 1986, 1989).
The Chaco-Beni plains, located in the central part of the country, cover 40% of Bolivia. The topography is dominated by the southwestern Amazon basin wetlands. Lying below 250 m elevation the wetlands offer little relief or outcrop. These extensive plains are part of the foreland basin of the Central Andes and include a 1 km to 3 km thick sequence of Cenozoic foreland alluvial sediment in the west and much thinner accumulations atop a broad forebulge to the east (Horton and DeCelles, 1997). This sequence overlies Tertiary red-bed sediments that are >6 km thick which in turn rest unconformably on the Precambrian crystalline basement to the east and Paleozoic and Mesozoic sedimentary rocks to the west. The alluvial accumulations are products of several Neogene to Holocene episodes of post-kinematic and epeirogenetic isostatic adjustment in the Eastern Andes and its piedmont.
Rocks of the Bolivian Andean orogen include the Subandean zone, Eastern Cordillera, Altiplano, and the Western Cordillera, represent approximately 42% of Bolivia. These physiographic provinces form a series of mountain chains, isolated mountain ranges, and plains, with a north-to-south trend (Ahlfeld and Schneider-Scherbina, 1964). This part of the orogen has a length of 1,100 km, with a maximum width of 700 km, and an average crustal thickness of 70 km. The orogen displays a distinct oroclinal bend in the main fabric orientation at the Arica Elbow (18°–19°S).
The Subandean zone is the thin-skinned, inland margin of an orogen-parallel fold-and-thrust belt, which is partly covered by sediments of the western side of the active foreland basin. It is characterized by north- south-trending, narrow mountain ranges with elevations between 500 m and 2,000 m. Rock types in this province include Paleozoic siliciclastic marine and Mesozoic and Tertiary continental sedimentary rocks.
The Eastern Cordillera, the uplifted interior of the Andean thrust belt, includes poly deformed Ordovician to Recent shale, siltstone, limestone, sandstone, slate, and quartzite sequences. These mainly Paleozoic clastic and metamorphic rocks have an approximate area of 280,000 km2 and represent flysch basin sediments that were deposited along the ancient Gondwana margin and first deformed in the middle to late Paleozoic. After Permian to Jurassic rifting, they were uplifted to high elevation and folded and thrusted again during Andean compression, which may have begun as early as Late Cretaceous (McQuarrie et al., 2005).
The Altiplano is comprised of a series of intermontane, continental basins with a combined length of approximately 850 km, an average width of 130 km, and an area of approximately 110,000 km2. The basins have been uplifted to form a high plateau at elevations between 3,600 masl and 4,100 masl. Geomorphologically, the province consists of an extensive flat plain that is interrupted by isolated mountain ranges. Crustal shortening, rapid subsidence, and, with concurrent sedimentation accumulated a sequence thickness of as much as 15 km during the Andean orogeny (Richter et al., in USGS and GEOBOL, 1992). Basin fill was dominated by erosion of the Western Cordillera during Late Eocene-Oligocene, but Neogene shortening in the Eastern Cordillera and Subandean zone led to a subsequent dominance of younger sediments derived from the east (Horton et al., 2002).
SORACAYA PROJECT | NI 43-101 TECHNICAL REPORT | 7-3 |
|
|
The Western Cordillera consists of a volcanic mountain chain that is 750 km in length and 40 km in average width, with an area of about 30,000 km2. Late Jurassic and Early Cretaceous flows and pyroclastic rocks and marine sandstone and siltstone sequences dominate the Cordillera in Peru and Chile. Lesser Late Cretaceous continental sediment was deposited above the marine rocks and, simultaneously, large granitoid plutons, many of which are associated with large porphyry orebodies, were emplaced along the coasts of adjacent Peru and Chile. In Bolivia, the province is dominated by high andesitic to dacitic strata volcanoes, erupted since ca. 28 Ma, which define the narrow, main Central Andes magmatic arc.
| 7.2.1 | Eastern Cordillera |
The Soracaya deposit is located in the southern part of the Eastern Cordillera, a thick sequence of Paleozoic marine siliciclastic and argillaceous sedimentary rocks deposited on the western margin of Gondwana and deformed in a fold-thrust belt. There were two major tectonic cycles in the Paleozoic: The Lower Paleozoic Famatinian cycle (the Tacsarian and Cordilleran cycles of Bolivia), and the Upper Paleozoic Gondwana cycle (Subandean cycle of Bolivia).
The late Precambrian supercontinent broke up with the opening of the southern Iapetus Ocean and the spreading of Laurentia away from Gondwana in the latest Precambrian or early Cambrian (Figure 7-3, Figure 7-4 and Figure 7-5). Ocean closure and collision of Laurentia and the South American segment of Gondwana during the Ordovician formed the Famatinian orogenic belt of NW Argentina (Dalla Salda et al., 1992a) which has been correlated with its probable Laurentian equivalent, the Taconic event of the Appalachian orogen (Dalla Salda et al., 1992b). The Famatinian belt records extension in the latest Precambrian with establishment of subduction during the Cambrian and closure of the ocean basin and continent-continent collision in the Ordovician (480-460 Ma) (Figure 7-6). The Pre-Cordillera Terrane carbonate platform of western Argentina, which has faunal similarities with eastern North America, may be a sliver of eastern Laurentia detached in the late Ordovician when Laurentia separated from Gondwana again (Dalla Salda et al., 1992a; b) (Figure 7-7).
SORACAYA PROJECT | NI 43-101 TECHNICAL REPORT | 7-4 |
|
|
Figure 7-3: Plate Tectonic Reconstructions of the Neoproterozoic Subcontinent and the Late Precambrian Supercontinent after the Opening of the Southern Iapetus Ocean
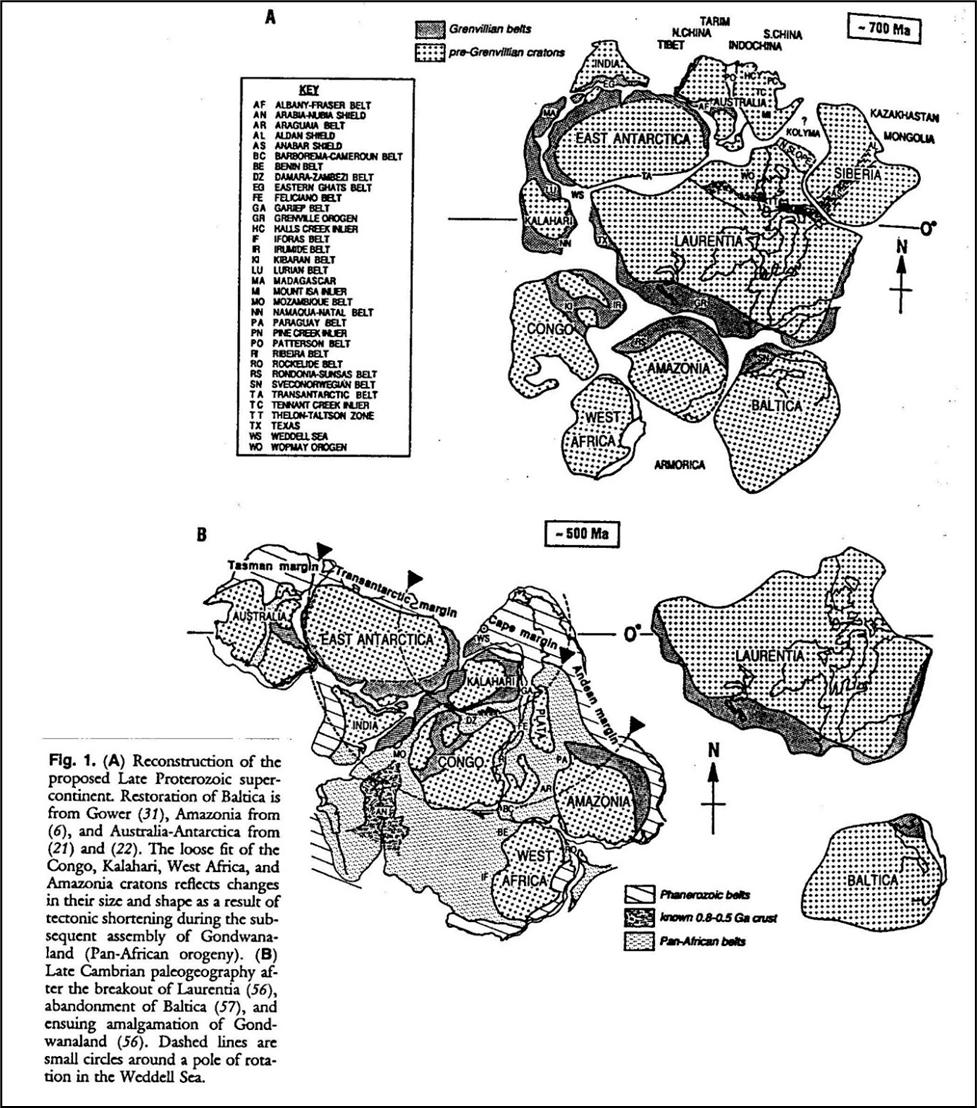
Source: Hoffman (1991)
SORACAYA PROJECT | NI 43-101 TECHNICAL REPORT | 7-5 |
|
|
Figure 7-4: Plate Tectonic Reconstructions of the Neoproterozoic and Late Precambrian Subcontinents
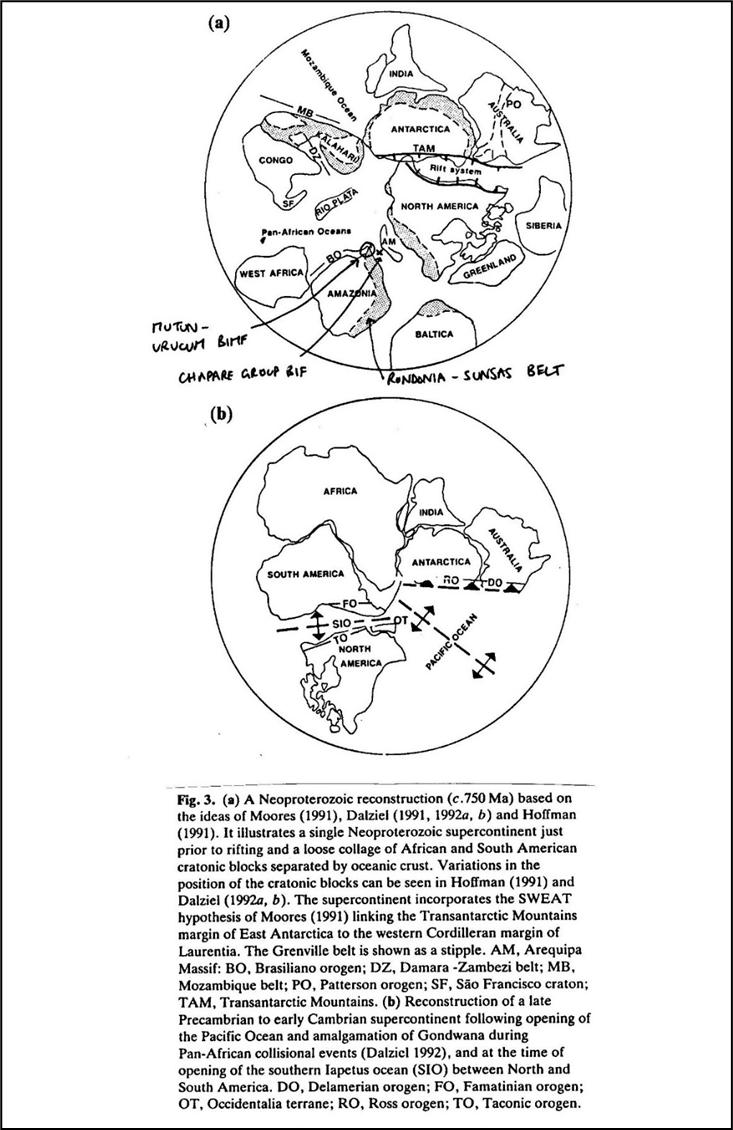
Source: Story (1993)
SORACAYA PROJECT | NI 43-101 TECHNICAL REPORT | 7-6 |
|
|
Figure 7-5: Paleogeography of SW Gondwana Margin in the Early Ordovician
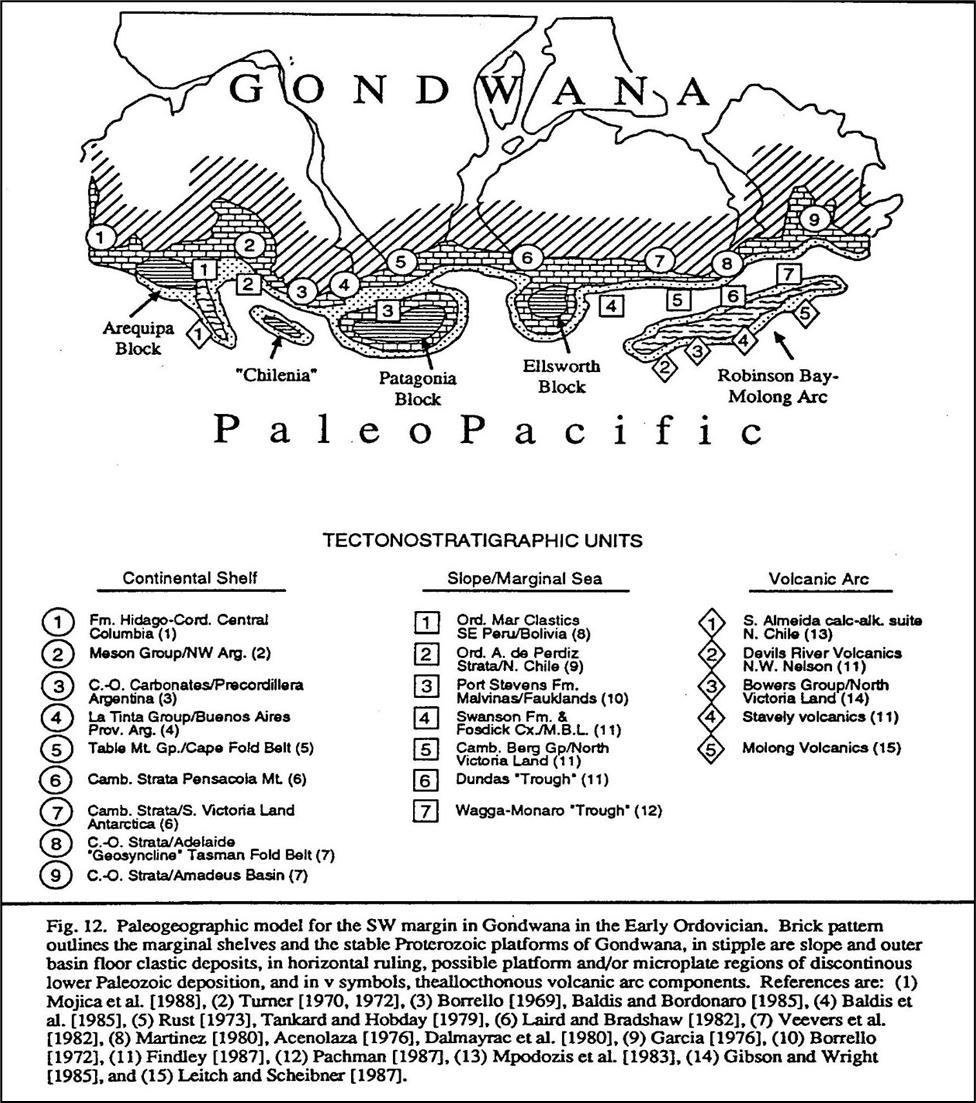
Source: Forsythe et al, (1993)
SORACAYA PROJECT | NI 43-101 TECHNICAL REPORT | 7-7 |
|
|
Figure 7-6: The Famatinian – Taconic Orogen in the Middle Ordovician
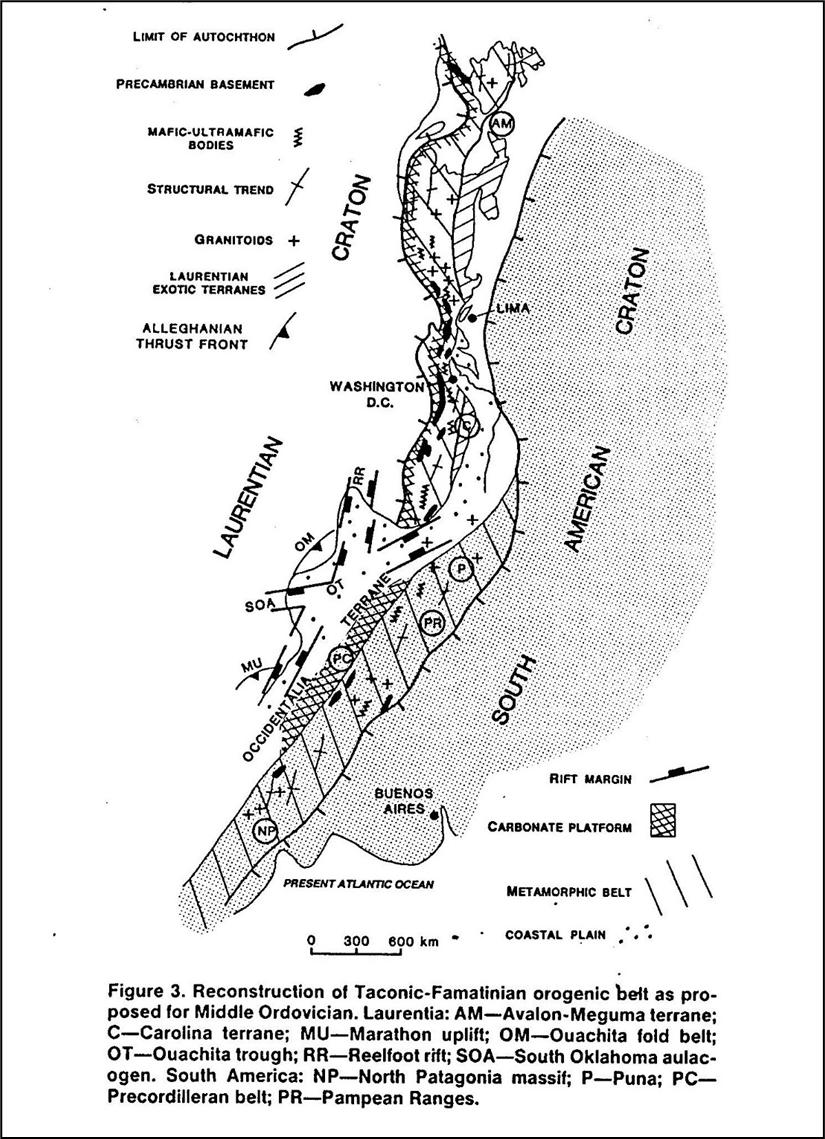
Source: Dalla Salda et al, (1992b)
SORACAYA PROJECT | NI 43-101 TECHNICAL REPORT | 7-8 |
|
|
Figure 7-7: The Ordovician of the Central Andes (Cunningham et al., 1994b)
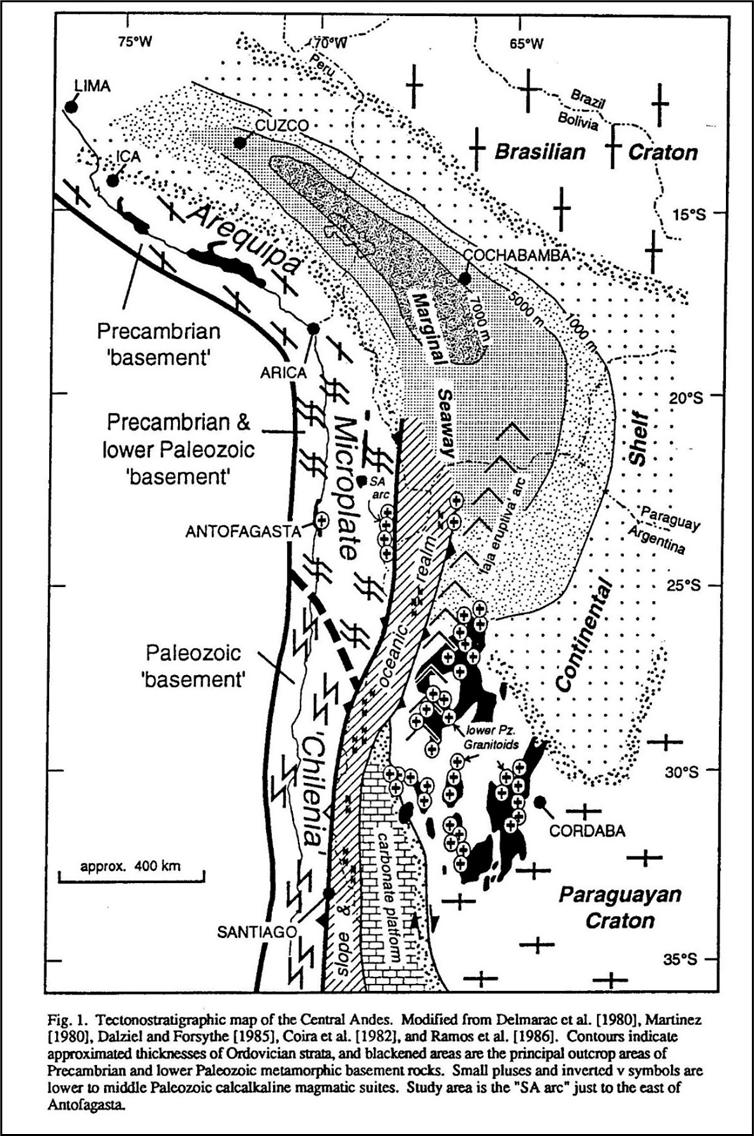
Source: Forsythe et al, (1993)
SORACAYA PROJECT | NI 43-101 TECHNICAL REPORT | 7-9 |
|
|
| 7.2.2 | Tacsarian Cycle (Upper Cambrian to Ordovician) |
During the Upper Cambrian to Caradoc Tacsarian Cycle a broad marine back-arc rift basin existed in Bolivia-Peru with its axis in the Eastern Cordillera. There was oceanic spreading in the southern part of the basin (Figure 7-6), the Puna Straits in NW Argentina, preserved as ophiolites, with intrusions of basic dikes and sills further north in the Bolivian basin. A possible magmatic arc on the Arequipa Terrane to the west of the basin, represented by calc-alkaline plutonic and volcanic rocks dated at 487-429 Ma (Mpodozis & Ramos, 1989), separated the back arc basin from a forearc. The Arequipa microplate swung about a hinge to the NW to form the Puna Straits and Bolivia-Peru back arc basin, as a Gulf of California-type basin (Sempere, 1991) or Japan-type basin (Forsythe et al., 1993). This was bordered to the east by another subduction-related magmatic arc in western Argentina, the Puna arc, and its southward continuation, the Sierras Pampeanas magmatic arc, represented by a granitoid belt (Mpodozis & Ramos, 1989). The Ocloyic Orogeny closed the Puna Straits Ocean basin during the Llanvirn-Caradoc, as evidenced by granitic magmatism.
In SW Bolivia, the sedimentary sequence begins with shallow marine clastic sediments of the basal Tremadoc transgression, which grade upwards into open marine thick graptolitic shales intercalated with subordinate turbidites and slumps of late Cambrian – Llanvirn age. The base of this super sequence outcrops in several localities along the Cochabamba-Chapare Road (central part of the Eastern Cordillera), which were described as part of the Limbo Group and of other Cambrian formations (Castaños & Rodrigo, 1978).
The majority of the sequence consists of thick and monotonous Lower to Middle Ordovician shale beds, with subordinate siltstones and sandstones are part of the Cochabamba Group, which from base to top includes the Capinota, Anzaldo, and San Benito Formations. In the southern part of Tarija, the sequence base includes shallow marine clastic rocks. These grade upward to thick, marine graptolitic shales with subordinate Cambrian turbidites of the Condado, Torohuayco, and Sama Formations (Castaños & Rodrigo, 1978). Further north, the sequence consists of thick graptolitic and cephalopodic shales: which have localized the main decollement zone during the Neogene, and consequently older rocks are rarely exposed in the Bolivian Andes.
In southern Bolivia the shales were affected by the Ocloyic deformation with development of folding, cleavage and schistosity. The effects of this orogeny diminished to the east and north, and are not identified north of 20°S. In the north and east, the basin developed as a marine foreland basin during deformation which was infilled with the deposition of a thick, monotonous sequence of shallowing upward, shallow marine siliciclastic interbedded sandstone and shale in the Middle to Late Ordovician (Llanvirn - Caradoc) (Sempere, 1990a, b, 1991, 1993).
| 7.2.3 | The Cordilleran Cycle (Late Ordovician to Late Devonian) |
During the Late Ordovician to Late Devonian Cordilleran Cycle (Chuquisaca Super sequence), the Bolivia- Peru basin occupied a back-arc setting, then from the late Llandovery formed a marine foreland basin. These basins lay east of the Puna arc on the Arequipa block, which continued south as the Sierra Pampeanas magmatic arc granitoid belt until the Early Carboniferous. These arcs were related to an eastward-dipping subduction regime east of the Precordillera. The cratonic Chilenia Terrane of the Cordillera Frontal collided with the continental margin in the latest Devonian to early Carboniferous, and the collision caused intense deformation in the western Precordillera. (Mpodozis & Ramos, 1989; Ramos et al., 1986; Ramos, 1988; Sempere, 1993).
SORACAYA PROJECT | NI 43-101 TECHNICAL REPORT | 7-10 |
|
|
The Cordilleran cycle began in Bolivia with rapid deepening of the basin as a back-arc with black pyritic- shale deposition (Tokochi Formation) followed by resedimented glacial-marine diamictites sediments in the Ashgill (Cancañiri Formation) with rare thin fossiliferous limestones. These are overlain by thickly bedded, thinning-upward turbidites (Llallagua Formation) and/or dark shales with minor turbidites (Uncía/Kirusillas Formation) from late Llandovery to Ludlow. Deposition in the basin was controlled by active normal faulting. Facies succession was induced by a major glacio-eustatic sea level low (the Ashgillian ice age) which developed between two maximum flooding episodes. The Uncía/Kirusillas Formation was the first of three main shallowing-up megasequences, which began with thick dark shales and ended with sandstone dominated units, of late Llandovery - Lochkovian, Pragian - early Giventian and late Giventian - middle Famennian ages. These were deposited in a large subsiding marine foreland basin covering the Bolivian Andes, Subandean zone and Chaco-Beni plains, reaching as far as the SW edge of the craton where they onlap the Chiquitos Supergroup (Litherland et al., 1986). This interval was a time of onlap towards the northeast and of deposition of major hydrocarbon source rocks in Bolivia. (Sempere, 1990a; b;1991; 1993).
The Cordilleran Cycle is generally considered to have been terminated by the Late Devonian to Early Carboniferous Hercynian Orogeny, which has been defined in Perú where the effects are much more evident. The presence of Hercynian orogenesis in Bolivia has been questioned however, due to Late Triassic U-Pb zircon age dates of 225 Ma (Farrar et al., 1990) for both foliated and weakly foliated facies of the Zongo-Yani granite, and by implication its wide metamorphic aureole, which was assigned an “Eohercynian” age by Bard et al. (1974).
| 7.2.4 | Subandean (Gondwana) Cycle (Upper Paleozoic) |
The Upper Paleozoic Gondwana Cycle was characterized by establishment of eastward subduction along the new Pacific margin west of Chilenia (Cordillera Frontal) and development of a broad forearc accretionary prism, which contains blue schists and ocean floor fragments. A magmatic arc lay to the east of the subduction zone. This cycle was terminated by deformation during the lower Triassic Gondwanide orogeny, the effects of which southward. (Mpodozis & Ramos, 1989; Ramos et al., 1986; Ramos, 1988).
In Bolivia, the Upper Paleozoic Subandean Cycle is characterized by the Late Devonian (Late Famennian) - Early Carboniferous (Mississippian) Villamontes Supersequence, deposited in the Subandean zone, Chaco and Titicaca basin, is mainly marine and comprises mudstone, black shale, sandstone, coal, glacial- marine sediments, diamictites and slumps, the stratigraphy of which is conflictive due to rapid facies variations (Sempere, 1993). The Eastern Cordillera was emergent. This was a period of high epeirogenic activity and synsedimentary tectonic instability coeval with the Hercynian deformation in Peru. Sempere (1993) considers the Mississippian sedimentation to have been the culmination of the Silurian - Devonian evolution.
Subsequently the Late Carboniferous (Pennsylvanian) - Early Triassic Cueva Supersequence was developed during a period of low subsidence and subtropical climate. In western Bolivia there was a shallow carbonate platform in the Titicaca Basin (Copacabana Formation) with deposition of white littoral-fluvial- eolian sands and evaporites on the eastern platform in the Subandean zone. The compressional Gondwana (Late Hercynian) deformation in the middle Permian of the Eastern Cordillera of Peru had weak effects in the Eastern Cordillera of Bolivia. This deformation was accompanied by transgression of the marine carbonate platform to the east. Post-orogenic calc-alkaline magmatism in the Early - Middle Triassic evolved in the late Middle Triassic toward continental tholeiitic compositions, reflecting the extension which initiated the Andean Cycle (Sempere, 1990a; b; 1993; Soler & Sempere, 1993).
SORACAYA PROJECT | NI 43-101 TECHNICAL REPORT | 7-11 |
|
|
| 7.2.5 | The Mesozoic to Cenozoic Andean Cycle: The Serere, Puca and Corcoro Supersequences |
The Andes developed during the Mesozoic to Cenozoic Andean Orogenic Cycle. Distension in the Middle to Upper Triassic related to the initial break up of Gondwana marked the start of the Andean Cycle. In the first part of the cycle, from Triassic to mid Cretaceous, an eastward dipping subduction zone existed along the length of the Pacific margin of Peru and Chile with a magmatic arc and back-arc basin, which in some segments had oceanic crust. In Chile, the arc was superimposed on the Late Paleozoic accretionary prism and an eastward younging coastal batholith intruded. (Cobbing, 1985; Dalziel, 1986; Mpodozis & Ramos, 1989).
During the Middle Triassic - Middle Jurassic, the Andean region of Bolivia was part of a stable cratonic regime. An initial rifting process of late Middle Triassic age developed in several areas, and numerous narrow grabens were filled by fluvio-lacustrine red beds and evaporites, accompanied by tholeiitic to transitional basalts (Sempere, 1990a; 1993; Soler & Sempere, 1993). Cessation of rifting in Bolivia was probably a consequence of a regional tectonic reorganization at about 220 Ma, which probably marked the resumption of subduction along the Pacific margin. The subsequent Late Triassic - Middle? Jurassic onlapping sedimentation of fluvial and eolian sands was probably controlled by post-rift thermal subsidence. The environment was of sandy deserts on the craton, akin to the Arabian Shield (Sempere, 1990a; 1993). These deposits of the Serere Supersequence occur in the Eastern Cordillera and Subandean Zone.
Since the Late Jurassic, Bolivia has been part of the Pacific subduction regime. This was marked by a Kimmeridgian rifting event in Bolivia, the “Araucana Phase”, with extrusion of alkaline basalts which initiated the Puna Supersequence (Sempere et al., 1989; Sempere, 1993; Soler & Sempere, 1993). Bolivia was set in a back arc setting to the east of the Pacific margin arc and back-arc basin, with deposition of coarse clastic continental sediments and alkali basalts in the Potosí and Titicaca basins in a distensive regime related to a transtensional continental margin until the Aptian (Sempere et al., 1989).
The Upper Cretaceous and Cenozoic of Perú - Chile was characterized by a subduction-related continental magmatic arc with no back-arc basin. In Peru, the 110 - 60 Ma Coastal Batholith was emplaced into the Jurassic - Early Cretaceous back-arc basin volcanic pile between the Mochica and Incaic 1-fold phases (Pitcher et al., 1985). At the same time in the Central Andes the magmatic arc migrated eastwards. Large parts of the forearc zone and Mesozoic arc were removed during the Cretaceous and Tertiary, either by subduction erosion or by longitudinal strike-slip faults such as the Atacama Fault (Mpodozis & Ramos, 1989).
The mid Cretaceous compressive event inverted the Tarapacá back-arc basin of north Chile (Late Triassic - Early Cretaceous) to form the proto-Domeyko Cordillera fold-thrust belt (Mpodozis & Ramos, 1989). In Bolivia, sedimentation of the Puca Supergroup continued in a distal external foreland basin, with deposition controlled by rifting and eustatic marine transgressions from the NW. The sequence is transgressive with successively younger units covering greater areas and reaching a total thickness of up to 5,600 m in the Sevaruyo area. The strata consist of fine red-bed sediments, evaporites and alkali basalts, with marine red shales in the Aptian and marine carbonates in the Cenomanian, Campanian and Maastrichtian. (Riccardi, 1988; Sempere et al., 1989; Soler & Sempere, 1993). The end of the Puca Supersequence is marked by an important unconformity developed at the end of the Paleocene, followed by deposition of thick red beds in the Altiplano and Eastern Cordillera in an external continental foreland basin during the Eocene and Oligocene (53 - 27 Ma; Sempere 1990a).
SORACAYA PROJECT | NI 43-101 TECHNICAL REPORT | 7-12 |
|
|
The Cenozoic evolution of Bolivia was dominated by considerable horizontal shortening (Sempere, 1990). Cenozoic basins of the Corocoro Supersequence developed in the Cordillera and in the plains in that time are related to the uplift of the Andes. During the Lower Paleocene-Lower Oligocene, a foreland basin formed east of the Andes. A thickening of the crust enabled the accumulation of 2.5 km of red beds in the Altiplano and Eastern Cordillera (Sempere, 1995).
| 7.2.6 | The Andean Orogeny |
The first major deformation in the Andean Cycle in Bolivia occurred during the Late Oligocene to Early Miocene (27 - 19 Ma) when the orogenic front jumped from west of Bolivia to the Eastern Cordillera, and the Bolivian Andes started to develop as a mountain belt. Major crustal shortening by thrusting occurred in the Eastern Cordillera, and deformation of the Subandean Zone also began. Since the Late Oligocene, the Altiplano has functioned as an intermontane foreland basin with deposition of thick continental sediments, with smaller intermontane basins in the Eastern Cordillera.
The external foreland basin moved east to the Subandean - Llanura (Beni-Chaco) Basin. The second major period of thrusting occurred between 11 - 5 Ma. Thrusting is mainly eastward-verging towards the foreland, with an important west-verging back-thrust belt in the eastern Altiplano and western side of the Eastern Cordillera.
| 7.2.7 | Mesozoic to Cenozoic Magmatism |
Extension-related granites were intruded in the Cordillera Real in the Triassic–Jurassic (227 - 180 Ma) (Everden et al., 1977; McBride, 1977; Grant et al., 1979; Farrar et al., 1990).
Alkaline volcanic activity was initiated in the Late Oligocene (28 - 21 Ma) in the Western Cordillera and western Altiplano, coincident with the first major period of deformation. At the same time granitoid plutons intruded in the southern part of the Cordillera Real (Illimani, Quimsa Chata, Santa Vera Cruz) with related tin-tungsten-silver-lead-zinc-polymetallic mineralization (28 - 20 Ma). Similar deposits also developed to the south as far as Potosí, such as Colquiri and Chicote Grande. These deposits are hosted by Paleozoic sediments and related to buried plutons of this age. The main period of magmatism was the Middle Miocene (17 - 12 Ma) with an eastward “breakout” of magmatism in an unusually broad arc across the Western Cordillera, Altiplano and Eastern Cordillera, generally forming small extrusive (domes) and intrusive (stocks, sills) bodies. Further magmatism occurred across this wide arc during the Late Miocene (10 - 5 Ma) during the second main period of crustal shortening. This was characterized by stratovolcanoes, ash-flow calderas, and major ignimbrite shields such as Los Frailes and Morococala in the Eastern Cordillera. (Baker, 1981; Baker & Francis, 1978; Evernden et al., 1977; Grant et al., 1979; McBride et al., 1983; Redwood, 1987; Redwood & Macintyre, 1989; Soler & Jimenez, 1993; Thorpe et al., 1982).
SORACAYA PROJECT | NI 43-101 TECHNICAL REPORT | 7-13 |
| |
|
| 7.3 | Regional Geology |
| 7.3.1 | Regional, local, and property geology |
The oldest rocks in the area correspond to undifferentiated Ordovician Paleozoic sediments which are lithologically constituted by an intercalation of packages of dark gray micaceous slates, with alternating quartzite banks, in sectors they are quite deformed (folded) and with overturned stratification, due to the intrusion of small igneous bodies “domes”. The main area of interest in the area is the Potos Orkho volcanic complex, constituted in its lower parts by volcanic breccias (lithic tuff), then there are Tertiary age rocks of dacitic composition with porphyritic texture and probably related to domic intrusions. They are partly silicified, sericitized and propylitized, occasionally with quartz-alunite alteration.
The western part of the area (Figure 7-8) is covered by a polymictic conglomerate package corresponding to the San Vicente Formation, brown to reddish in color, formed by rounded to subrounded clasts of Paleozoic rocks and some archosic sandstones probably from the Cretaceous. These conglomerate rocks are home to the zinc-silver veins of the San Vicente Mine.
Regionally, the Paleozoic basement forms anticlines and synclines with preferential north-west orientation. The Soracaya property is located approximately 8 km west of the prominent north-south striking San Vicente thrust fault, which forms the eastern limit of the intermountain Bolivian Altiplano basin. Low-angle faults, parallel to the folded structures, confirm the presence of compressive stresses in an easterly direction as is the case for the San Vicente fault, which causes the Ordovician sedimentary package to overlie the polymictic conglomerates of the San Vicente formation. As a result of the tensile phases which are reactivated, high-angle, typically mineralized, faulting and veining occurs in an east-west preferential direction. This system houses mineralized structures such as the Esperanza, España and 10 de Febrero veins.
SORACAYA PROJECT | NI 43-101 TECHNICAL REPORT | 7-14 |
| |
|
Figure 7-8: Regional Geology Map at Soracaya
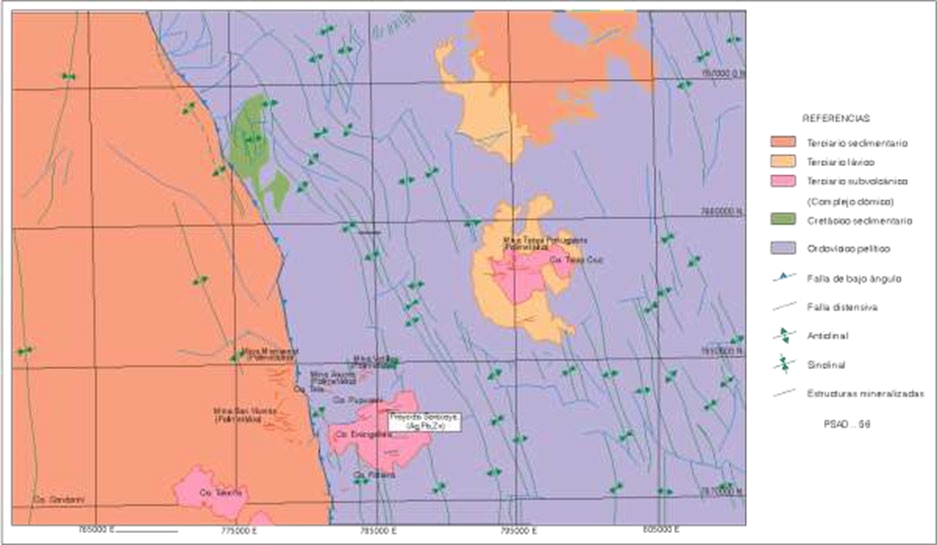
Source: Sinchi Wahra (2023)
| 7.4 | Local Geology |
The lithology is comprised of an altered shale-slate, followed by siltstone-sandstone and finally laminated sandstones. In the extreme west, outcrops of reddish conglomerates are observed, which are in discordant contact with Ordovician rocks bounded by a regional fault called the San Vicente fault.
Structurally, a series of anticlinal and synclinal folds with an almost north-south direction can be observed. The mineralization-filled fractures have a NEE strike and a second system transverse to the former but related to the vicinity of the Soracaya volcanic complex.
The predominant alteration is argillic followed by propylitization and/or chloritization. Alteration in sedimentary rocks is restricted to areas of possible mineralization. Most of the rocks are fresh.
| 7.4.1 | Lithology |
The lithology of the study area can be differentiated into four ages:
Quaternary – Generally composed of material which is the product of the disintegration of ancient rocks of Ordovician and Tertiary age. These materials are clays, sands and gravel that cover the slopes and plains called colluvium and alluvium, there is also material from moraines and friction mirrors as a result of the this decomposed material (Pupusani hills, Evangelista and Potos Orkho).
SORACAYA PROJECT | NI 43-101 TECHNICAL REPORT | 7-15 |
| |
|
Tertiary Sedimentary – The rocks of the San Vicente Formation are polymictic conglomerates of reddish- brown coloration due to the amount of iron contained in their matrix, their clasts are rounded to subrounded from Paleozoic rocks and some archosic sandstones probably from the Cretaceous.
These rocks are located to the west of the Soracaya deposit however some of these outcrops are within the property of Sinchi Wayra. They host the mineralized structures of San Vicente and are in discordant contact with sedimentary rocks of the Ordovician and the volcanic complex of Soracaya. The discordant contact is a regional reverse fault of called the “San Vicente fault”.
Tertiary Volcanic – These are rocks that are part of the volcanic complex of Potos Orcko and Evangelista (Soracaya) and are classified as follows:
| ● | Volcanic breccia composed of heterogeneous material with a siliceous matrix of gray to light gray coloration, usually argillized with pyrite dissemination. |
| ● | Coarse-grained porphyry dacite with light gray to greenish coloration due to chloritic alteration, generally compact and massive according to observations at level 0. |
| ● | Dacitic tuff of grey to dark grey colour, with heterogeneous material, with a rather porous brecciated appearance, mostly argillized and not very clarified. |
These rocks are very favorable for hosting mineralization and are seen in the Tuna Rumi, Evangelista Sur and Cerro Cantera areas.
| ● | Volcanic agglomerate composed of heterogeneous material, either volcanic or sedimentary, with volcanic ash paste, with clasts that vary from 2 cm to 10 cm to 80 cm in diameter. They are whitish- gray in color due to supergene alteration and are in discordant contact with the sedimentary rocks of the Ordovician south of the Soracaya camp. |
| ● | Andes-dacites the rocks at the extreme margins of the deposit, mostly developed to the east and north, and are compact gray rocks with little quartz, usually biotitic. |
Sedimentary Ordovician – These are rocks found at the edge of the volcanic complex.
They form part of a regional anticline with minor synclinal anticline folds. The hinge is composed of gray to olive-green slates and shale, with thicknesses that exceed 500 m, followed by a unit composed of laminated siltstones with a fairly compact greenish-gray sandstones of an approximate thickness of 300 m is also present on both flanks. It is again followed by a package of light gray slates and shales present only on the eastern flank and , laminated sandstones with very high siltstones outcrop on the west flank with an approximate thickness or 300 m. The Carlita, Promesa and Española veins, plus their branches, are hosted in these rocks.
| 7.4.2 | Structural Geology |
Illustrated within in geological mapping and field observations, the deformation of the sedimentary strata and the presence of fractures are evident through the presence of major folds and minor folds which are due to compressive and tensional stresses that correspond to different orogenic epochs. Also, the presence of minor fractures and folds in the sedimentary rocks is due to the intrusion of volcanogenic magmatic bodies.
SORACAYA PROJECT | NI 43-101 TECHNICAL REPORT | 7-16 |
| |
|
The most salient structural features of the area, in general, are the different orientations of the folds in the Palaeozoic rocks with respect to the structures.
Magmatism has played an important role in the architecture of the area. The Paleozoic strata are the ones that have undergone all the stresses since the first compressions of orogenesis. They have subparallel folds where the anticlines and synclines are well compressed and show marked symmetry. The general heading of the structures is from N 25º W to NS. According to the orogenic stresses suffered by these rocks, they correspond to the Andean Orogeny.
The remainder of the stress has developed reverse fractures, longitudinal faults and faults, shear fractures, which were filled by mineralizing solutions that gave rise to the mineralized structures.
There is evidence of a not very pronounced surface unconformity due to the Quaternary cover and puts the Tertiary in contact with the Paleozoic via a low-angle discordant contact with a general strike N 25° W (San Vicente Fault).
However, after averaging the variations in the heading of all structures, especially to the north, it follows that the compressive stresses are perpendicular to the axis of the folds formed by regional stresses.
Towards the south of the site, minor folds develop, where the influence of the Andean orogeny can be seen where the folds are faulted and show a subsidence towards the south, possibly due to the intrusion of the Potos Orkho Volcanic Complex of Soracaya.
The shape of the intrusive bodies within the volcanic complex plays a very important role in the architecture of the crust.
In some cases, fractures and faults are closely related to intrusive processes and flexures are related to regional stresses, but intrusive bodies have their influence on their neighboring rocks. As a result of these efforts, other intrusive bodies and conduits of volcanic rock may be located in areas of tectonic weakness.
| 7.5 | Mineralization |
Mineralization in the Soracaya deposit is structurally controlled, while lithology plays a minor role. Pre- existing faults, fractures, and zones of weakness served as conduits for the mineralizing solutions.
Structural preparation is very important for the passage of mineralizing solutions. Observations have shown that the control for mineralization is basically structural and probably lithological in the Tuna Rumi sector.
In the deposit, there are two generations of mineralization, the first being, polymetallic Philonian mineralization which presents as fissures and/or fractures filled with local disseminated syngenetic pyrite transformed into iron oxides found in the Potos Orkho, Tuna Rumi, Sud de Tuna Rumi and Cerro Evangelista areas.
SORACAYA PROJECT | NI 43-101 TECHNICAL REPORT | 7-17 |
| |
|
Another low-grade, high-volume mineralized system s a disseminated, limonitic matrix of pyrite and limonitic stockwork. This type of mineralization may be found at Cerro Evangelista and within a volcanic breccia that outcrops in the form of a process on the hill at Potos Orkho and may be an important target for exploration.
Surface mineralization presents as oxides such as Limonite, Hematite, Jarosite along with sectors where barite and quartz are present, and there are traces of disseminated of pyrite also related to nearby structures.
The structures identified at the surface were recognized at depth as massive structures, branched with pyrite, possibly silver (tetrahedrite) and chalcopyrite within some veins.
For this purpose, four underground workings that were previously rehabilitated have been mapped, such as at level-0 and level+20 which were worked on the Esperanza vein.
In order to establish the formation temperatures of the reservoir, it is recommended that fluid inclusion and salinity studies be performed. This research would be of great contribution to establishing the mineral paragenesis and metallogeny of the deposit.
| 7.5.1 | Alteration |
The hydrothermal alteration observed at the Soracaya deposit are sericitization, silicification, quartz- sericite-pyrite, quartz-alunite, and propylitization (chloritization).
| a. | Sericitization: The vast majority of feldspars are altered to sericite, of moderate to weak intensity. This type of alteration can be seen with greater exposure in the Tuna Rumi sector and the volcanic breccia outcrop area, as well as in other sectors. It accompanies halos of alteration between 5 m to 10 m confined to mineralized structures. |
| b. | Silicification: The hydrothermal breccias that can be seen in the northern part of Tuna Rumi have a greenish-gray to blackish and silicified matrix. In Cerro Evangelista there are sectors with penetrative to moderate silicification, in the form of a “silica cap”. They generally form silicified radial structures that are part of the morphology of Cerro Evangelista. |
| c. | Quartz-sericite-pyrite (medium argillization): This alteration mainly occurs at Cerro Evangelista and is related to mineralized structures. The alteration consists of sericite, secondary quartz and disseminated pyrite with a whitish coloration considered as argilization. This alteration is also observed to the south of the Ñuño Orcko Loma hill. |
| d. | Quartz-Alunite (Advanced Argyllic): This alteration occurs locally in Cerro Evangelista, with cavities and fissures filled by alunite in a siliceous paste. This type of alteration is very characteristic of high-sulphidation deposits and low-grade, but massive and/or disseminated mineralization contents. |
| e. | Propylitic (chlorite-calcite-epidote-pyrite): This alteration is the most widespread and is of moderate to weak intensity. It generally establishes the outer margins of mineralization. This alteration is characterized by the presence of chlorite, calcite, epidote and eventually pyrite. |
In summary, it can be indicated that Cerro Evangelista includes a zonation of alteration from the middle to the periphery from silicification, medium argilization, advanced argilization and chloritization at the extremes.
SORACAYA PROJECT | NI 43-101 TECHNICAL REPORT | 7-18 |
| |
|
| 7.5.2 | Mineralized Veins |
The mineralized structures are philonian and hydrothermal, resulting from the filling of pre-existing fissures and/or faults and are related to volcanic rocks that are part of an igneous body from which the mineralizing fluids ascended, coming from a magmatic source.
The minerals were deposited under appropriate pressure, temperature and age conditions giving rise to epithermal veins with minerals of medium to low temperatures.
The main mineralized structures recognized in this deposit from the first studies to the present management, are grouped into five mineralized sectors, namely: Potos Orkho Sector, Tuna Rumi, Evangelista, Evangelista Sur and Tuna Rumi Sur that will be described below. All these veins and/or structures are identified in Figure 7-9.
SORACAYA PROJECT | NI 43-101 TECHNICAL REPORT | 7-19 |
| |
|
Figure 7-9: Sectors Map at Soracaya
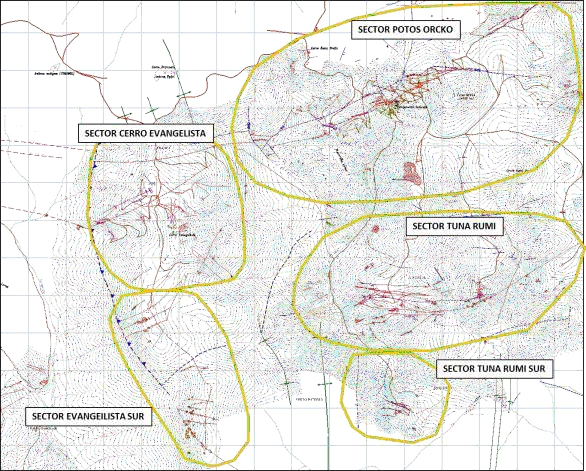
Source: Sinchi Wahra (2023)
| 7.5.2.1 | Sector Potos Orcko |
It is the most recognized sector of the area, where mining works have been concentrated since colonial times. The main mineralized structures are Esperanza, España, sus Ramos and 10 de Febrero.
The Esperanza Structure is the main structure in the area, it has a general strike that varies between N 55° E and N 75° E with inclinations between 80° to north-west to almost vertical. Both the course and the dips become distorted when the structure is affected by faults. The mineralized width (set of veins and veinlets) ranges from 0.20 m to 4.0 m, composed of galena, silver sulfosalts, sphalerite, barite, pyrite, chalcopyrite, siderite, quartz, and iron oxides. On the surface, the structure can be recognized up to approximately 1,700 m. The south-west extension is truncated by faults and the north-east extension joins Spain.
The España Structure is parallel to the Esperanza structure and is located 150 m north of it, has an average orientation of N 70° E and in the north-east part has a direction of N 85° W. The dips are subvertical and tend to the south-east. The width of the crackle structure (set of veinlets) varies between 0.2 m to 2.6 m, its mineralogical composition is very similar to that of the Esperanza structure. On this structure there are also old works that consist of a 94-m cut and a reconnaissance of the depth of the vein. The recognized surface extension through the trenches is at least 3,300 m, although its extremes have not yet been established.
SORACAYA PROJECT | NI 43-101 TECHNICAL REPORT | 7-20 |
| |
|
About 400 m north of the España structure, there is a mineralized structure called 10 de Febrero, in a direction N 60° E, inclined between 62° to 65° NW, with mineralized width (set of veinlets) ranging from 0.20 m to 0.50 m, with mineralization of galena, sphalerite, limonite, iron oxides, and occasionally barite. The results of the sampling of the central part report values of 0.11% Zn, 142 g/t Ag, 12.17% Pb. This structure can be recognized on the surface at least 500 m and was not evaluated by drilling. However, corroborative sampling has been carried out.
Esperanza Vein – It is the main vein that has a general strike of 53° NE-SW, a variable dip between 80° to 85° NW-SE, it is hosted in chloritized porphyry dacite; it has a width varying between 0.20 m to 1.70 m. On the surface it can be followed 2,600 m, it has been recognized in two levels and ntersected by drilling. Its mineralogy features barite, galena, sphalerite, pyrite, chalcopyrite and limonite on the surface.
This vein had already been worked in the past, but there is no information on how much ore was extracted.
Veta España – Its name is due to the fact that this vein had already been worked in colonial times by the Spaniards since there are vestiges of such mining work.
This vein has a general strike of 62° NE-SW, a dip of 65° to 87° NW-SE, the host rock is also a chloritized porphyritic dacite. It has a variable width from 0.40 m to 1.42 m. On the surface it can be followed for 2,400 m, it has been recognized by the level of the cut made by the Spaniards and was also recognized through drilling. Its mineralogy contains barite, galena, sphalerite, siderite and limonite.
Ramo Esperanza Vein – This is a structure that detaches from the SE side of the Esperanza vein, on the surface it can be recognized 300 m, has a bearing of 65° NE-SW, a dip of 81° SE. At level-0 it was developed on this vein for 30 m. Six boreholes intercepted this branch. The thickness of this branch ranges from 0.60 m to 0.80 m or more and the host rock being a porphyritic dacite. Its mineralogy is composed of barite, galena, sphalerite, quartz, pyrite, kaolin and limonite. In the same way, mineral resources were calculated for this vein.
Ramo Esperanza Vein 1 – This vein was intercepted at level-0 and has a development of 50 m, it was not intercepted by drilling, on the surface it is recognized in an extension of 50 m. It has a bearing of 75°SW- NE and a dip of 75° to 80° SE-NW, its thickness varies from 0.10 m to 0.80 m. It is also hosted in chloritized porphyritic dacite rocks. Its mineralogy is composed of barite, pyrite, galena marcasite, silver sulfosalts and limonite.
Veta Ramo España – It is a vein that was recognized by drilling, based on projection it was recognized in an extension of 600 m on the surface; seven drillholes intersected this vein, it has a general bearing of 73° NE-SW, a dip of 80°SE, its thickness ranges from 0.4 m to 1.0 m. The host rock is a porphyritic chloritized dacite and its mineralogy is composed of barite, galena, siderite and limonite.
Veta 10 de Febrero – This is a vein recognized on the surface in an extension of 800 m, on which reconnaissance trenches were dug, it has a general bearing of 57° NE-SW, a dip from 64° to 75° NW, its average thickness is 0.40 m. The host rock is a light gray dacite. Its mineralogy is composed of limonite, hematite, and kaolin.
SORACAYA PROJECT | NI 43-101 TECHNICAL REPORT | 7-21 |
| |
|
Systematic sampling has been carried out on this vein in trenches, the results did not yield interesting values however, the maximum value is 11 g/t Ag, 0.58% Pb and 0.27% Zn.
| 7.5.2.2 | Sector Tuna Rumi |
This sector is located 2.5 km south of the Potos Orcko sector. There are five to six mineralized structures, subparallel and with a general orientation of N 75° E and dips that vary between 55° to 75° to the south- east. Likewise, some structures have subvertical dips. On the surface, the lengths are up to 250 m and with mineralized widths (set of veinlets) of up to 3.1 m. They have been named San Vicente, Reyes, Tuna Rumi and La Dulce structures. On these structures, there are several historic works, probably from the colonial era, which possibly testifies to the high contents of silver and lead in these structures.
In the northern part of Tuna Rumi, there are hydrothermal breccia process outcrops, with a silicified matrix and dark gray to greenish coloration and seritized volcanic clasts that, according to samples obtained, which indicate the presence of low-grade gold.
Veta San Vicente – It is a vein that was worked in colonial times, it can be recognized on the surface in an extension of 850 m, the rock that hosts this vein is dark gray dacitic tuff.
This vein was not recognized by drilling, the mining operations that exist are all collapsed; has a strike of 83°NW-SE, a dip of 75° to 80° NE-SW. Its surface thickness varies from 1.0m to 2.0 m. Its mineralogy is composed of limonite, jarosite, and kaolin.
Surface sampling of this vein yields anomalous silver values between 30 g/t and 73 g/t.
Veta Reyes – It is also a vein that was worked in colonial times, it has a bearing of 41° NE-SW, its dip is subvertical, it has an average thickness of 0.25 m, on the surface it is recognized in an extension of 200 m, the host rock is a dark gray dacitic tuff quite porous. Its surface mineralogy is composed of limonite, hematite, and kaolin.
This vein was also not recognized by drilling however sampling carried out in previous campaigns shows anomalous silver values in a range of 37 g/t to 96 g/t.
La Dulce Vein – It is considered as the main vein of the Tuna Rumi area, on the surface it has a strike length of 2,100 m, it was worked in the colonial era and two holes were drilled trying to intercept it, but they fell short.
It has a bearing of 66°NE-SW, a dip between 75° and 82° SE, a thckness that varies from 0.1 m to 1.0 m measured on the surface. The host rock is a dacitic tuff. Its mineralogy is composed of barite, galena, pyrite and limonite.
Samplings carried out on this vein at the surface yield anomalous values which are reflected in Table 7-1.
SORACAYA PROJECT | NI 43-101 TECHNICAL REPORT | 7-22 |
| |
|
Table 7-1: La Dulce Vein Sampling
| Sample | Ag g/t | Zn % | Pb % |
| 10413 | 1,865 | 0.11 | 2.53 |
| 21105 | 592 | 0.29 | 28.13 |
| 21291 | 594 | 0.10 | 27.01 |
| 21515 | 116 | 0.02 | 0.08 |
| 10201 | 102 | 0.22 | 1.10 |
| Total | 236 | 0.13 | 3.66 |
Source: Sinchi Wahra (2023)
Apart from these three veins, according to the geological mapping, it has been possible to identify another five veins subparallel to the La Dulce vein and some branches that could show an area of high-volume mineralogical interest for future exploration with drilling.
| 7.5.2.3 | Sector Cerro Evangelista |
In the Cerro Evangelista sector, there is a series of siliceous structures banded and impregnated with pyrite and arranged radially to Cerro Evangelista. The widths of these structures are up to 20 m and lengths of up to 500 m. Sampling of these structures by EMICRUZ (1995-1996) reported anomalous gold and silver values. Undoubtedly, it is a high sulfation system and it is assumed that the siliceous structures are related to a possible mineralizing epicenter, associated with the emplacement of hydrothermal breccias.
It has also been possible to identify four structures with possible gold-silver mineralization, namely: Candelaria, Karina, Crucera and Camila. The Candelaria vein is the most prominent.
The Candelaria vein is the most geologically significant mineralized structure in the area, with a strike ranging from N 45° E to N 70° E dip 70° SE, thickness ranging from 0.20 to 0.80, with a recognized strike length of 976 m, with a vertical extension inferred from 350 m diamond drillhole intercepts.
Structurally, it is a vein classified as a “RAMEADA” type due to the different branches it presents as it deepens.
Mineralogically on the surface, it consists of a limonitized breccia, with traces of disseminated pyrite, in sectors with the presence of barite. The samples collected along the structure report anomalies of up to 306 g/t Ag, 0.35% Pb and in extreme NW strong anomalies of Au 1.78 g/t are recorded, while the values in zinc are very low < 0.01%.
Mineralogy at depth is represented by pyrite and possibly silver ores (Tetrahedrite) within the pyrite mass. However, core samples collected from drillholes reported grades of up to 402 g/t Ag, 2.63 g/t Au, 0.15% Cu with low anomalies in Pb and Zn and varying widths from 0.20 m to 1.85 m.
The host rock is defined as quartziferous sandstones, interbedded with slates and siltstones. These rocks have few hydrothermal alteration processes such as silicification, sericitization and are restricted to the structure.
The Karina Structure outcrops as siliceous stringers and in trenches it was recognized as a limonitised, silicified breccia with traces of barite.
SORACAYA PROJECT | NI 43-101 TECHNICAL REPORT | 7-23 |
| |
|
This structure was formed from Cerro Evangelista and was located in volcanic rocks where it takes a NW direction towards the San Vicente Mine which is located in Paleozoic rocks, and is possibly one of the structures currently being worked on in the San Vicente Mine.
Generally, the host rock is slightly silicified and with pyrite dissemination, in sections the seritization is very restricted to the structure while argillization is observed in the volcanic rock with halos of alteration of 2 m to 5 m.
This structure was recognized on the surface by trenches, and finally by boreholes, where it is defined as a horizontal length of 800 m, vertical extension of approximately 267 m, with a thickness that varies between 0.40 m and 1.40 m. and a bearing that ranges from EW to S 80° E, inclination from 65° to 72° to the SW. Anomalies reported from surface sampling range to 218 g/t, 1.44% Pb, 0.16% Zn and 0.012 g/t Au.
The Crucera vein has a NS direction with a dip of 70° W with a recognized surface length of 370 m and depth of up to 123 m with a variable thickness of up to 2.00 m.
The extent of the outcrop, is diminished by the fact that it has an almost flat topography covered by Quaternary material.
Mineralogically on the surface it is made up of silica, pyrite dissemination and oxide impregnation, while at depth it is a siliceous structure, crackled with pyrite dissemination and veins, (Ag sulfosalts?). Drill core taken from the structure reported grades of 48 g/t Ag, 1.45% Pb, 3.34% Zn and 0.14 g/t Au with a width of 0.63 m. The host rock is defined as porphyritic dacite, silicified with slight dissemination of pyrite. In this sector, below the siliceous layer (cryptocrystalline to microcrystalline), massive mineralization could be located that is susceptible to potential open-pit exploitation.
Candelaria Vein – It is a vein that intersects the Evangelista hill, and possibly continues to San Vicente since there are vestiges of having been worked in the Republican era. On the surface it can be recognized for 400 m, has a general bearing of 65° NE-SW, a dip of 80° NW, a variable thickness of 0.25 m to 0.40 m. The host rock is sandstones with dacites (discordant contact). Its mineralogy consists of pyrite, silver sulfosalts, limonite, hematite, barite and gold according to drillhole data.
Karina Vein – This vein is transverse to the Candelaria vein, and has low values that are in a range of 20 g/t Ag to 70 g/t Ag. This vein was not exploited in the past.
It has an EW strike, a dip of 65° to 72° SW, a surface measured thickness of 0.40 m to 1.40 m. Like the Candelaria vein, it develops in both types of lithology (sandstones and dacites). Its mineralogy consists of breccia with limonite, silica, pyrite and silver sulfosalts.
Crucera Vein – It is a vein that has a NS strike, a dip of 70° W, a thickness of 0.50 m to 2.00 m measured at the surface, this vein was intercepted by a drillhole whose results are shown in previous work.
It has an identified surface area of 370 m and is developed in dacites. Its mineralogy is composed of silica, pyrite, silver sulfosalts. This vein was also not worked.
Soledad Vein – It is a vein that develops in the extreme south of the area, and there are traces that it would have been worked for gold in colonial times.
SORACAYA PROJECT | NI 43-101 TECHNICAL REPORT | 7-24 |
| |
|
This vein has a strike of 35° NE-SW, a dip of 70° SE, a variable thickness of 0.10 m to 0.30 m. The host rock is a highly argillized and silicified dacite. Its mineralogy is composed of limonite, hematite, barite, and quartz.
Samples taken on this vein show very low values however there are periodic high grades such as an underground sample with a width of 0.40 m, 0.573 g/t Au, 9.2 g/t Ag, 0.001% Zn and 0.07% Pb.
The soil geochemistry carried out in this area shows a deep gold anomaly, which is interesting for future exploration since no drilling was carried out in this area.
Carlita Vein – It is a vein that develops in sedimentary rocks (sandstones and siltstones). This vein would have been worked on in the colonial past and on the surface it is can be tracked along strike for 400 m. It has a bearing of 66° NE-SW, a dip of 80° SE and a variable thickness of 0.10 m to 0.30 m.
This vein was not recognized by drilling. Its mineralogy is composed of quartz, barite, pyrite and galena. Surface samplings yield anomalous values as shown Table 7-2.
Table 7-2: Carlita Vein Sampling
| Sample | At g/t | Zn % | Pb % |
| 20672 | 55 | 0.10 | 0.54 |
| 20673 | 439 | 0.10 | 0.44 |
| 10248 | 201 | 0.00 | 0.15 |
| 21567 | 78 | 0.10 | 0.05 |
| Total | 191 | 0.08 | 0.26 |
Source: Sinchi Wahra (2023)
Veta Carlita Norte – It is a vein recognized on the surface for the alteration it presents and can be followed along strike for 300 m. To date it has not been exploited, it has a bearing of 58° NE-SW and dip 70°SE and its thickness varies between 0.20 m to 0.30 m. It also develops in sedimentary rocks (sandstone and siltstones). Its mineralogy is composed of barite, limonite, and quartz.
Surface sampling of this vein does not show interesting values, however there is an anomalous value of 61 g/t Ag.
Veta Carlita Sur – This vein has a strike length of 400 m, there are features of exploitation in the colonial era, it has a bearing of 65° NE-SW, a dip of 75° to 77° SE and its thickness is variable from 0.20 m to 0.50
m. It is a siliceous breccia, and its mineralogy consists of quartz, limonite and hematite only on surface.
According to surface sampling, only two samples yielded anomalous silver values of 258 g/t Ag and 19 g/t Ag while Zn and Pb did not yield values of significance.
Promising (Pormetedor) Vein – It is the main structure in this area, it has a strike of 47° NW-SE, a dip of 48° to 77° SW. This vein develops in laminated sandstones and siltstones and has a strike length of 1,800 m. Its thickness varies between 0.25 m to 0.50 m and its mineralogy is composed of barite, quartz, limonite and hematite. Grab samplings show interesting silver values as shown Table 7-3.
Table 7-3: Pormetedor Vein Sampling
| Sample | At g/t | Zn % | Pb % |
| 20667 | 1,508 | 0.10 | 1.41 |
| 20668 | 154 | 0.10 | 0.26 |
| 20669 | 73 | 0.10 | 4.56 |
| Total | 536 | 0.10 | 1.90 |
Source: Sinchi Wahra (2023)
SORACAYA PROJECT | NI 43-101 TECHNICAL REPORT | 7-25 |
| |
|
Ramo Promising (Pormetedor) Vein – This is a vein that detaches from the main vein, has a strike length of 500 m and it was also worked during the colony. It has a bearing of 77° NW-SE, a dip of 58° SW and a a variable thickness of 0.20 m to 0.30 m. Its mineralogy is composed of barite, limonite, hematite, and quartz. It also develops in sedimentary rocks. A grab sample yielded 783 g/t Ag, 0.10% Zn and 0.47% Pb.
| 7.5.2.3.1 | Tuna Rumi South Sector |
Española Vein – This vein is interesting because it was worked in colonial times by way of shafts which have unknown depth due to flooding.
The Española vein has a strike length of 400 m and is orented at a strike of 67° NW-SW, a dip of 55° SW and has a variable thickness of 0.30 m to 0.75 m. This is a fault vein and its mineralogy is composed of limonite, hematite, quartz, and barite. The host rock of is a laminated alternation package of compact, massive sandstones and siltstones.
Samplings carried out on this vein-fault show anomalous values as shown in Table 7-4.
Table 7-4: Española Vein Sampling
| Sample | At g/t | Zn % | Pb % |
| 20012 | 90 | 0.51 | 2.01 |
| 20014 | 59 | 0.24 | 0.72 |
| 10443 | 291 | 0.01 | 1.88 |
| 10444 | 383 | 0.01 | 0.94 |
| Total | 180 | 0.22 | 1.41 |
Source: Sinchi Wahra (2023)
SORACAYA PROJECT | NI 43-101 TECHNICAL REPORT | 7-26 |
| |
|
| 8 | DEPOSIT TYPES |
The Project’s mineralization is a intermediate to high sulfidation epithermal system with silver, lead, and zinc deposits hosted in stock works, breccia veins, faults and fractures. The above combinations are indicative of the epithermal mineralization that is sometimes associated with distal zoning around a volcanic intrusion (Figure 8-1).
Figure 8-1: Conceptual Model of the San Vicente and Soracaya Deposits (blue dashed = faults, red dashed = veins)
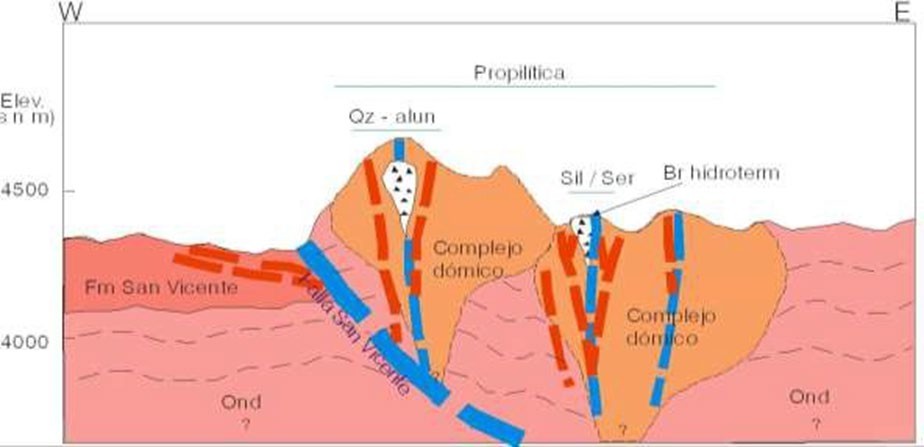
Source: Sinchi Wahra (2023)
Based on the geological mapping and surface sampling there are two types of mineralization and that are related to two volcanic events. The first volcanic event is of primary importance since it gave rise to the mineralization of the area which is best characterized within the Cerro Evangelista sector. The rocks here display hydrothermal alteration through advanced argillization (quartz-alunite), silicification, in the central area while the surrounding rocks have experienced a degree of low-grade metamorphism. However, this first volcanic event may also be displayed in other sectors such as Tuna Rumi which is characterzed by brecciated volcanic intrusions composed of a matrix of silicas and argillized dacitic clasts, which emerges as an apophysis. The predominant and most important mineralized structures at Soracaya are the Veta Esperanza and España, were likely pre-existing faults filled by magmatic solutions from this first volcanic event.
The second volcanic event is represented by isolated volcanic domes such as El Potos Orkho, Ñuño Orcko and Nuño Orcko Loma along with others of lesser importance, which are of unaltered dacitic to andesitic composition. This event can also be evidenced in Cerro Evangelista with small of greenish-gray dacitic domes that are weakly chloritized. Most of these domes present in their central part as and concentric pseudo-stratified (like onion layers). In some sectors it is observed that the dacitic flows of these domes superficially cover and displace the pre-existing siliceous structures, originated in the first volcanic event.
The Potos Orkho, Tuna Rumi, Tuna Rumi Sur, and Evangelista Sur sectors are considered to be vein type deposits related to pre-existing faults. The Evangelista sector appears to house a deposit of massive low- grade deep-sea mineralization, although there are vein-type structures that transect this sector.
| SORACAYA PROJECT | NI 43-101 TECHNICAL REPORT | 8-1 |
| |
|
| 9 | EXPLORATION |
No exploration has been carried out on behalf of Santacruz.
| SORACAYA PROJECT | NI 43-101 TECHNICAL REPORT | 9-1 |
| |
|
| 10 | DRILLING |
| 10.1 | Drilling Summary |
The Soracaya Project is an “exploration property” and has experienced exploration activity since 1992. Sinchi Wahra has performed exploration and resource expansion drilling of 95 surface drillholes totaling 29,554.3 m and 79 underground channel samples at the Soracaya Project since 1999.
Table 10-1 summarizes the historical drilling on the property from 1999 through 2018.
Table 10-1: Soracaya Drilling Programs from 1999 through 2018
Phase |
Year |
Hole ID |
Type |
Total (m) |
Core Size |
Target |
Total Cost ($US) |
| I | 1999 | DDH-01 to DDH-36 | Surface | 8,896.7 | NQ/BQ | Esperanza, España, La Dulce veins | 845,186 |
II |
2006 |
DDH-37S to DDH-50S |
Surface |
4,903.0 |
HQ/NQ |
Geophysical Anomanlies at Tuna Rumi, Evangelista |
480,494 |
III |
2008 |
DDH-51S to DDH-59S |
Surface |
2,605.6 |
HQ/NQ |
Mineralized Structures at Evangelista and Marquina |
265,771 |
IV |
2018 |
DDH-SOR-ESP-60s to DDH-SOR-ESP-85s; DDH-SOR-10F-86s; DDH-SOR-LDU-87s; DDH-SOR-ESP-88s to DDH-SOR-ESP-90s; DDH-SOR-CAN-91s to DDH-SOR-CAN-92s; DDH-SOR-LDU-93s; DDH-SOR-CAN-94s; DDH-SOR-LDU-95s |
Surface |
13,149.0 |
HQ/NQ |
Esperanza, España, 10 de Febrero, La Dulce, San Vicente veins |
1,776,946 |
Source: Sinchi Wahra (2023)
The drilling has been primarily focused upon the extension of the veins to depth particularly for definition and delineation of inferred resources. Figure 10-1 and Figure 10-2 shows a plan view of drillhole locations along with the underground channel sample data.
| SORACAYA PROJECT | NI 43-101 TECHNICAL REPORT | 10-1 |
| |
|
Figure 10-1: Plan View of Drillhole Locations at Soracaya
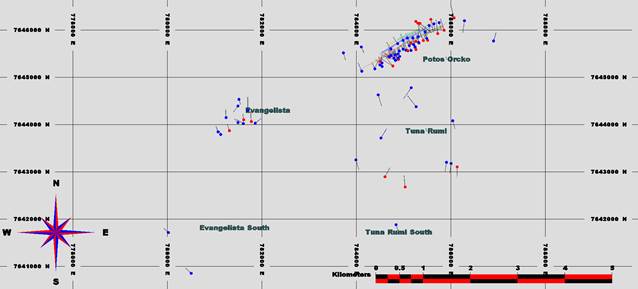
Source: KGL (2024)
Figure 10-2: Plan View of Drillhole Locations at Soracaya with Vein and Topographic Contours
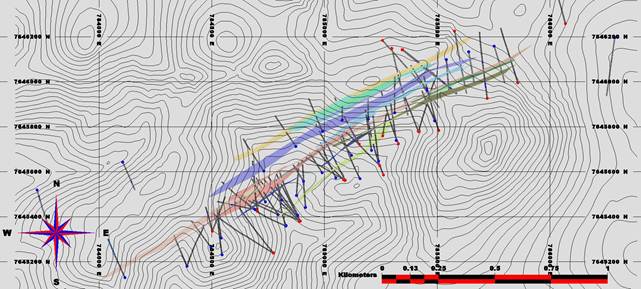
Source: KGL (2024)
Table 10-2 and Table 10-3 summarizes the drilling programs on the property from 1999 through 2018 and 2008 to 2021 respectively.
| SORACAYA PROJECT | NI 43-101 TECHNICAL REPORT | 10-2 |
| |
|
Table 10-2: Soracaya Drilling Programs from 1999 through 2008
| DDH Name | Easting | Northing | Elevation | Depth |
| DDH-1 | 784989 | 7645596 | 4437.27 | 150 |
| DDH-2 | 784906.8 | 7645558 | 4420.818 | 121.12 |
| DDH-3 | 784809.8 | 7645475 | 4402.19 | 130.6 |
| DDH-4 | 785208.05 | 7645695 | 4500.34 | 262.2 |
| DDH-5 | 785317.8 | 7645739 | 4516.27 | 286.9 |
| DDH-6 | 785157.15 | 7645569.3 | 4471.66 | 290.4 |
| DDH-7 | 784793.73 | 7645409.3 | 4395.57 | 285 |
| DDH-8 | 784793.96 | 7645409.8 | 4395.52 | 300 |
| DDH-9 | 785049.82 | 7645572.9 | 4450.54 | 310.4 |
| DDH-10 | 784880.8 | 7645407 | 4398.8 | 290.4 |
| DDH-11 | 784915.83 | 7645441.8 | 4415.93 | 308 |
| DDH-12 | 784737.8 | 7645466 | 4420.86 | 181 |
| DDH-13 | 784690.53 | 7645432.9 | 4425.29 | 281 |
| DDH-14 | 784828.26 | 7645358.8 | 4386.6 | 380 |
| DDH-15 | 784541.6 | 7645305.4 | 4505.26 | 235.5 |
| DDH-16 | 784496.28 | 7645264.3 | 4504.15 | 244.5 |
| DDH-17 | 784545.42 | 7645231 | 4497.85 | 352 |
| DDH-18 | 784875.52 | 7645494.5 | 4413.42 | 211 |
| DDH-19 | 785119.6 | 7645673.1 | 4487.92 | 144 |
| DDH-20 | 785239.36 | 7645648.1 | 4490.77 | 350 |
| DDH-21 | 784829.5 | 7645360.6 | 4386.6 | 406.17 |
| DDH-22 | 785639 | 7646133 | 4576.37 | 215.6 |
| DDH-23 | 784389.96 | 7645180 | 4440.27 | 321 |
| DDH-24 | 784389.96 | 7645180 | 4440.27 | 291 |
| DDH-25 | 785540 | 7646098 | 4603.8 | 200.3 |
| DDH-26 | 785752 | 7646158 | 4567.44 | 240 |
| DDH-27 | 785194 | 7645834 | 4557.83 | 155.2 |
| DDH-28 | 785078.15 | 7645830.1 | 4547.69 | 155.3 |
| DDH-29 | 785311 | 7645862 | 4567.13 | 233.5 |
| DDH-30 | 785488.14 | 7645826.3 | 4582.79 | 200 |
| DDH-31 | 784730.09 | 7645603.3 | 4441.51 | 230 |
| DDH-32 | 784872.59 | 7645712.2 | 4455.41 | 200 |
| DDH-33 | 784990.44 | 7645779.3 | 4505.57 | 190 |
| DDH-34 | 785453.85 | 7645961.3 | 4604.58 | 170.3 |
| DDH-35 | 786005 | 7643177 | 4320 | 291.3 |
| DDH-36 | 785907 | 7643202 | 4304 | 283 |
| DDH-37S | 786038.75 | 7644081.2 | 4404.27 | 300 |
| SORACAYA PROJECT | NI 43-101 TECHNICAL REPORT | 10-3 |
| |
|
| DDH Name | Easting | Northing | Elevation | Depth |
| DDH-38S | 783989.53 | 7643254 | 4168.31 | 426 |
| DDH-39S | 784461.66 | 7644630.8 | 4338.23 | 492 |
| DDH-40S | 784839.86 | 7641882.4 | 4103.23 | 312 |
| DDH-41S | 781515.01 | 7644534.2 | 4645.44 | 240 |
| DDH-42S | 785160.87 | 7644780.4 | 4509.4 | 501 |
| DDH-43S | 785264.66 | 7644379.3 | 4490.98 | 462 |
| DDH-44S | 784114.93 | 7645129.7 | 4489.62 | 266 |
| DDH-45S | 786286.85 | 7646196.2 | 4519 | 405 |
| DDH-46S | 781699.95 | 7644300 | 4666.46 | 444 |
| DDH-47S | 784520 | 7643715 | 4275 | 324 |
| DDH-48S | 784104.86 | 7645642.6 | 4496 | 209 |
| DDH-49S | 783725.41 | 7645518.9 | 4435 | 252 |
| DDH-50S | 786902.95 | 7645769.6 | 4475 | 270 |
| DDH-51S | 781072.57 | 7643847.6 | 4494.36 | 189 |
| DDH-52S | 781494 | 7644393.9 | 4654.55 | 257.7 |
| DDH-53S | 781494.96 | 7644043.1 | 4614.2 | 190.1 |
| DDH-54S | 781243.11 | 7644149.3 | 4617.89 | 289 |
| DDH-55S | 781858.4 | 7644030.2 | 4689.88 | 375 |
| DDH-56S | 781606.04 | 7644021.6 | 4634.66 | 482.5 |
| DDH-57S | 781128.46 | 7643791.3 | 4493.441 | 320.6 |
| DDH-58S | 780020.27 | 7641715.9 | 4281.725 | 248.3 |
| DDH-59S | 780503.69 | 7640854 | 4257.069 | 253.4 |
Source: Kirkham 2024
Table 10-3: Soracaya Drilling Programs from 2008 through 2021
| DDH Name | Easting | Northing | Elevation | Depth |
| SOR-10F-86s | 786067.8 | 7646258.2 | 4536.901 | 320 |
| SOR-CAN-91s | 781311.88 | 7643871.7 | 4538.644 | 300 |
| SOR-CAN-92s | 781776.47 | 7644064.5 | 4667.591 | 440 |
| SOR-CAN-94s | 781614.49 | 7644101.8 | 4637.548 | 260 |
| SOR-ESP60s | 784891.96 | 7645381.8 | 4395.101 | 290 |
| SOR-ESP61s | 785090.55 | 7645561.5 | 4459.951 | 280 |
| SOR-ESP62s | 785344.09 | 7646142 | 4612.237 | 383 |
| SOR-ESP63s | 784889.9 | 7645382.9 | 4394.504 | 341 |
| SOR-ESP64s | 785085 | 7645564 | 4454.613 | 407 |
| SOR-ESP65s | 785345.54 | 7646142.9 | 4609.917 | 450 |
| SOR-ESP66s | 785091.38 | 7645563 | 4459.891 | 421 |
| SOR-ESP67s | 784892.31 | 7645380.4 | 4394.904 | 422 |
| SORACAYA PROJECT | NI 43-101 TECHNICAL REPORT | 10-4 |
| |
|
| DDH Name | Easting | Northing | Elevation | Depth |
| SOR-ESP68s | 785257.74 | 7645759.2 | 4525.139 | 130 |
| SOR-ESP69s | 785327.57 | 7645724.2 | 4514.258 | 400 |
| SOR-ESP70s | 784771.83 | 7645239.2 | 4403.315 | 450 |
| SOR-ESP71s | 784890.25 | 7645380.7 | 4394.855 | 400 |
| SOR-ESP72s | 785153.83 | 7645722.3 | 4508.324 | 310 |
| SOR-ESP73s | 785415.57 | 7645779.5 | 4545.332 | 390 |
| SOR-ESP74s | 784773.48 | 7645239.7 | 4403.308 | 420 |
| SOR-ESP75s | 784502.23 | 7645338.1 | 4506.11 | 191 |
| SOR-ESP76s | 785297.89 | 7646148.1 | 4609.594 | 470 |
| SOR-ESP77s | 785417.38 | 7645778.4 | 4545.206 | 413 |
| SOR-ESP78s | 784502.34 | 7645336.4 | 4505.535 | 210 |
| SOR-ESP79s | 784694.91 | 7645430.9 | 4423.988 | 320 |
| SOR-ESP80s | 785256.82 | 7646183.4 | 4597.412 | 530 |
| SOR-ESP81s | 785506.04 | 7645783.9 | 4581.315 | 371 |
| SOR-ESP82s | 785856.5 | 7645995.2 | 4579.153 | 401 |
| SOR-ESP83s | 784702.73 | 7645423.3 | 4424.107 | 425 |
| SOR-ESP84s | 785720.89 | 7645926.5 | 4615.368 | 434 |
| SOR-ESP85s | 785576.11 | 7646225 | 4557.408 | 365 |
| SOR-ESP88s | 785244.46 | 7645627.4 | 4486.843 | 362 |
| SOR-ESP89s | 785261.41 | 7645585.5 | 4488.603 | 520 |
| SOR-ESP90s | 784887.72 | 7645379.9 | 4393.202 | 375 |
| SOR-LDU-87s | 785033.07 | 7642680.2 | 4355.354 | 380 |
| SOR-LDU-93s | 784604.98 | 7642897.4 | 4321.446 | 288 |
| SOR-LDU-95s | 786134 | 7643106 | 4286 | 280 |
Source: Kirkham 2024
Most diamond drilling has intersected mineralized ranges, primarily from the Esperanza, España and splays of those veins. The results of these significant interceptions in each of the drillholes are summarized in Table 10-4.
Table 10-4: Significant Results from Soracaya Drilling Programs from 1999 through 2008
| Hole # | From | -To- | -AI- | Zn% | Pb% | Ag | ZnEq | Code | AgEq |
| DDH-1 | 127.11 | 127.36 | 0.25 | 9.72 | 15.86 | 667 | 37.83 | 14 | 1437 |
| DDH-1 | 127.36 | 128.17 | 0.81 | 6.14 | 12.28 | 352 | 23.95 | 14 | 899 |
| DDH-1 | 128.17 | 128.97 | 0.8 | 11.77 | 26.23 | 934 | 54.19 | 14 | 2055 |
| DDH-1 | 128.97 | 129.75 | 0.78 | 8.44 | 20.47 | 861 | 44.72 | 14 | 1710 |
| DDH-1 | 129.75 | 131 | 1.25 | 1.43 | 5.89 | 303 | 13.20 | 14 | 512 |
| DDH-1 | 132.27 | 133.27 | 1 | 0.92 | 3.48 | 109 | 6.19 | 14 | 235 |
| DDH-1 | 140 | 143 | 3 | 0.92 | 1.13 | 109 | 4.40 | 17 | 172 |
| SORACAYA PROJECT | NI 43-101 TECHNICAL REPORT | 10-5 |
| |
|
| Hole # | From | -To- | -AI- | Zn% | Pb% | Ag | ZnEq | Code | AgEq |
| DDH-2 | 106.54 | 106.71 | 0.17 | 0.4 | 0.52 | 155 | 4.52 | 14 | 183 |
| DDH-3 | 107.61 | 108.55 | 0.94 | 0.14 | 0.23 | 170 | 4.40 | 15 | 181 |
| DDH-3 | 108.55 | 108.95 | 0.4 | 0.61 | 3.27 | 7275 | 178.07 | 15 | 7384 |
| DDH-3 | 108.95 | 109.73 | 0.78 | 0.17 | 0.27 | 315 | 7.95 | 15 | 328 |
| DDH-3 | 109.73 | 109.99 | 0.26 | 3.99 | 25.59 | 679 | 39.79 | 15 | 1508 |
| DDH-4 | 125.85 | 126.93 | 1.08 | 4.81 | 11.26 | 230 | 18.91 | 12 | 703 |
| DDH-4 | 126.93 | 127.5 | 0.57 | 0.74 | 14.12 | 243 | 17.33 | 12 | 649 |
| DDH-4 | 172.66 | 172.92 | 0.26 | 0.1 | 38.48 | 679 | 45.71 | 14 | 1717 |
| DDH-4 | 234.75 | 234.8 | 0.05 | 0.36 | 8.44 | 109 | 9.40 | 3 | 349 |
| DDH-5 | 131.9 | 132.1 | 0.2 | 1.17 | 11.05 | 109 | 12.20 | 12 | 447 |
| DDH-6 | 221.46 | 221.63 | 0.17 | 2.97 | 6.4 | 133 | 11.04 | 16 | 410 |
| DDH-6 | 245.35 | 246.47 | 1.12 | 2.05 | 5.89 | 109 | 9.15 | 12 | 340 |
| DDH-6 | 270.16 | 270.66 | 0.5 | 5.02 | 10.75 | 194 | 17.87 | 14 | 660 |
| DDH-6 | 284.15 | 285.8 | 1.65 | 0.46 | 9.47 | 133 | 10.86 | 17 | 404 |
| DDH-7 | 188.38 | 189 | 0.62 | 3.48 | 11.77 | 255 | 18.57 | 15 | 694 |
| DDH-7 | 190.03 | 190.47 | 0.44 | 1.13 | 11 | 376 | 18.54 | 15 | 712 |
| DDH-7 | 198.5 | 201 | 2.5 | 1.54 | 7.68 | 558 | 20.80 | 7 | 819 |
| DDH-7 | 207.42 | 207.86 | 0.44 | 3.47 | 31.34 | 703 | 44.22 | 14 | 1668 |
| DDH-7 | 207.86 | 209.04 | 1.18 | 0.33 | 3.69 | 114 | 5.88 | 14 | 225 |
| DDH-7 | 209.04 | 209.51 | 0.47 | 1.33 | 30.05 | 546 | 37.33 | 14 | 1401 |
| DDH-7 | 264.21 | 264.38 | 0.17 | 1.94 | 8.44 | 182 | 12.74 | 17 | 478 |
| DDH-7 | 264.67 | 265.63 | 0.96 | 0.51 | 5.12 | 961 | 27.52 | 17 | 1117 |
| DDH-8 | 222.39 | 223.43 | 1.04 | 1 | 25.59 | 663 | 36.42 | 15 | 1386 |
| DDH-8 | 223.43 | 224.59 | 1.16 | 0.16 | 30.19 | 1013 | 47.49 | 15 | 1830 |
| DDH-8 | 224.59 | 225.45 | 0.86 | 0.22 | 28.15 | 1188 | 50.21 | 15 | 1953 |
| DDH-8 | 225.45 | 227 | 1.55 | 0.38 | 11.67 | 250 | 15.27 | 15 | 577 |
| DDH-8 | 227 | 228 | 1 | 0.43 | 6.96 | 113 | 8.44 | 15 | 315 |
| DDH-8 | 229.5 | 231 | 1.5 | 0.53 | 5.32 | 113 | 7.30 | 15 | 275 |
| DDH-8 | 231 | 232.42 | 1.42 | 0.57 | 5.32 | 100 | 7.02 | 15 | 263 |
| DDH-8 | 255.7 | 256.46 | 0.76 | 0.51 | 9.42 | 388 | 17.01 | 14 | 659 |
| DDH-8 | 287.96 | 288.3 | 0.34 | 3.4 | 1.84 | 288 | 11.73 | 17 | 458 |
| DDH-8 | 288.3 | 289.3 | 1 | 0.05 | 0.29 | 100 | 2.68 | 17 | 110 |
| DDH-9 | 160.28 | 160.5 | 0.22 | 2.35 | 13.31 | 550 | 25.71 | 16 | 991 |
| DDH-10 | 213.42 | 213.85 | 0.43 | 5.53 | 19.98 | 946 | 43.48 | 16 | 1679 |
| DDH-10 | 219 | 219.97 | 0.97 | 1.64 | 25.59 | 812 | 40.64 | 16 | 1558 |
| DDH-10 | 220.33 | 220.8 | 0.47 | 3.99 | 16.63 | 560 | 30.11 | 16 | 1148 |
| DDH-10 | 267.64 | 268.44 | 0.8 | 0.71 | 5.37 | 109 | 7.42 | 14 | 278 |
| DDH-11 | 86 | 86.54 | 0.54 | 0.17 | 3.07 | 200 | 7.32 | 11 | 289 |
| DDH-11 | 86.54 | 86.63 | 0.09 | 0.71 | 19.96 | 1450 | 50.77 | 11 | 2012 |
| SORACAYA PROJECT | NI 43-101 TECHNICAL REPORT | 10-6 |
| |
|
| Hole # | From | -To- | -AI- | Zn% | Pb% | Ag | ZnEq | Code | AgEq |
| DDH-11 | 296.38 | 296.87 | 0.49 | 0.82 | 2.87 | 200 | 7.81 | 15 | 306 |
| DDH-11 | 301.57 | 302.27 | 0.7 | 2.15 | 1.02 | 200 | 7.74 | 14 | 303 |
| DDH-12 | 117.25 | 117.72 | 0.47 | 1.12 | 1 | 414 | 11.84 | 14 | 480 |
| DDH-12 | 117.72 | 118.15 | 0.43 | 0.8 | 0.97 | 320 | 9.23 | 14 | 374 |
| DDH-12 | 118.15 | 118.57 | 0.42 | 0.29 | 0.54 | 443 | 11.36 | 14 | 468 |
| DDH-12 | 120.07 | 121.64 | 1.57 | 0.18 | 0.53 | 315 | 8.16 | 14 | 336 |
| DDH-12 | 139.42 | 140.13 | 0.71 | 0.41 | 0.69 | 571 | 14.67 | 17 | 604 |
| DDH-12 | 140.13 | 140.75 | 0.62 | 0.16 | 0.41 | 336 | 8.55 | 17 | 353 |
| DDH-13 | 135 | 135.9 | 0.9 | 0.51 | 0.73 | 991 | 24.90 | 14 | 1029 |
| DDH-14 | 300 | 300.77 | 0.77 | 0.82 | 3.39 | 108 | 6.00 | 16 | 228 |
| DDH-14 | 300.77 | 301.77 | 1 | 0.1 | 6.65 | 142 | 8.58 | 16 | 324 |
| DDH-14 | 301.77 | 302.77 | 1 | 0.06 | 6.86 | 196 | 9.99 | 16 | 383 |
| DDH-14 | 302.77 | 303.77 | 1 | 0.04 | 3.79 | 124 | 5.91 | 16 | 227 |
| DDH-14 | 304.45 | 305.47 | 1.02 | 0.03 | 6.65 | 302.1 | 12.36 | 16 | 482 |
| DDH-14 | 337.77 | 338.87 | 1.1 | 0.05 | 0.17 | 520 | 12.69 | 15 | 526 |
| DDH-14 | 338.87 | 339.87 | 1 | 0.12 | 0.61 | 398 | 10.16 | 15 | 419 |
| DDH-15 | 227 | 228 | 1 | 0.08 | 0.92 | 154 | 4.48 | 14 | 182 |
| DDH-15 | 228 | 228.96 | 0.96 | 0.08 | 0.92 | 122 | 3.71 | 14 | 150 |
| DDH-16 | 209.8 | 210.05 | 0.25 | 0.3 | 0.23 | 154 | 4.18 | 14 | 171 |
| DDH-17 | 310 | 311 | 1 | 0.24 | 2.35 | 284 | 8.86 | 15 | 356 |
| DDH-17 | 311 | 311.79 | 0.79 | 0.17 | 0.07 | 140 | 3.59 | 15 | 148 |
| DDH-17 | 311.79 | 311.8 | 0.01 | 0.26 | 0.08 | 232 | 5.90 | 15 | 243 |
| DDH-17 | 311.8 | 312.79 | 0.99 | 0.26 | 0.08 | 232 | 5.90 | 15 | 243 |
| DDH-17 | 312.79 | 313.44 | 0.65 | 0.23 | 0.28 | 595 | 14.75 | 15 | 611 |
| DDH-17 | 343.02 | 343.72 | 0.7 | 0.07 | 3.48 | 292 | 9.74 | 14 | 388 |
| DDH-18 | 119.55 | 120.07 | 0.52 | 0.61 | 0.25 | 196 | 5.51 | 16 | 224 |
| DDH-18 | 171.73 | 172.35 | 0.62 | 1.74 | 7.93 | 235 | 13.43 | 15 | 510 |
| DDH-18 | 172.35 | 173.17 | 0.82 | 0.61 | 1.64 | 232 | 7.44 | 15 | 298 |
| DDH-18 | 173.17 | 173.92 | 0.75 | 0.25 | 0.45 | 202 | 5.45 | 15 | 223 |
| DDH-18 | 173.92 | 174.75 | 0.83 | 0.1 | 0.3 | 268 | 6.77 | 15 | 280 |
| DDH-18 | 177.42 | 178.19 | 0.77 | 0.86 | 7.27 | 124 | 9.37 | 15 | 350 |
| DDH-18 | 178.84 | 179.74 | 0.9 | 0.92 | 12.03 | 220 | 15.36 | 15 | 576 |
| DDH-18 | 179.74 | 180.34 | 0.6 | 0.53 | 6.24 | 104 | 7.78 | 15 | 291 |
| DDH-18 | 181.87 | 182.66 | 0.79 | 2.08 | 5.12 | 1437 | 40.54 | 15 | 1648 |
| DDH-18 | 182.66 | 183.43 | 0.77 | 0.78 | 1.23 | 260 | 7.97 | 15 | 321 |
| DDH-18 | 205.85 | 206.66 | 0.81 | 0.86 | 7.42 | 160 | 10.35 | 14 | 390 |
| DDH-19 | 133.15 | 133.69 | 0.54 | 0.72 | 4.35 | 165 | 8.00 | 14 | 307 |
| DDH-19 | 133.69 | 134.14 | 0.45 | 3.69 | 18.94 | 890 | 39.51 | 14 | 1530 |
| DDH-19 | 134.14 | 135 | 0.86 | 2.35 | 11.51 | 335 | 19.16 | 14 | 728 |
| SORACAYA PROJECT | NI 43-101 TECHNICAL REPORT | 10-7 |
| |
|
| Hole # | From | -To- | -AI- | Zn% | Pb% | Ag | ZnEq | Code | AgEq |
| DDH-19 | 135 | 135.82 | 0.82 | 0.11 | 0.14 | 145 | 3.70 | 14 | 153 |
| DDH-21 | 395.42 | 396.16 | 0.74 | 2.25 | 1.79 | 150 | 7.22 | 16 | 278 |
| DDH-22 | 149.93 | 150.63 | 0.7 | 0.02 | 4.61 | 128 | 6.61 | 14 | 253 |
| DDH-22 | 162.69 | 163.21 | 0.52 | 0.47 | 4.09 | 619 | 18.47 | 6 | 746 |
| DDH-22 | 163.73 | 164.4 | 0.67 | 0.03 | 13.43 | 1275 | 40.91 | 6 | 1637 |
| DDH-23 | 304.5 | 305.15 | 0.65 | 0.31 | 0.93 | 105 | 3.54 | 15 | 141 |
| DDH-24 | 221.01 | 221.81 | 0.8 | 0.01 | 0.08 | 355 | 8.61 | 15 | 358 |
| DDH-25 | 88.9 | 89.9 | 1 | 0.06 | 5.05 | 203 | 8.78 | 3 | 341 |
| DDH-25 | 155.03 | 156.03 | 1 | 0.56 | 7.88 | 630 | 21.71 | 14 | 862 |
| DDH-25 | 163.98 | 164.94 | 0.96 | 3.1 | 3.44 | 150 | 9.33 | 6 | 352 |
| DDH-27 | 112 | 112.92 | 0.92 | 3.39 | 5.5 | 354 | 16.09 | 1 | 622 |
| DDH-27 | 112.92 | 113.94 | 1.02 | 3.39 | 5.6 | 174 | 11.84 | 1 | 444 |
| DDH-27 | 113.94 | 114.83 | 0.89 | 3.58 | 8.6 | 344 | 18.40 | 1 | 702 |
| DDH-27 | 114.83 | 115.73 | 0.9 | 2.02 | 3.8 | 145 | 8.40 | 1 | 319 |
| DDH-27 | 144.58 | 145.58 | 1 | 0.9 | 11.5 | 269 | 16.12 | 2 | 610 |
| DDH-27 | 145.58 | 146.28 | 0.7 | 0.17 | 7.9 | 253 | 12.27 | 2 | 471 |
| DDH-27 | 146.98 | 147.93 | 0.95 | 0.19 | 14.3 | 619 | 25.96 | 2 | 1010 |
| DDH-27 | 149.08 | 149.83 | 0.75 | 0.18 | 8.1 | 250 | 12.36 | 2 | 474 |
| DDH-28 | 101.55 | 102.3 | 0.75 | 0.5 | 29.18 | 471 | 34.03 | 5 | 1273 |
| DDH-28 | 119.54 | 120.3 | 0.76 | 0.4 | 7.6 | 145 | 9.67 | 4 | 364 |
| DDH-29 | 76.86 | 77.37 | 0.51 | 1.33 | 7.59 | 193 | 11.75 | 3 | 444 |
| DDH-29 | 118.25 | 119 | 0.75 | 0.23 | 4.88 | 383 | 13.15 | 1 | 522 |
| DDH-29 | 182 | 183 | 1 | 0.17 | 2.75 | 102 | 4.72 | 2 | 182 |
| DDH-29 | 196.19 | 196.96 | 0.77 | 1.58 | 10.29 | 365 | 18.19 | 5 | 698 |
| DDH-32 | 33 | 33.9 | 0.9 | 0.17 | 0.21 | 123 | 3.29 | 1 | 135 |
| DDH-32 | 93.8 | 94.52 | 0.72 | 0.05 | 0.16 | 103 | 2.65 | 13 | 109 |
| DDH-34 | 45.82 | 46.52 | 0.7 | 0.45 | 3.55 | 125 | 6.16 | 3 | 236 |
| DDH-34 | 46.52 | 47.2 | 0.68 | 0.46 | 4.49 | 116 | 6.67 | 3 | 253 |
| DDH-34 | 47.2 | 48 | 0.8 | 0.63 | 4.63 | 210 | 9.20 | 3 | 357 |
| DDH-34 | 48 | 48.65 | 0.65 | 0.96 | 9.56 | 200 | 13.04 | 3 | 491 |
Source: KGL (2024)
In the period from 2005 to 2008, two drilling programs were executed.
The first comprised 14 drillholes with a total of 4,903 m drilled whose objectives were based on the interpretation of IP geophysical anomalies, which shows that the location of these drillholes was reconnaissance at different targets.
The results have reported values between fair to poor, although the geophysics showed anomalies with possible mineralization, the drillholes intercepted areas with pyrite that possibly they reflected the anomalies, and as they did not yield interesting values, this pyritization was considered syngenetic, the most interesting results are shown in Table 10-5.
| SORACAYA PROJECT | NI 43-101 TECHNICAL REPORT | 10-8 |
| |
|
Table 10-5: Significant Results Soracaya Drilling Programs from 2005 through 2008
DDH Name |
From | To | Interval | Au g/t | Ag g/t | Pb% | Zn% | Sector |
| DDH-38S | 192.8 | 193.8 | 1 | 0.05 | 13.4 | 0.02 | 0.22 | West Tuna Rumi |
| DDH-39S | 139.6 | 141.6 | 2 | 1.93 | 0.9 | 0 | 0.01 | South Esperanza-España |
| DDH-41S | 115 | 116 | 1 | 0.05 | 29.3 | 0.03 | 0 | Cerro Evangelista |
| DDH-42S | 79.4 | 80.6 | 1.3 | 0.36 | 59.9 | 1 | 1 | South Esperanza-España |
| DDH-42S | 85.9 | 87 | 1.1 | 0.05 | 33.2 | 1 | 0.36 | South Esperanza-España |
| DDH-44S | 78.7 | 79.1 | 0.4 | 0.05 | 77.9 | 1 | 0.12 | South Esperanza-España |
| DDH-44S | 79.1 | 80 | 0.9 | 0.05 | 11.8 | 1 | 0.05 | South Esperanza-España |
| DDH-44S | 118.8 | 119.4 | 0.5 | 0.05 | 43 | 0.46 | 0.03 | South Esperanza-España |
| DDH-44S | 168.6 | 172.6 | 4 | 0.05 | 36.4 | 0.42 | 0.06 | South Esperanza-España |
| DDH-44S | 182.9 | 183.5 | 0.7 | 0.05 | 29.4 | 1 | 0.03 | South Esperanza-España |
| DDH-44S | 192.2 | 194.2 | 2 | 0.05 | 44.4 | 0.59 | 0.02 | South Esperanza-España |
| DDH-44S | 243.7 | 251.7 | 8 | 0.05 | 81.3 | 1.27 | 0.05 | South Esperanza-España |
| DDH-44S | 251.7 | 253.1 | 1.4 | 0.05 | 58.9 | 2.31 | 0.04 | South Esperanza-España |
| DDH-46S | 68.4 | 70.4 | 2 | 0.05 | 100 | 0.78 | 0.03 | Cerro Evangelista |
| DDH-46S | 111 | 115.3 | 4.3 | 0.05 | 19.5 | 0.03 | 0 | Cerro Evangelista |
| DDH-47S | 290 | 290.4 | 0.4 | 0.05 | 58 | 0.27 | 0.92 | West Tuna Rumi |
| DDH-48S | 144.4 | 144.9 | 0.5 | 0.05 | 45.9 | 1 | 0.53 | South Esperanza-España |
| DDH-48S | 147.8 | 149.8 | 2 | 0.05 | 21.2 | 1 | 0.02 | South Esperanza-España |
| DDH-48S | 162 | 162.2 | 0.2 | 0.05 | 68.9 | 1 | 1 | South Esperanza-España |
| DDH-49S | 41.7 | 49.3 | 7.6 | 0.05 | 51.1 | 0.91 | 0.21 | South Esperanza-España |
Source: KGL (2024)
The second campaign comprised of nine drillholes with a total of 2,605.60 m drilled. All of them were located on Cerro Evangelista, except for the last two (DDH-58 S and DDH-59 S), which were carried out in the western sector (next to the San Vicente-Tupiza Road).
The objective of these drillholes was to test the silver-gold structures that were located in the evangelist, the relationship of these results obtained is shown in Table 10-6.
| SORACAYA PROJECT | NI 43-101 TECHNICAL REPORT | 10-9 |
| |
|
Table 10-6: Significant Results Soracaya Drilling Programs from 2008 through 2021
| BHID | From m | To m | INT m | Au ppm | Ag ppm | Pb % | Zn % | Structure | Sector |
| DDH-51S | 75.8 | 76.0 | 0.2 | 0.12 | 56.3 | 0.03 | 1.97 | Cerro Evangelista | |
| DDH-51S | 111.8 | 112.2 | 0.4 | 0.14 | 37.4 | 0.08 | 0.00 | Cerro Evangelista | |
| DDH-51S | 128.2 | 128.8 | 0.6 | 0.24 | 25.2 | 0.10 | 0.08 | Cerro Evangelista | |
| DDH-51S | 133.0 | 134.6 | 1.6 | 0.22 | 38.1 | 0.04 | 0.12 | Candelaria | Cerro Evangelista |
| DDH-53S | 167.0 | 167.6 | 0.6 | 1.55 | 30.3 | 0.07 | 0.06 | Cerro Evangelista | |
| DDH-53S | 169.9 | 171.8 | 1.8 | 2.63 | 91.6 | 0.09 | 0.05 | Cerro Evangelista | |
| DDH-53S | 172.9 | 173.3 | 0.5 | 1.54 | 27.9 | 0.05 | 0.14 | Cerro Evangelista | |
| DDH-53S | 174.6 | 175.4 | 0.8 | 1.24 | 47.9 | 0.81 | 0.72 | Candelaria | Cerro Evangelista |
| DDH-54S | 280.6 | 281.9 | 1.3 | 0.03 | 20.4 | 0.04 | 1.00 | Cerro Evangelista | |
| DDH-55S | 145.8 | 146.5 | 0.6 | 0.14 | 48.1 | 1.45 | 3.34 | Crucera (TR-42) | Cerro Evangelista |
| DDH-55S | 317.5 | 317.8 | 0.3 | 1.43 | 54.7 | 0.04 | 0.02 | Cerro Evangelista | |
| DDH-55S | 336.2 | 336.8 | 0.7 | 3.53 | 7.4 | 0.02 | 0.02 | Cerro Evangelista | |
| DDH-55S | 339.0 | 339.6 | 0.6 | 1.82 | 7.8 | 0.01 | 0.01 | Karina (TR-43) | Cerro Evangelista |
| DDH-55S | 349.0 | 349.4 | 0.4 | 1.77 | 17.9 | 0.01 | 0.00 | Cerro Evangelista | |
| DDH-56S | 132.0 | 132.9 | 0.8 | 0.38 | 374.0 | 0.21 | 0.23 | Cerro Evangelista | |
| DDH-56S | 338.80 | 339.40 | 0.6 | 0.290 | 4.8 | 0.05 | 0.03 | Candelaria | Cerro Evangelista |
| DDH-57S | 215.3 | 215.8 | 0.6 | 0.24 | 37.4 | 0.01 | 0.01 | Ramo 7 Techo Candelaria | Cerro Evangelista |
| DDH-57S | 231.0 | 232.4 | 1.3 | 2.09 | 386.4 | 0.03 | 0.03 | Ramo 6 Techo Candelaria | Cerro Evangelista |
| DDH-57S | 236.5 | 238.5 | 2.0 | 0.38 | 75.0 | 0.05 | 0.02 | Ramo 5 Techo Candelaria | Cerro Evangelista |
| DDH-57S | 239.4 | 242.1 | 2.7 | 0.20 | 47.4 | 0.04 | 0.04 | Ramo 4 Techo Candelaria | Cerro Evangelista |
| DDH-57S | 242.8 | 243.6 | 0.8 | 0.18 | 41.9 | 0.04 | 0.03 | Ramo 3 Techo Candelaria | Cerro Evangelista |
| DDH-57S | 245.0 | 247.8 | 2.8 | 0.11 | 120.3 | 0.02 | 0.02 | Ramo 2 Techo Candelaria | Cerro Evangelista |
| DDH-57S | 250.3 | 251.3 | 1.1 | 0.14 | 147.6 | 0.02 | 0.01 | Ramo 1 Techo Candelaria | Cerro Evangelista |
| DDH-57S | 256.0 | 257.1 | 1.1 | 1.13 | 402.0 | 0.06 | 0.17 | Candelaria | Cerro Evangelista |
Source: KGL (2024)
According to these results, the Candelaria vein and its branches would be considered as an exploration target in the future, as it yielded interesting values in gold and eventually silver. It is also important to mention that this structure has a lineament with one of the San Vicente veins.
| SORACAYA PROJECT | NI 43-101 TECHNICAL REPORT | 10-10 |
| |
|
| 10.2 | Drilling Programs |
Drills were operated by Maldonado Exploraciones of La Paz, Bolivia with the exception of the 2006 drilling campaign where Leduc Drilling performed the drilling operations as detailed in Table 10-7. The surface drilling was performed by drilling larger diameter HQ core at the early stage of the hole and reduced to NQ size. The exception is in the Phase I drilling in 1999 the drillholes were started as NQ and then reduced to BQ size.
Drillhole collar surveys were completed using a differential GPS (UTM WGS-84) by company survey staff. Downhole surveys were derived using either Tropary, Flexit or Reflex depending on the year.
Downhole survey measurements were taken every 50 m however since then, based on recommendations, the frequency was increased every 25 m. Survey results were corrected for magnetic declination.
Table 10-7: Soracaya Drilling Program Operations
| Contractor | Phase | Year | # Drillholes | Meters Drilled | Downhole Survey Instrument |
| Surface Drillholes | |||||
| Maldonado Exploraciones | I | 1999 | 36 | 8,896.7 | Tropary |
| Leduc Drilling | II | 2006 | 14 | 4,903.0 | Flexit |
| Maldonado Exploraciones | III | 2008 | 9 | 2,605.6 | Tropary |
| Maldonado Exploraciones | IV | 2018 | 36 | 13,149.0 | Reflex |
Source: Sinchi Wahra (2023)
Prior to commencement of drilling, the exploration geology supervisor set out the number of runs needed to reach total depth using steel bars and the blocks to be inserted by the driller into the core boxes at the appropriate depth delineated using permanent marker. Unless issues are encountered, the standard drill run length is 3 m. Then the exploration geology supervisor verifies this process by counting the number of steel bars introduced in the hole against the remaining steel bars left to complete total length of hole. The completed core is placed in wooden core boxes which are covered by wooden lids and secured with metal nails prior to being transported by mine staff from drill site to core logging facility.
For underground drillholes, orientations are marked before drill enters to drill site area, with the locations being measured using total station. The orientation of the drillhole is painted on both walls of the drift by the exploration geologist to insure correct alignment and positioning of the drill. Once the equipment mobilized and installed, the drill is leveled, and the direction is set. Finally, the dip is checked with a clinometer or compass.
Core recoveries were high, and by utilizing several drill core sizes, Glencore were able to ensure drillhole target completion. The majority of drillholes were drilled perpendicular to the strike and dip of the veining and therefore significantly represent true thickness of the veining.
There are no known drilling or core recovery factors that could materially impact the accuracy of these results.
| SORACAYA PROJECT | NI 43-101 TECHNICAL REPORT | 10-11 |
| |
|
| 11 | SAMPLE PREPARATION, ANALYSES AND SECURITY |
| 11.1 | Drillhole and Sub-Surface Sampling and Security |
As reported in Section 10, the surface diamond drilling was performed by Maldonado Exploraciones performing drilling services in 1999 through 2018, while Leduc Drilling performed the Phase II drilling in 2006. The surface diamond drilling is utilized primarily for resource expansion and delineation identify extensions of structures and specifically to define inferred resources. However, the sub-surface drift sampling is the primary and significant data source for defining and estimating resources which is performed by the Company’s geological staff at the Soracaya Project.
Sampling methods and procedures are consistent including drill core handling, sample collection, chain-of- custody and security in addition to assay preparation, assay analysis and QA/QC procedures are consistent for Soracaya, Bolivar, Caballo Balance and Porco.
The secure, sealed core and channel samples are delivered by Santacruz mine staff for analysis to the ISO Certified (NB/ISO/IEC 17025: 2018) Don Diego Assay Laboratory which is located within the Don Diego mill and processing complex. The Don Diego Complex including the assay laboratory is owned and operated by the Issuer, Santacruz. All samples undergo both assay preparation and assaying at the Don Diego Laboratory which also employs industry accepted QA/QC programs.
All analytical results are entered and reside upon the centralized database called Laboratory Information Management System (LIMS) which is the responsibility and under the supervision of the Don Deigo laboratory staff. The assay information is provided to geological staff via live, non-read-write access for import into the industry recognized geological modelling and estimation software systems such as LeapFrog™ and Datamine™.
Sample rejects and remaining half-core is stored in a secure location and labelled for access and retrieval. These facilities are fully controlled by perimeter fencing and security on the property.
| 11.1.1 | Drill Core Logging, Photography, Sampling and Security |
Drill core from surface and underground was stored in wooden labelled boxes, from the drill and transported from the drill to the core logging facility. Before core splitting and logging commences, drill core is systematically photographed using tripod-mounted camera in high resolution and digitally archived for reference as part of the drill and sample database.
Logging and sampling were undertaken on site by company personnel under a QA/QC protocol developed by Glencore. Technicians first prepared the core boxes by reviewing drillhole depth tags, re-assembling broken sections, and mis-placed or mis-aligned core. Core is then washed and cleaned, then marked every meter using permanent marker. Core logging is performed to identify lithology, alteration, RQD, structure, mineralization and sampling selection for core sawing was completed by technicians under the direction of the geologist.
A digital photographic record was performed on each core box, with each photo containing two to a maximum of three boxes. These photos are taken with natural light and each box are marked with their general description, such as project, sample name, box number, and start and end depths as shown in Figure 11-1.
| SORACAYA PROJECT | NI 43-101 TECHNICAL REPORT | 11-1 |
| |
|
Figure 11-1: Example of Core Box Photography
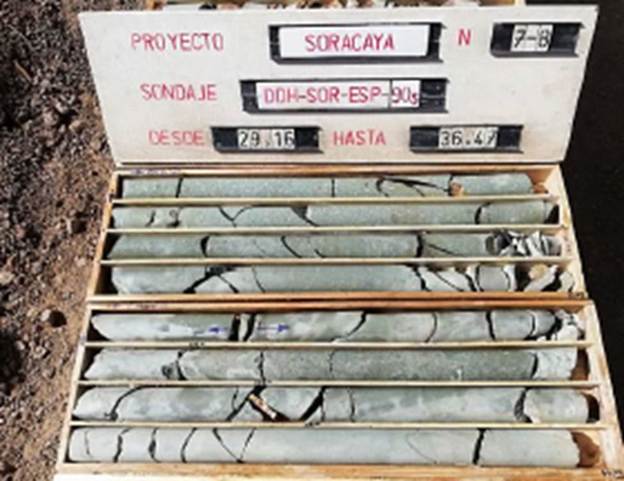
Source: KGL (2023)
The exploration geologist is responsible for marking core interval depending on interest structure in mineralization zones, from 1.0 m to 2.0 m. The typical sample lengths are 1.0 m to 1.5 m with a minimum sample width of 1.0 m and maximum lengths of approximately 2.0 m; sample lengths were based on the lithology and alteration. The geologist also marks the saw line along the core, with each side containing roughly an equivalent amount of mineralization, and also marks the start and end of each sample interval as shown in Figure 11-2. The technician records the core intervals entering then into an Excel™ spreadsheet.
| SORACAYA PROJECT | NI 43-101 TECHNICAL REPORT | 11-2 |
| |
|
Figure 11-2: Example of Core Marked for Splitting
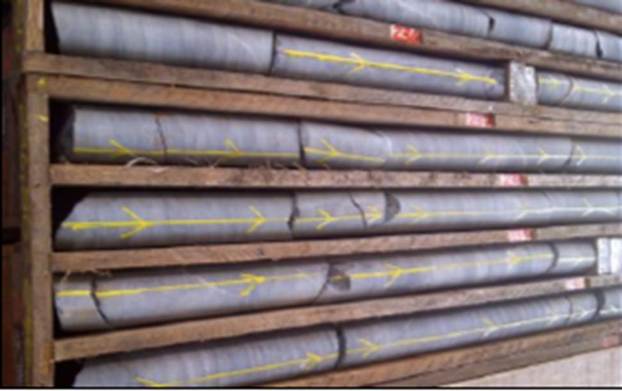
Source: Sinchi Wayra (2023)
Technicians secure the sample boxes while they are transported to the dedicated enclosure for cutting. Samples cutting is performed by trained, specialized personnel equipped with appropriate personal protective equipment (PPE) operating a Target Portasaw™ brand diamond disc cutting machine as shown in Figure 11-3. This type of cutting machine is used because it allows the operator to safely split the core longitudinally with precision. It is also possible to make perpendicular cuts and to cut segments greater than 45 cm can be split.
| SORACAYA PROJECT | NI 43-101 TECHNICAL REPORT | 11-3 |
| |
|
Figure 11-3: Core Splitting Facilities
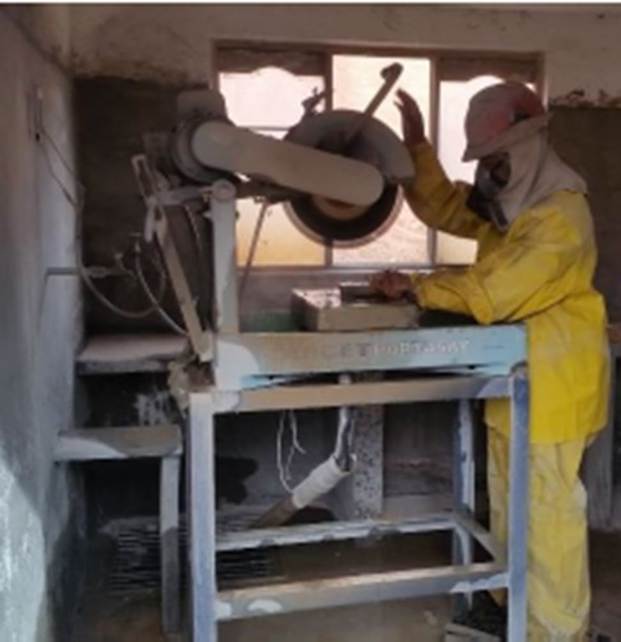
Source: Sinchi Wayra (2023)
Once the core is cut, half of the drill core is inserted into sample bags along with a sample ticket, tied with plastic straps and then placed in consecutive order according to sequential coding. Then, seven to ten samples are placed in rice bags, based on weight and not exceeding 25 kg. Then the rice sacks are grouped into batches and order maintaining as shown Figure 11-4.
| SORACAYA PROJECT | NI 43-101 TECHNICAL REPORT | 11-4 |
| |
|
Figure 11-4: Samples Prepared for Analysis Transport
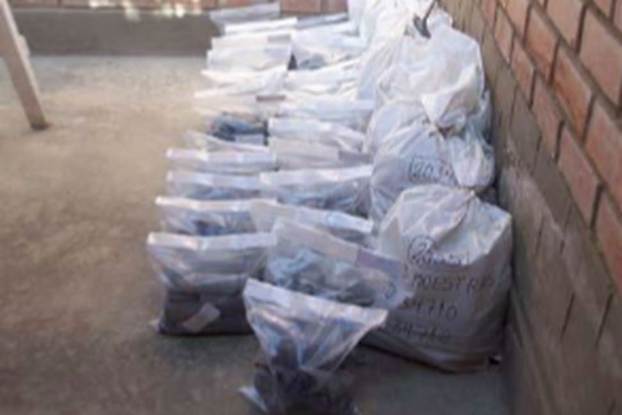
Source: Sinchi Wayra (2023)
The samples are then delivered to the laboratory through an analysis request form which lists the required elements for reporting. The form also includes details about the quantity of samples sent, how many sacks they are transported in, and indicate if they are special samples as shown in Figure 11-5.
| SORACAYA PROJECT | NI 43-101 TECHNICAL REPORT | 11-5 |
| |
|
Figure 11-5: Sample Submission Form
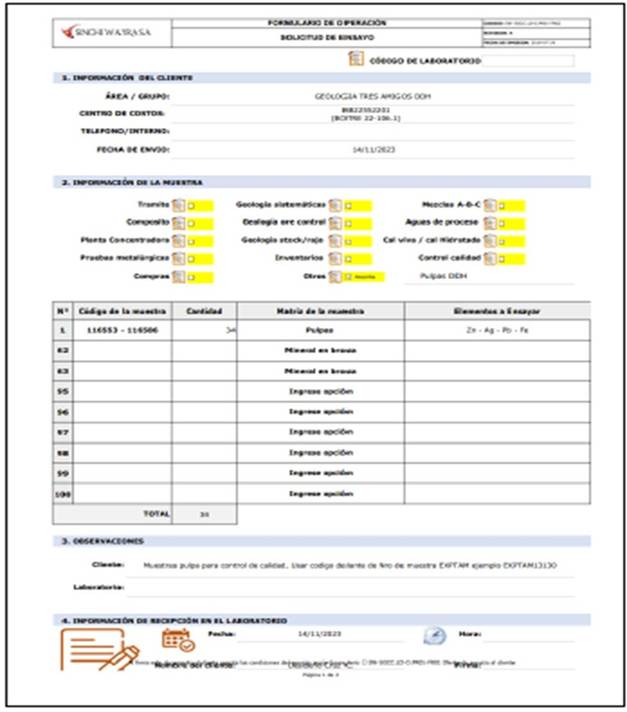
Source: Sinchi Wayra (2023)
| SORACAYA PROJECT | NI 43-101 TECHNICAL REPORT | 11-6 |
| |
|
All core boxes that have completed the entire logging and sampling process are stored in the logging area sequentially. They are then transported to the permanent secured core storage facilities and then stored on covered metal shelves as shown in Figure 11-6. Each core box is labelled and coded for easy identification and access.
Figure 11-6: Drill Core Storage Facilities
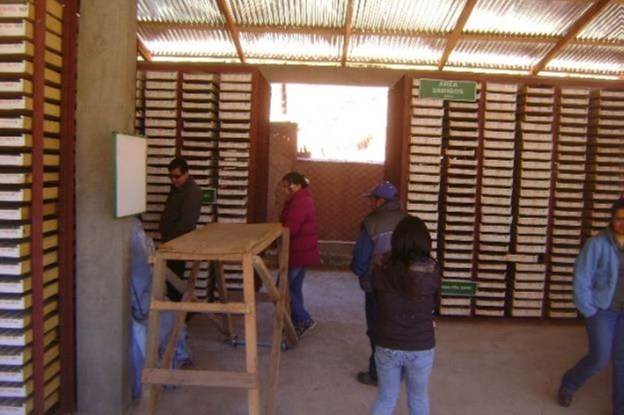
Source: Sinchi Wayra (2023)
| 11.1.2 | Sub-Surface Sampling and Logging |
The sub-surface sampling is primarily performed within horizontal drift development in addition to face and stope development. Prior to entering the designated underground sampling areas, inspection is performed to ensure or establish adequate ventilation and to perform scaling to eliminate hazards. The structure is washed by pressure hose prior to sampling and the faces marked with white spray paint to delineate length and orientation of sampling transverses. Then a ladder is secured if samples are being taken from the back or at heights up the drift walls to insure safe access. Samples are the taken using a hammer and chisel, collected into an un-used sample bag. Alternatively, samples are collected onto a cleaned and washed tarp, or a specialized tarp lined sample collection pocket for transfer into sample bags. Samples are collected from a 10 cm wide and at least 2 cm depth channel using the hammer and chisel by following the white painted markings. The sampling is performed as two-person teams with one operating the hammer and chisel, and the other collected the rock and mineralized fragments. A new sample bag or freshly cleaned tarp is used for each sample. In the case where the sample width is greater than approximately 1 m then more than one sample must be taken. For stope sampling, systematic samples are taken every 4 m. These samples are split depending upon the structure being sampled and the character of the mineralization encountered. Samples are then introduced to a polyethylene bag with its sample number labeled, sample tag inserted and gathered for transport to the surface for delivery to the analytical laboratory by Santacruz staff of analysis.
| SORACAYA PROJECT | NI 43-101 TECHNICAL REPORT | 11-7 |
| |
|
Table 11-1 lists the location and lengths and Table 11-2 shows the complete assay data listing for the underground channel samples.
Table 11-1: Underground Sample Locations
| Channel Name | Easting | Northing | Elevation | Length (m) |
| C21119 | 784998.14 | 7645708.2 | 4402.87 | 0.7 |
| C21120 | 784995.87 | 7645706.2 | 4402.86 | 0.8 |
| C21121 | 784992.58 | 7645704.5 | 4402.84 | 0.9 |
| C21122 | 784989.9 | 7645703.1 | 4402.83 | 1.1 |
| C21123 | 784987.57 | 7645699.6 | 4402.81 | 2.7 |
| C21125 | 784984.16 | 7645698.7 | 4402.8 | 0.8 |
| C21149 | 784980.39 | 7645696.1 | 4402.78 | 0.4 |
| C21150 | 784977.84 | 7645693.5 | 4402.77 | 1.5 |
| C21152 | 784976.01 | 7645692.4 | 4402.76 | 0.8 |
| C21153 | 784973.79 | 7645689.3 | 4402.74 | 1.7 |
| C21181 | 784970.35 | 7645687.6 | 4402.73 | 0.7 |
| C21182 | 784968.58 | 7645686.7 | 4402.72 | 1 |
| C21183 | 784965.03 | 7645684.5 | 4402.7 | 1.2 |
| C21184 | 784960.12 | 7645681.1 | 4402.68 | 0.9 |
| C21185 | 784957.09 | 7645677.9 | 4402.66 | 1.2 |
| C21248 | 784954.62 | 7645675.7 | 4402.65 | 0.9 |
| C21249 | 784951.26 | 7645673.2 | 4402.63 | 0.7 |
| C21250 | 784948.07 | 7645670.9 | 4402.62 | 1.1 |
| C21251 | 784944.1 | 7645667.5 | 4402.59 | 1.6 |
| C21253 | 784940.83 | 7645665.5 | 4402.579 | 1.2 |
| C21254 | 784938.57 | 7645663.5 | 4402.567 | 1.5 |
| C21351 | 784935.92 | 7645660.8 | 4402.552 | 0.8 |
| C21352 | 784932.65 | 7645658.4 | 4402.535 | 1 |
| C21353 | 784927.96 | 7645655.3 | 4402.512 | 0.8 |
| C21354 | 784923.54 | 7645653 | 4402.492 | 1.1 |
| C21355 | 784919.13 | 7645651.6 | 4402.474 | 1.2 |
| C21356 | 784914.86 | 7645649.6 | 4402.456 | 0.8 |
| C21357 | 784911.44 | 7645648.5 | 4402.441 | 1.6 |
| C21358 | 784907.7 | 7645645.4 | 4402.422 | 0.5 |
| C21359 | 784904.45 | 7645643.5 | 4402.407 | 1.1 |
| SORACAYA PROJECT | NI 43-101 TECHNICAL REPORT | 11-8 |
| |
|
| Channel Name | Easting | Northing | Elevation | Length (m) |
| C21360 | 784900.57 | 7645641.4 | 4402.389 | 2 |
| C21361 | 784898.43 | 7645639.7 | 4402.378 | 1.4 |
| C21362 | 784894.83 | 7645637.4 | 4402.361 | 0.9 |
| C21363 | 784891.44 | 7645635.2 | 4402.345 | 1.7 |
| C21364 | 784888.33 | 7645632.7 | 4402.329 | 1.2 |
| C21365 | 784884.19 | 7645629.2 | 4402.307 | 0.8 |
| C21366 | 784879 | 7645625 | 4402.28 | 1.1 |
| C21367 | 784875.8 | 7645622.6 | 4402.263 | 1 |
| C21368 | 784872.48 | 7645619.6 | 4402.246 | 1.1 |
| C21369 | 784869.47 | 7645617.1 | 4402.229 | 0.9 |
| C21370 | 784866.17 | 7645614.8 | 4402.213 | 0.7 |
| C21371 | 784862.18 | 7645611.2 | 4402.192 | 0.7 |
| C21372 | 784860.08 | 7645607.7 | 4402.176 | 0.9 |
| C21374 | 784857.06 | 7645605 | 4402.161 | 1.1 |
| C21375 | 784854.69 | 7645601.7 | 4402.145 | 1.1 |
| C21452 | 784852.06 | 7645600.1 | 4402.133 | 1.3 |
| C21453 | 784848.73 | 7645595.5 | 4402.11 | 0.8 |
| C21454 | 784844.3 | 7645592.9 | 4402.088 | 1.15 |
| C21455 | 784840.96 | 7645590.6 | 4402.073 | 0.7 |
| C21456 | 784839.32 | 7645589.4 | 4402.065 | 0.85 |
| C21457 | 784836.33 | 7645586.7 | 4402.05 | 0.8 |
| C21458 | 784835.04 | 7645585.1 | 4402.041 | 0.8 |
| C21459 | 784833.48 | 7645583.8 | 4402.032 | 0.7 |
| C21460 | 784831.97 | 7645582.5 | 4402.025 | 1.2 |
| C21461 | 784830.48 | 7645581.1 | 4402.016 | 0.8 |
| C21462 | 784827.33 | 7645578.9 | 4402 | 0.2 |
| C21463 | 784825.44 | 7645578.1 | 4401.992 | 0.35 |
| C21464 | 784822.26 | 7645577.3 | 4401.98 | 0.4 |
| C21465 | 784813.49 | 7645573.1 | 4401.941 | 0.7 |
| C21466 | 784806.33 | 7645566.1 | 4401.901 | 0.45 |
| C21479 | 784884.61 | 7645626.9 | 4425.02 | 1 |
| C21480 | 784889.22 | 7645630.3 | 4425.123 | 1.1 |
| C21481 | 784893.23 | 7645633.7 | 4425.22 | 1.1 |
| C21482 | 784895.51 | 7645635.7 | 4425.272 | 0.6 |
| C21483 | 784905.34 | 7645643.4 | 4425.494 | 0.6 |
| C21488 | 784919.07 | 7645645.6 | 4425.712 | 0.5 |
| C21489 | 784922.51 | 7645647.7 | 4425.783 | 0.4 |
| C21490 | 784925.58 | 7645649.4 | 4425.845 | 0.4 |
| SORACAYA PROJECT | NI 43-101 TECHNICAL REPORT | 11-9 |
| |
|
| Channel Name | Easting | Northing | Elevation | Length (m) |
| C21491 | 784930.79 | 7645652.7 | 4425.954 | 0.5 |
| C21493 | 784935.68 | 7645656.6 | 4426.066 | 0.8 |
| C21495 | 784942.49 | 7645661.4 | 4426.214 | 0.5 |
| C21496 | 784974.37 | 7645685.9 | 4426.931 | 0.4 |
| C21497 | 784980.49 | 7645691.7 | 4427.082 | 1.5 |
| C21498 | 784982.86 | 7645694 | 4427.144 | 1.7 |
| C21499 | 784985.78 | 7645696.1 | 4427.204 | 0.8 |
| C21500 | 784988.28 | 7645698.3 | 4427.261 | 0.9 |
| C21501 | 784991.14 | 7645700.8 | 4427.328 | 0.3 |
| C21502 | 784795.09 | 7645562.8 | 4401.856 | 1.1 |
| C21503 | 784784.67 | 7645558.5 | 4401.811 | 0.7 |
Source: Sinchi Wayra (2024)
Table 11-2: Assay Results for the Soracaya Underground Channel Sampling
| Hole # | From | To | -AI- | Zn% | Pb% | Ag | ZnEq | Code | AgEq |
| C21119 | 0 | 0.7 | 0.7 | 1.5 | 7.84 | 193 | 12.11 | 14 | 457 |
| C21120 | 0 | 0.8 | 0.8 | 3.87 | 3.21 | 184 | 10.74 | 14 | 407 |
| C21121 | 0 | 0.9 | 0.9 | 1.51 | 13.22 | 249 | 17.56 | 14 | 658 |
| C21122 | 0 | 1.1 | 1.1 | 2.11 | 7.37 | 183 | 12.12 | 14 | 456 |
| C21123 | 0 | 1 | 1 | 3.93 | 14.88 | 321 | 22.97 | 14 | 860 |
| C21123 | 1 | 2.7 | 1.7 | 0.1 | 0.26 | 12 | 0.59 | 14 | 23 |
| C21125 | 0 | 0.8 | 0.8 | 0.82 | 3.06 | 112 | 5.84 | 14 | 223 |
| C21149 | 0 | 0.4 | 0.4 | 9.5 | 15.31 | 652 | 36.83 | 14 | 1399 |
| C21150 | 0 | 0.7 | 0.7 | 0.5 | 0.31 | 12 | 1.02 | 14 | 38 |
| C21150 | 0.7 | 1.5 | 0.8 | 0.1 | 0.3 | 58 | 1.72 | 14 | 70 |
| C21152 | 0 | 0.8 | 0.8 | 1.83 | 1.67 | 247 | 9.04 | 14 | 357 |
| C21153 | 0 | 0.9 | 0.9 | 0.47 | 0.42 | 13 | 1.10 | 14 | 41 |
| C21153 | 0.9 | 1.7 | 0.8 | 1.3 | 3.85 | 536 | 17.12 | 14 | 685 |
| C21181 | 0 | 0.7 | 0.7 | 0.41 | 0.4 | 22 | 1.24 | 14 | 47 |
| C21182 | 0 | 1 | 1 | 0.2 | 0.63 | 331 | 8.64 | 14 | 355 |
| C21183 | 0 | 1.2 | 1.2 | 0.75 | 0.54 | 433 | 11.57 | 14 | 474 |
| C21184 | 0 | 0.9 | 0.9 | 0.1 | 0.77 | 148 | 4.25 | 14 | 172 |
| C21185 | 0 | 1.2 | 1.2 | 1.16 | 7.08 | 598 | 20.93 | 14 | 829 |
| C21248 | 0 | 0.9 | 0.9 | 0.94 | 2.22 | 208 | 7.63 | 14 | 301 |
| C21249 | 0 | 0.7 | 0.7 | 0.82 | 1.15 | 402 | 11.36 | 14 | 462 |
| C21250 | 0 | 1.1 | 1.1 | 1.27 | 8.2 | 516 | 19.92 | 14 | 781 |
| C21251 | 0 | 1.1 | 1.1 | 0.1 | 0.59 | 341 | 8.75 | 14 | 360 |
| C21251 | 1.1 | 1.6 | 0.5 | 18.03 | 9.13 | 306 | 32.34 | 14 | 1189 |
| C21253 | 0 | 1.2 | 1.2 | 1.77 | 2.09 | 954 | 26.30 | 14 | 1073 |
| SORACAYA PROJECT | NI 43-101 TECHNICAL REPORT | 11-10 |
| |
|
| Hole # | From | To | -AI- | Zn% | Pb% | Ag | ZnEq | Code | AgEq |
| C21254 | 0 | 1.5 | 1.5 | 1.7 | 2.74 | 441 | 14.39 | 14 | 575 |
| C21351 | 0 | 0.8 | 0.8 | 1.12 | 1.64 | 415 | 12.35 | 14 | 499 |
| C21352 | 0 | 1 | 1 | 1.19 | 2.57 | 468 | 14.40 | 14 | 579 |
| C21353 | 0 | 0.8 | 0.8 | 2.35 | 5.33 | 392 | 15.83 | 14 | 618 |
| C21354 | 0 | 1.1 | 1.1 | 0.71 | 2.22 | 868 | 23.28 | 14 | 953 |
| C21355 | 0 | 1.2 | 1.2 | 1.38 | 3.84 | 124 | 7.28 | 14 | 276 |
| C21356 | 0 | 0.8 | 0.8 | 2.07 | 6.11 | 123 | 9.68 | 14 | 360 |
| C21357 | 0 | 1.6 | 1.6 | 0.28 | 1.73 | 32 | 2.37 | 14 | 88 |
| C21358 | 0 | 0.5 | 0.5 | 2.27 | 9.86 | 362 | 18.48 | 14 | 707 |
| C21359 | 0 | 1.1 | 1.1 | 1.39 | 1.7 | 153 | 6.36 | 14 | 248 |
| C21360 | 0 | 2 | 2 | 1.54 | 1.75 | 465 | 14.06 | 14 | 566 |
| C21361 | 0 | 1.4 | 1.4 | 0.65 | 0.52 | 72 | 2.78 | 14 | 109 |
| C21362 | 0 | 0.9 | 0.9 | 1.59 | 3.03 | 135 | 7.14 | 14 | 273 |
| C21363 | 0 | 1.7 | 1.7 | 0.1 | 0.81 | 78 | 2.59 | 14 | 103 |
| C21364 | 0 | 1.2 | 1.2 | 0.57 | 1.12 | 189 | 5.97 | 14 | 239 |
| C21365 | 0 | 0.8 | 0.8 | 0.1 | 1.93 | 60 | 3.01 | 14 | 115 |
| C21366 | 0 | 1.1 | 1.1 | 4.65 | 7.5 | 685 | 26.83 | 14 | 1051 |
| C21367 | 0 | 1 | 1 | 1.08 | 0.91 | 388 | 11.10 | 14 | 451 |
| C21368 | 0 | 1.1 | 1.1 | 0.43 | 0.9 | 481 | 12.68 | 14 | 520 |
| C21369 | 0 | 0.9 | 0.9 | 1.86 | 0.74 | 532 | 15.22 | 14 | 618 |
| C21370 | 0 | 0.7 | 0.7 | 1.16 | 2.26 | 2753 | 69.09 | 14 | 2855 |
| C21371 | 0 | 0.7 | 0.7 | 0.48 | 1.48 | 34 | 2.42 | 14 | 91 |
| C21372 | 0 | 0.5 | 0.5 | 0.14 | 0.5 | 94 | 2.78 | 14 | 112 |
| C21372 | 0.5 | 0.9 | 0.4 | 1.5 | 3.4 | 113 | 6.80 | 14 | 257 |
| C21374 | 0 | 1.1 | 1.1 | 0.28 | 0.98 | 75 | 2.83 | 14 | 111 |
| C21375 | 0 | 0.7 | 0.7 | 0.14 | 0.56 | 12 | 0.85 | 14 | 32 |
| C21375 | 0.7 | 1.1 | 0.4 | 0.89 | 0.6 | 50 | 2.55 | 14 | 98 |
| C21452 | 0 | 1.3 | 1.3 | 0.38 | 1.3 | 720 | 18.69 | 14 | 768 |
| C21453 | 0 | 0.8 | 0.8 | 0.04 | 0.24 | 28 | 0.90 | 14 | 36 |
| C21454 | 0 | 1.15 | 1.15 | 0.2 | 4.4 | 267 | 9.97 | 14 | 392 |
| C21455 | 0 | 0.7 | 0.7 | 0.12 | 1.02 | 148 | 4.46 | 14 | 180 |
| C21456 | 0 | 0.85 | 0.85 | 0.18 | 2.8 | 243 | 8.15 | 14 | 325 |
| C21457 | 0 | 0.8 | 0.8 | 0.3 | 1.34 | 246 | 7.24 | 14 | 293 |
| C21458 | 0 | 0.8 | 0.8 | 1.3 | 2.6 | 269 | 9.75 | 14 | 385 |
| C21459 | 0 | 0.7 | 0.7 | 0.5 | 11.1 | 2990 | 80.86 | 14 | 3306 |
| C21460 | 0 | 1.2 | 1.2 | 0.7 | 1.32 | 107 | 4.28 | 14 | 167 |
| C21461 | 0 | 0.8 | 0.8 | 0.14 | 1.52 | 462 | 12.41 | 14 | 508 |
| C21462 | 0 | 0.2 | 0.2 | 0.22 | 4.82 | 114 | 6.63 | 14 | 251 |
| C21463 | 0 | 0.35 | 0.35 | 2.4 | 1.96 | 114 | 6.63 | 14 | 252 |
| SORACAYA PROJECT | NI 43-101 TECHNICAL REPORT | 11-11 |
| |
|
| Hole # | From | To | -AI- | Zn% | Pb% | Ag | ZnEq | Code | AgEq |
| C21464 | 0 | 0.4 | 0.4 | 4 | 3.17 | 371 | 15.33 | 14 | 598 |
| C21465 | 0 | 0.7 | 0.7 | 6.49 | 3.52 | 1313 | 40.75 | 15 | 1637 |
| C21466 | 0 | 0.45 | 0.45 | 1.47 | 0.91 | 1558 | 39.63 | 15 | 1634 |
| C21479 | 0 | 1 | 1 | 1.75 | 2.34 | 1350 | 36.00 | 14 | 1475 |
| C21480 | 0 | 1.1 | 1.1 | 1 | 2.2 | 553 | 15.97 | 14 | 648 |
| C21481 | 0 | 1.1 | 1.1 | 0.68 | 3.2 | 470 | 14.42 | 14 | 580 |
| C21482 | 0 | 0.6 | 0.6 | 1.94 | 2.4 | 408 | 13.58 | 14 | 541 |
| C21483 | 0 | 0.6 | 0.6 | 2.2 | 2.94 | 123 | 7.40 | 14 | 280 |
| C21488 | 0 | 0.5 | 0.5 | 14.42 | 10.39 | 311 | 29.81 | 14 | 1100 |
| C21489 | 0 | 0.4 | 0.4 | 12.47 | 24.07 | 633 | 46.01 | 14 | 1721 |
| C21490 | 0 | 0.4 | 0.4 | 12.81 | 3.83 | 154 | 19.43 | 14 | 710 |
| C21491 | 0 | 0.5 | 0.5 | 0.28 | 2.6 | 1210 | 31.36 | 14 | 1290 |
| C21493 | 0 | 0.8 | 0.8 | 0.1 | 5.9 | 758 | 22.82 | 14 | 920 |
| C21495 | 0 | 0.5 | 0.5 | 0.42 | 1.84 | 390 | 11.20 | 14 | 454 |
| C21496 | 0 | 0.4 | 0.4 | 0.24 | 1.94 | 400 | 11.34 | 14 | 461 |
| C21497 | 0 | 1.5 | 1.5 | 0.44 | 1.63 | 820 | 21.40 | 14 | 879 |
| C21498 | 0 | 1.7 | 1.7 | 1.67 | 3 | 520 | 16.46 | 14 | 660 |
| C21499 | 0 | 0.8 | 0.8 | 1.81 | 4.9 | 494 | 17.42 | 14 | 690 |
| C21500 | 0 | 0.9 | 0.9 | 0.04 | 0.44 | 53 | 1.65 | 14 | 66 |
| C21501 | 0 | 0.3 | 0.3 | 1.34 | 20.41 | 571 | 30.60 | 14 | 1167 |
| C21502 | 0 | 1.1 | 1.1 | 11.05 | 5.42 | 214 | 20.32 | 15 | 750 |
| C21503 | 0 | 0.7 | 0.7 | 0.08 | 2.28 | 3350 | 82.39 | 15 | 3414 |
Source: Sinchi Wayra (2024)
| 11.2 | Sample Preparation and Analysis |
Samples were transported to the Don Diego Laboratory, which has NB/ISO/IEC 17025: 2018 certification, for sample preparation and analysis where they are documented and entered to the LIMS for tracking and secure reporting of data and results. It is important to note that the Don Diego Laboratory is owned and operated by the Issuer, Santacruz, and was previously owned and operated by Glencore prior to the purchase of all the Sinchi Wayra operations.
Once received the samples are laid out for sample preparation which entails crushing and pulverizing the drill core down to 95% passing -140 microns. The resulting pulps are weighed and individually packaged into envelopes and loaded onto carts for assaying. The resulted prepared samples are then assayed for Ag, Pb, Zn, and Fe using an Atomic Absorption Spectroscopy (AAS) followed by a Gravimetric finish for Ag samples >2,100 g/t and volumetric for Pb >16% and Zn >20% as shown in Figure 11-7.
| SORACAYA PROJECT | NI 43-101 TECHNICAL REPORT | 11-12 |
| |
|
Figure 11-7: Assay Methods Employed at the Soracaya Project
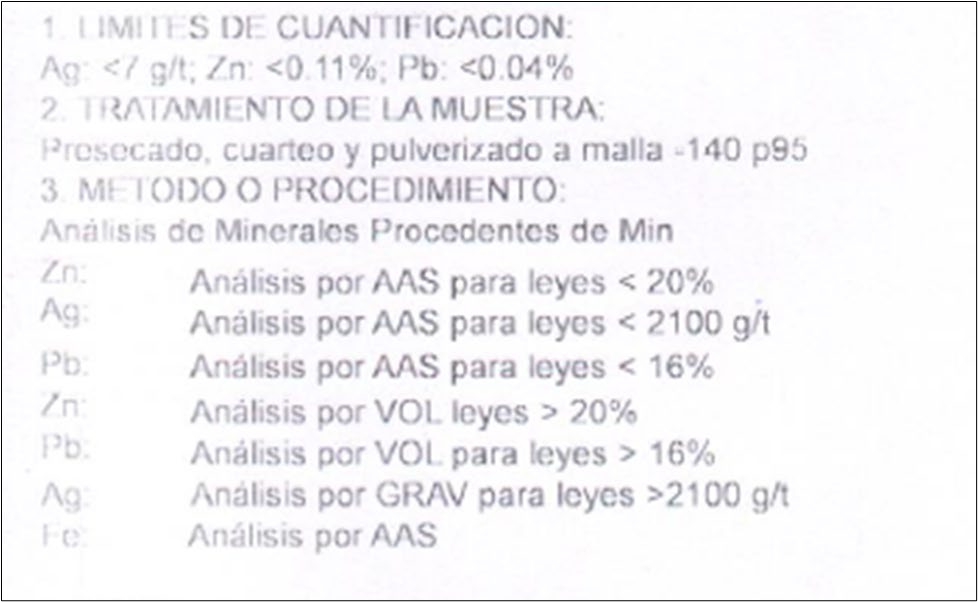
Source: Sinchi Wayra (2023)
Analytical results are provided via secure servers and pdf formatted assay certificates as shown in Figure 11-8.
| SORACAYA PROJECT | NI 43-101 TECHNICAL REPORT | 11-13 |
| |
|
Figure 11-8: Example of Don Diego Laboratory Assay Certificate
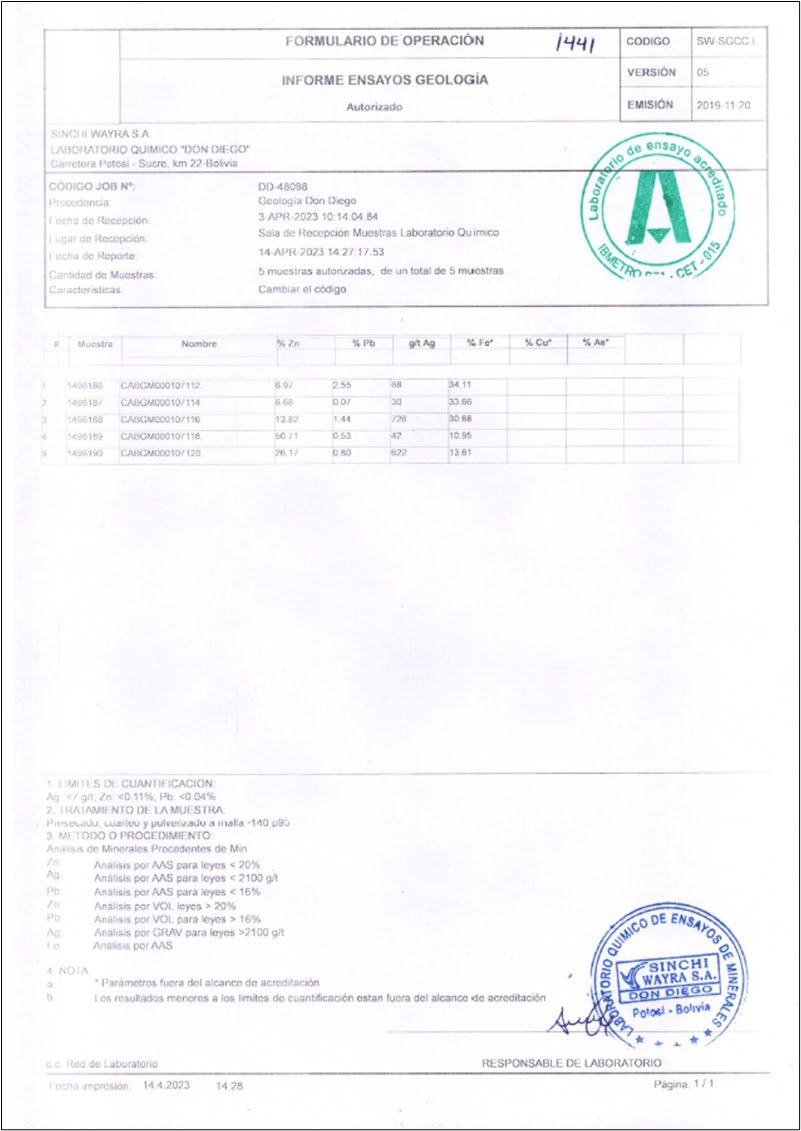
Source: Sinchi Wayra (2023)
| SORACAYA PROJECT | NI 43-101 TECHNICAL REPORT | 11-14 |
| |
|
Santacruz database files are stored and managed in Microsoft Access™ and Excel™ formats before being transferred to LeapFrog™ and Datamine™ software.
All half-core is stored at a dedicated core storage facility that is locked and is within a fully controlled perimeter wall and fencing with security on the property.
| 11.3 | QA/QC Procedures and Discussion of Results |
The purpose of Quality Assurance and Quality Control (QA/QC) is to ensure that the laboratory procedures may be relied upon by guarding against sample contamination and test whether the equipment used to prepare the samples has been sufficiently cleaned between sequential assays. In addition, it is standard and highly recommended practice to insert additional “control” samples to continually test the precision and accuracy of the resulting analyses.
Since 2018, Sinchi Wayra has implemented QA/QC programs to varying degrees which employ industry standards and accepted practices for drill core and channel sampling. This includes the regular insertion of blanks and standards randomly into the sample stream along with performing duplicate analysis of pulps and coarse rejects to assess analytical precision and accuracy. Additionally, beginning in 2012, the practice of including coarse and pulp duplicate QA/QC samples was employed.
Field blanks are non-mineralized material sourced locally and inserted into the sample series one every 20 samples (5%). Field blanks are inserted to test for any potential carry-over contamination which might occur in the crushing phase of sample preparation, because of laboratory poor cleaning practices.
Standards analysis are used to inserted to test and insure accuracy.
Duplicate analysis of pulps and quarter-core are used to evaluate analytical precision and to determine if any biases exist between laboratories. Duplicate analysis of coarse rejects is used to analyze preparation error. Table 11-3 details the QA/QC sample insertion rate.
Table 11-3: QA/QC Sample Insertion Rates
| Sample Type | Notes |
| Pulp Blanks | Usually inserted at the end of mineralized runs to measure carry-over at the laboratory |
| Pulp Duplicates | Undertaken at second laboratory with same analytical technique. High- and low-grade mineralized samples are usually chosen |
| Coarse Duplicates | Normally choose mineralized samples, used to measure laboratory sample preparation |
| Standards | Certified standards ME-1602 and ME-017 |
Source: KGL (2024)
In 2018, a total of 161 control samples as shown in Table 11-4 were assigned for QA/QC purposes and accounted for approximately 20% of total samples taken during the program.
| SORACAYA PROJECT | NI 43-101 TECHNICAL REPORT | 11-15 |
| |
|
Table 11-4: Quantity of Control Samples by Type
| Control Type | # |
| Blanks | 47 |
| Standards | 18 |
| Coarse Duplicates | 53 |
| Pulp Duplicates | 54 |
| Total | 172 |
Source: KGL (2024)
| 11.3.1 | Blanks |
Contamination and determining whether adequate cleaning practices are being performed at the laboratory is evaluated through the direct incorporation of sample blanks. Blank samples typically have some level of very low-grade background values depending upon where they are sourced from so the results should be at that value or within acceptable error (±) thresholds. The placement of blanks within the sample stream is typically in the middle of an identified mineralized structure or immediately at the end of the section or sample run. Figure 11-9 through Figure 11-11 show results zero failures or 0% for silver and lead blanks, while there were three failures or 6% for zinc.
Figure 11-9: Plot of Ag g/t Values for Blanks
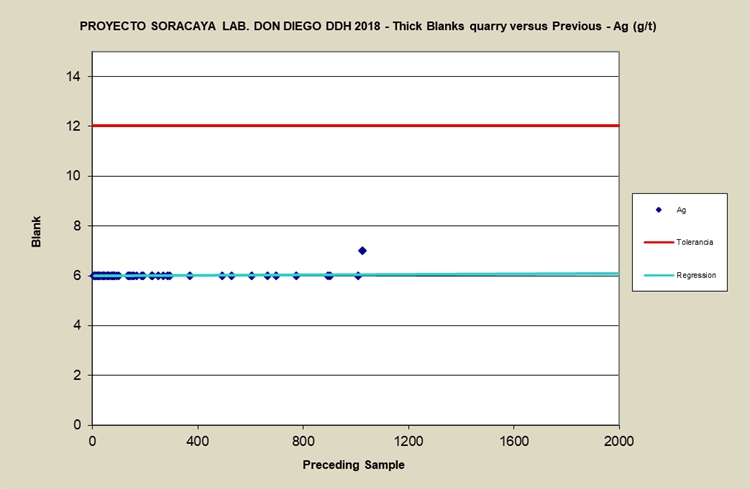
Source: Sinchi Wayra (2024)
| SORACAYA PROJECT | NI 43-101 TECHNICAL REPORT | 11-16 |
| |
|
Figure 11-10: Plot of Pb% Values for Blanks
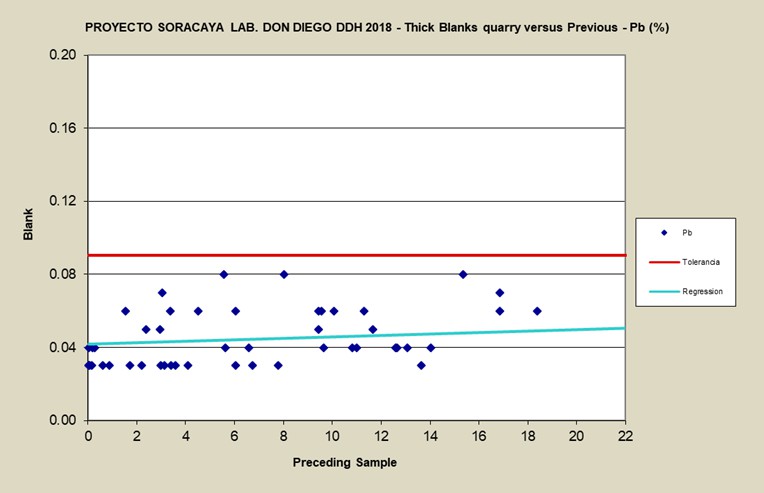
Source: Sinchi Wayra (2024)
Figure 11-11: Plot of Zn% Values for Blanks
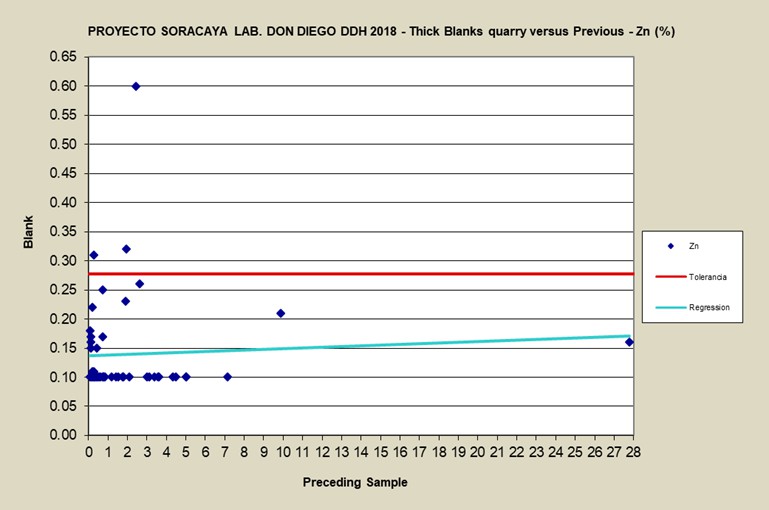
Source: Sinchi Wayra (2024)
| SORACAYA PROJECT | NI 43-101 TECHNICAL REPORT | 11-17 |
| |
|
| 11.4 | Standards |
Commercial standards sourced from CDN are used to test the accuracy of the assays and to monitor the consistency of the laboratory over time. All standards listed here are multielement standards with recommended values (between-lab mean ± 2 standard deviations) for silver, lead and zinc. All prepared blanks are certified values with absolute and relative standard deviations, as well as 95% confidence intervals. In the case of the certified blanks, 2 standard deviations were chosen as a guide to flag samples for QAQC analysis. These standards were randomly inserted into the sample sequences. Table 11-5 show the standards used for the Soracaya Project, along with their recommended mean metal concentrations.
Table 11-5: Recommended Metal Concentrations of Standards Used at Soracaya
| Standard | Ag g/t | Pb % | Zn % |
| CDN-ME-017 | 37.8 | 0.61 | 6.85 |
| CDN-ME-1402 | 125.8 | 2.45 | 14.7 |
Source: CDN Laboratories website
Failure of a standard implies that all routine samples within its sphere of influence are also considered to have failed and must be re-analyzed at the same primary laboratory. Standards are considered to have failed if the reported gold, silver, copper lead or zinc assay concentration is greater or less than two standard deviations from the recommended mean value for that standard.
In the case of failure of any standard, the failure is recorded, and a determination is made as to whether the failure is within the proximity of any mineralized intervals. If so, the procedure is to re-assay the block of samples within its sphere of influence. In practice, this means that all consecutively listed samples, down list from the failing standard to the next passing standard, and up list from the failing standard to the next prior passing standard, are considered to have failed, and must be re-assayed.
Figure 11-12 through Figure 11-14 shows the results for the CDN ME-017 standards while Figure 11-15 through Figure 11-17 provides the results for the CDN ME-1402 standards for Ag, Pb and Zn, respectively. original versus duplicate grades for Ag, Pb and Zn, respectively. Note that a ±2 standard deviation threshold is denoted as green lines and the purple dashed line illustrates target line.
Of the nine standard analyses for each of CDN ME-017 and CDN ME-1402, there is only one failure for the Pb CDN ME-017 standard. Although the results are good, the number of standards inserted and analysed is minimal. Going forward, the number of standards, and all QAQC methodologies must be increased.
| SORACAYA PROJECT | NI 43-101 TECHNICAL REPORT | 11-18 |
| |
|
Figure 11-12: Plot of Ag g/t Values for Standards ME-017
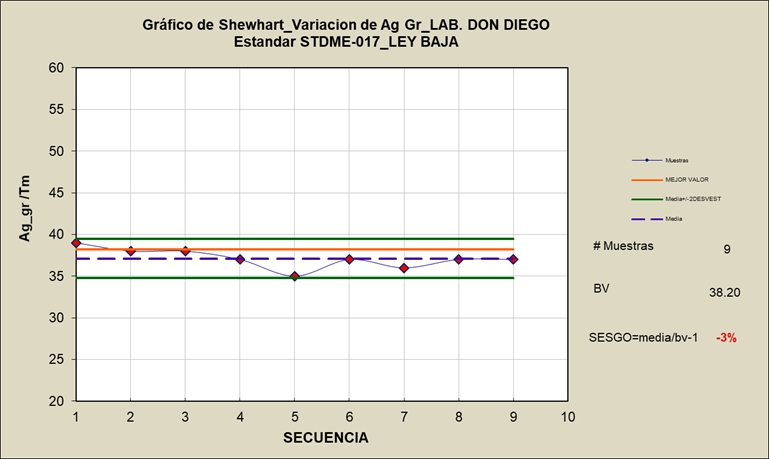
Source: Sinchi Wayra (2024)
Figure 11-13: Plot of Pb% Values for Standards ME-017
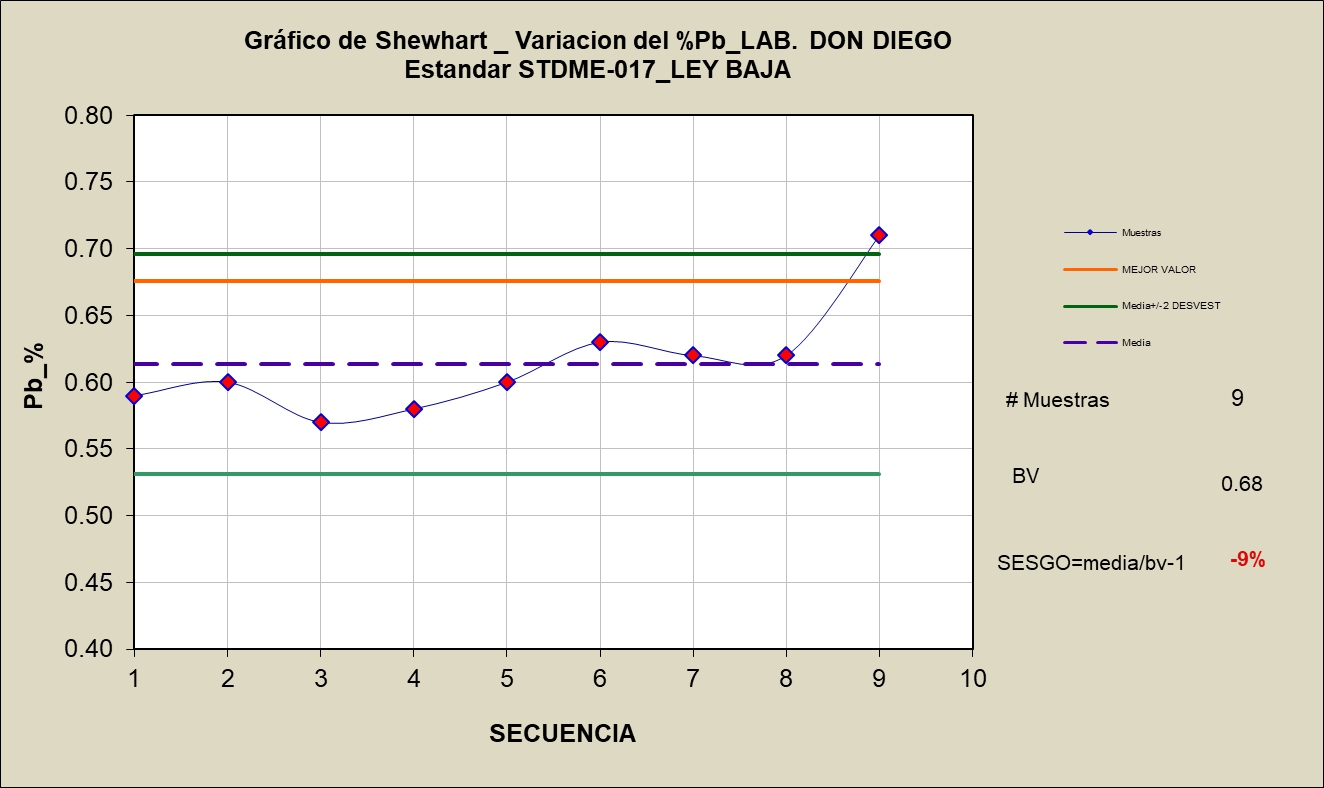
Source: Sinchi Wayra (2024)
| SORACAYA PROJECT | NI 43-101 TECHNICAL REPORT | 11-19 |
| |
|
Figure 11-14: Plot of Pb% Values for Standards ME-017
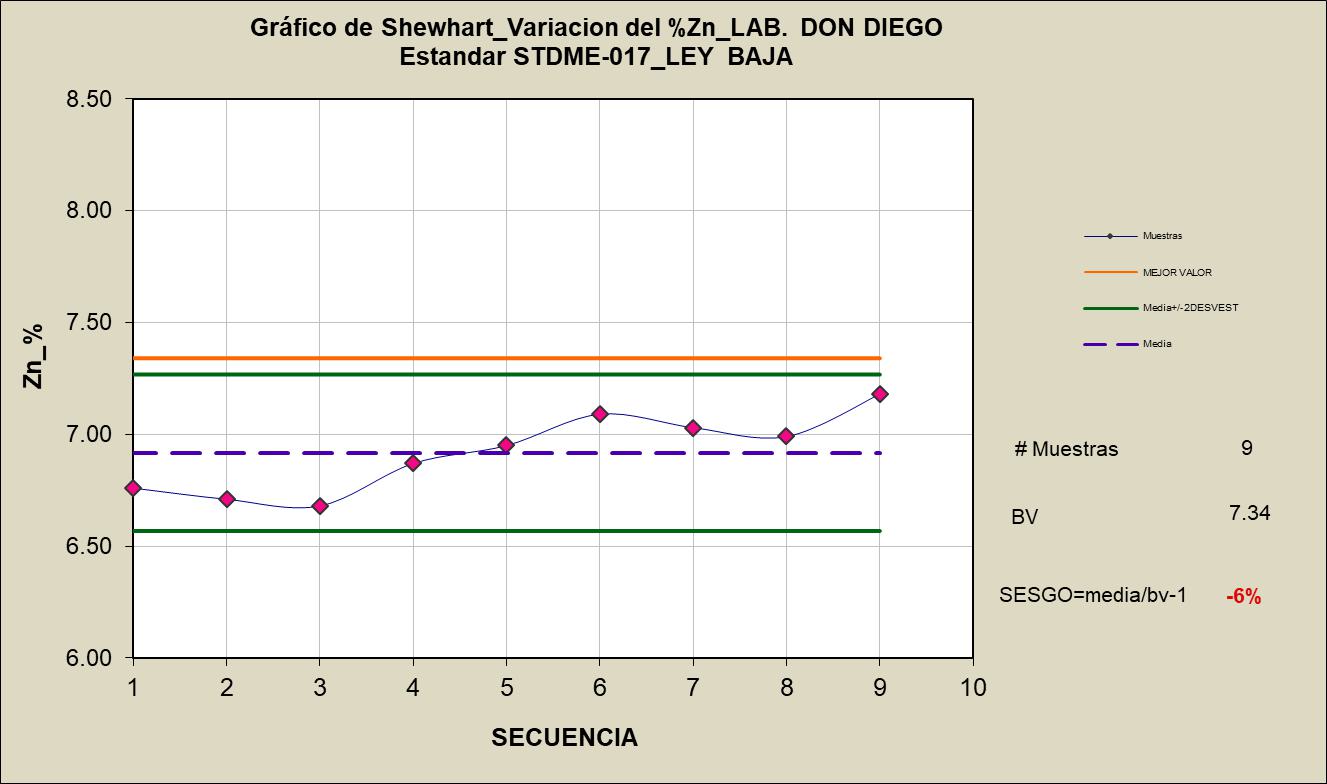
Source: Sinchi Wayra (2024)
Figure 11-15: Plot of Ag g/t Values for Standards ME-1402
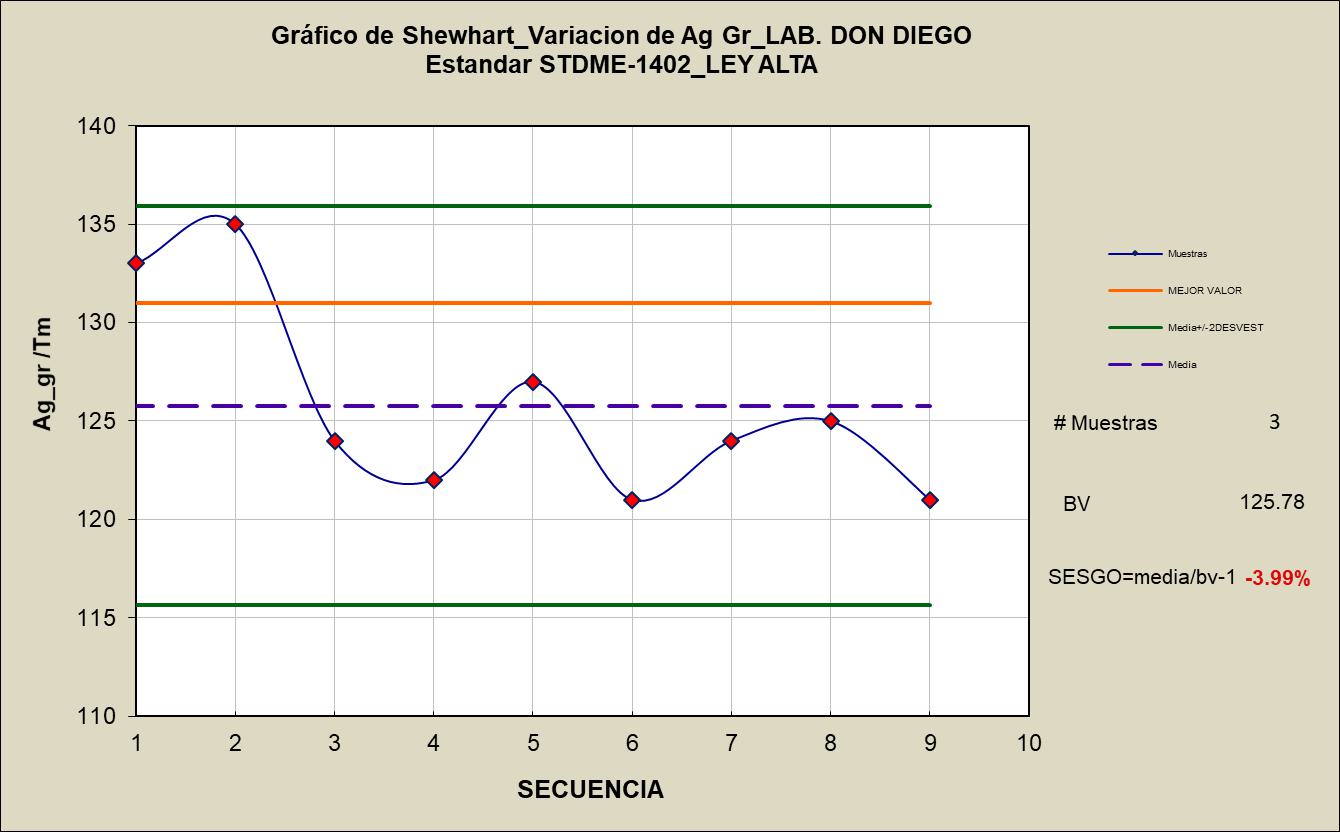
Source: Sinchi Wayra (2024)
| SORACAYA PROJECT | NI 43-101 TECHNICAL REPORT | 11-20 |
| | |
Figure 11-16: Plot of Pb% Values for Standards ME-1402
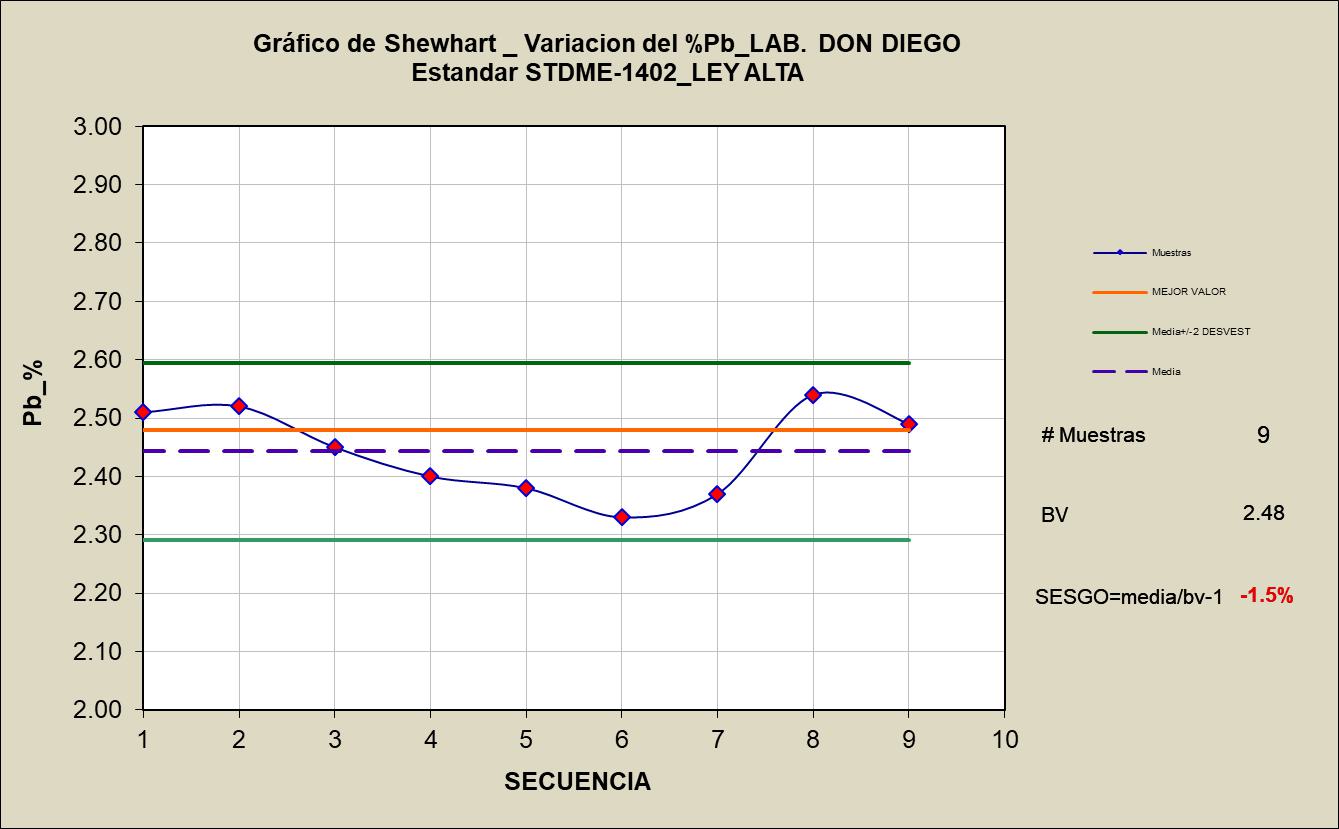
Source: Sinchi Wayra (2024)
Figure 11-17: Plot of Zn% Values for Standards ME-1402
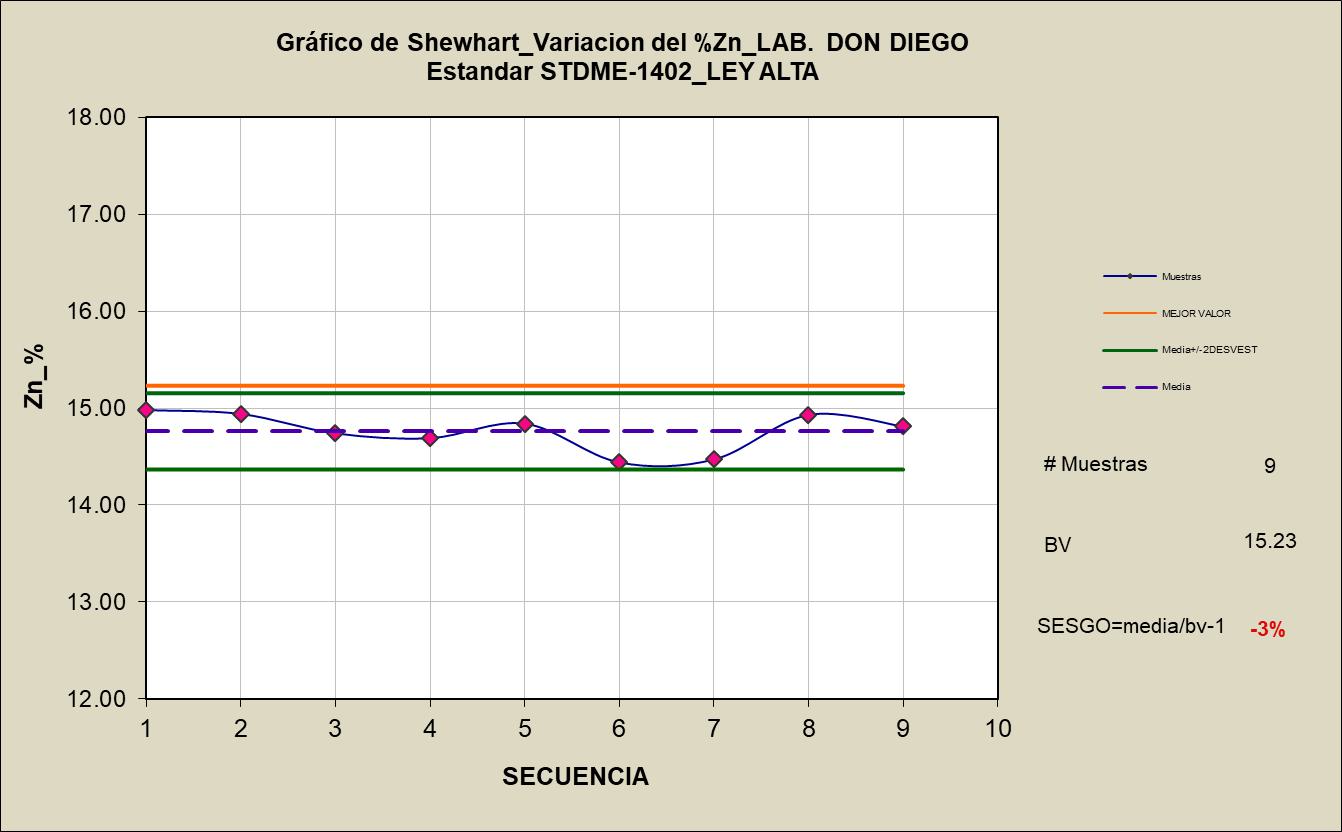
Source: Sinchi Wayra (2024)
| SORACAYA PROJECT | NI 43-101 TECHNICAL REPORT | 11-21 |
| | |
| 11.4.1 | Duplicates |
Precision is a measure of reproducibility which is measured by introducing duplicate samples randomly into the sample stream. At the Soracaya Project, both coarse and pulp duplicates are performed in order to ensure appropriate levels of precision are being attained at the Don Diego Laboratory facilities. Coarse duplicates entail taking a physical split of the sample at the sample collection stage and then including that duplicate blindly into the sample stream. Pulp duplicates entail taking a physical split of the sample at the culmination of the sample preparation stage at the laboratory and re-inserted into the sample stream.
Figure 11-18 through Figure 11-23 shows the comparative results for the original versus duplicate grades for silver, lead and zinc, respectively. Note that a ±10% relative difference threshold is denoted as a red line and the dashed blue line illustrates x/y=1 target line.
Of the 53 coarse duplicate analyses, the results for silver show good results with one warning for a failure rate of 0% as shown in Figure 11-18. Figure 11-19 shows the results for lead where there are nine warnings for a failure rate of 0%. Although the failure rate for lead is zero, there is a very high warning rate of 20%, it is recommended that sampling practices be reviewed to determine whether there may be a reason for potential cross-contamination at the sampling stage or within the laboratory. Figure 11-20 shows three failures and one warning for the zinc coarse duplicates for a failure rate of 6%. It is important to note that there are three silver, nine lead and two zinc samples that have been mislabelled or analysed in error. This should not be occurring at these frequencies, so procedures need review and revision to eradicate the potential for this to happen.
Figure 11-18: Plot of Coarse Reject Duplicates – Ag g/t
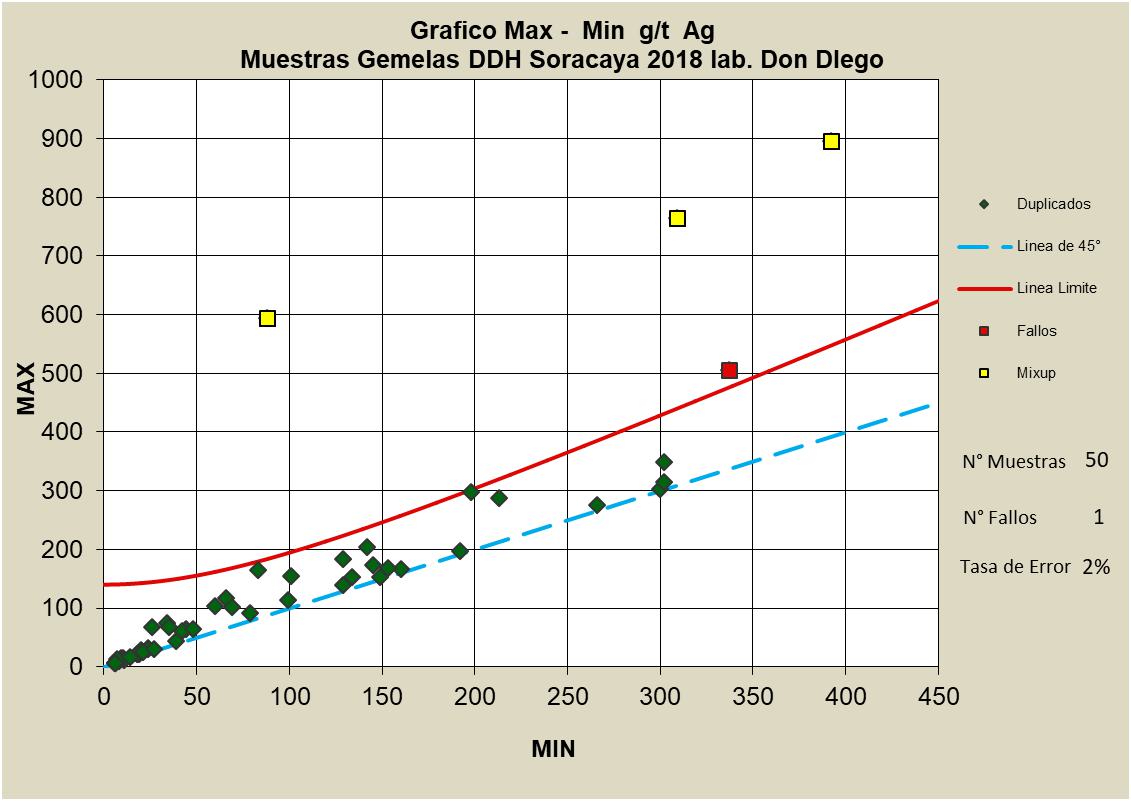
Source: Sinchi Wayra (2024)
| SORACAYA PROJECT | NI 43-101 TECHNICAL REPORT | 11-22 |
| | |
Figure 11-19: Plot of Coarse Reject Duplicates – Pb%
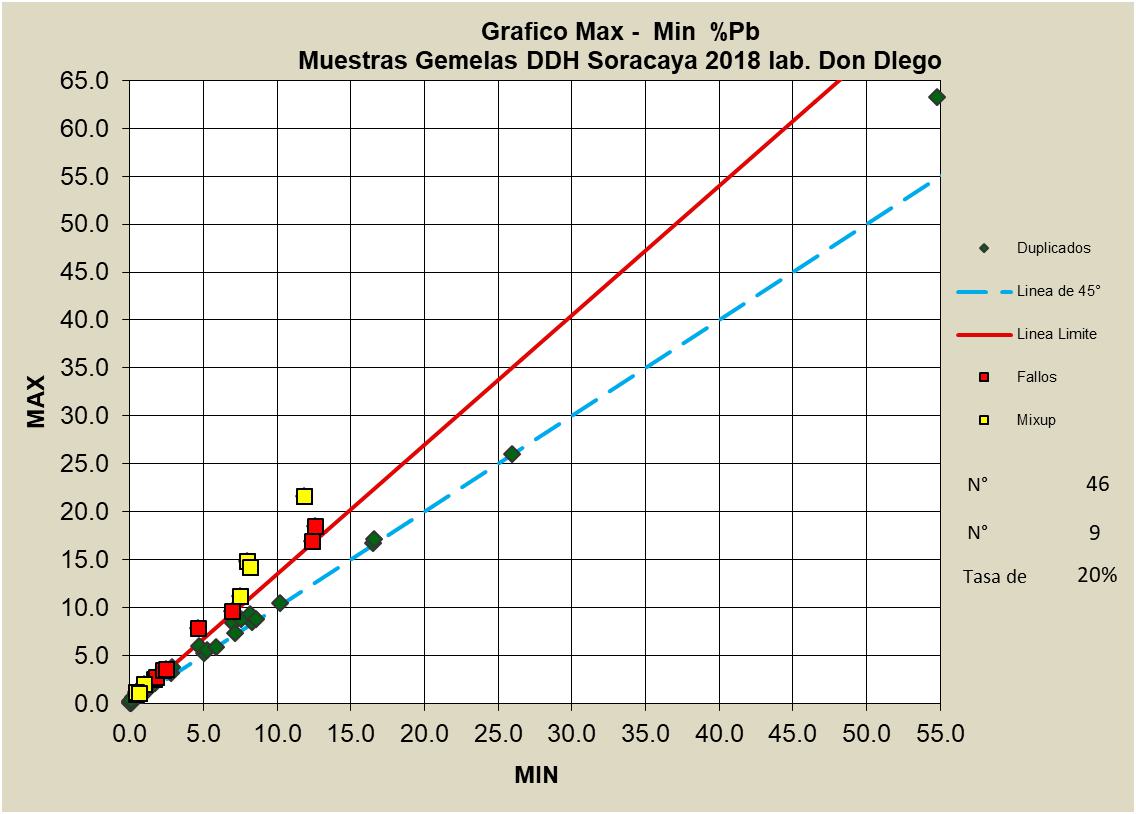
Source: Sinchi Wayra (2024)
Figure 11-20: Plot of Coarse Reject Duplicates – Zn%
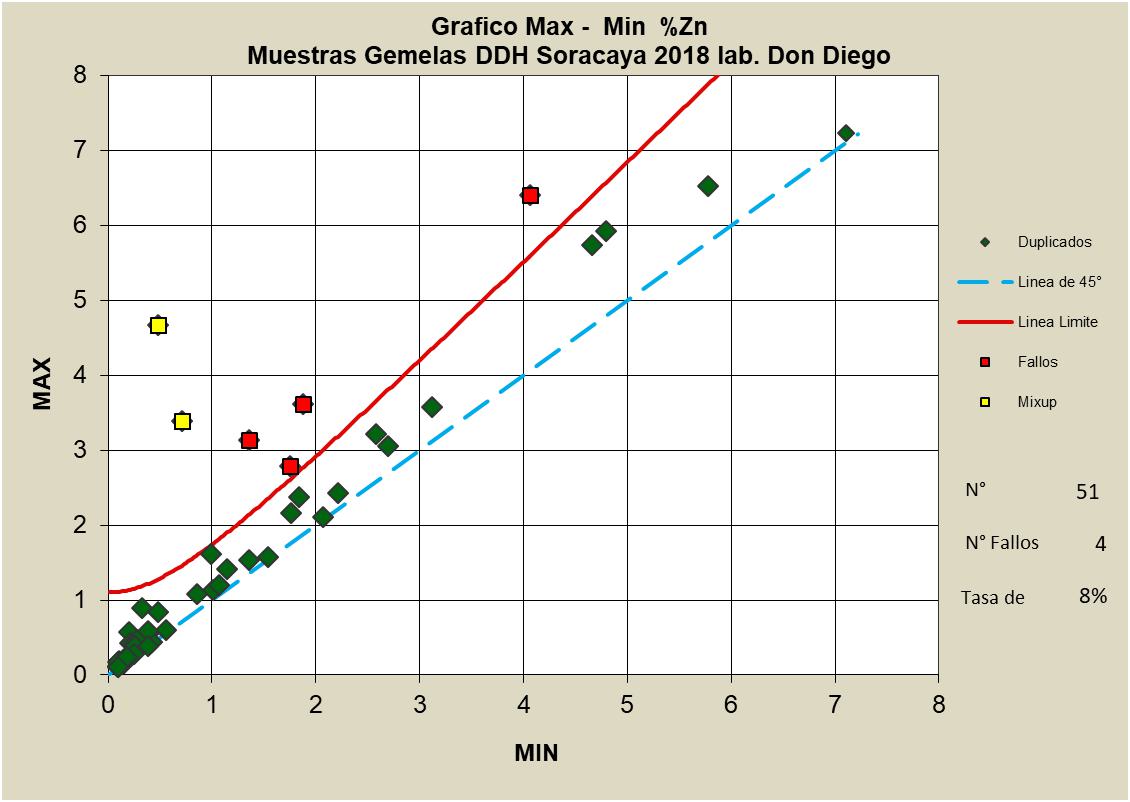
Source: Sinchi Wayra (2024)
| SORACAYA PROJECT | NI 43-101 TECHNICAL REPORT | 11-23 |
| | |
Figure 11-21 through Figure 11-23 shows the comparative results for the original versus duplicate grades for silver, lead and zinc pulp duplicates, respectively. Again, note that a ±10% relative difference threshold is denoted as a red line and the dashed blue line illustrates x/y=1 target line. Of the 54 pulp duplicate analyses, the results for silver show very good results with no failures and one warning for a failure rate of 0% as shown in Figure 11-21. Figure 11-22 and Figure 11-23 shows excellent results for lead where there are no failures and no warnings for a failure rate of 0% and zinc where there is one failure and no warnings for a failure rate of 2%, respectively.
Figure 11-21: Plot of Pulp Duplicates – Ag g/t
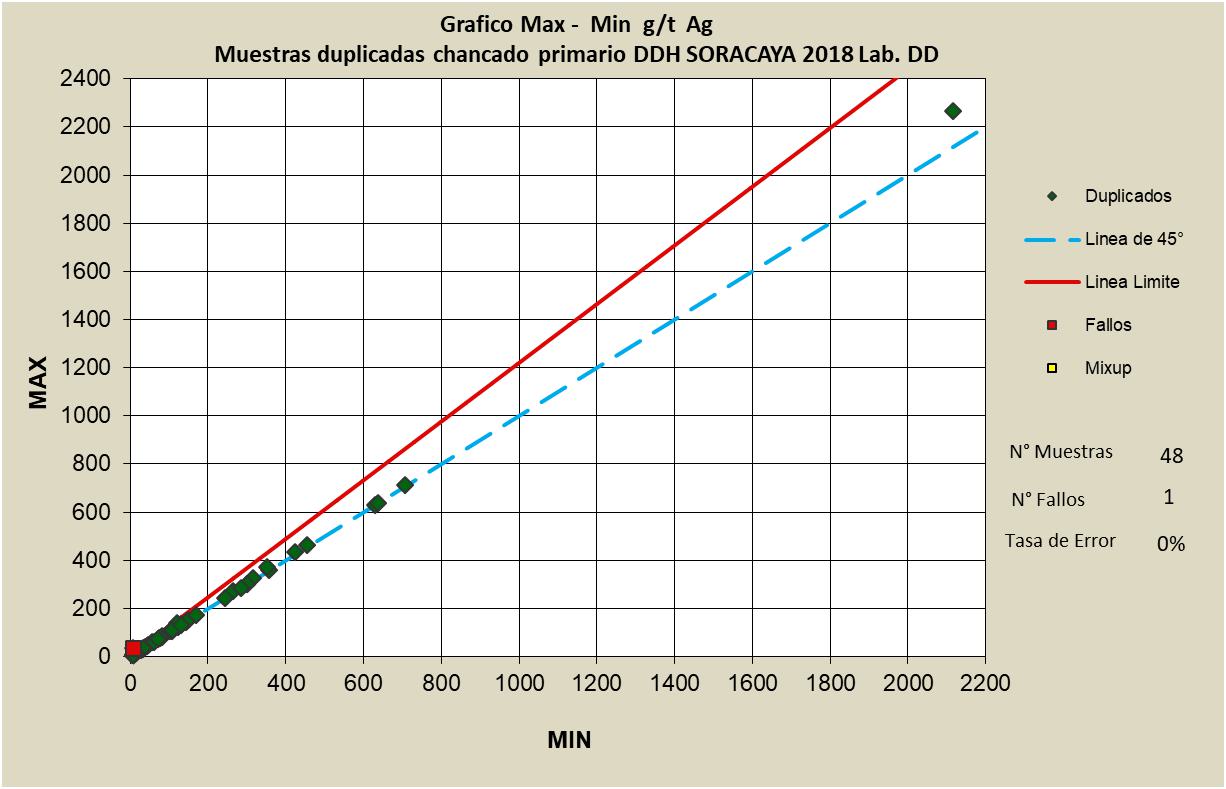
Source: Sinchi Wayra (2024)
| SORACAYA PROJECT | NI 43-101 TECHNICAL REPORT | 11-24 |
| | |
Figure 11-22: Plot of Pulp Duplicates – Pb%
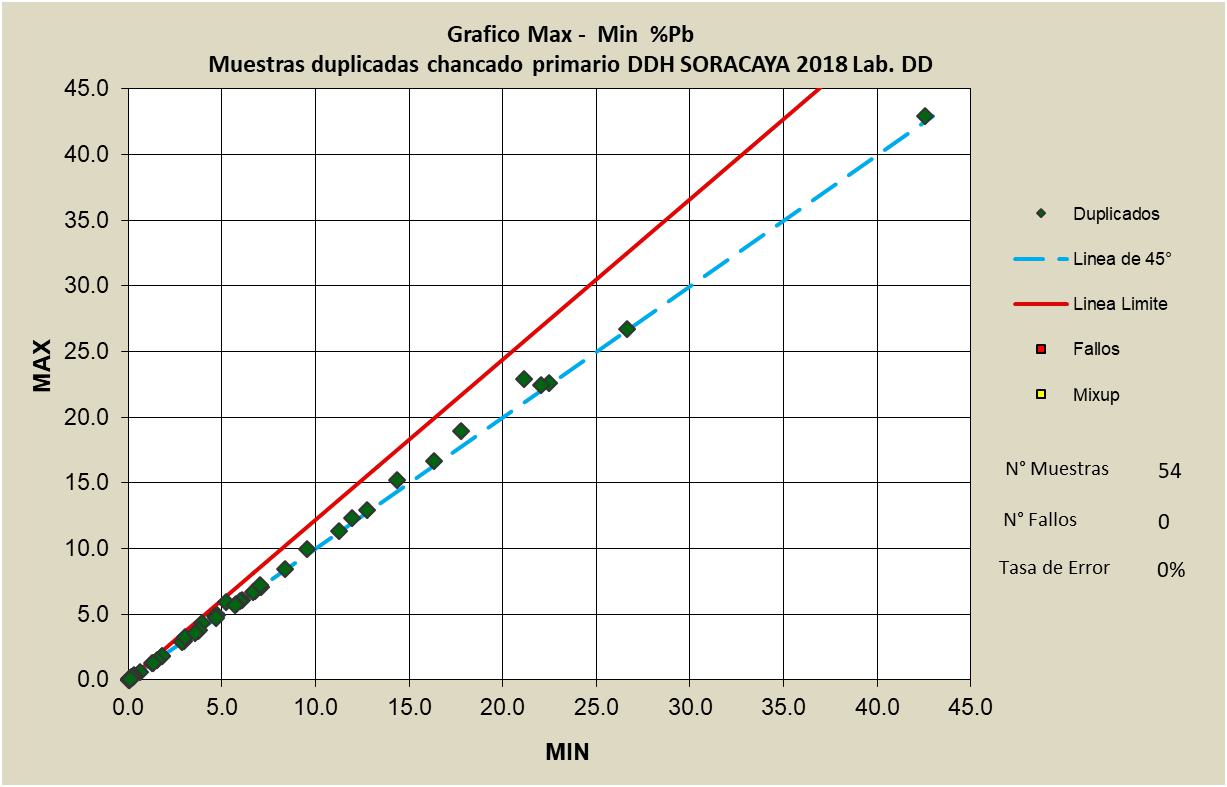
Source: Sinchi Wayra (2024)
Figure 11-23: Plot of Pulp Duplicates – Zn%
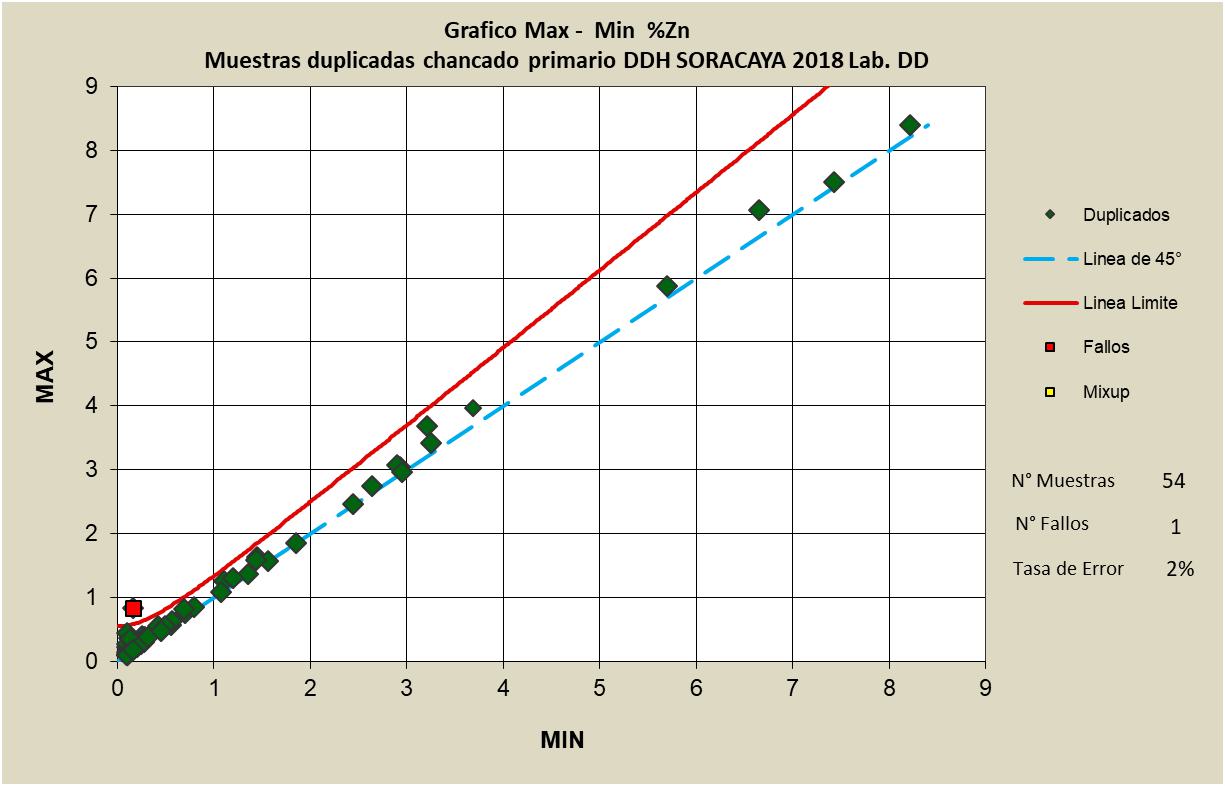
Source: Sinchi Wayra (2024)
| SORACAYA PROJECT | NI 43-101 TECHNICAL REPORT | 11-25 |
| | |
In summary, the quality assurance and quality practices and methods employed are reasonable and produce good results. Recommendations with respect to the QA/QC sample selections that the Company should investigate obtaining Certified Reference Material form an outside accredited source for blanks, particularly barren blanks, and for specific silver, lead, and zinc standards.
The LIMS system is widely used and accepted at the laboratory while interfaces to users are automated and trusted. The system is also highly secure which is critical in ensuring that data is not tampered with or prone to inadvertent error however, this also makes it difficult to access, review and report data externally. In addition, reporting functions are relatively dated and system upgrades should be investigated, and some additional customization would also be desirable.
| 11.5 | QP Statement |
It is the opinion of the QP, Garth Kirkham, P.Geo., that the sampling preparation, security, analytical procedures and quality control protocols used by Santacruz are consistent with generally accepted industry best practices and therefore reliable for the purpose of resource estimation particularly for an inferred resource. However, a full review of the QAQC methods and procedures is recommended going forward.
| SORACAYA PROJECT | NI 43-101 TECHNICAL REPORT | 11-26 |
| | |
| 12 | DATA VERIFICATION |
| 12.1 | Verifications by the Authors of this Technical Report |
The following details the data verification performed by the QPs for the completion of this Technical Report.
A site visit was conducted by the QP, as detailed in Section 2.3 (Table 2-2). The purpose of this visit was to fulfill the requirements specified under NI 43-101 and to familiarize with the property. The site visit consisted of a tour of the surface exposures and trenches which remain open showing mineralized and non- mineralized exposure, sampling review, storage areas and existing infrastructure.
No limitations or failures to conduct data verification were identified by the QPs in the preparation of this Technical Report.
| 12.2 | Geology and Resources |
| 12.2.1 | Site Visit & Verification |
The purpose of these visits is to fulfill the requirements specified under NI 43-101, to gain familiarization with the property, to validate the existence, location, extent and the mineralization and deposits. In addition, the site visits are an important component for verification of all information and data being submitted by the Company for inclusion into the NI 43-101 Technical Report including sample data, geology, QA/QA procedures and mineral resource models and results. These site visits consisted of underground tours of non-mineralized development headings, sampling, storage areas and existing infrastructure. In addition to gathering on-site data and reports, performing interviews, walking through procedures, and investigating areas of discrepancy, the identification and collection of independent verification data such as samples are all critical activities that make up a site visit.
Prior to the site visits, the author reviewed all collected data sources and reports. The primary sources of data for inspection were the drillhole and underground channel sample data, related assay data, QA/QC data and analyses, assay certificates and LIMS databases. In addition, internal Company reports and demonstrations were provided detailing the methods and procedures for sample collection, handling and chain-of-custody, QA/QC procedures and results, and resource estimation methods and reporting.
The QP, Garth Kirkham, P.Geo., visited the property between March 28 through March 30, 2023. The site visit included an inspection of the property, offices, underground operations, core storage facilities, and tours of major centers and surrounding villages most likely to be affected by any potential mining operation.
The site visit performed by the QP to support the Technical Report included a tour of the offices, core logging, and storage facilities which showed clean, well-organized, professional environments. Santacruz geological staff and on-site personnel led the QP through the chain of custody and methods used at each stage of the logging and sampling process. All methods and processes are to common industry standards and common best practices, and no issues were identified. The 2021 site visit also entailed attending all operations including the Bolivar mine, Porco mine and the Caballo Blanco complex which included separate attendance to the Tres Amigos, Colquechaquita and Reserva mines. In addition, the tour included tours through the Don Diego Milling and Processing Complex along with the sample storage facilities.
| SORACAYA PROJECT | NI 43-101 TECHNICAL REPORT | 12-1 |
| | |
The tour of the property showed a clean, well-organized, professional environment. On-site staff led the author through the methods used at each stage of the resource estimation process. All methods and processes are up to industry standards and reflect leading practices, and no issues were identified.
| 12.2.2 | Sample Database Verification |
Verification of the Soracaya drillhole and underground sample assay database was primarily focused on silver, lead and zinc. Sample databases were supplied in Excel™ format and in LeapFrog™. Checks against source data and assay certificates showed agreement. Statistical analyses used to investigate and identify errors were performed and resulted in minor issues. These have been corrected and it is recommended that a continued program of random “spot checking” the database against assay certificates be employed.
| 12.2.3 | Independent Sampling |
The 2023 site visit included a visit of the Don Diego Mill Complex which included a tour of the Don Diego Laboratory which included an extensive review of the methods and procedures along with gathering appropriate documentation for reporting.
Also, during the 2023 site visit, an independent sampling verification plan was implemented with a total of 10 samples collected across from the Bolivar, Porco and Caballo Blanco operations. The Don Diego Laboratory is an NB/ISO/IEC 17025:2018 accredited laboratory which performs all assay analyses for the mining and processing operations for Sinchi Wayra including Soracaya.
In order to ensure reliability of results particularly as the data is being used for resource estimation purposes with this Technical Report, independent verification duplicate samples are sent to an accredited external umpire laboratory. These verification samples were secured and transported to SGS Peru for analysis and comparison. SGS Peru is a well-established certified assay laboratory that possess and maintains ISO 14000 accreditation. Individual samples were placed in plastic bags with a uniquely numbered tag, after which all samples were collectively placed in a larger bag and delivered by independent transport to the SGS laboratory in Lima, Peru for analysis. The selection was a combination of acid digestion and Induced Coupled-Plasma Atomic Emission Spectroscopy (ICP) along with screening and hydroxide precipitation for overlimit values.
A total of 10 samples which were comprised of pulp duplicates were sent for independent analysis as shown in Table 12-1.
Table 12-1: Soracaya Independent Verification Sampling
| Sample# | Ag g/t | Fe % | Pb % | Zn % | Cu % |
| 22283 | 1061 | 1.53 | 2.85 | 0.21 | 0.04 |
| 22352 | 423 | 12.99 | 16.31 | 3.04 | 0.007 |
| 22530 | 300 | 8.47 | 9.28 | 3.12 | 0.01 |
| 22595 | 631 | 7.21 | 26.68 | 0.42 | 0.07 |
| SORACAYA PROJECT | NI 43-101 TECHNICAL REPORT | 12-2 |
| | |
| Sample# | Ag g/t | Fe % | Pb % | Zn % | Cu % |
| 22602 | 213 | 6.19 | 12.34 | 1.88 | 0.026 |
| 22713 | 353 | 4.74 | 14.37 | 2.47 | 0.417 |
| 22832 | 374 | 6.37 | 11.76 | 0.88 | 0.309 |
| 23056 | 331 | 6.07 | 11.82 | 1.1 | 0.941 |
| 23083 | 286 | 6.89 | 9.43 | 0.77 | 0.083 |
| 23243 | 302 | 5.1 | 8.55 | 0.26 | 0.011 |
Source: KGL (2024)
Results of the verification samples are presented in Figure 12-1 through Figure 12-4 for Ag, Pb, Zn and Fe, respectively. In all cases, the correlation between the original source Don Diego assay data and that of the duplicate SGS umpire analyses, are perfect as evidenced by the respective R2 being 1. R2 is a measure of the goodness of fit of a model. In regression, the R2 coefficient of determination is a statistical measure of how well the regression predictions approximate the real data points. An R2 of 1 indicates that the regression predictions perfectly fit the data.
Although, these results are not a complete audit of the laboratory, they do verify that the assay results are suitable for resource estimation purposes.
Figure 12-1: Results of Independent Verification Sampling for Ag g/t
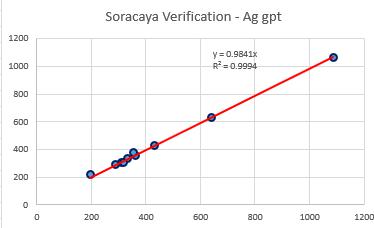
Source: KGL (2024)
| SORACAYA PROJECT | NI 43-101 TECHNICAL REPORT | 12-3 |
| | |
Figure 12-2: Results of Independent Verification Sampling for Pb%
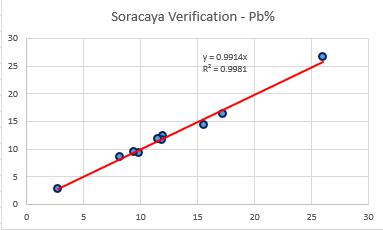
Source: KGL (2024)
Figure 12-3: Results of Independent Verification Sampling for Zn%
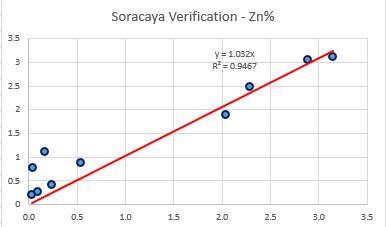
Source: KGL (2024)
| SORACAYA PROJECT | NI 43-101 TECHNICAL REPORT | 12-4 |
| | |
Figure 12-4: Results of Independent Verification Sampling for Fe%
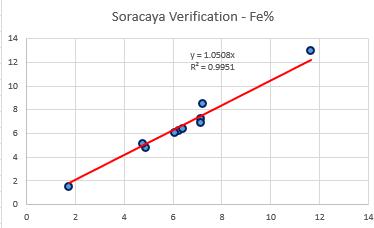
Source: KGL (2024)
Figure 12-5: Results of Independent Verification Sampling for Cu%
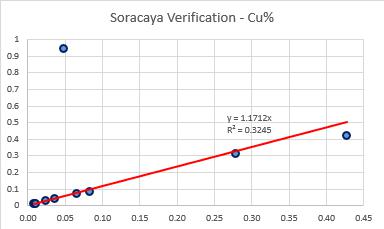
Source: KGL (2024)
| 12.2.4 | Geological Model Verification |
The geological and lithological solid domain models were supplied by Santacruz in both Datamine™ and LeapFrog™ which are both industry-leading software systems. The QP imported the multiple vein domains into a similar system called MineSight™ to verify solids volumes and ensure matching of the solids domains against the drillhole and sample database. Results confirmed location and extent of volumes are appropriate to resource estimation purposes.
| 12.2.5 | Conclusions |
The QP is confident that the data and results are valid based on the site visits and inspection of all aspects of the Project, including the methods and procedures used. It is the opinion of the QP that all work, procedures, and results have adhered to best practices and industry standards as required by NI 43-101.
| SORACAYA PROJECT | NI 43-101 TECHNICAL REPORT | 12-5 |
| | |
| 13 | MINERAL PROCESSING AND METALLURGICAL TESTING |
The metallurgical assessment of the Soracaya deposit is in the early stages. To date there has been a bench scale flotation test and a pilot plant test conducted to produce bulk lead-zinc-silver concentrates. The recovery rates of silver, lead and zinc were evaluated across these different phases to predict the effective recovery.
| 13.1 | Laboratory Bench Scale Testing |
The laboratory bench scale tests provided initial insights into the potential recovery of the Soracaya mineralized material. Due to the limited results available, the data has been analyzed using two methods:
1) calculated rougher recovery based on lab test data and 2) reported recovery rates from the lab tests. It is unclear from the report reviewed if there were multiple tests conducted to determine the optimal reagent dosages and rougher residence time or if the flotation test results are based on a single test of the Soracaya mineralized material.
The flotation test produced a single bulk concentrate containing silver, lead and zinc. It is reasonable that future testwork will include a flotation stage to separate the lead concentrate from the zinc concentrate or will focus on switching the flowsheet to a sequential flotation flowsheet where a lead concentrate is produced (while depressing zinc) and then activating the zinc to produce a zinc concentrate. The flowsheet used in the flotation test can be seen in Figure 13-1.
| SORACAYA PROJECT | NI 43-101 TECHNICAL REPORT | 13-1 |
| | |
Figure 13-1: Lab Flotation Testwork Flowsheet
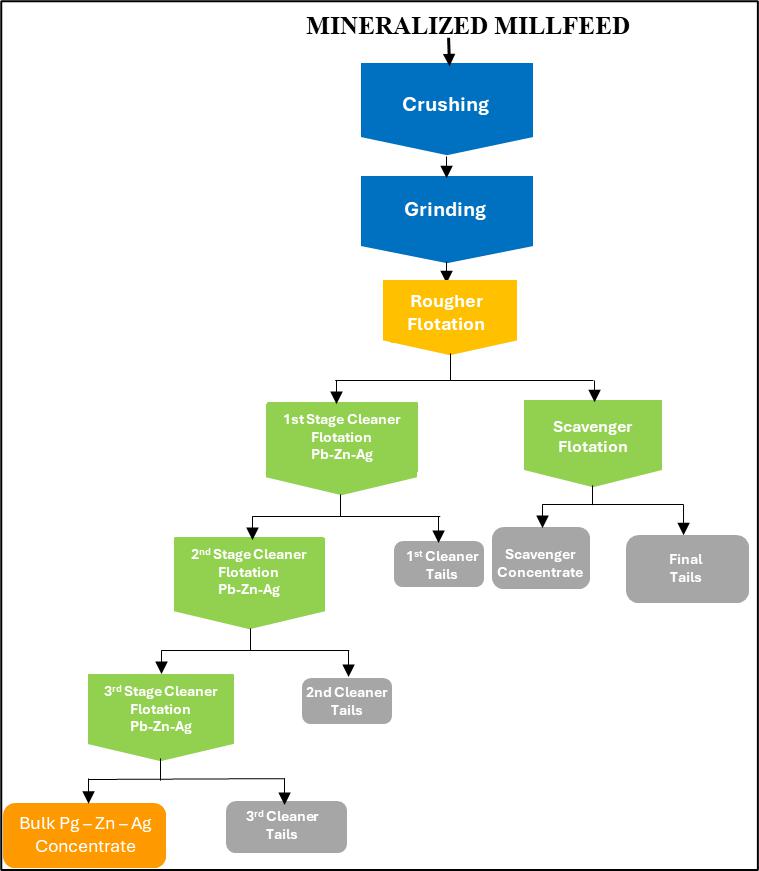
Source: Sinchi Wayra (2024)
The tests were conducted by Laboratorio de Fisica UMSA (UMSA), with the following results:
| ● | Concentrate Mass Pull: ~5.5% | |
| ● | Zinc (Zn): 90.43% | |
| ● | Lead (Pb): 62.41% | |
| ● | Silver (Ag): 86.63% |
The author of this Technical Report has reviewed the calculations and determined a different interpretation of the results, which are summarized in Table 13-1, including calculations of the interim products.
| SORACAYA PROJECT | NI 43-101 TECHNICAL REPORT | 13-2 |
| | |
Table 13-1: Summary of Results from Lab Flotation Test
| Mass | Mass | Assays | Distribution | |||||||
| g | % | Zn % | Pb % | Ag g/t | Fe % | Zn | Pb | Ag | Fe | |
| Rougher Feed | 2000 | 100.0 | 1.29 | 2.72 | 562.9 | 6.41 | 100.00 | 100.00 | 100.00 | 100.00 |
| Rougher Concentrate | 203.72 | 10.2 | 7.1434 | 10.288 | 3159.0 | 8.3705 | 56.57 | 38.60 | 57.16 | 13.30 |
| Rougher Tails | 1796.3 | 89.8 | 0.6221 | 1.8562 | 268.5 | 6.1891 | 43.43 | 61.40 | 42.84 | 86.70 |
| Scavenger Concentrate | 348.51 | 17.4 | 2.50 | 3.71 | 952.0 | 9.55 | 33.87 | 23.81 | 29.47 | 25.96 |
| Scavenger Tailings | 1447.77 | 72.4 | 0.17 | 1.41 | 104.0 | 5.38 | 9.57 | 37.59 | 13.37 | 60.74 |
| 1st Cleaner Concentrate | 83.66 | 4.2 | 12.24 | 16.33 | 5191.0 | 8.83 | 39.81 | 25.15 | 38.57 | 5.76 |
| 1st Cleaner Tails | 120.06 | 6.0 | 3.59 | 6.08 | 1743.0 | 8.05 | 16.75 | 13.44 | 18.59 | 7.54 |
| 2nd Cleaner Concentrate | 44.56 | 2.2 | 17.00 | 21.96 | 7091.6 | 8.86 | 29.45 | 18.02 | 28.07 | 3.08 |
| 2nd Cleaner Tails | 39.1 | 2.0 | 6.82 | 9.91 | 3025.0 | 8.80 | 10.37 | 7.14 | 10.51 | 2.68 |
| 3rd Cleaner Concentrate | 16.24 | 0.8 | 22.06 | 29.96 | 8622.0 | 7.51 | 13.93 | 8.96 | 12.44 | 0.95 |
| 3rd Cleaner Tails | 28.32 | 1.4 | 14.10 | 17.37 | 6214.0 | 9.63 | 15.52 | 9.06 | 15.63 | 2.13 |
Source: Sinchi Wayra (2024)
| SORACAYA PROJECT | NI 43-101 TECHNICAL REPORT | 13-3 |
| | |
The cleaner flotation tests demonstrate that saleable concentrates can be made from the feed and that with sufficient rougher and scavenger flotation effort, it is possible to achieve reasonable recoveries.
The estimated recoveries, when accounting for the scavenger flotation circuit and assuming the final concentrate grade achieved in the flotation test was representative of a plant final concentrate were:
| ● | Concentrate Mass Pull: 5% | |
| ● | Zinc (Zn): 87.46% | |
| ● | Lead (Pb): 50.44% | |
| ● | Silver (Ag): 82.52% |
| 13.2 | Pilot Plant Operations |
Pilot plant testing is typically carried out to prove that a selected flowsheet developed through batch rougher and cleaner testing will work on a larger, representative sample of the typical ore. Prior to pilot plant testing, the laboratory will often run a locked cycle test (LCT) which simulates the recirculating streams found in a plant to check that the flowsheet is stable and that plant recoveries can be predicted. The pilot plant testing on the Soracaya mineralized material appears to have been conducted without an LCT using a similar, but not identical flowsheet to the laboratory work presented in the report.
The pilot plant testing conducted by the metallurgical department of UMSA followed the flowsheet in Figure 13-2.
Figure 13-2: Pilot Plant Testwork Flowsheet
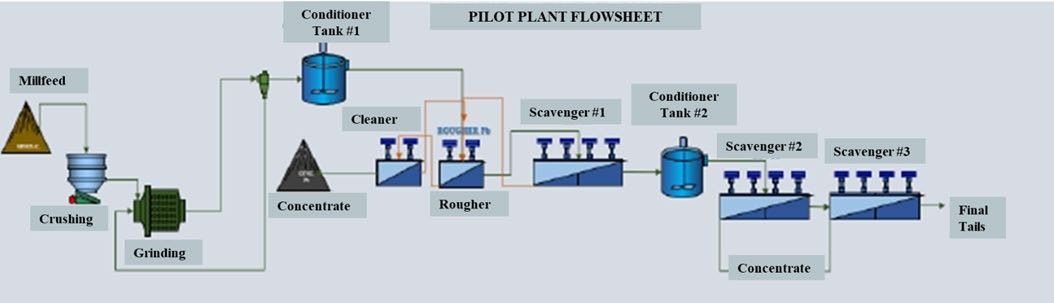
Source: Sinchi Wayra (2024)
The pilot plant confirmed that it is possible to produce a high-grade concentrate while achieving reasonable recoveries The reported recoveries from the pilot plant were:
| ● | Reported Pilot Plant Recovery: |
| ○ | Zinc (Zn): 79.81% | |
| ○ | Lead (Pb): 68.27% | |
| ○ | Silver (Ag): 83.85% |
| SORACAYA PROJECT | NI 43-101 TECHNICAL REPORT | 13-4 |
| | |
| 13.3 | San Vicente Comparative Analysis |
In addition to the internal testing, comparative data from the San Vicente mine was examined to gauge the recovery performance against an external benchmark. The San Vicente mill uses a sequential flotation flowsheet rather than the bulk/differential flowsheet that has been conducted on the Soracaya samples.
Although, the San Vicente mine is located close to the Soracaya deposit, there are substantial differences in the feed grade with the zinc feed grade being approximately double and the lead feed grade approximately half that of Soracaya.
| ● | San Vicente Recovery Rates: |
| ○ | Zinc (Zn): 76.3% | |
| ○ | Lead (Pb): 79.433% | |
| ○ | Silver (Ag): 91.4% |
| 13.4 | Recovery Recommendation |
Based on the test data and comparison to San Vicente results, the following recovery factors are assumed as shown in Table 13-2.
Table 13-2: Recovery Factors
| Recovery | |||
| Report | Zn | Pb | Ag |
| Calculated Lab Test Rougher Recovery | 87.46 | 50.44 | 82.52 |
| Lab Test (Reported) | 90.43 | 62.41 | 86.63 |
| Pilot Plant (Reported) | 79.81 | 68.27 | 83.85 |
| San Vicente | 76.3 | 79.43 | 91.4 |
| Recovery Recommendation | 85 | 65 | 85 |
Source: Sinchi Wayra (2024)
| SORACAYA PROJECT | NI 43-101 TECHNICAL REPORT | 13-5 |
| | |
| 14 | MINERAL RESOURCE ESTIMATES |
| 14.1 | Introduction |
The purpose of this Technical Report is to document the resource estimations for the Soracaya deposit. This section describes the work undertaken by KGL, including key assumptions and parameters used to prepare the mineral resource models for Soracaya which herein to be reporting using zinc-equivalent (ZnEq) cut-offs based upon updated commodity pricing and actual operating costs.
In addition, this Technical Report serves as a first-time disclosure for mineral resources for the Soracaya deposit, together with appropriate commentary regarding the merits and possible limitations of such assumptions.
| 14.2 | Data |
The database included 95 drillholes and 79 underground channel samples which were supplied in electronic format by Santacruz. This included collars, downhole surveys, lithology data and assay data (i.e., Ag g/t, Pb%, Zn%, Fe%). Validation and verification checks were performed during importation of data to ensure there were no overlapping intervals, typographic errors or anomalous entries. Anomalies and errors were validated and corrected. Figure 14-1 shows a plan view of the supplied drillholes and underground channel samples.
Figure 14-1: Plan View of Soracaya Drillholes
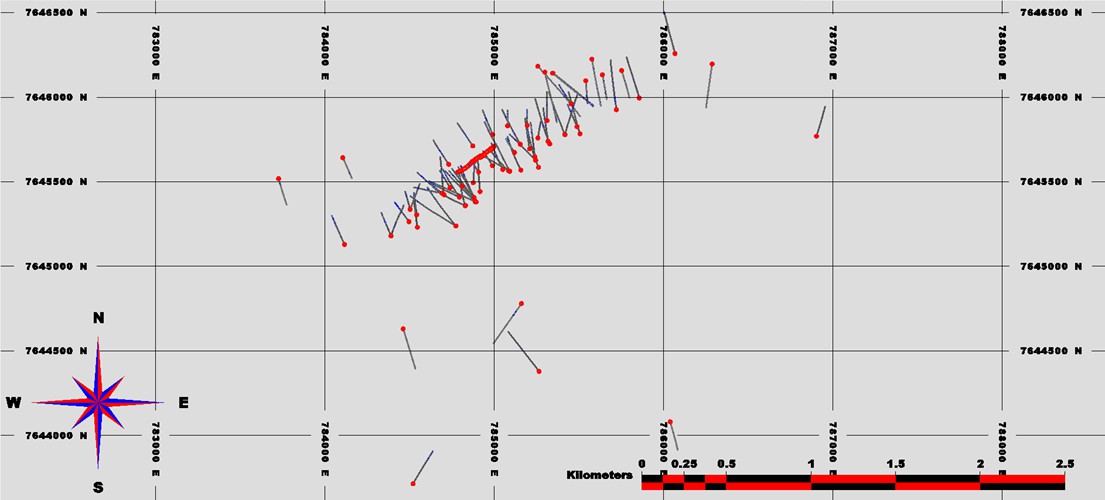
Source: KGL (2024)
| SORACAYA PROJECT | NI 43-101 TECHNICAL REPORT | 14-1 |
| |
| 14.3 | Geology Model |
Solid models (Figure 14-2, Figure 14-3 and Figure 14-4) were created from sections and based on a combination of lithology, grades and site knowledge. It is important to note that the Soracaya Project consists of very uniform and consistent veins which provides a relatively good level of confidence with respect to location, orientation and dimensions of the modelled geological domains. Of the 95 drillholes, 85 of them intersect the veins while 10 drillholes do not.
Figure 14-2: Plan View of Soracaya Mineralized Zones and Drillholes
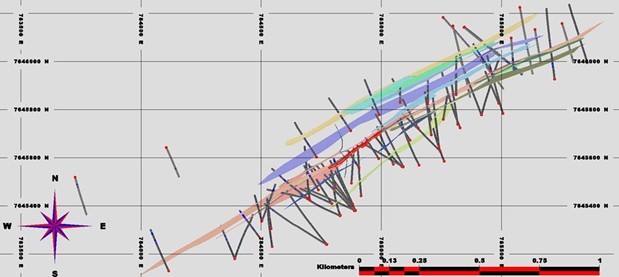
Source: KGL (2024)
Figure 14-3: Section View of Soracaya Mineralized Zones and Drillholes Looking Southwest with Topography
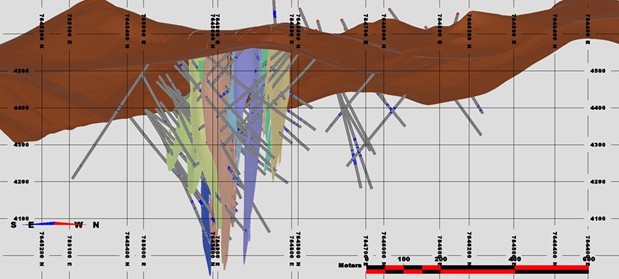
Source: KGL (2024)
| SORACAYA PROJECT | NI 43-101 TECHNICAL REPORT | 14-2 |
| |
Figure 14-4: Long Section View of Soracaya Mineralized Zones and Drillholes Looking Northwest
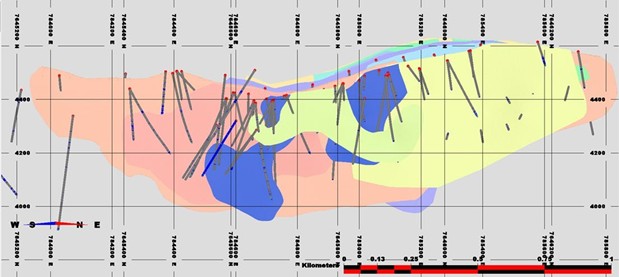
Source: KGL (2024)
All zones were modelled based on current drilling and assay data using LeapFrog™ and then imported into MineSight™ for interpretation and refinement. Every intersection was inspected, and the solid was then manually adjusted to match the drill intercepts. Once the solid model was created, it was used to code the drillhole assays and composites for subsequent statistical and geostatistical analysis. The solid zones were used to constrain the block model by matching assays to those within the zones. The orientation and ranges (distances) used for search ellipsoids in the estimation process were derived from strike and dip of the mineralized zone, site knowledge and on-site observations.
| 14.4 | Data Analysis |
Each of the veins within the Soracaya deposit is identified and individually coded as shown in Table 14-1 which are used throughout the estimation process.
Table 14-1: Vein Codes and Descriptions for the Soracaya Deposit
| Vein Code | Vein Name |
| 1 | A1 |
| 2 | A2 |
| 3 | A3 |
| 4 | A4 |
| 5 | A5 |
| 6 | A5 |
| 7 | A6 |
| 11 | B1 |
| 12 | ES2 |
| 13 | España |
| SORACAYA PROJECT | NI 43-101 TECHNICAL REPORT | 14-3 |
| |
| Vein Code | Vein Name |
| 14 | Esperanza |
| 15 | Ramo 1 |
| 16 | Ramo 2 |
| 17 | SOR1 |
Source: KGL (2024)
The database was then numerically coded using these individual mineralized solids. The database was then inspected and manually adjusted, drillhole by drillhole, to ensure accuracy of zonal intercepts. Table 14-2 shows the statistics for the silver, lead and zinc assays.
Note that all the vein domains possess a relatively low degree of variability which is evidenced by the low Coefficient of Variation (CV) which is a unit independent quantitative measure of variability. With CVs being quite low at values of <2 with only the Ag for A6, Cu for Esperansa, and the Ag and Cu for Esperanza Ramo 1 having CVs >2. However, the Soracaya deposit has extremely high Ag grades and although not demonstrating high levels of variability, with grades up to 18.53% Zn, 9.14% Cu, 47.94% Pb and 15,397 g/t Ag, it is prudent to ensure that extremely high grades do not unduly over-influence the resource as a whole. So, the goal of compositing and grade cutting will be to temper the effect of extreme grades so as not to spread or smear beyond reasonable distances.
Table 14-2: Statistics Silver, Lead and Zinc for the Soracaya Deposit by Vein
| CODE | # | Length (m) | Min | Max | Mean | SD | CV | |
Ag |
1 | 33 | 20.58 | 4 | 921 | 165 | 218 | 1.3 |
| 2 | 20 | 13.89 | 9 | 619 | 138 | 161 | 1.2 | |
| 3 | 18 | 10.51 | 10 | 338 | 120 | 88 | 0.7 | |
| 4 | 7 | 5.38 | 28 | 145 | 59 | 39 | 0.7 | |
| 5 | 8 | 4.97 | 8 | 471 | 202 | 180 | 0.9 | |
| 6 | 15 | 10.69 | 7 | 15,397 | 710 | 2,527 | 3.6 | |
| 7 | 7 | 6.8 | 6 | 558 | 231 | 251 | 1.1 | |
| 11 | 8 | 3.55 | 10 | 1,450 | 175 | 257 | 1.5 | |
| 12 | 34 | 24.63 | 4 | 570 | 110 | 121 | 1.1 | |
| 13 | 13 | 10.16 | 28 | 315 | 89 | 71 | 0.8 | |
| 14 | 207 | 162.23 | 7 | 3,291 | 317 | 452 | 1.4 | |
| 15 | 76 | 57.17 | 4 | 7,275 | 335 | 749 | 2.2 | |
| 16 | 36 | 24.07 | 22 | 962 | 197 | 223 | 1.1 | |
| 17 | 27 | 26.68 | 4 | 964 | 218 | 255 | 1.2 | |
| Total | 510 | 382.26 | 4 | 15,397 | 268 | 614 | 2.3 | |
| All | 3,283 | 2,672.38 | 0 | 15,397 | 54 | 251 | 4.7 | |
Pb% |
1 | 33 | 20.58 | 0.21 | 26.68 | 4.71 | 5.89 | 1.3 |
| 2 | 20 | 13.89 | 0.04 | 14.30 | 4.38 | 4.58 | 1.0 | |
| 3 | 18 | 10.51 | 0.2 | 14.56 | 4.84 | 3.56 | 0.7 | |
| 4 | 7 | 5.38 | 0.17 | 7.95 | 3.56 | 2.32 | 0.7 |
| SORACAYA PROJECT | NI 43-101 TECHNICAL REPORT | 14-4 |
| |
| CODE | # | Length (m) | Min | Max | Mean | SD | CV | |
| 5 | 8 | 4.97 | 0.16 | 29.18 | 9.62 | 9.91 | 1.0 | |
| 6 | 15 | 10.69 | 0.04 | 32.23 | 4.29 | 5.99 | 1.4 | |
| 7 | 7 | 6.8 | 0.08 | 7.68 | 4.28 | 2.94 | 0.7 | |
| 11 | 8 | 3.55 | 0.32 | 19.96 | 3.57 | 4.75 | 1.3 | |
| 12 | 34 | 24.63 | 0.01 | 26.00 | 5.40 | 5.00 | 0.9 | |
| 13 | 13 | 10.16 | 0.16 | 16.71 | 3.58 | 3.75 | 1.0 | |
| 14 | 207 | 162.23 | 0.04 | 38.48 | 4.35 | 5.41 | 1.2 | |
| 15 | 76 | 57.17 | 0.02 | 30.19 | 5.27 | 7.19 | 1.4 | |
| 16 | 36 | 24.07 | 0.14 | 29.60 | 6.20 | 6.88 | 1.1 | |
| 17 | 27 | 26.68 | 0.03 | 47.49 | 9.77 | 13.50 | 1.4 | |
| Total | 510 | 382.26 | 0.01 | 47.49 | 5.10 | 6.77 | 1.3 | |
| All | 3,287 | 2,676.38 | 0 | 54.78 | 1.20 | 3.30 | 2.7 | |
Zn% |
1 | 33 | 20.58 | 0.04 | 8.87 | 1.67 | 1.73 | 1.0 |
| 2 | 20 | 13.89 | 0.06 | 3.11 | 0.59 | 0.90 | 1.5 | |
| 3 | 18 | 10.51 | 0.06 | 4.71 | 0.87 | 1.14 | 1.3 | |
| 4 | 7 | 5.38 | 0.05 | 0.48 | 0.24 | 0.12 | 0.5 | |
| 5 | 8 | 4.97 | 0.3 | 3.62 | 0.96 | 1.08 | 1.1 | |
| 6 | 15 | 10.69 | 0.01 | 3.10 | 0.47 | 0.85 | 1.8 | |
| 7 | 7 | 6.8 | 0.14 | 3.97 | 1.26 | 1.12 | 0.9 | |
| 11 | 8 | 3.55 | 0.14 | 5.94 | 1.39 | 1.78 | 1.3 | |
| 12 | 34 | 24.63 | 0.03 | 4.81 | 0.72 | 1.01 | 1.4 | |
| 13 | 13 | 10.16 | 0.05 | 2.64 | 0.57 | 0.69 | 1.2 | |
| 14 | 207 | 162.23 | 0.02 | 18.03 | 1.36 | 2.17 | 1.6 | |
| 15 | 76 | 57.17 | 0.01 | 11.05 | 1.16 | 2.01 | 1.7 | |
| 16 | 36 | 24.07 | 0.02 | 18.53 | 1.24 | 2.38 | 1.9 | |
| 17 | 27 | 26.68 | 0.05 | 7.62 | 1.59 | 1.67 | 1.0 | |
| Total | 510 | 382.26 | 0.01 | 18.53 | 1.20 | 1.91 | 1.6 | |
| All | 3,297 | 2,686.38 | 0 | 27.80 | 0.39 | 0.93 | 2.4 | |
Cu% |
1 | 19 | 9.88 | 0 | 0.75 | 0.09 | 0.21 | 2.5 |
| 2 | 6 | 2.02 | 0.006 | 0.13 | 0.05 | 0.05 | 0.8 | |
| 3 | 8 | 3.58 | 0.006 | 0.18 | 0.03 | 0.04 | 1.4 | |
| 4 | 3 | 2.46 | 0.005 | 0.01 | 0.01 | 0.00 | 0.2 | |
| 5 | 3 | 1.31 | 0.006 | 0.04 | 0.02 | 0.02 | 0.8 | |
| 6 | 9 | 6.68 | 0.001 | 0.83 | 0.20 | 0.30 | 1.6 | |
| 7 | 4 | 3.01 | 0.001 | 0.02 | 0.01 | 0.01 | 1.1 | |
| 11 | 4 | 1.55 | 0.005 | 0.02 | 0.01 | 0.01 | 0.7 | |
| 12 | 22 | 14.87 | 0.001 | 1.04 | 0.22 | 0.38 | 1.7 | |
| 13 | 7 | 5.39 | 0.004 | 0.04 | 0.02 | 0.01 | 0.6 |
| SORACAYA PROJECT | NI 43-101 TECHNICAL REPORT | 14-5 |
| |
| CODE | # | Length (m) | Min | Max | Mean | SD | CV | |
| 14 | 81 | 54.88 | 0.001 | 9.14 | 0.19 | 0.74 | 3.9 | |
| 15 | 18 | 8.96 | 0.001 | 1.59 | 0.11 | 0.34 | 3.1 | |
| 16 | 15 | 7.14 | 0.008 | 0.10 | 0.03 | 0.03 | 0.8 | |
| 17 | 16 | 16.1 | 0.002 | 0.29 | 0.04 | 0.06 | 1.5 | |
| Total | 215 | 137.83 | 0 | 9.14 | 0.13 | 0.50 | 3.8 | |
| All | 1,448 | 1,062.93 | 0 | 12.70 | 0.07 | 0.33 | 5.0 |
Source: KGL (2024)
Additionally, iron statistics show very low CV values throughout with an overall value of 0.6 as shown in Table 14-3. Although the iron is not considered economic contributors at this time, it may prove important in the future from a geo-metallurgical perspective.
Table 14-3: Iron Statistics for the Soracaya Deposit by Vein
| CODE | # | Length (m) | Min | Max | Mean | SD | CV | |
Fe% |
1 | 19 | 9.88 | 2.23 | 18.10 | 5.57 | 2.98 | 0.5 |
| 2 | 6 | 2.02 | 4.72 | 16.21 | 7.43 | 3.39 | 0.5 | |
| 3 | 8 | 3.58 | 2.16 | 13.10 | 8.11 | 3.79 | 0.5 | |
| 4 | 3 | 2.46 | 1.68 | 3.15 | 2.54 | 0.62 | 0.2 | |
| 5 | 3 | 1.31 | 1.31 | 10.13 | 6.09 | 4.39 | 0.7 | |
| 6 | 9 | 6.68 | 1.11 | 17.00 | 5.81 | 4.71 | 0.8 | |
| 7 | 4 | 3.01 | 5.22 | 6.61 | 5.69 | 0.45 | 0.1 | |
| 11 | 4 | 1.55 | 4.87 | 12.99 | 7.73 | 2.34 | 0.3 | |
| 12 | 22 | 14.87 | 4.62 | 18.13 | 9.03 | 2.98 | 0.3 | |
| 13 | 7 | 5.39 | 3.75 | 16.91 | 6.72 | 3.78 | 0.6 | |
| 14 | 81 | 54.88 | 1.09 | 22.81 | 5.76 | 3.72 | 0.6 | |
| 15 | 18 | 8.96 | 1.87 | 10.95 | 5.51 | 2.49 | 0.5 | |
| 16 | 15 | 7.14 | 3.3 | 17.25 | 6.32 | 2.13 | 0.3 | |
| 17 | 16 | 16.1 | 0.88 | 13.98 | 3.73 | 3.60 | 1.0 | |
| Total | 215 | 137.83 | 0.88 | 22.81 | 5.97 | 3.71 | 0.6 | |
| All | 1,448 | 1,062.93 | 0.32 | 39.70 | 7.07 | 4.87 | 0.7 |
Source: KGL (2024)
| SORACAYA PROJECT | NI 43-101 TECHNICAL REPORT | 14-6 |
| |
Table 14-4 shows the statistical analysis of assay interval lengths shows that the average sample length is 0.75 m with the median (or the value where 50% of the data is above and below) being 0.72 m. Therefore, the data is not skewed meaning that the sample lengths are relatively consistent. Figure 14-5 also illustrates this negative skewness and also illustrates that the assay lengths are predominately <1 m in length with 8% of all vein samples being >1 m.
Table 14-4: Statistics Assay Interval Lengths for the Soracaya Deposit by Vein
| CODE | # | Length (m) | Min | Max | Mean | SD | Median | CV | |
AI |
1 | 33 | 0 | 0.11 | 1.16 | 0.62 | 0.28 | 0.63 | 0.4 |
| 2 | 20 | 0 | 0.06 | 1.00 | 0.70 | 0.30 | 0.77 | 0.4 | |
| 3 | 18 | 0 | 0.05 | 1.00 | 0.58 | 0.28 | 0.65 | 0.5 | |
| 4 | 7 | 0 | 0.26 | 1.23 | 0.77 | 0.32 | 0.76 | 0.4 | |
| 5 | 8 | 0 | 0.17 | 0.77 | 0.62 | 0.20 | 0.67 | 0.3 | |
| 6 | 15 | 0 | 0.3 | 1.80 | 0.71 | 0.39 | 0.6 | 0.5 | |
| 7 | 7 | 0 | 0.47 | 2.50 | 0.97 | 0.73 | 0.77 | 0.7 | |
| 11 | 8 | 0 | 0.09 | 0.79 | 0.44 | 0.23 | 0.50 | 0.5 | |
| 12 | 34 | 0 | 0.04 | 1.50 | 0.72 | 0.35 | 0.76 | 0.5 | |
| 13 | 13 | 0 | 0.17 | 1.52 | 0.78 | 0.39 | 0.72 | 0.5 | |
| 14 | 207 | 0 | 0.14 | 2.50 | 0.78 | 0.41 | 0.78 | 0.5 | |
| 15 | 76 | 0 | 0.01 | 2.68 | 0.75 | 0.38 | 0.73 | 0.5 | |
| 16 | 36 | 0 | 0.07 | 2.00 | 0.67 | 0.46 | 0.52 | 0.7 | |
| 17 | 27 | 0 | 0.16 | 3.00 | 0.99 | 0.77 | 0.96 | 0.8 | |
| Total | 510 | 0 | 0.01 | 3.00 | 0.75 | 0.42 | 0.72 | 0.6 | |
| All | 4,873 | 0 | 0.01 | 326.70 | 6.08 | 13.88 | 1.00 | 2.3 |
Source: KGL (2024)
Figure 14-5: Assay Interval Lengths
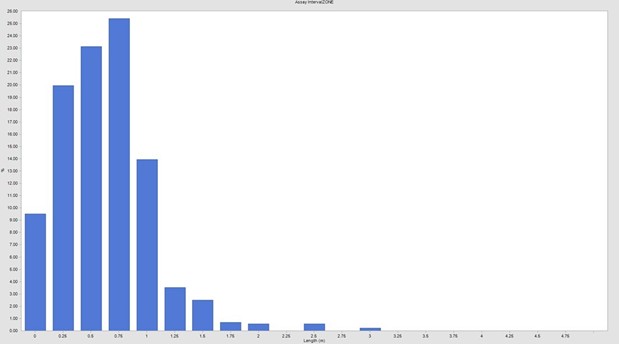
Source: KGL (2024)
| SORACAYA PROJECT | NI 43-101 TECHNICAL REPORT | 14-7 |
| |
A significant concern related to having very small sample widths is the potential for bias due to selectively sampled or high grading. Figure 14-6 shows the distribution of silver values compared with sample lengths where there are small number of very high grades that coincide with small intervals although the distribution is not overly biased although there are two extreme grades > 7,000 g/t Ag at assay intervals lengths of 0.3 m and 0.4 m, respectively. However, compositing to larger intervals will understandably smooth out or dilute the effect of these very high grades and an effective outlier strategy that reduces the extreme effects is also warranted even though variabilities remain low.
Figure 14-6: Assay Interval Length vs. Silver Grades
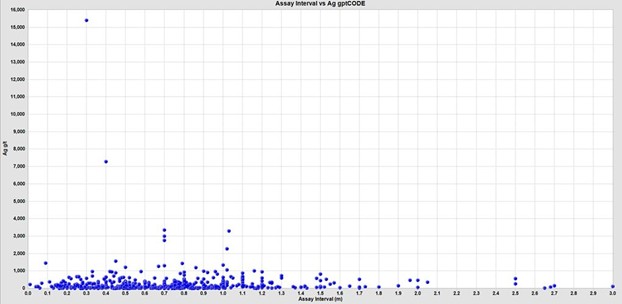
Source: KGL (2024)
| 14.5 | Composites |
It was determined that a 1.0 m composite length offered the best balance between supplying common support for samples and minimizing the smoothing of the grades with ~90% of the samples within the mineralized zones being <1 m in length. The 1.0 m sample length also was consistent with the distribution of sample lengths within the mineralized domains as shown in the histogram of assay lengths.
Note that the composite data was not declustered however analysis shows that there are variations in the mean grades between native and declustered composites. The drillhole data is widely distributed and not grouped into specific clusters however the channel sample data is very tightly spaced in comparison to the drillhole data. The underground channel samples also should have limited influence near and adjacent to the underground workings however if they are treated similarly to the drillhole data, they will create a significant bias by weighting the underground samples and overwhelm the drillhole sample data. Therefore, the underground channel sample data requires declusting while the drillhole data does not to ensure appropriate sample support. Figure 14-7 shows the 79 underground channel samples supplied. Declustering was performed manually, as shown in Figure 14-8 resulting in 19 underground channel samples that are utilized for statistical analysis and use for the mineral resource estimate.
| SORACAYA PROJECT | NI 43-101 TECHNICAL REPORT | 14-8 |
| |
Figure 14-7: Long Section View of the Underground Channel Samples
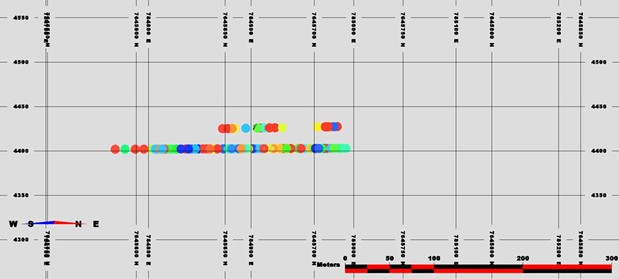
Source: KGL (2024)
Figure 14-8: Long Section of the Manually Declustered Underground Channel Samples
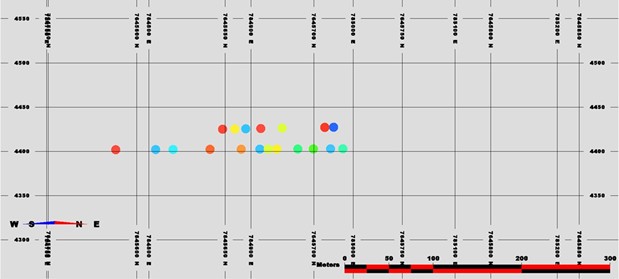
Source: KGL (2024)
Table 14-5 shows the basic statistics for the 1.0 m Ag, Pb, Zn and Cu composite grades within the mineralized vein domains. It should be noted that although 1.0 m is the composite length, any residual composites of lengths greater than 0.5 m were retained to represent a composite, while any composite residuals less than 0.5 m were combined with the previous composite. It is important to note that compositing has proven effective in tempering the effect of high grade outliers as the CVs have been tamed, bringing them consistently below 2.0 with the exception of the Cu values for the Esperansa and Esperanza Ramo 1 veins. Although effective, it is prudent to perform outlier analyses to determine whether additional measures are warranted.
| SORACAYA PROJECT | NI 43-101 TECHNICAL REPORT | 14-9 |
| |
Table 14-5: Composite Statistics for the Soracaya Deposit by Vein
| Zone | # | Length (m) | Min | Max | Mean | SD | CV | |
Ag |
1 | 28 | 20.58 | 4 | 921 | 165 | 213 | 1.3 |
| 2 | 15 | 13.89 | 25 | 375 | 138 | 110 | 0.8 | |
| 3 | 17 | 10.51 | 10 | 338 | 120 | 87 | 0.7 | |
| 4 | 6 | 5.38 | 30.77 | 145 | 59 | 36 | 0.6 | |
| 5 | 7 | 4.97 | 8 | 375 | 202 | 164 | 0.8 | |
| 6 | 13 | 10.69 | 7 | 4,696 | 710 | 1,334 | 1.9 | |
| 7 | 9 | 6.8 | 6 | 558 | 231 | 251 | 1.1 | |
| 11 | 7 | 3.55 | 10 | 423 | 175 | 180 | 1.0 | |
| 12 | 29 | 24.63 | 4 | 513 | 110 | 113 | 1.0 | |
| 13 | 13 | 10.16 | 28 | 294 | 89 | 63 | 0.7 | |
| 14 | 123 | 106.33 | 7 | 3,156 | 280 | 402 | 1.4 | |
| 15 | 58 | 54.92 | 4 | 3,350 | 315 | 510 | 1.6 | |
| 16 | 28 | 24.07 | 36 | 606 | 197 | 159 | 0.8 | |
| 17 | 28 | 26.68 | 4 | 684 | 218 | 213 | 1.0 | |
| Total | 382 | 324.11 | 4 | 4,696 | 244 | 426 | 1.7 | |
| All | 3,358 | 2,672.38 | 0 | 4,696 | 54 | 190 | 3.5 | |
Pb% |
1 | 28 | 20.58 | 0.21 | 22.19 | 4.71 | 5.40 | 1.1 |
| 2 | 15 | 13.89 | 0.04 | 11.93 | 4.38 | 3.56 | 0.8 | |
| 3 | 17 | 10.51 | 0.2 | 14.56 | 4.84 | 3.51 | 0.7 | |
| 4 | 6 | 5.38 | 0.17 | 7.60 | 3.56 | 1.99 | 0.6 | |
| 5 | 7 | 4.97 | 0.16 | 22.86 | 9.62 | 8.61 | 0.9 | |
| 6 | 13 | 10.69 | 0.04 | 12.69 | 4.29 | 3.92 | 0.9 | |
| 7 | 9 | 6.8 | 0.08 | 7.68 | 4.28 | 2.94 | 0.7 | |
| 11 | 7 | 3.55 | 0.32 | 16.31 | 3.57 | 4.04 | 1.1 | |
| 12 | 29 | 24.63 | 0.01 | 16.02 | 5.40 | 4.33 | 0.8 | |
| 13 | 13 | 10.16 | 0.16 | 12.66 | 3.58 | 3.34 | 0.9 | |
| 14 | 123 | 106.33 | 0.04 | 38.48 | 4.89 | 5.45 | 1.1 | |
| 15 | 58 | 54.92 | 0.02 | 30.01 | 5.33 | 6.65 | 1.2 | |
| 16 | 28 | 24.07 | 0.14 | 22.19 | 6.20 | 5.23 | 0.8 | |
| 17 | 28 | 26.68 | 0.03 | 41.27 | 9.77 | 12.68 | 1.3 | |
| Total | 382 | 324.11 | 0.01 | 41.27 | 5.42 | 6.45 | 1.2 | |
| All | 3,362 | 2,664.38 | 0 | 41.27 | 1.21 | 3.02 | 2.5 | |
Zn% |
1 | 28 | 20.58 | 0.04 | 4.07 | 1.67 | 1.39 | 0.8 |
| 2 | 15 | 13.89 | 0.06 | 3.11 | 0.59 | 0.90 | 1.5 | |
| 3 | 17 | 10.51 | 0.06 | 4.71 | 0.87 | 1.14 | 1.3 | |
| 4 | 6 | 5.38 | 0.05 | 0.40 | 0.24 | 0.11 | 0.4 |
| SORACAYA PROJECT | NI 43-101 TECHNICAL REPORT | 14-10 |
| |
| Zone | # | Length (m) | Min | Max | Mean | SD | CV | |
| 5 | 7 | 4.97 | 0.3 | 3.62 | 0.96 | 1.08 | 1.1 | |
| 6 | 13 | 10.69 | 0.01 | 3.10 | 0.47 | 0.84 | 1.8 | |
| 7 | 9 | 6.8 | 0.14 | 3.97 | 1.26 | 1.12 | 0.9 | |
| 11 | 7 | 3.55 | 0.14 | 5.94 | 1.39 | 1.77 | 1.3 | |
| 12 | 29 | 24.63 | 0.03 | 4.81 | 0.72 | 0.97 | 1.3 | |
| 13 | 13 | 10.16 | 0.05 | 2.64 | 0.57 | 0.69 | 1.2 | |
| 14 | 123 | 106.33 | 0.02 | 12.47 | 1.34 | 1.84 | 1.4 | |
| 15 | 58 | 54.92 | 0.01 | 6.60 | 0.89 | 1.11 | 1.2 | |
| 16 | 28 | 24.07 | 0.0269 | 18.53 | 1.24 | 2.28 | 1.8 | |
| 17 | 28 | 26.68 | 0.05 | 5.48 | 1.59 | 1.44 | 0.9 | |
| Total | 382 | 324.11 | 0.01 | 18.53 | 1.12 | 1.54 | 1.4 | |
| All | 3,372 | 2,672.38 | 0 | 18.53 | 0.40 | 0.86 | 2.2 | |
Cu% |
1 | 14 | 9.88 | 0.003 | 0.75 | 0.09 | 0.21 | 2.5 |
| 2 | 3 | 2.02 | 0.02 | 0.13 | 0.05 | 0.04 | 0.8 | |
| 3 | 8 | 3.58 | 0.006 | 0.18 | 0.03 | 0.04 | 1.4 | |
| 4 | 2 | 2.46 | 0.005 | 0.01 | 0.01 | 0.00 | 0.2 | |
| 5 | 2 | 1.31 | 0.006 | 0.04 | 0.02 | 0.02 | 0.8 | |
| 6 | 8 | 6.68 | 0.001 | 0.83 | 0.20 | 0.30 | 1.5 | |
| 7 | 4 | 3.01 | 0.001 | 0.02 | 0.01 | 0.01 | 1.1 | |
| 11 | 4 | 1.55 | 0.005 | 0.02 | 0.01 | 0.01 | 0.7 | |
| 12 | 18 | 14.87 | 0.001 | 1.02 | 0.22 | 0.38 | 1.7 | |
| 13 | 7 | 5.39 | 0.007 | 0.04 | 0.02 | 0.01 | 0.6 | |
| 14 | 63 | 54.88 | 0.001 | 3.62 | 0.19 | 0.49 | 2.6 | |
| 15 | 11 | 8.96 | 0.001 | 0.62 | 0.11 | 0.22 | 2.0 | |
| 16 | 9 | 7.14 | 0.01 | 0.07 | 0.03 | 0.02 | 0.6 | |
| 17 | 18 | 16.1 | 0.003 | 0.29 | 0.04 | 0.05 | 1.4 | |
| Total | 171 | 137.83 | 0.001 | 3.62 | 0.13 | 0.36 | 2.7 | |
| All | 1,349 | 1,062.93 | 0 | 4.48 | 0.07 | 0.23 | 3.5 |
Source: KGL (2024)
| SORACAYA PROJECT | NI 43-101 TECHNICAL REPORT | 14-11 |
| |
Figure 14-9 shows the distribution of silver values compared with composite lengths which is in contrast to those that were illustrated for the assay intervals in Figure 14-6. This shows that composting has smoothed that high grade outliers within the smaller assay intervals to ensure that these smaller intervals are weighted appropriately.
Figure 14-9: Composite Interval Lengths vs. Silver Grades
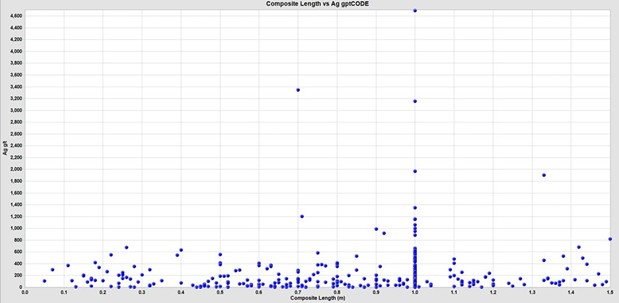
Source: KGL (2024)
The box plots for the zinc, lead, silver and sopper composites shown in Figure 14-10 through Figure 14-13 illustrate that each of the individual vein domains have differing statistical characteristics and grade distributions. Therefore, there is not a case combine the vein domains for estimation and as such, they are treated independently utilizing hard boundaries.
Figure 14-10: Box Plot of Zn% Composites for the Soracaya Deposit
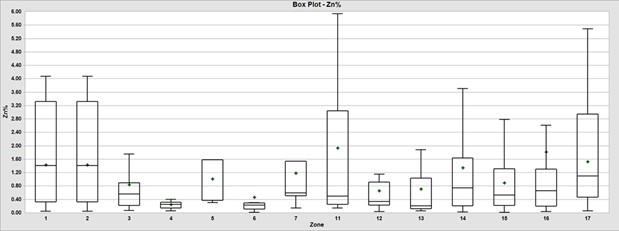
Source: KGL (2024)
| SORACAYA PROJECT | NI 43-101 TECHNICAL REPORT | 14-12 |
| |
Figure 14-11: Box Plot of Pb% Composites for the Soracaya Deposit
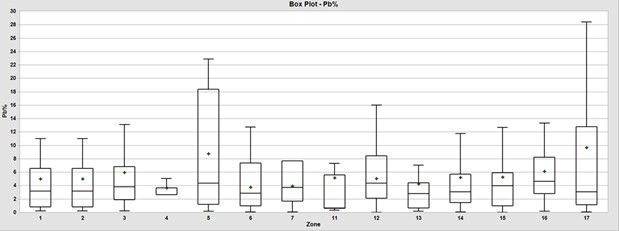
Source: KGL (2024)
Figure 14-12: Box Plot of Ag g/t Composites for the Soracaya Deposit
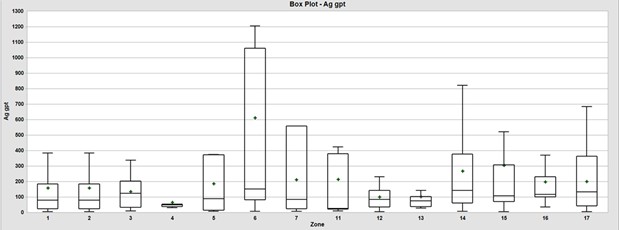
Source: KGL (2024)
| SORACAYA PROJECT | NI 43-101 TECHNICAL REPORT | 14-13 |
| |
Figure 14-13: Box Plot of Cu% Composites for the Soracaya Deposit
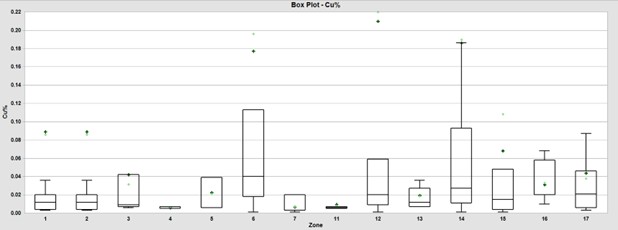
Source: KGL (2024)
| 14.6 | Evaluation of Outlier Assay Values |
An evaluation of the probability plots suggests that there may be outlier assay values that could result in an overestimation of resources as previously discussed. Although it is believed that this risk is relatively low, it was considered prudent to cut the silver, lead and zinc composites to varying thresholds for each mineralized vein to reduce the effects of outliers.
As previously discussed, the CVs, which are a unit independent measure of variability, were relatively low for the assay data. This may be mitigated or resolved by 1) compositing and 2) cutting or grade limiting.
Compositing has shown to have a mitigative effect on the high-grade outlier grades however an evaluation of the probability plots suggests that there may be outlier values or populations that could result in an overestimation or smearing of grade. Figure 14-14 through Figure 14-17 shows probability plots for the lead, zinc and silver, respectively which demonstrate “breaks” or shifts at between the 95th and 99th percentile that indicate an outlier population. Therefore, for composites above those “breaks” or thresholds, the composites are limited or capped. Table 14-6 lists the cut thresholds applied to the composite data for each all veins for zinc, lead, silver and copper, respectively.
Table 14-6: Outlier Cutting Analysis for the Soracaya Deposit
| Zone | Zn % | Ag g/t | Pb % |
| 1-17 | 4 | 750 | 20 |
Source: KGL (2024)
| SORACAYA PROJECT | NI 43-101 TECHNICAL REPORT | 14-14 |
| |
Figure 14-14: Cumulative Probability Plot of Zn% Composites for the Soracaya Deposit
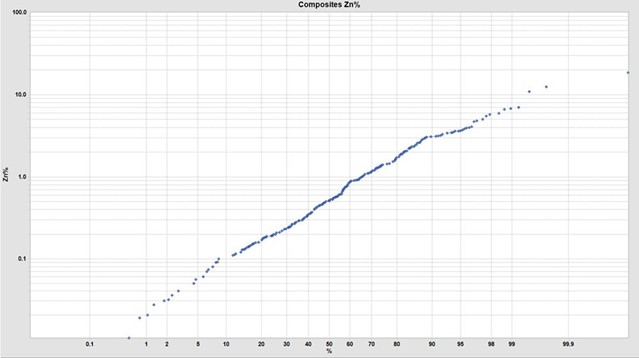
Source: KGL (2024)
Figure 14-15: Cumulative Probability of Pb% Composites for the Soracaya Deposit
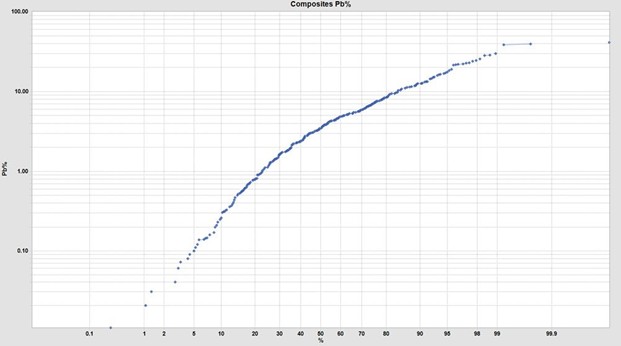
Source: KGL (2024)
| SORACAYA PROJECT | NI 43-101 TECHNICAL REPORT | 14-15 |
| |
Figure 14-16: Cumulative Probability of Ag g/t Composites for the Soracaya Deposit
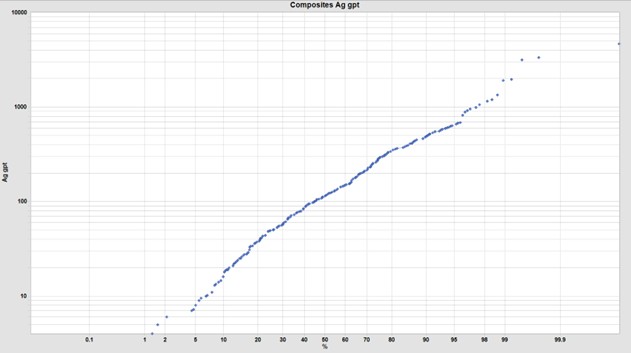
Source: KGL (2024)
Figure 14-17: Cumulative Probability of Cu% Composites for the Soracaya Deposit
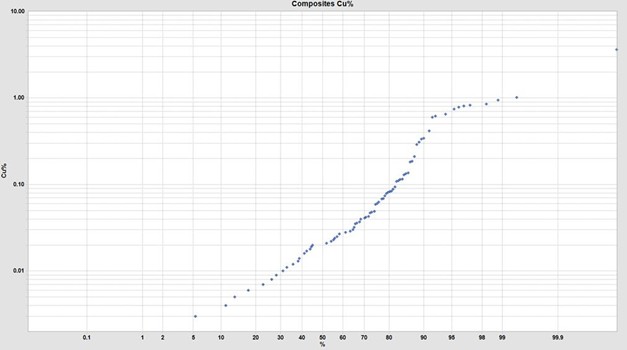
Source: KGL (2024)
| SORACAYA PROJECT | NI 43-101 TECHNICAL REPORT | 14-16 |
| |
Table 14-7 illustrates the effect of each process from assay data to composites and then cut composites along with the reduction in average grade and corresponding CV. Throughout, the results show a modest reduction of metal as illustrated by the reductions of the mean grades from assay versus cut composites as shown as red bold. In addition, variability is modestly to significantly reduced as illustrated by the reduction in the CVs.
Table 14-7: Outlier Cutting Analysis for the Soracaya Deposit
| Assays | Composites | %diff Assay vs Comps | Cut Composites | %diff Assay vs Cut Comps | ||||||||||||
| Zone | Max | Mean | CV | Max | Mean | CV | Max | Mean | CV | Max | Mean | CV | Max | Mean | CV | |
Ag |
1 | 921 | 165 | 1.3 | 921 | 165 | 1.3 | 0% | 0% | -2% | 750 | 157 | 1.2 | -19% | -5% | -10% |
| 2 | 619 | 138 | 1.2 | 375 | 138 | 0.8 | -39% | 0% | -32% | 375 | 138 | 0.8 | -39% | 0% | -32% | |
| 3 | 338 | 120 | 0.7 | 338 | 120 | 0.7 | 0% | 0% | -1% | 338 | 120 | 0.7 | 0% | 0% | -1% | |
| 4 | 145 | 59 | 0.7 | 145 | 59 | 0.6 | 0% | 0% | -8% | 145 | 59 | 0.6 | 0% | 0% | -8% | |
| 5 | 471 | 202 | 0.9 | 375 | 202 | 0.8 | -20% | 0% | -9% | 375 | 202 | 0.8 | -20% | 0% | -9% | |
| 6 | 15,397 | 710 | 3.6 | 4,696 | 710 | 1.9 | -70% | 0% | -47% | 750 | 282 | 1.0 | -95% | -60% | -71% | |
| 7 | 558 | 231 | 1.1 | 558 | 231 | 1.1 | 0% | 0% | 0% | 558 | 231 | 1.1 | 0% | 0% | 0% | |
| 11 | 1,450 | 175 | 1.5 | 423 | 175 | 1.0 | -71% | 0% | -30% | 423 | 175 | 1.0 | -71% | 0% | -30% | |
| 12 | 570 | 110 | 1.1 | 513 | 110 | 1.0 | -10% | 0% | -7% | 513 | 110 | 1.0 | -10% | 0% | -7% | |
| 13 | 315 | 89 | 0.8 | 294 | 89 | 0.7 | -7% | 0% | -12% | 294 | 89 | 0.7 | -7% | 0% | -12% | |
| 14 | 3,291 | 317 | 1.4 | 3,156 | 280 | 1.4 | -4% | -11% | 0% | 750 | 236 | 0.9 | -77% | -25% | -37% | |
| 15 | 7,275 | 335 | 2.2 | 3,350 | 315 | 1.6 | -54% | -6% | -28% | 750 | 231 | 1.0 | -90% | -31% | -55% | |
| 16 | 962 | 197 | 1.1 | 606 | 197 | 0.8 | -37% | 0% | -29% | 606 | 197 | 0.8 | -37% | 0% | -29% | |
| 17 | 964 | 218 | 1.2 | 684 | 218 | 1.0 | -29% | 0% | -16% | 684 | 218 | 1.0 | -29% | 0% | -16% | |
| Total | 15,397 | 268 | 2.3 | 4,696 | 244 | 1.7 | -70% | -9% | -24% | 750 | 200 | 1.0 | -95% | -25% | -56% | |
| All | 15,397 | 54 | 4.7 | 4,696 | 54 | 3.5 | -70% | 0% | -24% | 750 | 47 | 2.4 | -95% | -13% | -49% | |
Pb% |
1 | 26.68 | 4.71 | 1.3 | 22.19 | 4.71 | 1.1 | -17% | 0% | -8% | 20.00 | 4.62 | 1.1 | -25% | -2% | -11% |
| 2 | 14.30 | 4.38 | 1.0 | 11.93 | 4.38 | 0.8 | -17% | 0% | -22% | 11.93 | 4.38 | 0.8 | -17% | 0% | -22% | |
| 3 | 14.56 | 4.84 | 0.7 | 14.56 | 4.84 | 0.7 | 0% | 0% | -1% | 14.56 | 4.84 | 0.7 | 0% | 0% | -1% | |
| 4 | 7.95 | 3.56 | 0.7 | 7.60 | 3.56 | 0.6 | -4% | 0% | -14% | 7.60 | 3.56 | 0.6 | -4% | 0% | -14% | |
| 5 | 29.18 | 9.62 | 1.0 | 22.86 | 9.62 | 0.9 | -22% | 0% | -13% | 20.00 | 9.05 | 0.9 | -31% | -6% | -17% | |
| 6 | 32.23 | 4.29 | 1.4 | 12.69 | 4.29 | 0.9 | -61% | 0% | -35% | 12.69 | 4.29 | 0.9 | -61% | 0% | -35% | |
| 7 | 7.68 | 4.28 | 0.7 | 7.68 | 4.28 | 0.7 | 0% | 0% | 0% | 7.68 | 4.28 | 0.7 | 0% | 0% | 0% | |
| 11 | 19.96 | 3.57 | 1.3 | 16.31 | 3.57 | 1.1 | -18% | 0% | -15% | 16.31 | 3.57 | 1.1 | -18% | 0% | -15% | |
| 12 | 26.00 | 5.40 | 0.9 | 16.02 | 5.40 | 0.8 | -38% | 0% | -13% | 16.02 | 5.40 | 0.8 | -38% | 0% | -13% | |
| 13 | 16.71 | 3.58 | 1.0 | 12.66 | 3.58 | 0.9 | -24% | 0% | -11% | 12.66 | 3.58 | 0.9 | -24% | 0% | -11% | |
| SORACAYA PROJECT | NI 43-101 TECHNICAL REPORT | 14-17 |
| |
| Assays | Composites | %diff Assay vs Comps | Cut Composites | %diff Assay vs Cut Comps | ||||||||||||
| Zone | Max | Mean | CV | Max | Mean | CV | Max | Mean | CV | Max | Mean | CV | Max | Mean | CV | |
| 14 | 38.48 | 4.35 | 1.2 | 38.48 | 4.89 | 1.1 | 0% | 12% | -10% | 20.00 | 4.74 | 1.0 | -48% | 9% | -17% | |
| 15 | 30.19 | 5.27 | 1.4 | 30.01 | 5.33 | 1.2 | -1% | 1% | -8% | 20.00 | 4.89 | 1.1 | -34% | -7% | -21% | |
| 16 | 29.60 | 6.20 | 1.1 | 22.19 | 6.20 | 0.8 | -25% | 0% | -24% | 20.00 | 6.11 | 0.8 | -32% | -1% | -27% | |
| 17 | 47.49 | 9.77 | 1.4 | 41.27 | 9.77 | 1.3 | -13% | 0% | -6% | 20.00 | 7.15 | 1.0 | -58% | -27% | -26% | |
| Total | 47.49 | 5.10 | 1.3 | 41.27 | 5.42 | 1.2 | -13% | 6% | -10% | 20.00 | 5.06 | 1.0 | -58% | -1% | -24% | |
| All | 54.78 | 1.20 | 2.7 | 41.27 | 1.21 | 2.5 | -25% | 0% | -9% | 20.00 | 1.16 | 2.3 | -63% | -3% | -18% | |
Zn% |
1 | 8.87 | 1.67 | 1.0 | 4.07 | 1.67 | 0.8 | -54% | 0% | -19% | 4.00 | 1.67 | 0.8 | -55% | 0% | -20% |
| 2 | 3.11 | 0.59 | 1.5 | 3.11 | 0.59 | 1.5 | 0% | 0% | 0% | 3.11 | 0.59 | 1.5 | 0% | 0% | 0% | |
| 3 | 4.71 | 0.87 | 1.3 | 4.71 | 0.87 | 1.3 | 0% | 0% | 0% | 4.00 | 0.82 | 1.2 | -15% | -6% | -10% | |
| 4 | 0.48 | 0.24 | 0.5 | 0.40 | 0.24 | 0.4 | -17% | 0% | -13% | 0.40 | 0.24 | 0.4 | -17% | 0% | -12% | |
| 5 | 3.62 | 0.96 | 1.1 | 3.62 | 0.96 | 1.1 | 0% | 0% | 0% | 3.62 | 0.96 | 1.1 | 0% | 0% | 0% | |
| 6 | 3.10 | 0.47 | 1.8 | 3.10 | 0.47 | 1.8 | 0% | 0% | -1% | 3.10 | 0.47 | 1.8 | 0% | 0% | -1% | |
| 7 | 3.97 | 1.26 | 0.9 | 3.97 | 1.26 | 0.9 | 0% | 0% | 0% | 3.97 | 1.26 | 0.9 | 0% | 0% | 0% | |
| 11 | 5.94 | 1.39 | 1.3 | 5.94 | 1.39 | 1.3 | 0% | 0% | 0% | 4.00 | 1.22 | 1.1 | -33% | -12% | -11% | |
| 12 | 4.81 | 0.72 | 1.4 | 4.81 | 0.72 | 1.3 | 0% | 0% | -4% | 4.00 | 0.69 | 1.2 | -17% | -5% | -14% | |
| 13 | 2.64 | 0.57 | 1.2 | 2.64 | 0.57 | 1.2 | 0% | 0% | 0% | 2.64 | 0.57 | 1.2 | 0% | 0% | 0% | |
| 14 | 18.03 | 1.36 | 1.6 | 12.47 | 1.34 | 1.4 | -31% | -2% | -14% | 4.00 | 1.15 | 1.0 | -78% | -16% | -36% | |
| 15 | 11.05 | 1.16 | 1.7 | 6.60 | 0.89 | 1.2 | -40% | -23% | -28% | 4.00 | 0.83 | 1.0 | -64% | -28% | -40% | |
| 16 | 18.53 | 1.24 | 1.9 | 18.53 | 1.24 | 1.8 | 0% | 0% | -4% | 4.00 | 1.04 | 1.0 | -78% | -16% | -46% | |
| 17 | 7.62 | 1.59 | 1.0 | 5.48 | 1.59 | 0.9 | -28% | 0% | -14% | 4.00 | 1.54 | 0.9 | -48% | -3% | -19% | |
| Total | 18.53 | 1.20 | 1.6 | 18.53 | 1.12 | 1.4 | 0% | -7% | -13% | 4.00 | 1.03 | 1.1 | -78% | -15% | -31% | |
| All | 27.80 | 0.39 | 2.4 | 18.53 | 0.40 | 2.2 | -33% | 1% | -8% | 4.00 | 0.37 | 1.7 | -86% | -5% | -27% | |
Source: KGL (2024)
| SORACAYA PROJECT | NI 43-101 TECHNICAL REPORT | 14-18 |
| |
| 14.7 | Specific Gravity Estimation |
There are no bulk density measurements taken at Soracaya. Due to the similarities and proximity to the San Vicente project, the same density formula was utilized for Soracaya as follows:
Density = 2.646 + 0.0171*Cu% + 0.132*Pb% + 0.018*Zn
Specific gravities assigned on a block-by-block basis using the calculated values. A default density of 3.1 t/m3 was assigned to any blocks that were not assigned a calculated value (Figure 14-18). It is recommended that a program be initiated to derive direct density measurements from the Soracaya Project
Figure 14-18: Calculated Density Model
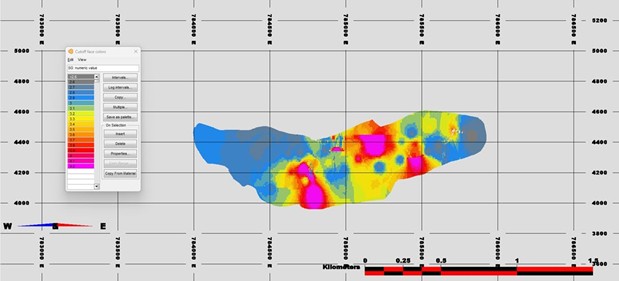
Source: KGL (2024)
| 14.8 | ZnEq and Cut-off Grade Calculation |
The mineral resources reported herein are reporting based on zinc equivalent (ZnEq). The formula used to convert the respective metals to ZnEq is as follows:
ZnEq = Zn% + 1.6 x Pb% + 0.071 x Ag g/t + 4.1 x Cu%
Metal prices used were $3.65/lb Cu, $21.00/oz Ag, $1.00/lb Pb, and $1.15/lb Zn. The process recoveries used for the calculation are 70% Pb, 72.25% Ag and 70% Cu for the lead con while 80% Zn and 12.75% Ag for the zinc con.
Based on actual 2023 operating costs derived from the Porco mine operating cost data of $104/t mining costs, $17/t G&A and $1.94 almacen, the cut-off grade for reporting the resources is 10% ZnEq.
| SORACAYA PROJECT | NI 43-101 TECHNICAL REPORT | 14-19 |
| |
| 14.9 | Mined Out Development Volumes |
Soracaya has a limited amount of development on surface and underground. The underground development incudes an access ramp and drifting along the Esperanza vein which requires depletion from the resource estimate. Figure 14-19 and Figure 14-20 shows a plan and long-section view of the existing underground development to be extracted from the resource model.
Figure 14-19: Plan View of Mined Out Development (Blue)
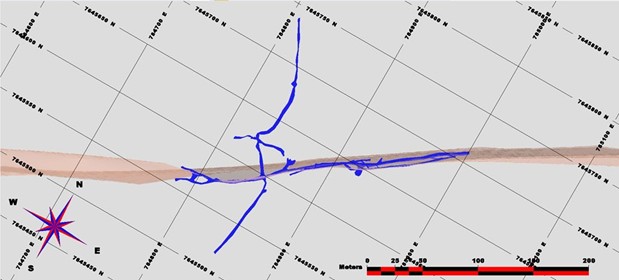
Source: KGL (2024)
Figure 14-20: Long Section View of Mined Out Development (Blue)
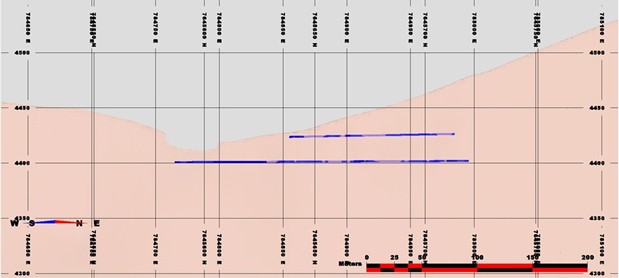
Source: KGL (2024)
| SORACAYA PROJECT | NI 43-101 TECHNICAL REPORT | 14-20 |
| |
| 14.10 | Block Model Definition |
The block model used to estimate the resources was defined according to the limits specified in Figure 14-21. The block model is orthogonal and rotated 330°, reflecting the orientation of the deposit. The chosen block size was 10 m by 10 m by 2 m and subsequently sub-blocked to 2 m x 2 m x 0.1 m to facilitate underground mine planning and scheduling. Note that MineSight™ uses the centroid of the blocks as the origin.
Figure 14-21: Dimensions, Origin and Orientation for the Soracaya Block Model
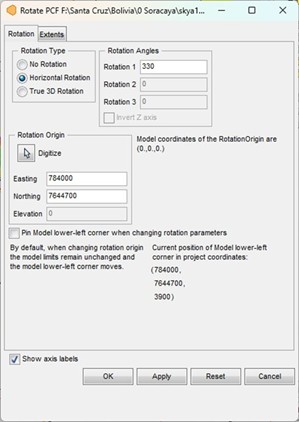 |
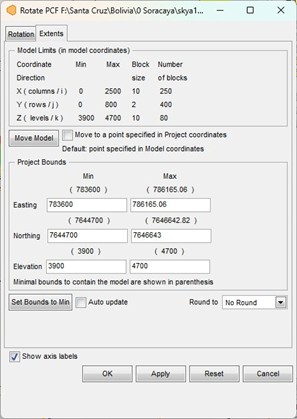 |
Source: KGL (2024)
| 14.11 | Resource Estimation Methodology |
Experimental variograms and variogram models in the form of correlograms were generated for silver, lead, zinc and copper grades. However, the veins do not have sufficient data to generate meaningful variogram results. For this reason, it was decided at this time to use inverse distance to the second power as the interpolator.
The resource estimation plan includes the following items:
| ■ | mineralized zone code of modelled mineralization in each block; |
| SORACAYA PROJECT | NI 43-101 TECHNICAL REPORT | 14-21 |
| |
| ■ | estimated block silver, lead, zinc and copper grades by inverse distance to the second power; |
| ■ | two-pass estimation strategy for each mineralized vein domain. The two passes enable better estimation of local metal grades and infill of interpreted solids and to facilitate classification; and |
| ■ | assignment of mined out areas coded into the block model for exclusion. |
The resultant resource model for the Esperanza vein is shown in Figure 14-22 through Figure 14-27.
Figure 14-22: Long Section View of Block Model for the Esperansa Vein showing ZnEq% Cutoff Grades
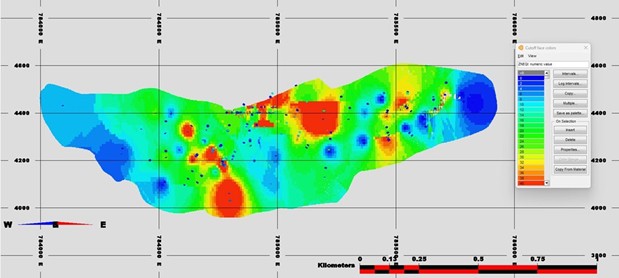
Source: KGL (2024)
Figure 14-23: Long Section View of Block Model for the Esperansa Vein showing Zn% Cutoff Grades
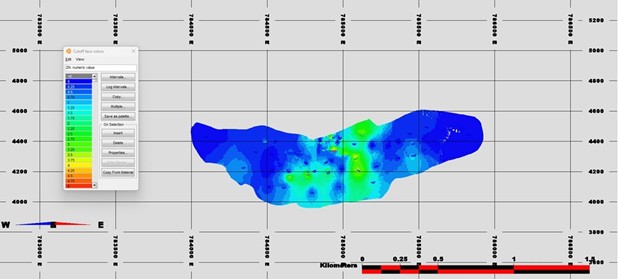
Source: KGL (2024)
| SORACAYA PROJECT | NI 43-101 TECHNICAL REPORT | 14-22 |
| |
Figure 14-24: Long Section View of Block Model for the Esperansa Vein showing Ag g/t Cutoff Grades
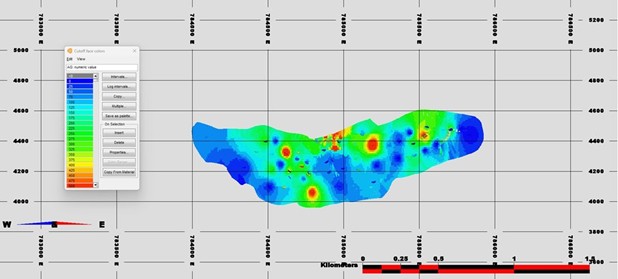
Source: KGL (2024)
Figure 14-25: Long Section View of Block Model for the Esperansa Vein showing Pb% Cutoff Grades
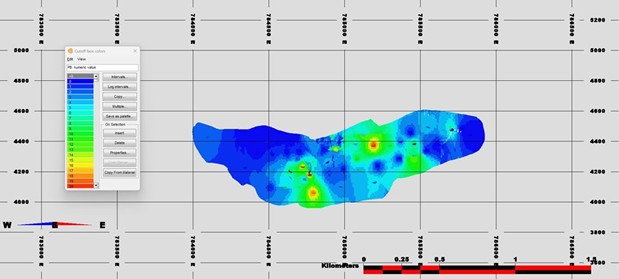
Source: KGL (2024)
| SORACAYA PROJECT | NI 43-101 TECHNICAL REPORT | 14-23 |
| |
Figure 14-26: Long Section View of Block Model for the Esperansa Vein showing Cu% Cutoff Grades
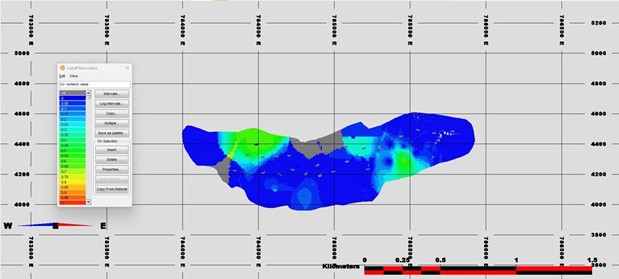
Source: KGL (2024)
Figure 14-27: Cross Section View of ZnEq Cutoff Grades for the Soracaya Block Model, Drillholes and Topography
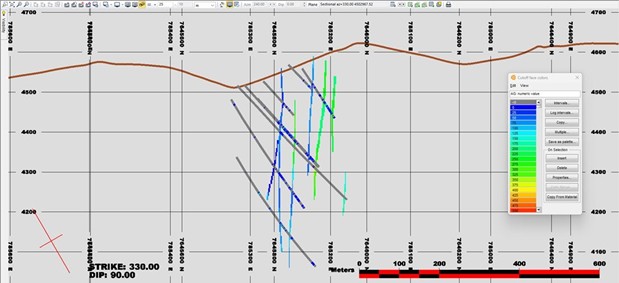
Source: KGL (2024)
| 14.12 | Mineral Resource Classification |
Mineral resources were estimated in conformity with generally accepted CIM Estimation of Mineral Resources and Mineral Reserves Best Practice Guidelines (2019). Mineral resources are not mineral reserves and do not have demonstrated economic viability.
| SORACAYA PROJECT | NI 43-101 TECHNICAL REPORT | 14-24 |
| |
The mineral resources may be impacted by further infill and exploration drilling that may result in an increase or decrease in future resource evaluations. The mineral resources may also be affected by subsequent assessment of mining, environmental, processing, permitting, taxation, socio-economic and other factors. There is insufficient information in this early stage of study to assess the extent to which the mineral resources will be affected by factors such as these that are more suitably assessed in a scoping or conceptual study.
Mineral resources for the Soracaya deposit were classified according to the CIM Definition Standards for Mineral Resources and Mineral Reserves (2014) as approved by Garth Kirkham, P.Geo., an “independent qualified person” as defined by NI 43-101.
Drillhole spacing in the Soracaya deposit is sufficient for preliminary geostatistical analysis and evaluating spatial grade variability. KGL is, therefore, of the opinion that the amount of sample data is adequate to demonstrate very good confidence in the grade estimates for the deposit.
The estimated blocks were classified according to the following:
| ■ | confidence in interpretation of the mineralized zones; | |
| ■ | lack of density measurements; | |
| ■ | number of data used to estimate a block; | |
| ■ | number of composites allowed per drillhole; and | |
■ | distance to nearest composite used to estimate a block. |
The classification of resources was based primarily on distance to the nearest composite; however, all the quantitative measures, as listed above, were inspected and taken into consideration. In addition, the classification of resources for each zone was considered individually by virtue of their relative depth from surface and the inability to derive meaningful geostatistical results.
| 14.13 | Reasonable Prospect of Eventual Economic Extraction |
Furthermore, an interpreted boundary was created for the inferred threshold in order to exclude orphans and reduce “spotted dog” effect. The remaining blocks may be unclassified and may be considered as geologic potential for further exploration. This interpreted boundary is considered the threshold within which there is a “reasonable prospect of eventual economic extraction” as shown for the Esperanza vein in Figure 14-28.
| SORACAYA PROJECT | NI 43-101 TECHNICAL REPORT | 14-25 |
| |
Figure 14-28: Long Section View of Inferred Resources (blue) and Unclassified Resources (red)
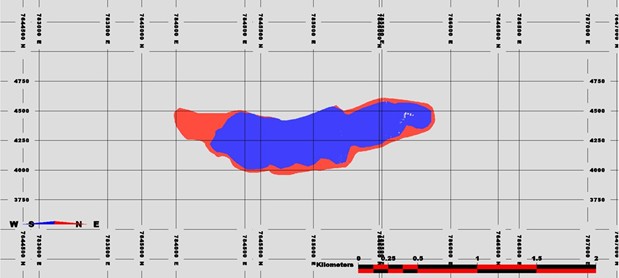
Source: KGL (2024)
Furthermore, an additional consideration for the requirement for resources to possess a “reasonable prospect of eventual economic extraction” (RP3E) is the creation of underground mineable shapes that display continuity based on cut-off grades and classification. Additionally, these RP3E shapes also took into account must-take material that may fall below cut-off grade but will be extracted by mining in the event that adjacent economic material is extracted making below cut-off material by virtue of the mining costs being paid for.
These underground mining shapes were created using stope optimization techniques and are shown in Figure 14-29. The design criteria utilized was based on stope dimensions of 20 m along strike, 20 m tall and minimum mining width of 1.25 m. In addition, dilution of 0.25 m is included for hangingwall and footwall for a total diluted minimum mining width of 1.75 m. Figure 14-30 shows the corresponding classified block model for ZnEq% within the optimized stopes.
| SORACAYA PROJECT | NI 43-101 TECHNICAL REPORT | 14-26 |
| |
Figure 14-29: Long Section View of Stopes
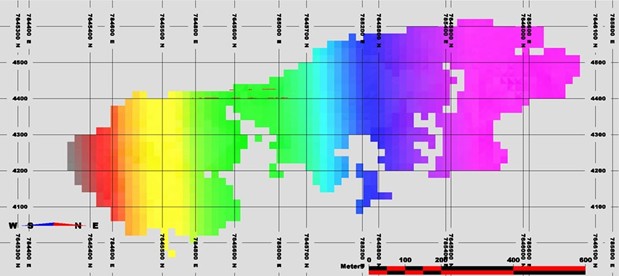
Source: KGL (2024)
Figure 14-30: Long Section View of Inferred Blocks with ZnEq% Cutoff Grades along within Optimized Stopes
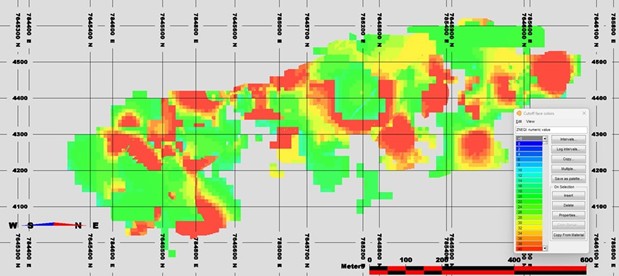
Source: KGL (2024)
| 14.14 | Resource Validation |
A graphical validation was completed on the block model. This type of validation serves the following purposes:
| ■ | checks the reasonableness of the estimated grades based on the estimation plan and the nearby composites; |
| SORACAYA PROJECT | NI 43-101 TECHNICAL REPORT | 14-27 |
| |
| ■ | checks that the general drift and the local grade trends compare to the drift and local grade trends of the composites; |
| ■ | ensures that all blocks in the core of the deposit have been estimated; |
| ■ | checks that topography has been properly accounted for; |
| ■ | checks against manual approximate estimates of tonnages to determine reasonableness; and |
| ■ | inspects for and explains potentially high-grade block estimates in the neighbourhood of the extremely high assays. |
A full set of cross sections, long sections and plans were used to digitally check the block model; these showed the block grades and composites. There was no indication that a block was wrongly estimated, and it appears that every block grade could be explained as a function of the surrounding composites and the applied estimation plan.
The validation techniques included the following:
| ■ | visual inspections of cross, long and plan sections; | |
| ■ | swath plots comparing estimated block grades from inverse distance and nearest neighbour estimates; and | |
| ■ | inspection of histograms showing distance from first composite to nearest block, and average distance to blocks for all composites which gives a quantitative measure of confidence that blocks are adequately informed in addition to assisting in the classification of resources. |
| 14.15 | Mineral Resource Statement |
Table 14-8 shows the Mineral Resource Statement for the Soracaya deposit at 13.4% ZnEq cut-off grade. The criteria considered were confidence, continuity and economic cut-off. Table 14-9 lists the mineral resources by individual vein.
Table 14-8: Base Case Total Mineral Resources at 10% ZnEq Cut-off
| Tonnes | ZnEq | Zn | Ag | Pb | Cu | NSR |
| 4,137,000 | 31.62 | 1.23 | 259.76 | 7.23 | 0.09 | 248.82 |
Notes:
| 6) | The current Resource Estimate was prepared by Garth Kirkham, P.Geo., of Kirkham Geosystems Ltd. |
| 7) | All mineral resources have been estimated in accordance with Canadian Institute of Mining and Metallurgy and Petroleum (“CIM”) definitions, as required under National Instrument 43-101 (“NI43-101”). |
| 8) | The Mineral Resource Estimate was prepared using a 10% zinc equivalent cut-off grade. Cut-off grades were derived from $3.65/lb. copper, $21.00/oz silver, $1.15/lb. zinc and $1.00/lb. lead. This cut-off grade was based on current smelter agreements and total OPEX costs of $156.00/t based on 2023 actual costs derived from the Porco mine data, with process recoveries of 70.0% for copper, 80.0% for zinc, 70.0% for lead, and 85% for silver. All prices are stated in $USD. |
| 9) | An Inferred Mineral Resource has a lower level of confidence than that applying to an Indicated Mineral Resource and must not be converted to a Mineral Reserve. It is reasonably expected that the majority of Inferred Mineral Resources could be upgraded to Indicated Mineral Resources with continued exploration. |
| 10) | Mineral resources are not mineral reserves until they have demonstrated economic viability. Mineral resource estimates do not account for a resource’s mineability, selectivity, mining loss, or dilution. All figures are rounded to reflect the relative accuracy of the estimate and therefore numbers may not appear to add precisely. |
| SORACAYA PROJECT | NI 43-101 TECHNICAL REPORT | 14-28 |
| |
Table 14-9: Base Case Total Mineral Resources at 10% ZnEq Cut-off Split by Area
| Vein Code | Vein Name | Tonnes | ZnEq | Zn | Ag | Pb | Cu | NSR |
| 1 | A1 | 317,000 | 33.28 | 1.86 | 270.69 | 7.37 | 0.10 | 261.99 |
| 2 | A2 | 290,000 | 28.87 | 0.88 | 229.70 | 7.05 | 0.10 | 227.13 |
| 3 | A3 | 210,000 | 24.53 | 0.50 | 177.34 | 7.06 | 0.03 | 192.82 |
| 5 | A5 | 177,000 | 35.75 | 1.04 | 247.48 | 10.66 | 0.02 | 281.22 |
| 6 | A6 | 100,000 | 39.63 | 0.29 | 429.37 | 5.31 | 0.08 | 312.16 |
| 7 | A7 | 39,000 | 32.02 | 1.39 | 312.44 | 5.26 | 0.01 | 252.18 |
| 11 | B1 | 8,000 | 51.77 | 2.53 | 385.30 | 13.65 | 0.01 | 407.22 |
| 12 | ES2 | 273,000 | 27.41 | 1.01 | 176.95 | 8.00 | 0.25 | 215.55 |
| 13 | España | 24,000 | 32.75 | 1.76 | 196.25 | 10.59 | 0.03 | 257.45 |
| 14 | Esperanza | 1,343,000 | 31.66 | 1.41 | 260.08 | 7.02 | 0.13 | 249.13 |
| 15 | Ramo 1 | 680,000 | 31.98 | 1.09 | 294.90 | 6.13 | 0.04 | 251.67 |
| 16 | Ramo 2 | 393,000 | 25.44 | 1.00 | 198.62 | 6.36 | 0.04 | 200.11 |
| 17 | SOR1 | 283,000 | 43.35 | 1.77 | 360.88 | 9.81 | 0.06 | 341.11 |
Notes:
| 1) | The current Resource Estimate was prepared by Garth Kirkham, P.Geo., of Kirkham Geosystems Ltd. |
| 2) | All mineral resources have been estimated in accordance with Canadian Institute of Mining and Metallurgy and Petroleum (“CIM”) definitions, as required under National Instrument 43-101 (“NI43-101”). |
| 3) | The Mineral Resource Estimate was prepared using a 10% zinc equivalent cut-off grade. Cut-off grades were derived from $3.65/lb. copper, $21.00/oz silver, $1.15/lb. zinc and $1.00/lb. lead. This cut-off grade was based on current smelter agreements and total OPEX costs of $156.00/t based on 2023 actual costs derived from the Porco mine data, with process recoveries of 80.0% for zinc, 70.0% for lead, and 72.25% for silver. All prices are stated in $USD. |
| 4) | An Inferred Mineral Resource has a lower level of confidence than that applying to an Indicated Mineral Resource and must not be converted to a Mineral Reserve. It is reasonably expected that the majority of Inferred Mineral Resources could be upgraded to Indicated Mineral Resources with continued exploration. |
| 5) | Mineral resources are not mineral reserves until they have demonstrated economic viability. Mineral resource estimates do not account for a resource’s mineability, selectivity, mining loss, or dilution. All figures are rounded to reflect the relative accuracy of the estimate and therefore numbers may not appear to add precisely. |
| 14.16 | Sensitivity of the Block Model to Selection Cut-off Grade |
The mineral resources are not particularly sensitive to the selection of cut-off grade. Table 14-10 shows the total resources for all metals at varying ZnEq cut-off grades. The reader is cautioned that these values should not be misconstrued as a mineral reserve. The reported quantities and grades are only presented as a sensitivity of the resource model to the selection of cut-off grades.
Note that the base case cut-off grades presented in Table 14-10 are based on potentially underground, mineable resources at the base case of 10% ZnEq.
| SORACAYA PROJECT | NI 43-101 TECHNICAL REPORT | 14-29 |
| |
Table 14-10: Sensitivity Analyses at Various ZnEq Cut-off Grades for the Inferred Resources
| Cutoff | Tonnes | ZnEq | Zn | Ag | Pb | Cu | NSR |
| >=13.4 | 4,125,000 | 31.68 | 1.23 | 260.26 | 7.24 | 0.09 | 249.26 |
| >=10 | 4,137,000 | 31.62 | 1.23 | 259.76 | 7.23 | 0.09 | 248.82 |
| >=2 | 4,142,000 | 31.59 | 1.23 | 259.53 | 7.22 | 0.09 | 248.61 |
Notes:
| 1) | The current Resource Estimate was prepared by Garth Kirkham, P.Geo., of Kirkham Geosystems Ltd. |
| 2) | All mineral resources have been estimated in accordance with Canadian Institute of Mining and Metallurgy and Petroleum (“CIM”) definitions, as required under National Instrument 43-101 (“NI43-101”). |
| 3) | The Mineral Resource Estimate was prepared using a 10% zinc equivalent cut-off grade. Cut-off grades were derived from $3.65/lb. copper, $21.00/oz silver, $1.15/lb. zinc and $1.00/lb. lead. This cut-off grade was based on current smelter agreements and total OPEX costs of $156.00/t based on 2023 actual costs derived from the Porco mine data, with process recoveries of 80.0% for zinc, 70.0% for lead, and 72.25% for silver. All prices are stated in $USD. |
| 4) | An Inferred Mineral Resource has a lower level of confidence than that applying to an Indicated Mineral Resource and must not be converted to a Mineral Reserve. It is reasonably expected that the majority of Inferred Mineral Resources could be upgraded to Indicated Mineral Resources with continued exploration. |
| 5) | Mineral resources are not mineral reserves until they have demonstrated economic viability. Mineral resource estimates do not account for a resource’s mineability, selectivity, mining loss, or dilution. All figures are rounded to reflect the relative accuracy of the estimate and therefore numbers may not appear to add precisely. |
| 14.17 | Discussion with Respect to Potential Material Risks to the Resources |
The current political and socio-economic climate in Bolivia poses risks and uncertainties that could delay or even stop development as reported within the Fraser Institute Annual Report 2022 where Bolivia ranks very low in many non-technical metrics. Bolivia has been ranked consistently low for the past five years and ranks in the lower quartile on all metrics that gauge risk and uncertainty. It is difficult to gauge or qualify the level or extents of the risks however, all companies working in Bolivia must continue to be aware of the potential risks and develop mitigation strategies. A significant risk related to the Santacruz Bolivian mineral assets and in particular the mineral resources and mineral reserves is the significant artisanal activity that continues to exist. This activity is not only a socio-economic risk but also effects access to resources and reserves along with potentially resulting in potential sterilization of mineral resources.
Apart from political and socio-economic risks there are no other known environmental, permitting, legal, taxation, title or other relevant factors that materially affect the resources apart from commodity price fluctuations particularly on the downside.
The Soracaya deposit consists of very many high-grade thin veins. These types of deposits are very sensitive to grade as the size and geometry must be economically viable as they must support selective mining methods and be able to withstand high levels of dilutive material.
| SORACAYA PROJECT | NI 43-101 TECHNICAL REPORT | 14-30 |
| |
| 15 | MINERAL RESERVE ESTIMATE |
This section is not applicable to this Technical Report.
| SORACAYA PROJECT | NI 43-101 TECHNICAL REPORT | 15-1 |
| |
|
16 | MINING METHODS |
This section is not applicable to this Technical Report.
| SORACAYA PROJECT | NI 43-101 TECHNICAL REPORT | 16-1 |
| |
| 17 | PROCESS DESCRIPTION AND RECOVERY METHODS |
This section is not applicable to this Technical Report.
| SORACAYA PROJECT | NI 43-101 TECHNICAL REPORT | 17-1 |
| |
| 18 | PROJECT INFRASTRUCTURE AND SERVICES |
This section is not applicable to this Technical Report.
| SORACAYA PROJECT | NI 43-101 TECHNICAL REPORT | 18-1 |
| |
|
19 | MARKET STUDIES AND CONTRACTS |
This section is not applicable to this Technical Report.
| SORACAYA PROJECT | NI 43-101 TECHNICAL REPORT | 19-1 |
| |
| 20 | ENVIRONMENTAL STUDIES, PERMITTING AND SOCIAL OR COMMUNITY IMPACTS |
This section is not applicable to this Technical Report.
| SORACAYA PROJECT | NI 43-101 TECHNICAL REPORT | 20-1 |
| |
| 21 | CAPITAL AND OPERATING COSTS |
This section is not applicable to this Technical Report.
| SORACAYA PROJECT | NI 43-101 TECHNICAL REPORT | 21-1 |
| |
| 22 | ECONOMIC ANALYSIS |
This section is not applicable to this Technical Report.
| SORACAYA PROJECT | NI 43-101 TECHNICAL REPORT | 22-1 |
| |
| 23 | ADJACENT PROPERTIES |
The San Vicente mine is located in southern Bolivia, in the province of Sud-Chicas, Department of Potosí, at a latitude of 21°16’ south, longitude 66°19’ west, and an altitude of 4,500 masl. It is 11 km to the west of Soracaya. Table 23-1 shows the 2023 resources and reserves as published in the Pan American Silver website.
Table 23-1: 2023 Resources and Reserves for San Vicente
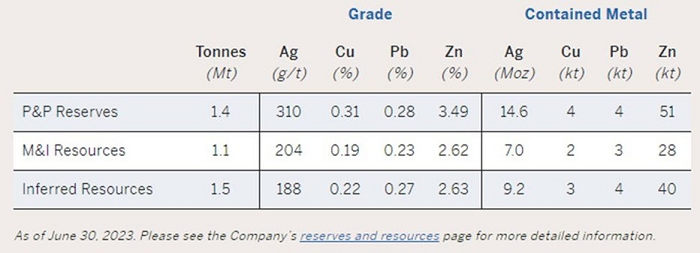
Source: Pan American Website
The QP has been unable to verify the information and that the information is not necessarily indicative of the mineralization on the property that is the subject of the Technical Report.
| SORACAYA PROJECT | NI 43-101 TECHNICAL REPORT | 23-1 |
| |
| 24 | OTHER RELEVANT DATA AND INFORMATION |
There is no other relevant data.
| SORACAYA PROJECT | NI 43-101 TECHNICAL REPORT | 24-1 |
| |
| 25 | INTERPRETATIONS AND CONCLUSIONS |
| 25.1 | Observations |
Regionally, the Paleozoic basement forms anticlines and synclines with preferential north-west orientation. The Soracaya property is located approximately 8 km west of the prominent north-south striking San Vicente thrust fault, which forms the eastern limit of the intermountain Bolivian Altiplano basin. Low-angle faults, parallel to the folded structures, confirm the presence of compressive stresses in an easterly direction and this is the case for the San Vicente fault, which causes the Ordovician sedimentary package to overlie the polymictic conglomerates of the San Vicente formation. As a result of the tensile phases which are reactivated, high-angle, typically mineralized, faulting and veining occurs in an east-west preferential direction.
The lithology comprises an alternation of shale-slate, followed by siltstone-sandstone and finally laminated sandstones. In the extreme west, outcrops of reddish conglomerates are observed, which are in discordant contact with Ordovician rocks bounded by a regional fault called the San Vicente fault.
Structurally, a series of anticlinal and synclinal folds with an almost north-south direction can be observed. The mineralization-filled fractures have a NEE strike and a second system transverse to the former but related to the vicinity of the Soracaya volcanic complex.
The predominant alteration is argillic followed by propylitization and/or chloritization. Alteration in sedimentary rocks is restricted to areas of possible mineralization. Most of the rocks are fresh.
Mineralization in the Soracaya deposit is structurally controlled, while lithological control plays a minimal role. Pre-existing faults, fractures, and zones of weakness served as conduits for the mineralizing solutions. Structural preparation is very important for the passage of mineralizing solutions. From what has been observed in the Project, the control for mineralization is basically structural and probably lithological in the Tuna Rumi sector.
In the deposit, there are two generations of mineralization; Polymetallic mineralization of the Philonian type, i.e. fissure and/or fracture filled with local dissemination of syngenetic pyrite transformed into iron oxides of probably meteoric character, located in the areas of (Potos Orkho, Tuna Rumi, Sud de Tuna Rumi and Cerro Evangelista).
Another low-grade, high-volume mineralization system where mineralization is likely to be in disseminated form, limonitic box work from pyrite and limonitic stockwork; this type of mineralization could be found in Cerro Evangelista and in volcanic breccia that outcrops in the form of a process on the hill (Potos Orkho) and could be important targets for exploration with drilling.
Surface mineralization is represented by oxides such as Limonite, Hematite, Jarosite; Sectors with barite and quartz, are generally observed in the traces of structures and point sectors dissemination of pyrite also related to nearby structures. The structures identified at the surface were recognized at depth as massive structures, branched with pyrite, possibly silver (tetrahedrite) and copper ores within the pyrite mass and chalcopyrite veins.
| SORACAYA PROJECT | NI 43-101 TECHNICAL REPORT | 25-1 |
| |
The Soracaya Project is an “exploration property”. Predecessor companies have performed exploration and deposit expansion drilling of surface and performed underground sampling since 1999 totalling 95 surface drillholes totaling 29,554.3 m and 79 underground channel samples in the database were supplied in electronic format by Santacruz. This included collars, downhole surveys, lithology data and assay data (i.e., Ag g/t, Pb%, Zn%).
Verification of the Soracaya drillhole and underground sample assay database was primarily focused on silver, lead and zinc. Sample databases were supplied in ExcelTM format and in LeapFrogTM. Checks against source data and assay certificates showed agreement. Statistical analyses used to investigate and identify errors were performed and resulted in minor issues. These have been corrected and it is recommended that a continued program of random “spot checking” the database against assay certificates be employed.
During the 2023 site visit, an extensive independent sampling verification plan was implemented with a total of 80 samples collected across from the Bolivar, Porco and Caballo Blanco operations. The Don Diego Laboratory is an NB/ISO/IEC 17025:2018 accredited laboratory which performs all assay analyses for the mining and processing operations for Sinchi Wayra including Bolivar. The Don Diego Laboratory in owned and operated by the Issuer, Santacruz.
Results of the verification samples indicates that the regression predictions perfectly fit the data meaning that the check sampling program successfully verified and validated the data and although, these results are not a complete audit of the laboratory, they do verify that the assay results are suitable for resource estimation purposes.
The geological and lithological solid domain models were supplied by Santacruz in both DatamineTM and LeapFrogTM which are both industry-leading software systems. The QP imported the multiple vein domains into a similar system called MineSightTM to verify solids volumes and ensure matching of the solids domains against the drillhole and sample database. Results confirmed location and extent of volumes are appropriate to resource estimation purposes.
Resource block models were supplied in DatamineTM format which is an industry recognized software system used for resource estimation. These models were then imported to MineSightTM for verification of the resource estimation. In addition, independent estimations were run using the verified sample data and vein domains employing inverse distance estimations to ensure reasonableness and verify the resources independently. Results illustrated good agreement between the original and verification models. Verification of the SG regression analysis was also performed by comparing measured versus calculated density values.
The mineral resources were estimated in conformity with CIM’s “Estimation of Mineral Resources and Mineral Reserves Best Practices Guidelines” (December 2019) and are reported in accordance with NI 43-101 guidelines.
Using a cut-off grade of 10.0 ZnEq, the Soracaya Project resources are presented in Table 25-1.
| SORACAYA PROJECT | NI 43-101 TECHNICAL REPORT | 25-2 |
| |
Table 25-1: Base-Case Total Mineral Resources at 10% ZnEq Cut-off
| Tonnes | ZnEq | Zn | Ag | Pb | Cu | NSR |
| 4,137,000 | 31.62 | 1.23 | 259.76 | 7.23 | 0.09 | 248.82 |
Notes:
| 1) | The current Resource Estimate was prepared by Garth Kirkham, P.Geo., of Kirkham Geosystems Ltd. |
| 2) | All mineral resources have been estimated in accordance with Canadian Institute of Mining and Metallurgy and Petroleum (“CIM”) definitions, as required under National Instrument 43-101 (“NI43-101”). |
| 3) | The Mineral Resource Estimate was prepared using a 10% zinc equivalent cut-off grade. Cut-off grades were derived from $3.65/lb. copper, $21.00/oz silver, $1.15/lb. zinc and $1.00/lb. lead. This cut-off grade was based on current smelter agreements and total OPEX costs of $156.00/t based on 2023 actual costs derived from the Porco mine data, with process recoveries of 70.0% for copper, 80.0% for zinc, 70.0% for lead, and 85% for silver. All prices are stated in $USD. |
| 4) | An Inferred Mineral Resource has a lower level of confidence than that applying to an Indicated Mineral Resource and must not be converted to a Mineral Reserve. It is reasonably expected that the majority of Inferred Mineral Resources could be upgraded to Indicated Mineral Resources with continued exploration. |
| 5) | Mineral resources are not mineral reserves until they have demonstrated economic viability. Mineral resource estimates do not account for a resource’s mineability, selectivity, mining loss, or dilution. All figures are rounded to reflect the relative accuracy of the estimate and therefore numbers may not appear to add precisely. |
The QPs found that the Soracaya Project is a well-managed operation that has exploration potential and should be advanced further.
The methods and procedures are employed using industry-standard techniques and procedures and industry-standard software by diligent and competent professionals.
The area and Santacruz has an ample provision of skilled workers and reasonably good quality equipment.
The mill facility at the Don Diego is well run and the feed and mill operation are well understood by the technical group. The mill equipment appeared to be well maintained during the site visit in 2021.
| 25.2 | Risks |
The Soracaya Project is subject to all the risks normally associated with an operating mine, and some unique to its situation. These include:
| ■ | The current political and socio-economic climate in Bolivia poses risks and uncertainties that could delay or even stop development as reported within the Fraser Institute Annual Report 2022 where Bolivia ranks very low in many non-technical metrics. Bolivia has been ranked consistently low for the past five years and ranks in the lower quartile on all metrics that gauge risk and uncertainty. It is difficult to gauge or qualify the level or extents of the risks however, all companies working in Bolivia must continue to be aware of the potential risks and develop mitigation strategies. A significant risk related to the Santacruz Bolivian mineral assets and in particular the mineral resources and mineral reserves is the significant artisanal activity that continues to exist. This activity is not only a socio-economic risk but also affects access to resources and reserves along with potential sterilization of mineral resources; | |
| ■ | Geological interpretations may be subjective and may result in the location and extent of some of the mineralized structure to change although as the Soracaya Project is comprised of well constrained veins, this risk is minimal; | |
| ■ | As vein thicknesses are narrow, resources may be sensitive to dilution although the relative high grades that exist at the Soracaya Project are successful at mitigating such risks to date; | |
| ■ | Information and data that documents the location and amount of material extracted during colonial times is limited, therefore accounting for lose of this material n the resource is not precise; | |
| ■ | Varying resource classification methods and criteria may vary as more data is considered; |
| SORACAYA PROJECT | NI 43-101 TECHNICAL REPORT | 25-3 |
| |
| ■ | There is no guarantee that further drilling will result in additional resources or increased classification; | |
| ■ | Lower commodity prices could change size and grade of the potential targets; | |
| ■ | Further work may disprove previous models and therefore result in condemnation of targets and potential negative economic outcomes; and | |
| ■ | Maintenance of permits. |
| 25.3 | Opportunities |
Project opportunities include:
| ■ | A systematic exploration program could provide an excellent opportunity for successfully uncovering new discoveries; | |
| ■ | An increased understanding and derivation of alternative theories may result in further discovery and expansion for the Project; | |
| ■ | A hydrogeological study could help the operation to better characterize and understand water inflows, aiding design work and planning to reduce the impact of major seasonal inflows; | |
| ■ | Higher commodity prices will change size and grade of the potential targets; and | |
| ■ | Potential for expansion and classification upgrade of resources as mining activities progress. |
| SORACAYA PROJECT | NI 43-101 TECHNICAL REPORT | 25-4 |
| |
| 26 | RECOMMENDATIONS |
To advance the Soracaya Project and further evaluate the potential additional veins and increase resources thereby displacing depletion due to ongoing mining activities, the following is recommended:
| ■ | Regional exploration for identification of new veins; | |
| ■ | Incorporate structural interpretations to assist regional understanding; | |
| ■ | Review and improve QA/QC program; | |
| ■ | Investigate source of anomalous lead values experienced with the field blanks; | |
| ■ | Incorporate externally certified blanks and standards into the QA/QC program; | |
| ■ | Insert QA/QC samples throughout at a rate of 1 in 20 for blanks, standards and duplicates; | |
| ■ | Analyze thickness and grade-thickness profiles for resource targeting and predictive dilution study; | |
| ■ | Investigate geo-metallurgical characteristics; | |
| ■ | Run a metallurgical program to develop an understanding of the Soracaya mineralization. The program should include the assembly of a composite that is representative of the Soracaya mineralized structures. | |
| ■ | Metallurgical study composed of a testwork program that should include mineralogy, comminution and flotation along with settling and filtration testwork; | |
| ■ | Economic study to test the economic viability of the Soracaya Project to understand sensitivities to varying metal prices, costs, mining and processing methods; | |
| ■ | Hydrogeological study and modelling should be done to better understand water inflows and minimize their impact on production; and | |
| ■ | Extensive surface drilling for near surface targets along with underground drilling for resource delineation and extension. |
These recommendations have not been costed, as they represent changes to current practices that can be funded by existing operating budgets.
| SORACAYA PROJECT | NI 43-101 TECHNICAL REPORT | 26-1 |
| |
| 27 | REFERENCES |
Ahlfeld, F.E. & Schneider-Scherbina, A., 1964. Los yacimientos minerales y de hidrocarburos de Bolivia. Departamento Nacional de Geología (Bolivia) Boletín 5 (Especial), 388 p.
Barrios, Enrique, Dentons Guevara & Gutierrez S.C., 18 March 2022 “Local Counsel Legal Opinion on Empresa Minera San Lucas S.A.”
Barrios, Enrique, Dentons Guevara & Gutierrez S.C., 18 March 2022 “Local Counsel Legal Opinion on Sociedad Minero Metalúrgica Reserva Ltda.”
Barrios, Enrique, Dentons Guevara & Gutierrez S.C., 18 March 2022 “Local Counsel Legal Opinion on Sociedad Minera Illapa S.A.”
Barrios, Enrique, Dentons Guevara & Gutierrez S.C., 18 March 2022 “Local Counsel Legal Opinion on Sinchi Wayra S.A.”
Barrios, Enrique, Dentons Guevara & Gutierrez S.C., 18 March 2022 “Local Counsel Legal Opinion on the Illapa Joint Venture”
Cunningham, C. G., Aparicio, H., Murillo, F., Jimenez, N., Lizeca, J. L., Ericksen, G. E. & Tavera, F., 1993. The Porco, Bolivia, Ag-Zn-Pb-Sn deposit is along the ring fracture of the newly recognized Porco caldera. GSA Abstracts with Programs, Vol. 25, No. 5, p. 26.
Cunningham, C. G., Aparicio, H., Murillo, F., Jiménez, N., Lizeca, J. L., McKee, E. H., Ericksen, G. E. & Tavera, F., 1994a. The relationship between the Porco, Bolivia, Ag-Zn-Pb-Sn Deposit and the Porco Caldera. U.S. Geological Survey, Open-File Report 94-238, p. 19.
Cunningham, C. G., Aparicio, H., Murillo, F., Jiménez, N., Lizeca, J. L., McKee, E. H., Ericksen, G. E. & Tavera, F., 1994b. Relationship between the Porco, Bolivia, Ag-Zn-Pb-Sn Deposit and the Porco Caldera. Economic Geology, Vol. 89, p. 1833-1841.
Cunningham, C.G., Zartman, R.E., McKee, E.H., Rye, R.O., Naeser, C.W., Sanjines, V.O., Ericksen, G.E. and Tavera, V.F., 1996. The age and thermal history of Cerro Rico de Potosí, Bolivia. Mineralium Deposita, v. 31, p. 374-385.
Francis, P.W., Baker, M.C.W. & Halls, C., 1981. The Kari caldera, Bolivia, and the Cerro Rico stock. Journal of Volcanology and Geothermal Research, v. 10, p. 113-124.
Glencore, 2020. Reported reserves and resources are based on Glencore’s Resources & Reserves report as of 31 December 2020: https://www.glencore.com/dam/jcr:3c05a365-e6ae-4c1a-9439- 960249a42e35/GLEN_2020_Resources_reserves_report.pdf
Glencore - Summary of Mobile Mining Equipment – August 2021 – Excel Spreadsheet
Glencore - Sustainability Report, 2019, Sinchi Wayra S.A. / Illapa S.A.- Glencore Internal Document
| SORACAYA PROJECT | NI 43-101 TECHNICAL REPORT | 27-1 |
| |
HSEC Assurance Report, December 2020, Zinc, Sinchi Wayra, Bolivia – Tailing Storage Facilities, Verification 3 Assessment – Glencore Internal Document
Jiménez, N., Sanjinés, O., Cunningham, Ch., Lizeca, J.L., Aparicio, H., McKee, E., Tavera, F. & Ericksen, G., 1998, La Caldera resurgente de Porco y su relación con la mineralización de Ag-Zn-Pb. Memorias del XI Congreso Geológico de Bolivia, Tarija, p.132-146.
Kato, J. J., 2013. Geochemistry of the Neogene Los Frailes Ignimbrite Complex on the Central Andean Altiplano Plateau. Unpublished MSc thesis, Cornell University, xiv + 173 p.
Kato, J. J., Kay, S. M., Coira, B. L., Jicha, B. R., Harris, C., Caffe, P. J. & Jimenez, N., 2014. Evolution and Geochemistry of the Neogene Los Frailes Ignimbrite Complex on the. Bolivian Altiplano Plateau. XIX Congreso Geológico Argentino, Córdoba, Argentina, June 2014, abstract S24-3-6.
Kay, S. M., Kato, J. J., Coira, B. L. & Jimenez, N., 2018. Isotopic and Geochemical Signals of the Neogene Los Frailes Volcanic Complex as Recorders of Delamination and Lower Crustal Flow under the Southern Altiplano of the Central Andes. 11th South American Symposium on Isotope Geology, Cochabamba, Bolivia, 22-25 July 2018, abstract.
Kirkham, G., Crowie, T. and Corso, W. 2021. JDS “NI43-101 Technical Report, Soracaya Project, Oruro State, Bolivia” dated December 21, 2021.
Ludington, S., Orris, G.J., Cox, D.P., Long, K.R. & Asher-Bolinder, S., 1992. Mineral deposit models. In USGS-Geobol, Geology and Mineral Resources of the Altiplano and Cordillera Occidental, Bolivia. USGS Bulletin 1975, p. 63-89.
Mina Bolivar - Determinación De Volúmenes Explotados Y Volúmenes Planificados Rajos Sls (Dilución Externa) Informe Parcial - Junio 2021 – Soracaya Project Internal Technical Services Study
Redwood, S. D., 1993. The Metallogeny of the Bolivian Andes. Mineral Research Unit, Short Course No. 15. UBC, Vancouver, B.C., Canada, 59 p.
Rice, C.M., Steele, G.B., Barfod, D., Boyce, A.J., and Pringle, M.S., 2005. Duration of magmatic, hydrothermal and supergene activity at Cerro Rico de Potosí, Bolivia. Economic Geology, v. 100, p. 1647-1656.
Sinchi Wayra S.A. - BO Site Oct-2020. Soracaya Project Site Presentation – Microsoft PowerPoint
Schneider, A., 1985. Eruptive processes, mineralization and isotopic evolution of the Los Frailes Kari Region, Bolivia. Unpublished Ph.D. thesis, Royal School of Mines, Imperial College, University of London, London, 290p.
Schneider, A., 1987. Eruptive processes, mineralization and isotopic evolution of the Los Frailes-Kari Kari region, Bolivia. Revista Geológica de Chile, v. 30, p. 27-33.
Schneider, A., & Halls, C., 1985. Chronology of eruptive processes and mineralization of the Frailes - Kari volcanic field, Eastern Cordillera, Bolivia. Comunicaciones, Departamento de Geología, University of Chile, Santiago, v. 35, p. 217-224.
| SORACAYA PROJECT | NI 43-101 TECHNICAL REPORT | 27-2 |
| |
Sillitoe, R. H., Halls, C. & Grant, J. N., 1975. Porphyry tin deposits in Bolivia. Economic Geology, Vol. 70, p. 913-927.
Silver Belt – Management Presentation Bolivia V10 - Microsoft PowerPoint - Sinchi Wayra S.A.
Sugaki, A., Ueno, H., Shimada, N., Kitakaze, A., Hayashi, K., Shima, H., Sanjines, O. & Saavedra, A., 1981a. Geological study on polymetallic ore deposits in the Oruro district, Bolivia. Science Reports of the Tohoku University, Series III, Vol. 15, p. 1-52.
Sugaki, A., Ueno, H. & Saavedra, A., 1981b. Mineralization and Mineral Zoning in the Avicaya and Bolivar Mining District, Bolivia. Science Reports of the Tohoku University, Series III, Vol. 15, p. 53-64.
Sugaki, A., Ueno, H., Shimada, N., Kusachi, I., Kitakaze, A., Hayashi, K., Kojima, S. & Sanjines, O., 1983. Geological study on the polymetallic ore deposits in the Potosí district, Bolivia. Science Reports of the Tohoku University, Series III, Vol. 15, p. 409-460.
Sugaki, A., Shimada, N., Ueno, H. & Kano, S., 2003. K-Ar Ages of Tin-Polymetallic Mineralization in the Oruro Mining District, Central Bolivian Tin Belt. Resource Geology, Vol. 53, p. 273-282.
Wafforn, M., Steinmann, M., Delgado, A., 2024. Technical Report for San Vicente Property, Potosí, Bolivia effective date December 31, 2014.
Zartman, R.E., & Cunningham, C.G., 1995. U-Th-Pb zircon dating of the 13.8 Ma dacite volcanic dome at Cerro Rico de Potosí, Bolivia. Earth and Planetary Science Letters, v. 133, p. 227-237.
| SORACAYA PROJECT | NI 43-101 TECHNICAL REPORT | 27-3 |
| |
| 28 | UNITS OF MEASURE, ABBREVIATIONS, ACRONYMS, AND GLOSSARY OF SPANISH TERMS |
| Symbol / Abbreviation | Description |
| ° | degree |
| $ | United States Dollars |
| $M | One Million United States Dollars |
| °C | degrees Celsius |
| µm | micrometres |
| 3D | three-dimensions |
| a | annum (year) |
| ACAD | AutoCAD™, a commercially produced design software by Autodesk |
| Ag | silver |
| amsl | above mean sea level |
| Au | gold |
| Bi | bismuth |
| Ca | calcium |
| CAPEX | Capital expense |
| cfm | cubic feet per minute |
| CIM | Canadian Institute of Mining, Metallurgy and Petroleum |
| cm | centimetre |
| cm2 | square centimetre |
| cm3 | cubic centimetre |
| CIBC | Canadian Imperial Bank of Commerce |
| CIT | Corporate income tax |
| COMIBOL | Bolivian Government owned mining company; joint venture partner to Santacruz through the Illapa JV |
| CQA | Quality Assurance (for tailings disposal) |
| CQC | Quality control management (for tailings disposal) |
| Cu | copper |
| CV | Coefficient of Variation |
| DAA | Declaration of Environmental Adequacy |
| DMT | Dry metric tonnes |
| E | East |
| EBIT | Earnings before interest and taxes |
| EIA | Environmental Impact Assessment |
| ENDE | National Electricity Company (Bolivia) |
| ft3 | cubic foot |
| g | gram |
| SORACAYA PROJECT | NI 43-101 TECHNICAL REPORT | 28-1 |
| |
| Symbol / Abbreviation | Description |
| G&A | general and administrative |
| g/t | grams per tonne |
| hp | horsepower |
| HSEC | health, safety, environment and community |
| IDW | Inverse distance weighting |
| JDS | JDS Energy & Mining Inc. |
| JORC | Australasian Joint Ore Reserves Committee |
| JV | Joint venture |
| kg | kilogram |
| km | kilometre |
| km/h | kilometres per hour |
| kPa | kilopascal |
| kt | kilotonne |
| kV | kilovolt |
| kVA | kilovolt-ampere |
| kW | kilowatt |
| L | litre |
| L/min | litres per minute |
| L/s | litres per second |
| LOM | life of mine |
| m | metre |
| M | million |
| Ma | million years |
| masl | metres above sea level |
| mm | millimetre |
| Mm3 | Millions of cubic metres |
| MPa | megapascal |
| Mt | million metric tonnes |
| MW | megawatt |
| N | north |
| NI 43-101 | National Instrument 43-101 |
| NSR | net smelter return |
| OPEX | Operating cost |
| oz | troy ounce |
| OK | Ordinary kriging |
| P.Eng. | Professional engineer (a Canadian designation) |
| P.Geo. | Professional Geologist (a Canadian designation) |
| Pb | lead |
| ppm | parts per million |
| SORACAYA PROJECT | NI 43-101 TECHNICAL REPORT | 28-2 |
| |
| Symbol / Abbreviation | Description |
| PVC | Polymerization of vinyl chloride (a plastic) |
| QA/QC | quality assurance/quality control |
| QP | qualified person |
| RMR | rock mass rating |
| S | South |
| SAG | Semi-autogenous grinding |
| SAMREC | South African Code for the Reporting of Exploration Results |
| Sb | Antimony |
| SDG | Sustainable development goals |
| SG | specific gravity |
| Sn | selenium |
| t | metric tonne |
| t/d | tonnes per day |
| t/m3 | Tonnes per cubic metre |
| TSF | tailings storage facility |
| UTM | universal transverse mercator |
| V | volt |
| W | west |
| Zn | zinc |
| ZnEq | Zinc equivalent (other payable metal values have been converted to the same value of zinc metal) |
| Glossary | |
| Spanish Term | English Translation |
| 1er | primary |
| 2do | secondary |
| Acceso | Sublevel access |
| Aire limpio | Fresh air |
| Aire viciado | Exhaust |
| Altura de banco | Bench height |
| Ancho | Width |
| Ángulo | Dip |
| Bomba estacionaria | Stationary pump |
| Bomba sumergible | Submersible pump |
| Bombeo | pumping |
| Buzon | Ore bin |
| Cara libre | Free face |
| Chimenea | Raise |
| SORACAYA PROJECT | NI 43-101 TECHNICAL REPORT | 28-3 |
| |
| Glossary | |
| Spanish Term | English Translation |
| Chimenea de ventilacion | Ventilation raise |
| Circuito | circuit |
| Desarollos | Development |
| Dique de colas | TSF |
| Direccion de tumbe | Ore mining direction |
| Etapa | Stage |
| Exploración | Exploration |
| Filtracion | filtration |
| Flotacion | flotation |
| Flujograma | Flowsheet |
| Galería | Drift (gallery), classified as Superior (main) and Inferior (secondary) |
| Ingeniera | Engineering |
| Ingreso rampa | Portal |
| Mantenimiento | Maintenance |
| Media ambiente | environment |
| Mina | mine |
| Nivel | Level |
| Perforación | drilling |
| Planta Concentradora | Processing Plant |
| Plomo | lead |
| Puente | Pillar |
| Red de bombeo | Pumping system |
| Relleno | Backfill |
| Seccion longitudinal | Long section |
| Seccion transversal | Cross section |
| Seguridad | Security |
| Sistema | System |
| Subnivel | Sublevel |
| Subnivel de relleno | Backfill drift |
| Taladros | Drillholes |
| Taza de bombeo | Water storage pond |
| Ventilador | Fan |
| Veta | Vein |
| Zonas explotadas | Mined zones |
| SORACAYA PROJECT | NI 43-101 TECHNICAL REPORT | 28-4 |