Exhibit 99.46
NI 43-101 TECHNICAL REPORT ON THE
MINERAL RESOURCES OF THE
NUSSIR AND ULVERYGGEN PROJECTS, NORWAY
Prepared for
Blue Moon Metals Inc.
by
Qualified Person:
Adam Wheeler, B.Sc, M.Sc, C. Eng., Eur Ing., FIMMM
Effective Date of Resources: 20th January 2025
Effective Date of Report: 24th January 2025 (as amended and restated on 12 September 2025)
Adam Wheeler,
Mining Consultant, C. Eng, Eur Ing,, FIMMM
Cambrose Farm,
Redruth,
Cornwall, TR16 4HT,
England.
| September 2025 |
| Technical Report on the Mineral Resources of the Nussir and Ulveryggen Projects | 2 |
QUALIFIED PERSONS CERTIFICATE
Certificate Of Author
Adam Wheeler, Mining Consultant,
Cambrose Farm, Redruth, Cornwall, TR16 4HT, England.
Tel/Fax: (44) 1209-899042; E-mail: adamwheeler@btinternet.com
As the author of this “Technical Report on the Mineral Resources of the Nussir and Ulveryggen Projects, Norway”, I, A. Wheeler do hereby certify that:
| 1. | I am an independent mining consultant, based at Cambrose Farm, Redruth, Cornwall, TR16 4HT, England. |
| 2. | I hold the following academic qualifications:- |
| B.Sc. (Mining) | Camborne School of Mines | 1981 | |
| M.Sc. (Mining Engineering) | Queen’s University (Canada) | 1982 |
| 3. | I am a registered Chartered Engineer (C. Eng and Eur. Ing) with the Engineering Council (UK). Reg. no. 371572. |
| 4. | I am a professional fellow (FIMMM) in good standing of the Institute of Materials, Minerals and Mining. |
| 5. | I have worked as a mining consultant in the minerals industry for over 40 years. I have worked on over 50 different projects involving geological modelling, exploration drillhole layout or resource estimation. These projects have covered 35 different countries, and 25 of them have involved me as an QP for either 43-101 or JORC reports. Twenty of these projects have been related to copper. I have been working on the Nussir project since 2007 and the Ulveryggen project since 2010, involved with exploration drillhole layout, geological modelling and resource estimation. |
| 6. | I have read NI 43-101 and the technical report, which is the subject of this certificate, has been prepared in compliance with NI 43-101. By reason of my education, experience and professional registration, I fulfil the requirements of a “qualified person” as defined by NI 43-101. My work experience includes 5 years at an underground gold mine, 7 years as a mining engineer in the development and application of mining and geological software, and 30 years as an independent mining consultant, involved with geological modelling, exploration drill hole layout, resource and reserve estimation, evaluation and planning projects for both open pit and underground mining projects. |
| 7. | I am responsible for the preparation of the technical report titled “Technical Report on the Mineral Resources of the Nussir and Ulveryggen Projects, Norway”, and dated January 25th, 2025. I visited the project property on 2/7/2007 – 4/7/2007, 14/6/2010 – 16/6/2010, 22/9/2014 – 24/9/2014 and 14/1/2025 – 16/1/2025. The visits before 2024 were part of my prior involvement with Nussir as an independent contractor, related to previous resource estimation exercises for the Nussir and Ulveryggen projects. |
| 8. | As of the date hereof, to the best of the my knowledge, information and belief, the technical report, which is the subject of this certificate, contains all scientific and technical information that is required to be disclosed to make such a technical report not misleading. |
| Adam Wheeler | September 2025 |
| Technical Report on the Mineral Resources of the Nussir and Ulveryggen Projects | 3 |
| 9. | I am independent of the Issuer and related companies applying all of the tests of Section 1.5 of NI 43-101. |
| 10. | I have read the National Instrument and Form 43-101F1 (the “Form”) and the Technical Report has been prepared in compliance with the Instrument and the Form. |
DATE AND SIGNATURES PAGE
Herewith, my report entitled “Technical Report on the Mineral Resources of the Nussir and Ulveryggen Projects, Norway”, dated January 24, 2025 (as amended and restated on September 12, 2025).
| (signed and sealed) "Adam Wheeler" | |||
| A. Wheeler, C.Eng., Eur. Ing. FIMMM | Dated the 12th of September 2025 |
| Adam Wheeler | September 2025 |
| Technical Report on the Mineral Resources of the Nussir and Ulveryggen Projects | 4 |
TABLE OF CONTENTS
| Page | ||
| QUALIFIED PERSONS CERTIFICATE | 2 | |
| 1 | SUMMARY | 12 |
| 1.1 | Overview | 12 |
| 1.2 | Ownership | 12 |
| 1.3 | Geology | 12 |
| 1.4 | Database and Resource Estimation | 13 |
| 1.5 | Exploration Status | 14 |
| 1.6 | Mineral Resource Estimation | 15 |
| 1.7 | Results and Interpretations | 16 |
| 1.7.1 | Exploration Targets – Nussir deposit | 16 |
| 1.7.2 | Exploration Targets – Ulveryggen deposit | 17 |
| 1.7.3 | Double Mineralised Intersections – Nussir deposit | 17 |
| 1.7.4 | Inferred Resource Conversion – Nussir deposit | 17 |
| 1.7.5 | Inferred Resource Conversion – Ulveryggen deposit | 17 |
| 1.8 | Conclusions | 18 |
| 1.9 | Recommendations | 18 |
| 1.9.1 | Sample Preparation, Analyses, and Security | 18 |
| 1.9.2 | Data Verification | 19 |
| 1.9.3 | Further Studies | 19 |
| 1.9.4 | Exploration Program and Budget | 20 |
| 2 | INTRODUCTION | 21 |
| 2.1 | Author | 21 |
| 2.2 | Terms of Reference | 21 |
| 2.3 | Units and Currency | 22 |
| 3 | RELIANCE ON OTHER EXPERTS | 22 |
| 3.1 | Ownership | 22 |
| 3.2 | Taxes | 22 |
| 4 | PROPERTY DESCRIPTION AND LOCATION | 23 |
| 4.1 | Location | 23 |
| 4.2 | Licenses | 24 |
| 4.3 | Fees and Royalties | 27 |
| 4.4 | Environmental Liabilities | 27 |
| 5 | ACCESSIBILITY, CLIMATE, LOCAL RESOURCES, INFRASTRUCTURE and PHYSIOGRAPHY | 28 |
| 5.1 | Accessibility | 28 |
| 5.2 | Site Description | 28 |
| 5.3 | Climate | 28 |
| 5.4 | Local Resources | 29 |
| 5.5 | Infrastructure | 29 |
| 5.6 | Power Supply | 30 |
| 5.7 | Water Supply | 30 |
| 6 | HISTORY | 31 |
| 6.1 | Nussir | 31 |
| 6.1.1 | Initial Exploration | 31 |
| 6.1.2 | Geophysical surveys | 31 |
| 6.2 | Ulveryggen | 36 |
| 6.2.1 | Initial Exploration and Historical Open Pit Mining | 36 |
| 6.2.2 | Geophysical survey | 36 |
| 6.2.3 | Structural Mapping and Field XRF Analyses | 39 |
| 6.2.4 | Stream Sediment Sampling | 42 |
| 6.3 | Historical Mineral Resources | 42 |
| 7 | GEOLOGICAL SETTING AND MINERALISATION | 44 |
| 7.1 | Nussir | 44 |
| 7.1.1 | Regional Geology- Nussir | 44 |
| 7.1.2 | Local Geology and Mineralisation - Nussir | 46 |
| 7.2 | Ulveryggen | 47 |
| 7.2.1 | Regional Geology - Ulveryggen | 47 |
| 7.2.2 | Local Geology and Mineralisation - Ulveryggen | 47 |
| Adam Wheeler | September 2025 |
| Technical Report on the Mineral Resources of the Nussir and Ulveryggen Projects | 5 |
| 8 | DEPOSIT TYPE | 52 |
| 8.1 | Background | 52 |
| 8.2 | Nussir | 52 |
| 8.3 | Ulveryggen | 52 |
| 9 | EXPLORATION | 53 |
| 10 | DRILLING | 53 |
| 10.1 | Nussir | 53 |
| 10.2 | Ulveryggen | 61 |
| 11 | SAMPLE PREPARATION, ANALYSIS AND SECURITY | 68 |
| 11.1 | Nussir | 68 |
| 11.1.1 | 1984 to 1996 | 68 |
| 11.1.2 | Terra Control/Nussir ASA 2006 to 2019 | 68 |
| 11.1.3 | Quality Assurance/ Quality Control | 70 |
| 11.1.4 | Density Measurements | 89 |
| 11.1.5 | Summary | 89 |
| 11.2 | Ulveryggen | 89 |
| 11.2.1 | Sample Preparation and Analysis | 89 |
| 11.2.2 | Quality Assurance/ Quality Control | 91 |
| 11.3 | Core and Sample Storage | 98 |
| 11.4 | Overview | 98 |
| 12 | DATA VERIFICATION | 99 |
| 12.1 | Site Visits | 99 |
| 12.2 | Drillhole Data | 102 |
| 12.2.1 | Collar Data | 102 |
| 12.2.2 | Drillhole Core | 105 |
| 12.3 | Database | 105 |
| 12.4 | Overview | 108 |
| 13 | MINERAL PROCESSING AND METALLURGICAL TESTING | 109 |
| 13.1 | Overview | 109 |
| 13.2 | Variability and Hardness Testing | 112 |
| 13.3 | Locked Cycle Testing | 113 |
| 13.4 | Material Sorting Studies | 114 |
| 14 | MINERAL RESOURCE ESTIMATE | 115 |
| 14.1 | Nussir | 115 |
| 14.1.1 | Data Collation | 115 |
| 14.1.2 | Interpretation | 117 |
| 14.1.3 | Exploratory Data Analysis | 121 |
| 14.1.4 | Compositing | 124 |
| 14.1.5 | Geostatistics | 125 |
| 14.1.6 | Volumetric Modelling | 128 |
| 14.1.7 | Density | 132 |
| 14.1.8 | Grade Estimation | 134 |
| 14.1.9 | Resource Classification | 137 |
| 14.1.10 | Model Validation | 142 |
| 14.1.11 | Resource Evaluation | 144 |
| 14.2 | Ulveryggen | 149 |
| 14.2.1 | Data Collation | 149 |
| 14.2.2 | Interpretation | 150 |
| 14.2.3 | Exploratory Data Processing | 153 |
| 14.2.4 | Compositing | 156 |
| 14.2.5 | Geostatistics | 158 |
| 14.2.6 | Volumetric Modelling | 159 |
| 14.2.7 | Grade Estimation | 159 |
| 14.2.8 | Density | 162 |
| 14.2.9 | Resource Classification | 163 |
| 14.2.10 | Model Validation | 165 |
| 14.2.11 | Resource Evaluation | 167 |
| 15 | MINERAL RESERVE ESTIMATES | 169 |
| 16 | MINING METHODS | 169 |
| 17 | RECOVERY METHODS | 169 |
| Adam Wheeler | September 2025 |
| Technical Report on the Mineral Resources of the Nussir and Ulveryggen Projects | 6 |
| 18 | PROJECT INFRASTRUCTURE | 169 |
| 19 | MARKET STUDIES AND CONTRACTS | 169 |
| 20 | ENVIRONMENTAL STUDIES, PERMITTING AND SOCIAL IMPACT | 169 |
| 21 | CAPITAL AND OPERATING COSTS | 169 |
| 22 | ECONOMIC ANALYSIS | 169 |
| 23 | ADJACENT PROPERTIES | 170 |
| 24 | OTHER RELEVANT DATA AND INFORMATION | 172 |
| 25 | INTERPRETATION AND CONCLUSIONS | 172 |
| 25.1 | Risks and Uncertainties | 172 |
| 25.1.1 | Drillholes | 172 |
| 25.1.2 | Density Measurements | 172 |
| 25.1.3 | Rejects/Pulps Inventory | 172 |
| 25.1.4 | Historic QA/QC Procedures | 173 |
| 25.1.5 | Fault Zones - Nussir | 173 |
| 25.1.6 | Structural Modelling - Nussir | 173 |
| 25.2 | Results and Interpretations | 174 |
| 25.2.1 | Exploration Targets - Nussir | 174 |
| 25.2.2 | Exploration Targets - Ulveryggen | 174 |
| 25.2.3 | Double Mineralised Intersections – Nussir deposit | 175 |
| 25.2.4 | Inferred Resource Conversion – Nussir deposit | 175 |
| 25.3 | Conclusions | 176 |
| 26 | RECOMMENDATIONS | 178 |
| 26.1 | Sample Preparation, Analyses, and Security | 178 |
| 26.2 | Data Verification | 179 |
| 26.3 | Further Studies | 179 |
| 26.4 | Exploration Program and Budget | 180 |
| 27 | REFERENCES | 181 |
| APPENDICES | ||
| A | Geostatistical Plots - Nussir | |
| Adam Wheeler | September 2025 |
| Technical Report on the Mineral Resources of the Nussir and Ulveryggen Projects | 7 |
| LIST OF TABLES | |
| Page | |
| Table 1-1. Nussir Resource Estimation Summary | 15 |
| Table 1-2. Ulveryggen Resource Estimation Summary | 16 |
| Table 1-3. Proposed Exploration Budget | 20 |
| Table 4-1. Summary of License Areas - Nussir | 25 |
| Table 4-2. Summary of License Areas – Ulveryggen | 25 |
| Table 10-1. Summary of Collar Positioning Systems – Nussir | 54 |
| Table 10-2. Nussir Diamond Drilling Summary | 55 |
| Table 10-3. Nussir Drillhole Collars, 1985-2011 | 56 |
| Table 10-4. Nussir Drillhole Collars, 2013-2019 | 57 |
| Table 10-5. Nussir – Main Drillhole intersections, 1985-2011 | 58 |
| Table 10-6. Nussir – Main Drillhole intersections, 2013-2019 | 59 |
| Table 10-7. Ulveryggen Drilling Summary | 61 |
| Table 10-8. Ulveryggen Drillhole Collars – Underground Drill Holes | 62 |
| Table 10-9. Ulveryggen Drillhole Collars – Surface Drill Holes | 63 |
| Table 10-10. Summary of Main Intersections- Ulveryggen (1 of 2) | 64 |
| Table 10-11. Summary of Main Intersections- Ulveryggen (2 of 2) | 65 |
| Table 11-1. Summary of Reassay Cu Analysis - 2008 | 70 |
| Table 11-2. Summary of 2011 Nussir Cu Check Assay Analysis | 72 |
| Table 11-3. Summary of 2011 ALS Internal Duplicates | 73 |
| Table 11-4. Summary of Internal Coarse Duplicates - 2013 | 73 |
| Table 11-5. External Duplicates’ Summary – 2013 | 75 |
| Table 11-6. Summary of QAQC Samples – 2014 and 2015 | 76 |
| Table 11-7. Summary of QAQC Samples – 2017 | 79 |
| Table 11-8. Precision Analysis – Field Duplicates - 2017 | 79 |
| Table 11-9. Precision Analysis – Pulp Duplicates - 2017 | 80 |
| Table 11-10. Standards’ Results Summary and Global Accuracy - 2017 | 82 |
| Table 11-11. Summary of QAQC Samples – 2019 | 84 |
| Table 11-12. Summary of Sample Standards | 89 |
| Table 11-13. Summary of QAQC Samples – 2014 and 2015 | 91 |
| Table 11-14. Summary of Standards Used for Ulveryggen | 91 |
| Table 11-15. Summary of QAQC Samples – 2017 | 94 |
| Table 11-16. Precision Analysis – Field Duplicates - 2017 | 95 |
| Table 11-17. Precision Analysis – Pulp Duplicates - 2017 | 95 |
| Table 11-18. Standards’ Results Summary and Global Accuracy - 2017 | 97 |
| Table 11-19. Summary of Core Inventories | 98 |
| Table 11-20. Summary of Analytical Laboratories | 98 |
| Table 12-1. Summary of Horizontal Displacements - Azimuth Differences – Nussir | 102 |
| Table 12-2. Summary of Collars’ Elevation Differences with LiDAR - Nussir | 103 |
| Table 12-3. Summary of Collars’ Elevation Differences with LiDAR – Ulveryggen | 104 |
| Table 13-1. Summary of Nussir Composite Metallurgical Samples | 109 |
| Table 13-2. Assay Breakdown of Nussir Composite Metallurgical Samples | 110 |
| Table 13-3. Variability Samples Head Assays | 112 |
| Table 13-4. Nussir Deposit Grindability Statistics | 112 |
| Table 13-5. Locked Cycle and Open Circuit Test Results Summary | 114 |
| Table 14-1. Holes and Cu Sample Data Summary - Nussir | 116 |
| Adam Wheeler | September 2025 |
| Technical Report on the Mineral Resources of the Nussir and Ulveryggen Projects | 8 |
| Table 14-2. Sample Statistics – Nussir | 121 |
| Table 14-3. Summary of Top-Cuts Applied – Nussir | 121 |
| Table 14-4. Composite Statistics – Nussir | 124 |
| Table 14-5. Model Variogram Parameters – Nussir | 127 |
| Table 14-6. Model Prototype Definitions - Nussir | 131 |
| Table 14-7. Statistical Summary of Density Measurements - Nussir | 132 |
| Table 14-8. Statistical Summary of Composite Densities - Nussir | 132 |
| Table 14-9. Grade Estimation Parameters – Nussir | 134 |
| Table 14-10. Conditional Simulation Results for Nussir | 140 |
| Table 14-11. Resource Classification Criteria - Nussir | 140 |
| Table 14-12. Global Comparison of Grades – Nussir | 142 |
| Table 14-13. MSO Parameters – Nussir | 144 |
| Table 14-14. Average Resource True Thickness | 144 |
| Table 14-15. Cut-Off Grade Calculation | 145 |
| Table 14-16. Copper-Equivalent Calculations | 145 |
| Table 14-17. Grade-Tonnage Table – Measured and Indicated Resources Only | 146 |
| Table 14-18. Constrained Resource Evaluation Statement – Nussir deposit | 147 |
| Table 14-19. Sample Data Summary - Ulveryggen | 149 |
| Table 14-20. Summary of Selected Samples - Ulveryggen | 153 |
| Table 14-21. Cu Sample Statistics - Ulveryggen | 154 |
| Table 14-22. Decile Analysis of Selected Samples >0.3% Cu, - Ulveryggen | 155 |
| Table 14-23. Summary of 2.5m Composites - Ulveryggen | 156 |
| Table 14-24. Composite Statistics – Ulveryggen | 156 |
| Table 14-25. Model Variogram Parameters - Ulveryggen | 158 |
| Table 14-26. Model Prototype - Ulveryggen | 159 |
| Table 14-27. Grade Estimation Parameters - Ulveryggen | 161 |
| Table 14-28. Summary of Density Measurements - Ulveryggen | 162 |
| Table 14-29. Resource Classification System - Ulveryggen | 163 |
| Table 14-30. Global Comparison of Cu Grades - Ulveryggen | 165 |
| Table 14-31. MSO Parameters - Ulveryggen | 167 |
| Table 14-32. Resource Evaluation Summary – Ulveryggen | 168 |
| Table 14-33. Grade-Tonnage Table - Indicated Resources Only- Ulveryggen | 168 |
| Table 25-25-1. Nussir Resource Estimation Summary | 177 |
| Table 25-25-2. Ulveryggen Resource Estimation Summary | 178 |
| Table 26-1. Proposed Budget | 180 |
| Adam Wheeler | September 2025 |
| Technical Report on the Mineral Resources of the Nussir and Ulveryggen Projects | 9 |
| LIST OF FIGURES | |
| Page | |
| Figure 4-1. Area Map of West Finnmark | 23 |
| Figure 4-2. Plan of License Areas | 26 |
| Figure 6-1. Geophysical Signature of the Nussir West Area | 33 |
| Figure 6-2. Structural Interpretation of Nussir West Area | 34 |
| Figure 6-3. Profile Plot of Inverse of Apparent Resistivity, Hz 34133 | 35 |
| Figure 6-4. Flight Lines of Geophysical Survey Lines, South of Repparfjord | 37 |
| Figure 6-5. Plan of Magnetic Total Field Results | 38 |
| Figure 6-6. Plan of Structural Observation Localities | 39 |
| Figure 6-7. View to NE of Hovedfelt Northeastern Face | 40 |
| Figure 6-8. Cu Analyses Along lower NE wall at Hovedfelt | 41 |
| Figure 6-9. Identified Exploration Targets | 42 |
| Figure 7-1. Nussir Geological Map | 45 |
| Figure 7-2. John Open Pit, Looking SW | 48 |
| Figure 7-3. Erik Open Pit Looking N | 49 |
| Figure 7-4. Hovedfelt Open pit, NE part, looking NE | 49 |
| Figure 7-5. NW-dipping Mineralisation in Erik Open Pit | 50 |
| Figure 7-6. Plan of Deposit Area and Main Tectonic Features | 51 |
| Figure 7-7. Section of Simplified Tectonic Framework | 51 |
| Figure 10-1. Plan of Drill Holes – Nussir | 60 |
| Figure 10-2. Example Drill Hole Cross-Sections – Nussir | 60 |
| Figure 10-3. Plan of Drillholes and Mineralised Zones - Ulveryggen | 66 |
| Figure 10-4. 3D View of Drillholes Looking NE - Ulveryggen | 66 |
| Figure 10-5. Plan of Drill Holes | 67 |
| Figure 10-6. Example Drill Hole Sections | 67 |
| Figure 11-1. Nussir - Reassayed Grade Comparison | 70 |
| Figure 11-2. Check Assay Scatterplot – 2009 Campaign | 71 |
| Figure 11-3. ALS Internal Duplicate Assays – 2011 Drilling Campaign | 72 |
| Figure 11-4. Internal Coarse Cu Duplicates - 2013 | 73 |
| Figure 11-5. Blanks’ Results – 2013 | 74 |
| Figure 11-6. External Duplicates – 2013 | 74 |
| Figure 11-7. Standards’ Results - 2013 | 75 |
| Figure 11-8. 2015 Field Duplicates – Precision Analysis | 77 |
| Figure 11-9. Pulp Duplicates’ Analyses – 2014 and 2015 | 77 |
| Figure 11-10. External Duplicates’ Analyses – 2014 and 2015 | 78 |
| Figure 11-11. Blanks’ Analyses – 2014 and 2015 | 78 |
| Figure 11-12. Precision Analysis – Field Duplicates - 2017 | 79 |
| Figure 11-13. Precision Analysis – Coarse Duplicates - 2017 | 80 |
| Figure 11-14. Precision Analysis – Pulp Duplicates - 2017 | 80 |
| Figure 11-15. Standard Analyses’ Graphs – Cu% - 2017 | 81 |
| Figure 11-16. Coarse Blanks’ Assays - 2017 | 83 |
| Figure 11-17. Field Duplicates’ Results -2019 | 85 |
| Figure 11-18. Coarse Duplicates’ Results -2019 | 85 |
| Figure 11-19. Pulp Duplicates’ Results -2019 | 86 |
| Figure 11-20. Coarse Blanks’ Results – 2019 | 86 |
| Figure 11-21. Standard 910-11 Results 2017-2019 | 87 |
| Figure 11-22. Standard 310-1 Results 2017-2019 | 87 |
| Adam Wheeler | September 2025 |
| Technical Report on the Mineral Resources of the Nussir and Ulveryggen Projects | 10 |
| Figure 11-23. External Check Sample Results – 2019 | 88 |
| Figure 11-24. 2015 Field Duplicates – Precision Analysis | 92 |
| Figure 11-25. Pulp Duplicates’ Analyses – 2014 and 2015 | 92 |
| Figure 11-26. External Duplicates’ Analyses – 2014 and 2015 | 93 |
| Figure 11-27. Blanks’ Analyses – 2014 and 2015 | 93 |
| Figure 11-28. Precision Analysis – Field Duplicates - 2017 | 94 |
| Figure 11-29. Precision Analysis – Pulp Duplicates - 2017 | 95 |
| Figure 11-30. Standard Analyses’ Graphs – Cu% - 2017 | 96 |
| Figure 11-31. Coarse Blanks’ Assays - 2017 | 97 |
| Figure 12-1. Looking West Along Topography at Nussir | 100 |
| Figure 12-2. Looking North at Drilling Rig Set-Up – Nussir | 100 |
| Figure 12-3. South-East Wall of Holvedfelt Pit, Ulveryggen | 100 |
| Figure 12-4. Looking Eastwards into Old Pit Workings, Ulveryggen | 101 |
| Figure 12-5. Skaidi Core Shack | 101 |
| Figure 12-6. Histograms of Collars’ LiDAR Errors - Nussir | 103 |
| Figure 12-7. Histograms of Collars’ Elevation Differences with LiDAR - Nussir | 103 |
| Figure 12-8. Histograms of Collars’ Elevation Differences with LiDAR - Ulveryggen | 104 |
| Figure 12-9. Plan of LiDAR Differences with Collar Elevation - Nussir | 104 |
| Figure 12-10. 3D View of Holes, Showing Holes of Core Review | 105 |
| Figure 12-11. Hole NUS-DD-90-009 | 106 |
| Figure 12-12. Hole NUS-DD-90-017 | 106 |
| Figure 12-13. Hole NUS-DD-90-021 | 106 |
| Figure 12-14. Hole NUS-DD-14-001 | 107 |
| Figure 12-15. Hole NUS-DD-15-030 | 107 |
| Figure 12-16. Hole ULV-DD-17-06 | 108 |
| Figure 13-1. Nussir Long Section - Locations of Composite Metallurgical Samples | 111 |
| Figure 13-2. Nussir Long Section – Drillholes Used for Variability Metallurgical Samples | 111 |
| Figure 13-3. Locked Cycle Test Flowsheet | 113 |
| Figure 14-1. Nussir Horizontal Section at 0mRL, with Lithological Interpretation | 117 |
| Figure 14-2. Nussir Example Sections - Lithological Interpretation | 118 |
| Figure 14-3. Plan View of Drillholes and Interpretation Limits - Nussir | 119 |
| Figure 14-4. 3D View of Nussir Mineralized Zones – East Side | 120 |
| Figure 14-5. 3D View of Nussir Mineralized Zones – West Side | 120 |
| Figure 14-6. Log-Probability Plots of Mineralized Zone Samples - Nussir | 122 |
| Figure 14-7. Coefficient of Variation Analyses’ Graphs - Nussir | 123 |
| Figure 14-8. Sample Length Histogram - Nussir | 124 |
| Figure 14-9. Histogram of Composite True Thicknesses - Nussir | 124 |
| Figure 14-10. Statistical Cu Plots, Composites - Nussir | 125 |
| Figure 14-11. Histograms/ Log-Probability Plots- - Composites Au, Ag. Pd, Pt | 126 |
| Figure 14-12. Experimental and Model Variograms - Nussir | 127 |
| Figure 14-13. Plan of Evaluation Regions - Nussir | 128 |
| Figure 14-14. Plan View of Mineralized Wireframe Model - Nussir | 129 |
| Figure 14-15. W-E Long Section of Wireframe Model - Nussir | 129 |
| Figure 14-16. 3D View of Wireframe Model – View from SW - Nussir | 130 |
| Figure 14-17. 3D View of Model Prototype Structures– View from SW - Nussir | 130 |
| Figure 14-18. Grade vs Density Graph – Mineralized Zone Measurements - Nussir | 132 |
| Figure 14-19. Density Histograms by Rock Type - Nussir | 133 |
| Figure 14-20. Density Histograms by Lithology - Nussir | 133 |
| Figure 14-21. 3D View of Density Measurement Locations - Nussir | 133 |
| Figure 14-22. 3D View of Estimated Cu Grades - Nussir | 134 |
| Adam Wheeler | September 2025 |
| Technical Report on the Mineral Resources of the Nussir and Ulveryggen Projects | 11 |
| Figure 14-23. Long Section of Modelled Cu Grades - Nussir | 135 |
| Figure 14-24. Long Section of Resource Classification - Nussir | 136 |
| Figure 14-25. Normal Score Variogram for Cu - Nussir | 139 |
| Figure 14-26. Example Histogram of Simulated Average Cu Grades | 139 |
| Figure 14-27. Resource Classification – Plan- Nussir | 141 |
| Figure 14-28. Resource Classification – 3D View from NE, With Drillholes – Nussir | 141 |
| Figure 14-29. Swath Plots - Nussir | 143 |
| Figure 14-30. Constrained Resource Evaluation Long Section – Nussir (looking north) | 148 |
| Figure 14-31. Long Section - Resource Model Partitions – Nussir (looking north) | 148 |
| Figure 14-32. Example Interpretation of Ulveryggen Mineralized Zones – Section 20 | 150 |
| Figure 14-33. Plan View of Interpreted Mineralized Zones – Ulveryggen | 151 |
| Figure 14-34. Long Section of Mineralized Zones - Ulveryggen | 151 |
| Figure 14-35. 3D View of Mineralized Zones, Looking North-East - Ulveryggen | 152 |
| Figure 14-36. Log Probability Plot of All Selected Samples - Ulveryggen | 154 |
| Figure 14-37. Log Probability Plot of +0.3%Cu Composites - Ulveryggen | 157 |
| Figure 14-38. Cu Variogram Models - Ulveryggen | 158 |
| Figure 14-39. Example Vertical Section of Block Model Structure- Ulveryggen | 160 |
| Figure 14-40. Example Horizontal Section of Block Model Structure – Ulveryggen | 160 |
| Figure 14-41. Histogram of Densities – Mineralised Samples 2017 - Ulveryggen | 162 |
| Figure 14-42. Example Block Model Section, Showing Resource Classes – Ulveryggen | 164 |
| Figure 14-43. Cu Swath Plot - Ulveryggen | 166 |
| Figure 14-44. 3D Plot of MSO Stopes Shapes – Ulveryggen | 167 |
| Figure 23-1. Claims in the Repparfjord Area | 171 |
| Adam Wheeler | September 2025 |
| Technical Report on the Mineral Resources of the Nussir and Ulveryggen Projects | 12 |
| 1 | SUMMARY |
| 1.1 | Overview |
Mr. Adam Wheeler, (C. Eng, Eur Ing.) was retained by Blue Moon Metals Inc. (“Blue Moon”), a TSX Venture Exchange listed (TSX-V.: MOON) company focused on the exploration and development of deposits in Norway and the USA, to prepare an independent Technical Report on the mineral resources of the Nussir and Ulveryggen projects located in Finnmark, northern Norway. Both are potential underground mining projects. The deposits are approximately 3 km apart. This Technical Report conforms to National Instrument 43-101 Standards of Disclosure for Mineral Projects (NI 43-101). The Author has visited the Project several times, most recently from January 14 to 16, 2025.
The Nussir deposit has been evaluated over several different drilling campaigns from 2007 up to 2019. The resource estimate described here reflects all the drilling up to 2019, as well as development of the project since then. The Nussir sample database reflects the most recent drilling results available, as well as checks on old and reanalysed data. Geological Interpretation work was done using the Leapfrog modelling system, version 4.3.1 in 2018 and version 5.0.3 in 2019.
The Ulveryggen deposit, previously referred to as Repparfjord, was mined by a series of small open pits during the 1970s. The deposit was evaluated again in 2010, based on available drillhole, channel and trench data. Further drilling was then done between 2014 and 2017, leading to the resource estimation described in this report.
For both deposits, resource estimation work was done using the Datamine mining software system (Studio RM).
| 1.2 | Ownership |
Nussir ASA owns 25 extraction licences and 4 exploration licences covering the Nussir and Ulveryggen deposit areas within the Kvalsund district. There are no protected areas (national park, nature reserve, landscape conservation) in the area.
Blue Moon entered into a definitive agreement with Nussir ASA, a private Norwegian Company, on December 19, 2024, to which Blue Moon has agreed to acquire 99.5% of the issued and outstanding shares of Nussir. The consideration is being satisfied through the issuance of common shares of Blue Moon. Closing of such transaction is subject to TSX-V approval, and therefore acceptance of this NI 43-101 technical report.
| 1.3 | Geology |
Nussir is considered to be a stratabound sediment hosted copper deposit. The Nussir Cu-mineralized zone is an almost continuous layer over a strike length of 9 km, which is dolomite-dominated in the west and mostly calcite-dominated sandstone-limestone, along with medium dark schist with chalcocite/bornite dissemination in the east. This mineralized zone is within the Gorohatjohca sedimentary formation, which consists of claystone and is 200- 400m thick in the west, thinning out to a few meters wide in the east. The Gorohatjohca overlies the Stangvatn conglomerate formation and underlies the Nussir volcanic formation.
| Adam Wheeler | September 2025 |
| Technical Report on the Mineral Resources of the Nussir and Ulveryggen Projects | 13 |
The Ulveryggen prospect area is comprised of folded Precambrian sedimentary rocks, that are exposed in the Caledonian mountain belt of western Finnmark. Sediments in the general prospect area are typically described as sandstones and quartzites, trending to what have been previously described as conglomeratic beds in the immediate area of the old Ulveryggen Mine. The Ulveryggen sedimentary units are fault-bounded to the south by older greenstones and to the north by younger sedimentary units.
The main Ulveryggen deposit area is dominated by two sub-parallel ENE-trending faults, dipping steeply towards each other. Known mineralization occurs in several pods along a 2-kilometer trend between the two main faults and along a fan of smaller faults located in between. It is considered that the mineralisation is most likely of shear zone origin, rather than sedimentary, primarily in the form of chalcopyrite, bornite, and lesser chalcocite and secondary malachite. The thickness of mineralization appears to diminish with depth as the two main faults coalesce. However, there is potential for more, heretofore undiscovered, copper mineralization along strike of the main system, both to the east and west.
| 1.4 | Database and Resource Estimation |
For both deposits, the sample databases were updated by Norwegian geologists, which has culminated in Excel databases, data from which were exported to Datamine as separate .csv files for collar coordinates, drillhole survey data, assay results and lithology logs. After import of these data sets into Datamine, the different assay, collars and survey data files were combined into a single file of three-dimensional samples.
For the Nussir deposit, complete sets of data from 211 diamond drillholes have now been collated. Of these, 172 diamond drillholes have intersected mineralisation. In addition, data from 10 lines of surface channel samples have been used. These data were then used to develop a final three-dimensional model of sectional interpretations, based on a cut-off of broadly 0.4%Cu. The interpreted zones have in general been extrapolated a maximum distance of approximately 100m, both laterally and down-dip, from the outer-most drillhole intersections. The drilling grid spacing used was generally 200-250m, so the extrapolation distance is generally half of the typical grid spacing.
These Nussir solid wireframe models were separated into three main groups, according to orientation, and were then used as the basis to create resource block models of the deposit, with blocks rotated so as to be aligned with the zones’ general orientations. Cu, Ag, Au, Pd and Pt grades were estimated into the resource block models using ordinary kriging. Geostatistical parameters were also used in the assignment of resource categories. These final block models were used as the basis for resource evaluation.
For Ulveryggen, complete sets of data from 134 diamond drillholes have now been collated. Of these, 113 diamond drillholes have intersected mineralisation. In addition, data from 51 surface trenches have been used, along with 8 underground channel samples. These data were then used to develop a final three-dimensional model of sectional interpretations, based on a cut-off of broadly 0.3%Cu.
The interpreted Ulveryggen zones have in general been extrapolated a maximum distance of approximately 50m down-dip, from the outer-most drillhole intersections, and 30m laterally beyond the ultimate drilled sections. The drilling grid spacing generally used is 30-45m. Cu grades were estimated into the resource block model using ordinary kriging, and the final block models was used as the basis for resource evaluation.
| Adam Wheeler | September 2025 |
| Technical Report on the Mineral Resources of the Nussir and Ulveryggen Projects | 14 |
| 1.5 | Exploration Status |
The Nussir and Ulveryggen projects are at the Mineral Resource development stage. Drilling was carried out between 1985 and 2019, during which operators completed 345 core drill holes for a total of 69,440 m. Other exploration work has included surficial geochemistry sampling, ground and airborne geophysical studies, geological mapping, surface chip and grab sampling (including trenching), and regional lithogeochemical rock sampling for rocktype fingerprinting. In addition to the two deposits that have been identified, there are a number of mineralized occurrences both around the deposits and regionally that are either untested or supported by limited drilling. This means that additional infill and exploration drilling is warranted to more fully test favourable stratigraphy both around the deposits and regionally.
| Adam Wheeler | September 2025 |
| Technical Report on the Mineral Resources of the Nussir and Ulveryggen Projects | 15 |
| 1.6 | Mineral Resource Estimation |
This Mineral Resource Estimation (“MRE”) work was carried out and prepared in compliance with Canadian National Instrument 43-101, and the mineral resources in this estimate were calculated using the Canadian Institute of Mining, Metallurgy and Petroleum (CIM), CIM Standards on Mineral Resources and Reserves, Definitions and Guidelines prepared by the CIM Standing Committee on Reserve Definitions and adopted by CIM Council May, 2014.
Conforming with guidelines for “reasonable prospects for eventual economic extraction”, constrained evaluations were completed using a Mineable Shape Optimiser (MSO) to generate wireframes.
The updated mineral resource estimate of the Nussir deposit is summarised in Table 1-1, related to a cut-off grade of 0.3%Cu and a minimum width of 2.0 m.
Table 1-1. Nussir Resource Estimation Summary
Effective Date: 20th January, 2025
| Category | Tonnes | Cu | Ag | Au | Cu Eq | Cu Metal | Ag Metal | Au Metal |
| Mt | % | g/t | g/t | % | Kt | Koz | Koz | |
| Measured | 2.69 | 1.08 | 12.8 | 0.18 | 1.31 | 29 | 1,103 | 16 |
| Indicated | 26.03 | 1.01 | 12.3 | 0.11 | 1.19 | 263 | 10,288 | 92 |
| Meas+Ind | 28.72 | 1.02 | 12.3 | 0.12 | 1.20 | 292 | 11,391 | 108 |
| Inferred | 31.99 | 1.01 | 14.6 | 0.14 | 1.23 | 324 | 14,972 | 143 |
Notes:
| 1. | CIM definitions were followed for MRE. | |
| 2. | A minimum mining width of 2.0 m was applied in making the MRE constraint wireframes. These wireframes were generated using a preliminary MSO. | |
| 3. | Density values for Nussir were estimated from density sample values or assigned default average values where insufficient samples occur nearby. | |
| 4. | MRE constraint wireframes were generated for a cut-off grade of 0.30% Cu, related to potential underground mining. | |
| 5. | Metal prices assumed for this MRE were US$4.20 lb Cu, US$27.00/Oz Ag and US$2,200oz Au, which represent reasonable long-term consensus metal pricing. | |
| 6. | Metallurgy recovery assumptions were 96% Cu, 80% Ag and 93% Au, which stem from SGS metallurgical testwork completed in 2022. | |
| 7. | The cut-off grade of 0.30% Cu was derived from the price and recovery values above, as well as a smelter payability of 97.3% and an assumed total operating cost $26.20/t of ore. | |
| 8. | Rounding may result in apparent summation differences between tonnes, grades and metal content; not considered material. | |
| 9. | Mineral Resources are not Mineral Reserves and do not have demonstrated economic viability. |
| Adam Wheeler | September 2025 |
| Technical Report on the Mineral Resources of the Nussir and Ulveryggen Projects | 16 |
The updated resource estimate of the Ulveryggen deposit is summarised in Table 1-2 .
Table 1-2. Ulveryggen Resource Estimation Summary
Effective Date: 20th January, 2025
| Resource | Tonnes | Cu | Cu Metal |
| Category | Mt | % | Kt |
| Indicated | 4.05 | 0.65 | 26.3 |
| Inferred | 3.70 | 0.68 | 25.0 |
Notes:
| 1. | CIM definitions were followed for MRE. | |
| 2. | A minimum mining width of 2.0 m was applied in making the MRE constraint wireframes. These wireframes were generated using a preliminary MSO. | |
| 3. | A global density value was assigned for Ulveryggen, based on analysis of density measurements. | |
| 4. | MRE constraint wireframes generated for a cut-off grade of 0.30% Cu, related to potential underground mining. | |
| 5. | The assumed metal price assumed for this MRE was 4.20 $/lb Cu, which represents a reasonable long-term value. | |
| 6. | The assumed metallurgical recovery was 96% Cu, which stems from SGS metallurgical testwork completed in 2022. | |
| 7. | The cut-off grade of 0.30% Cu was derived from the price and recovery values above, as well as a smelter payability of 97.3% and an assumed total operating cost $26.20/t of ore. | |
| 8. | Rounding may result in apparent summation of differences between tonnes, grades and metal content; not considered material. | |
| 9. | Mineral Resources are not Mineral Reserves and do not have demonstrated economic viability. |
| 1.7 | Results and Interpretations |
There are several opportunities to improve the current results, that should be investigated further as part of the ongoing development of the Nussir and Ulveryggen projects.
| 1.7.1 | Exploration Targets – Nussir deposit |
The Nussir deposit is open to the west and to depth. In particular, the current limit of Inferred category resources excludes the influence of thee deep drillhole intersections, because they are excessively distant to the grid of holes above. The exploration target potential was derived by modelling the identified mineralization. The volume of the modelled areas determines the potential tonnage statement in the exploration target. The grade range given in the exploration target is determined with consideration to the drill results within the modelled exploration target area and consideration of the geological setting in an established mineral resource estimate area. The potential tonnages and grades are therefore conceptual in nature and are based on previous drill results that defined the approximate length, thickness, depth and grade of the portion of the mineral resource estimate. There has been insufficient exploration and data collection to define a current mineral resource for the exploration target and the Issuer cautions that there is a risk that further exploration will not result in the delineation of a mineral resource. The exploration target around these deeper intersections therefore represents a tonnage between 8.5 Mt and 16.5 Mt, and a Cu grade between 0.7 and 1.3% Cu, between 9 and 17g/t Ag, and 0.1 to 0.15 g/t Au.
| Adam Wheeler | September 2025 |
| Technical Report on the Mineral Resources of the Nussir and Ulveryggen Projects | 17 |
There are also a number of mineralized targets occur both downdip and along strike of the mineralized exploration target that has been defined. This mineral potential has not been properly tested by drilling. Additionally, a number of mineral targets currently outside of the resource area of the Nussir and Ulveryggen deposits are supported by geological mapping and limited drilling. This means that additional infill and exploration drilling is warranted to more fully test favourable stratigraphy both regionally and directly at Nussir and Ulveryggen deposits.
| 1.7.2 | Exploration Targets – Ulveryggen deposit |
The Ulveryggen deposit is open to depth, and based on geochemical sampling and geophysics, there are drilling targets both along strike and down-dip.
| 1.7.3 | Double Mineralised Intersections -– Nussir deposit |
There are some instances at Nussir, mainly in the more folded west end, of single drillholes picking up two mineralised intersections. This could be due to reverse faulting, and when drilled sufficiently in the future, could lead to an improved interpretation with more mineralised material that is currently modelled. These potentially repeated strata are only known to occur over 2.5 of the 10 km strike length of known mineralization. Limited drilling has been done to date to fully test the mineral potential of this possible extension. Given the presence of a mineral resource adjacent to this parallel zone of favourable strata, it means additional drilling is warranted, but there is no guarantee that additional drilling will result in the delineation of a mineral resource in these areas.
| 1.7.4 | Inferred Resource Conversion -– Nussir deposit |
The Nussir deposit is open to depth over much of its strike length, as well as westwards. If the project progresses and the proposed underground development commences, this could allow much closer and offset access for drilling of deeper zones. This would provide an opportunity to significantly extend Indicated resources to depth and westwards. Additional drilling should be designed in order to enable a significant proportion of the deposit to be reclassified into a higher category of confidence, such as Indicated category, as well as provide a more accurate interrelation and structural geology and mineralised zones. Though it is cautioned that additional drilling is not a guarantee for upgrading the resource category.
| 1.7.5 | Inferred Resource Conversion – Ulveryggen deposit |
There are numerous areas currently modelled at the Ulveryggen deposit, where the current drilling density does not support an Indicated resource categorisation. Additional drilling should be designed in order toto enable a significant proportion of the deposit to be reclassified into a higher category of confidence, such as Indicated category, as well as provide a more accurate interrelation and structural geology and mineralised zones. Though it is cautioned that additional drilling is not a guarantee for upgrading the resource category.
| Adam Wheeler | September 2025 |
| Technical Report on the Mineral Resources of the Nussir and Ulveryggen Projects | 18 |
| 1.8 | Conclusions |
The updated mineral resource estimate as of January 20th, 2025, has these conclusions from the Author and are as follows:
· The geological setting and character of the sedimentary-hosted copper mineralization identified to date on the Project, and specifically at the Nussir and Ulveryggen deposits, are of sufficient enough merit to justify additional exploration expenditures.
· The majority of drill holes completed to date were targeting the mineral resource totalling 345 core drill holes for 69,440 metres.
· Drilling has identified extensive, conformable, sedimentary strata that are well mineralized that remain open for growth. Geological mapping on surface and drilling both along strike and downdip of the mineral resource have identified the same favourable host rocks for copper mineralization indicating mineral potential warranting additional drilling to more fully test these favourable strata both regionally and at the Nussir and Ulveryggen deposits.
· The Author has reviewed the procedures for drilling, sampling, sample preparation and analysis, and is of the opinion that they are appropriate for the deposit style and mineralization.
· The Author has reviewed the quality control results (QA/QC) and did not find any material issues, so the Author is of the opinion that the databases for the mineral resource are of sufficient quality to estimate mineral resources.
· Mineral resources were estimated using a 0.30% copper cutoff value for potential underground extraction that will need to be studied further in the future.
· Measured mineral resources for the Nussir deposit are 2.69 Mt grading 1.08% copper, 12.8 g/t silver, and 0.11 g/t gold. The Indicated mineral resources are 26.03 Mt grading 1.01% copper, 12.3 g/t silver and 0.11 g/t gold. The Inferred mineral resources are 31.99 Mt grading 1.01% copper, 14.6 g/t silver and 0.14 g/t gold.
· For the Ulveryggen deposit, the Indicated mineral resources are 4.05 Mt grading 0.65% copper and the Inferred mineral resources are 3.70 Mt grading 0.68% copper.
· There is a parallel zone of mineralization that is believed to be a potential fault repetition, tested only by limited drilling over a 2.5 km stretch of the 10 km strike extent of the favourable strata. A number of additional mineral occurrences occur outside of the deposits, such as the Western zone, that require addition exploration beyond infill and exploration drilling directly around the mineral resource wireframes.
· There is general support for the project at the exploration stage of mineral resource development from the affected communities in the area, as those communities will benefit from local employment.
| 1.9 | Recommendations |
| 1.9.1 | Sample Preparation, Analyses, and Security |
· Develop a rigorous quality control and quality assurance (“QAQC”) policy for standards, blanks and duplicate sample when drilling, that is monitored on a batch by batch basis when data is received from the accredited laboratory.
· Consider the use of prep- and or reject duplicate samples to enhance the QAQC.
· Select certified reference material (CRM) that are more aligned to the grades of the Nussir and Ulveryggen deposits for copper, gold and silver; being mindful that if geochemically testing for platinum and or palladium, it might require a different CRM.
· Using an umpire or secondary independent laboratory, and remitting approximately 10 to 15% of the total samples, and select analysis methodologies that are similar to the primary laboratory. This will provide future assurances that the range of grades seen in the analytical certificates are valid and respected.
· Consider centralizing all pulp and reject storage.
| Adam Wheeler | September 2025 |
| Technical Report on the Mineral Resources of the Nussir and Ulveryggen Projects | 19 |
| 1.9.2 | Data Verification |
· Finish the drill collar validations done in 2019, referencing the Devisight system from Devico for the X and Y coordinates, and then validating elevation (or Z) data between the surveys for each of the drill collar locations against the LiDAR survey. Having a valid elevation data strengthens the respect of the mineral resource modelling.
· Consider a more rigorous check analysis program, if the analytical pulps are available from prior drilling program results. At a minimum, select approximately 100 to 200 pulps from each round of drilling that would be re-run at both the primary and secondary laboratory.
· Consider moving point and vector data from drilling into a proper database management system such as MX Deposit. This includes but is not limited to drill collar information, lithological data, structural data, sample data, and analytical results. The advantage of such a cloud-based database management system is that it negates expensive software purchasing and it can be linked to major 3D modelling programs such as Seequent’s Leapfrog Geo and other programs.
| 1.9.3 | Further Studies |
· An optimization and or trade-off study is recommended to assess a conventional tailings facility approach for any future engineering studies
· Consider building a Leapfrog Geo model of all lithological units and structures that is maintained and updated regularly when new surficial mapping and or drilling is completed. This will help better guide future studies and mineral resource estimation processes.
· Consider adding RMR to the geomechanical (rock mechanics) data collection in addition to the RQD work already part of the core logging process. This methodology is typically done for deposits that potentially could be extracted through an underground.
· Consider adding point load testing (“PLT”) to the geomechanical data collection process in the coreshack. The addition of this process will provide rock quality and strength information that is expected to be valuable when assessing ground stability in future engineering studies. It will also provide a large dataset that can be used in conjunction with any analytical program carried out at a rock mechanics laboratory
· Consider a regular analytical process at a rock mechanics laboratory to backstop geomechanical data collection. Testing could include UCS, BTS, and Triaxial measurements. If a PLT is collecting
· Consider taking a coreshack measurement of specific gravity for each sample marked for collection or add an analytical pulp or reject measurement at the primary laboratory. The addition of a larger number of specific gravity measurements is expected to greatly enhance the estimation of the tonnes on a block by block basis in the mineral resource model, as currently the estimations are using average values for lithologies.
| Adam Wheeler | September 2025 |
| Technical Report on the Mineral Resources of the Nussir and Ulveryggen Projects | 20 |
| 1.9.4 | Exploration Program and Budget |
For further development of the project, the Author recommends a work program at the Nussir and Ulveryggen projects, that includes the preparation of the development of an exploration decline (including logistics and support), exploration drilling and optimization studies including engineering. A summary breakdown of this work program is presented below along with associated estimated costs expected to cost C$13.0 million (Table 1-3).
Table 1-3. Proposed Exploration Budget
| Item | (C$000) |
| Underground access (decline) preparation, exploration logistics and support | 4,000 |
| Exploration – drilling 25,000 to 30,000 m | 6,000 |
| Optimization studies including engineering studies | 3,000 |
| Total | 13,000 |
| Adam Wheeler | September 2025 |
| Technical Report on the Mineral Resources of the Nussir and Ulveryggen Projects | 21 |
| 2 | INTRODUCTION |
| 2.1 | Author |
This report was prepared by qualified person (QP) Adam Wheeler (C. Eng, Eur Ing, Fellow, Institute of Materials, Minerals and Mining) – herein referred to as the Author. Mr. Wheeler is an independent mining consultant, who was contracted by Blue Moon in order to estimate an updated mineral resource, which has an effective date of 20th January, 2025. The Author’s involvement with Nussir and Ulveryggen Projects started in 2007, noting a summary of the Author’s site visits and personal inspections are shown below:
| Dates | Duration | Work Completed |
| 2/7/2007 – 4/7/2007 | 3 days. | Inspected whole Nussir deposit and project area, and review of available data. |
| 14/6/2010 – 16/6/2010 | 3 days | Surface and underground inspections at Ulveryggen. |
| 22/9/2014 – 24/9/2014 | 3 days | Nussir site visit during drilling campaign, inspection of core, sampling and QA/QC procedures |
| 03/12/2024 | 1 day | Nussir and Ulveryggen core review ay NGU core storage facilities, Løkken. |
| 14/1/2025 – 16/1/2025 | 3 days | Ulveryggen site visit, as well as Nussir/Ulveryggen core review in Skaidi. |
| 2.2 | Terms of Reference |
This independent Technical Report was commissioned by the Issuer, Blue Moon Metals Inc., in connection with its acquisition of Nussir ASA, and completed by the Author, an independent mining consultant.
Blue Moon has agreed to acquire a 99.5% interest in Nussir ASA and the Nussir project, pursuant to a share purchase agreement dated December 19, 2024, as further described in news releases dated December 19, 2024 and November 17, 2024. Nussir ASA is a private Norwegian company, and its main asset is the Nussir project in northern Norway.
The Author was retained previously by Nussir ASA to provide an independent Technical Report on the Mineral Resources at Nussir, as at December 31st, 2019, and for the Mineral Resources at Ulveryggen, as at January 31st, 2018. The mineral resource estimated presented herein has used resource block models generated from these periods, but the evaluation itself has been updated.
Blue Moon retained the Author for the current transaction to provide an independent Technical Report on the combined Mineral Resources for Nussir and Ulveryggen Projects that meets the provisions of CIM - Standards of Disclosure for Mineral Projects. The purpose of this current report is to provide an independent Technical Report in conformance with the standards required by NI 43-101 and Form 43-101F1. The estimate of mineral resources contained in this report conforms to the CIM Mineral Resource and Mineral Reserve definitions (May 2014) referred to in NI 43-101.
Based on the Property visits and review of the available literature and data, the Author takes responsibility for the information herein.
| Adam Wheeler | September 2025 |
| Technical Report on the Mineral Resources of the Nussir and Ulveryggen Projects | 22 |
This Report is a compilation of proprietary and publicly available information. In support of the technical sections of this Report, the Author has independently reviewed reports, data, and information derived from work completed by Nussir ASA and relevant geological publications, as listed in Section 27. These were used to verify background geological information regarding the regional and local geological setting and mineral deposit potential of the Property. The Author has deemed these reports, data, and information to be valid contributions, to the best of his knowledge. In addition to site visits, Adam Wheeler reviewed available literature and documented results concerning the project and held discussions with technical personnel of Blue Moon.
Based on the Property visits and review of the available literature and data, the Author takes responsibility for the information herein.
| 2.3 | Units and Currency |
All measurement units used in this report are metric, and currency is expressed in US Dollars, unless stated otherwise.
| 3 | RELIANCE ON OTHER EXPERTS |
For this report, the Author has relied on information related to:
| 3.1 | Ownership |
The Author has worked on the Nussir project since 2007 and so is familiar with the relevant license areas but has not independently reviewed the ownership of the Nussir and Ulveryggen projects, or any underlying property agreements, mineral tenure, surface rights, or royalties. For the Nussir project, the extent and nature of the Title to the mineral lands has been investigated and confirmed by a 3rd party legal expert, Simonsen Vogt Wiig AS, written by Mona Soyland, in a report dated December 19, 2024. This 3rd party title opinion has confirmed the Author’s view with respect to the validity of the mineral title for tenure, but the Author is not qualified to express a legal opinion in respect to property titles, current ownership, and other related legal matters, associated with the Nussir and Ulveryggen projects. It is further described in Section 4.2 of this report.
| 3.2 | Taxes |
The Author has relied on Blue Moon for guidance on applicable taxes, royalties, and other government levies or interests, applicable to revenue or income from the Project. This information was provided by an internal document on January 22nd, 2025, from Blue Moon’s legal advisors, Simonsen Vogtwiig, written by Mona Soyland. The Author is not qualified to express an opinion regarding taxation in respect to the Nussir and Ulveryggen projects. This information has been further described in Section 4.3 of this report. However, as this report is focussed on resource estimates only, with no economic analysis, this tax information does not affect the resource estimation results but have been presented to give a full disclosure of these economic parameters.
| Adam Wheeler | September 2025 |
| Technical Report on the Mineral Resources of the Nussir and Ulveryggen Projects | 23 |
| 4 | PROPERTY DESCRIPTION AND LOCATION |
| 4.1 | Location |
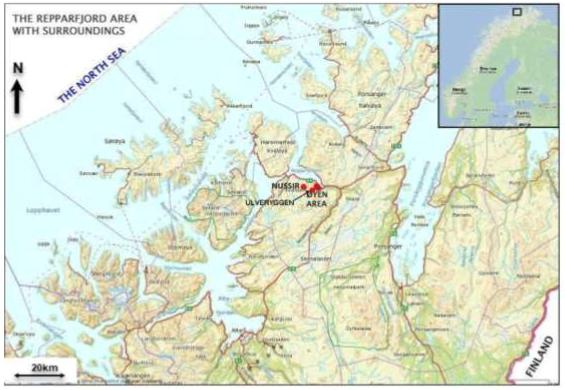
The Nussir deposit is located about 1,5 km north of the Øyen Industrial area and 1.5 km south of the Markoppnes Industrial area, in Repparfjord, Kvalsund, Hammerfest Municipality, in the western part of Finnmark county, northern Norway. The Ulveryggen deposit is located approximately 3 km south of Nussir. It is envisaged that an industrial area with mineral processing plant and related facilities could be located either at the established industrial area at Øyen, subject to a deal with the current operator, or at the Markoppnes industrial area. The zoned area for mining and industrial activity in the Repparfjord area is about 5000 acres.
For exploration activities, access is year-round for the underground, however, for surface exploration, only the legislated window of May 1 to June 15 each year is unavailable. This means that all work that is planned and budgeted can be undertaken on tenure for the Nussir and Ulveryggen projects.
Figure 4-1. Area Map of West Finnmark
[Map compiled by Promin AS]
| Adam Wheeler | September 2025 |
| Technical Report on the Mineral Resources of the Nussir and Ulveryggen Projects | 24 |
| 4.2 | Licenses |
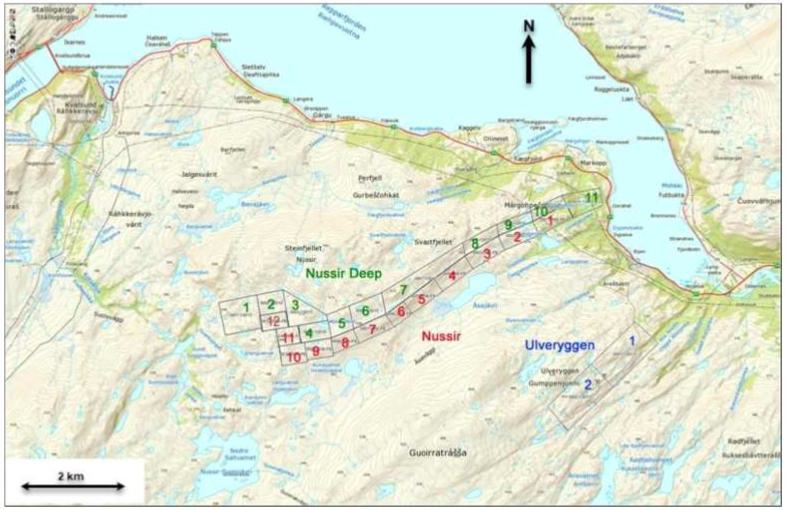
The main license areas held by Nussir ASA, are shown in Figure 4-2 and Figure 3-2, and are summarised in Table 4-1 for Nussir and in Table 4-2 for Ulveryggen. These areas all have valid extraction status and are held by Nussir ASA. These extraction licences areas do not expire as the operating licence on top of these is valid and are held by Nussir ASA. Nussir applied for an operating license for the area covered by the 25 extraction licences, and the operating licence was awarded in 2019. In 2024 it applied for extension of the operating licence for further 3 years according to the Minerals Act of Norway. Extension was granted by the Mining Directorate of Norway in 2024 and then objected by a third parties. The Mining Directorate upheld its decision and then sent the objections to be finally decided by the Ministry of Trade, Industry and Fisheries and a decision is expected within Q1 2025. As long as the objection regarding the extension is under processing, the permit remains valid. Other than the fees described in section 4.3, there are no other obligations that must be met to retain the permit.
Nussir ASA, a Norwegian public limited liability company, holds various mineral extraction and exploration permits necessary for its mining operations. According to the title and legal opinion provided by Simonsen Vogt Wiig AS, Nussir ASA is duly incorporated and in good standing under Norwegian law, with no ongoing bankruptcy proceedings as of December 19th, 2024, and has valid title to all licences listed in Tables 4-1 and 4-2. The company does not own or lease any real property, meaning it must enter into an agreement with the public landowner Finnmark Estate for mining activities. Nussir ASA is given access by the state to the land covered by the extraction permits which allows Nussir to access the surface rights both for the Nussir and Ulveryggen properties, and to carry out the required exploration and development activities. In addition, Nussir ASA needs to submit application to the Municipality for use of vehicles for such activities, typically once a year. Nussir ASA will need to reach an agreement to acquire and/or lease additional industrial area to construct a full mine and milling operation. Two options exist at the Markoppnes or the Oyen industrial areas next to the project. Both are being evaluated by Nussir ASA, with a further decision to come in due course, but at this time Nussir ASA is in good legal standing with all of its licenses and access arrangements with the different governing entities for the current stage of project.
The third-party,legal, title opinion confirms that Nussir ASA holds a 100% interest in all its registered mining permits, which remain in good standing. These include an operating license, extraction permits named for copper, gold, palladium, platinum, and silver (but will in fact also include all other state-owned minerals (i.e metals with a specific gravity of 5 grams/cm3 or higher) within the license areas) and 4 exploration permits. The company’s operating license, initially issued in 2019, was extended until 2027 by the Norwegian Directorate of Mining, although this decision has been appealed and is currently under review by the Ministry of Trade, Industry, and Fisheries. If the extension is overturned, a new application process could take up to two years. The opinion also notes that the permits are not subject to any registered security interests and that no legal or regulatory issues outside Norway have been identified that would affect Nussir ASA’s ability to hold these rights.
| Adam Wheeler | September 2025 |
| Technical Report on the Mineral Resources of the Nussir and Ulveryggen Projects | 25 |
Table 4-1. Summary of License Areas - Nussir
| License Code | NAME | AREA |
| m2 | ||
| G.UTV 0001/2006-FB | Nussir 1 | 291,172 |
| G.UTV 0002/2006-FB | Nussir 2 | 292,251 |
| G.UTV 0003/2006-FB | Nussir 3 | 299,109 |
| G.UTV 0004/2006-FB | Nussir 4 | 298,875 |
| G.UTV 0005/2006-FB | Nussir 5 | 296,036 |
| G.UTV 0006/2006-FB | Nussir 6 | 174,865 |
| G.UTV 0007/2006-FB | Nussir 7 | 287,282 |
| G.UTV 0008/2006-FB | Nussir 8 | 205,676 |
| G.UTV 0009/2006-FB | Nussir 9 | 242,878 |
| G.UTV 0010/2006-FB | Nussir 10 | 255,072 |
| G.UTV 0011/2006-FB | Nussir 11 | 199,900 |
| G.UTV 0012/2006-FB | Nussir 12 | 215,893 |
| G.UTV 0001-1/2015 | Nussir Deep 1 | 644,623 |
| G.UTV 0002-1/2015 | Nussir Deep 2 | 288,715 |
| G.UTV 0003-1/2015 | Nussir Deep 3 | 433,512 |
| G.UTV 0004-1/2015 | Nussir Deep 4 | 269,706 |
| G.UTV 0005-1/2015 | Nussir Deep 5 | 283,553 |
| G.UTV 0006-1/2015 | Nussir Deep 6 | 399,766 |
| G.UTV 0007-1/2015 | Nussir Deep 7 | 806,227 |
| G.UTV 0008-1/2015 | Nussir Deep 8 | 233,762 |
| G.UTV 0009-1/2015 | Nussir Deep 9 | 207,267 |
| G.UTV 0010-1/2015 | Nussir Deep 10 | 184,362 |
| G.UTV 0011-1/2015 | Nussir Deep 11 | 369,850 |
Table 4-2. Summary of License Areas – Ulveryggen
| License Code | NAME | AREA |
| m2 | ||
| G.UTV 001-1/2013 | Ulveryggen 1 | 991,269 |
| G.UTV 002-1/2013 | Ulveryggen 2 | 988,113 |
| Adam Wheeler | September 2025 |
| Technical Report on the Mineral Resources of the Nussir and Ulveryggen Projects | 26 |
Figure 4-2. Plan of License Areas
[Source: Norwegian Directorate of Mining]
| Adam Wheeler | September 2025 |
| Technical Report on the Mineral Resources of the Nussir and Ulveryggen Projects | 27 |
| 4.3 | Fees and Royalties |
Under the Norwegian Minerals Act, metals with a specific gravity of 5 g/cm³ or higher, including copper, silver, and gold, are classified as state-owned minerals. These metals, which are of primary economic interest at both Nussir and Ulveryggen, require compensation to the state through payment of yearly fees in order to uphold the extraction and exploration permits. These fees are calculated based on the size of the areas in question and must be paid within 15th January each year. Nussir ASA has made payment of NOK 107,000 in total for all extraction and exploration permits for 2025.
Further, all extraction of state-owned minerals requires payment of a 0.5% net smelter royalty of the sales value of the extracted minerals to the landowner, who is Finnmarkseiendommen (FeFo). In addition, an increased landowner royalty of 0.25% net smelter royalty is mandated for projects in Finnmark as is the case for Nussir ASA, which is also paid to Finnmarkseiendommen (FeFo).
Blue Moon must therefore pay a 0.75% net smelter royalty on all extracted minerals. This royalty will be due for payment by March 31 of the following year. There are no back-in rights, payments or other encumbrances to which both Nussir and Ulveryggen permits are subject to.
| 4.4 | Environmental Liabilities |
The Nussir and Ulveryggen projects have negligible environmental liability, since any impact from historical mining operations, notably at Ulveryggen deposit, rest with the State, meaning Norwegian Government.
| Adam Wheeler | September 2025 |
| Technical Report on the Mineral Resources of the Nussir and Ulveryggen Projects | 28 |
| 5 | ACCESSIBILITY, CLIMATE, LOCAL RESOURCES, INFRASTRUCTURE and PHYSIOGRAPHY |
| 5.1 | Accessibility |
The Øyen area and nearby Markoppnes, which are on the coast just to the north-west of each deposit, are situated along National Highway 94 (R94). The R94 highway continues to the north-west, up to the city of Hammerfest with its major oil installations. The E6 major road is just a few kilometres away at the site of Skaidi; this road connects the previous mining area to the biggest city in Finnmark, Alta, to the south. Alta is approximately 70km south-west of the deposit areas and has an international airport.
The Repparfjord is ice-free during winter, making sea transport of supplies and export of concentrate directly to and from the site possible year-round.
| 5.2 | Site Description |
The topography overlying and around the area of the Nussir deposit is an unspoiled Arctic environment, extending westwards from the port area at Øyen. The area immediately overlying Nussir is relatively flat for most of the first 8 km from the coast, passing various small shallow post-glacial lakes, at an elevation generally of approximately 200 m. Almost immediately north of the Nussir outcrop, hill rise up steeply, up to a height of approximately 500 m. Approximately 800m south-east of the Nussir deposit the land again rises up to 400-500 m. The most westward part of the Nussir deposit passes under the rising hills. The vegetation of the projects is predominantly described as alpine and rare, but variable. It ranges from areas of birch trees close to the fjord to more like alpine tundra, at altitude, with very sparse and limited vegetation. Near bog ecosystems, dwarf birch trees are present.
The Ulveryggen deposit is approximately 3km south-east from the Nussir deposit and 2km south-west from the coastline. There are four old open pits at the Ulveryggen deposit, which were mined from 1972 to 1979. There is some surface infrastructure which connects to a 2.5 km 36 m2 (6x6 meter) historical underground haulage tunnel, which is in good condition, as well as existing 4.5 km of surface haul roads from the Øyen industrial area all the way up to the open pits at 450 meter above sea level. Next to the tunnel portal there is an existing workshop building for trucks and other vehicles. The current strike of the Ulveryggen deposit is much smaller than Nussir, extending approximately 2 km from west to east.
| 5.3 | Climate |
The climate and landscape of the Kvalsund Municipality is typical of Arctic and Sub-Arctic Zones. There is midnight sun in the summers and 24 hours without sun in the winter.
Precipitation is typically over 1 mm for 10-15 days/month throughout the year, and over 10 mm for 1-2 days/month throughout the year. Wind speeds are typically over 10 m/s (Force 5) from December through to April, and otherwise much lower for the other months.
Winter temperatures are generally below freezing for November through till April, typically around -5o C. The lowest temperatures can be down to around -10o C. Summer temperatures are typically around 7-10o C and get up to 16o C.
| Adam Wheeler | September 2025 |
| Technical Report on the Mineral Resources of the Nussir and Ulveryggen Projects | 29 |
| 5.4 | Local Resources |
Kvalsund was a 1,846 km2 municipality on the western coast of Finnmark, which largely consists of pristine and rugged landscapes. It is approximately 20 km from the western boundary of the projects; noting the roads are of good quality and provide for sufficient transport. Most of that area was on the mainland, but 125 km2 of it was on the island Kvaløya and 85 km2 on the island Seiland. The municipality had about 1,000 inhabitants, many of which live in the Kvalsund village, the then administrative centre. Some live in the Sami village of Kokelv, in the inner part of the Revsbotn Fjord. The population of Kvalsund has been in decline since 1950, during the period 1950-2004 by 43%, the reason being a sharp decline in employment in the fisheries. Kvalsund Municipality was merged with the larger Hammerfest Municipality on January 1st, 2020.
Businesses in Kvalsund are characterized by small enterprises of various trades. Primary industries have recently become less important for employment. Tourism, transport, aquaculture, construction and service industries have become the more prominent industries. On the other hand, 37% of the working population have jobs outside the Kvalsund area, mainly in Hammerfest.
| 5.5 | Infrastructure |
The industrial area and former processing plant are currently controlled by Repparfjord Eiendom. Access to the eastern portion of the Nussir deposit is facilitated by its proximity to the fjord which provides deep water harbour, with all year access. There is an opportunity to place any new construction within the regulated industrial area at Øyen, including but not limited to a processing plant, roads, and the portal to the mine.
A processing plant was built to serve the previous historical mining activities of the Ulveryggen deposit with an open pit in the 1970s, transporting ore via an underground tunnel and ore pass to an ore processing plant at the Øyen industrial area. The industrial area today is partially in use to serve a local quarry, which also utilises the harbour’s loading facilities.
The quay was built in 1971 and can serve vessels up to 30,000 tonnes. A Ship Loader with a loading capacity of 1,000 to 1,500 tph is installed and in use. The quay is operated and maintained by Repparfjord Eiendom.
| Adam Wheeler | September 2025 |
| Technical Report on the Mineral Resources of the Nussir and Ulveryggen Projects | 30 |
| 5.6 | Power Supply |
The municipality has two hydroelectric powerplants in Porsaelva on the east side of the Vargsundet (a total of 65 GWh of average annual production), and there is currently stranded green electric hydropower oversupply in Northern Norway, leading to relatively low electricity prices and therefore power available for any future development of industrial activities.
| 5.7 | Water Supply |
There are considerable freshwater resources in the area. Repparfjord Eiendom owns the existing water feed system including a dam and an 8” pipeline and has secured the rights from the owner, FEFO, to use the water. A study was initiated to assess secure the water supply in the future. One of the suggestions has been to strengthen the existing dam at level 170 m. Taking water from the Geresjohka River has also been considered. Improving the road to the dam would also be necessary for future developments.
| Adam Wheeler | September 2025 |
| Technical Report on the Mineral Resources of the Nussir and Ulveryggen Projects | 31 |
| 6 | HISTORY |
| 6.1 | Nussir |
| 6.1.1 | Initial Exploration |
Copper ore deposits in the Repparfjord area were discovered at the turn of the last century. In 1903, the Swedish company Nordiska Grufaktiebolag began to explore the ore field. Sydvaranger AS, a large Norwegian mining company with an iron ore mine in Finnmark, was prospecting west of Ulveryggen and found some Cu-enriched sites, which were later identified to be the Nussir orebody. AS Prospektering was established from Sydvaranger as an independent company, and worked on building their geological database, including the Nussir Project.
In 2000, Terra Holding bought AS Prospektering and took over the Nussir deposit rights. Further analyses on the deposit showed promising results, and plans were made to further study and develop the project. In December 2004, Terra Holding created Nussir AS to focus on developing the Nussir deposit.
| 6.1.2 | Geophysical surveys |
Ground IP and Resistivity
Three ground geophysical surveys campaigns have been done by the Norwegian Geological Survey (NGU) using surveying equipment comprising a Terrameter ABEM-LS unit and multi-electrode cables. Cables configured with 2m electrode interval were used for the five 160m long survey lines in 2007, 10m electrode interval were used for the four long survey lines in 2011 and an electrode interval of 5m were used for the nine 4-700m long survey lines in the 2013 campaign. Depth range depended on profile length, being roughly 160m for the long 2011 profiles and 60 m for the 2013 profiles. Most profiles were oriented normal to structures, as shown in Figure 6-1.
Induced polarisation and resistivity were measured in the ground above drillhole intersections for correlation purposes and in target exploration areas. Results indicated strong correlations between copper mineralisation, strong IP anomalies and low resistivity anomalies, as exemplified in Figure 6-2 (Dalsegg. E. et.al. 2013). Other mineralisation suffers from a low signal-to-noise ratio. Large parts of the regions are characterized by "negative" in phase data, typical for regions with high susceptibility and/or high resistivity. All collected data have a significant higher quality and resolution than earlier airborne data collected by the NGU in the same area in the 1970s.
A GPS system from Seatex (SEAPOS 100E) was used for helicopter positioning. This system has an accuracy of ±5 m. Moreover, a Bendix/King radar-altimeter was mounted on the helicopter. Its accuracy is 5 % of the measured altitude. The time sampling of the GPS was 1 second.
| Adam Wheeler | September 2025 |
| Technical Report on the Mineral Resources of the Nussir and Ulveryggen Projects | 32 |
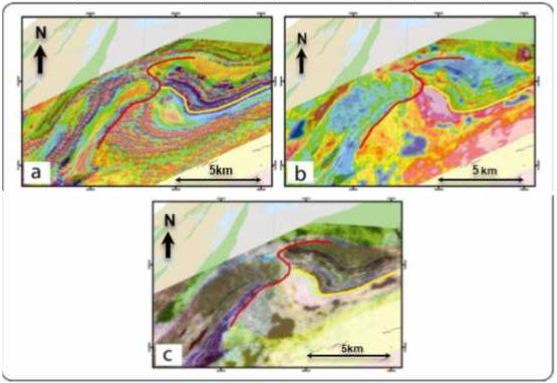
It was important to interpret all the geophysical data in order to understand the overall occurrence of the mineralised zones. Progressing from the (eastern) Nussir I mineralised body, detailed field observations allowed the establishment of its potential Nussir II continuation towards west. Figure 6-1 shows its magnetic and radiometric signatures, with a red line highlighting a possible thrust discontinuity (Pharaoh et al.,1983). The vertical derivative of the total magnetic field (Figure 6-1a) shows that the Nussir greenstones to the east of the red line are characterised by two very prominent, parallel high anomalies. A third, weaker and less continuous anomaly parallels these two anomalies further to the north. These features are the most prominent elements of the magnetic signature in the greenstones of the Nussir Mountain. They are folded about a NE-SW trending axis and can be readily traced eastward, where they strike ENE-WSW. The same fold geometry is shown by the anomalies generated by the Saltvatn Group lithologies, south of the yellow line. The Nussir mineralisation is folded by this structure, which generated local thickening and duplication of the deposit. It is obvious from Figure 6-1 that these high anomalies do not continue simply to the west of the red line, where a single, yet extremely irregular and laterally stepped magnetic anomaly has instead been observed. The radiometric dataset is less conclusive with regard to the detailed internal architecture of the greenstone bodies exposed to the east and west of the discontinuity, but on the other hand, highlights significant compositional similarities between the two greenstone bodies, expressed by a similar total count signature (Figure 6-1b) and, above all, the ternary radiometric information of Figure 6-1c. It needs to be mentioned that only the radioactive concentrations of the uppermost 1-2 m are detected by gamma ray spectrometry and, therefore, the radiometric signature reflects only the surface geology.
| Adam Wheeler | September 2025 |
| Technical Report on the Mineral Resources of the Nussir and Ulveryggen Projects | 33 |
Figure 6-1. Geophysical Signature of the Nussir West Area
[Source: NGU]
Geological information is drawn on top of:
a) The vertical gradient of the magnetic total field.
b) The radiometric total count.
c) The ternary radiometry.
The red line traces possible thrust discontinuity (Pharaoh et al., 1983). The yellow line shows the boundary between the Nussir (to the north) and Saltvatn Groups (to the south).
The current interpretation of the local structural framework is shown in Figure 6-2. White lines are used to trace the main anomalies within the greenstones. These interpretations are supported by the results from structural investigations (Viola, G. et al 2008): the Skinnfjellet greenstone body is interpreted as being folded by a Fn+1 antiform, with an undulating axial trace trending generally SW-NE. The fold nose has been traced, however, not by following the curved map pattern of the dolomites, but instead by joining the high magnetic anomalies of the underlying greenstones, which are the likely source of the magnetic signature from underneath a presumably very thin dolomite occurrence. The south-eastern limb of the antiform is easily identified and corresponds to the top-to-the-NW sheared contact between dolomites and greenstones and the Dypelv conglomerates.
The conglomerates contain also early Fn folds, which are the oldest structural feature recognised by Nussir within the Repparfjord Window (see Sandstad et al., 2007). Later Fn+2 shortening generated the prominent folds that refold Fn+1 and Fn folds. Fn+2 are the folds that caused the current folded pattern of the Nussir and Saltvatn Group lithologies in the Nussir West area.
| Adam Wheeler | September 2025 |
| Technical Report on the Mineral Resources of the Nussir and Ulveryggen Projects | 34 |
Figure 6-2. Structural Interpretation of Nussir West Area.
[Source: NGU]
[Interpretation superimposed on the vertical gradient of the total magnetic field]
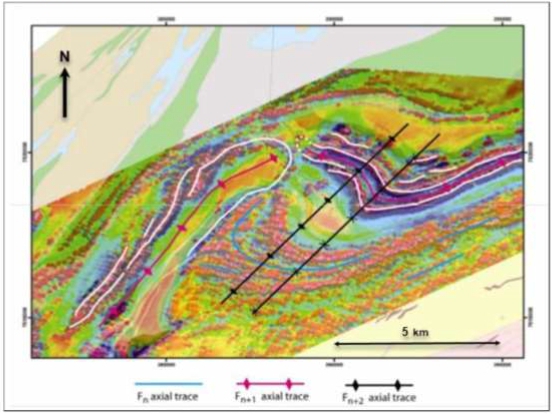
Key to the understanding of a possible existence of a south-westward continuation of Nussir I, into the postulated Nussir II towards the west, was the geological and structural evolution in the Nussir West area. The currently preferred interpretation, i.e. the Nussir Group greenstones occupying the hanging wall of a thrust with top-to-the-SE transport direction, calls for a possible continuation of Nussir I below this thrust plane on the south-eastern side of Skinnfjellet. The dip of the thrust plane is, however, an important factor. Although there is a lack of direct field constraints on the geometry of the structure, it can be argued that the dip of this thrust is probably steep, as indicated by the abrupt termination of the magnetic anomalies of the highly magnetic Djupelv Formation conglomerate. If the conglomerate continued at shallow depth beneath the greenstones of Steinfjellet, then the magnetic signature of this formation should be encountered as deeply seated magnetic anomalies, which is not the case, thus, suggesting a sharp truncation by the thrust plane.
Detailed studies of the highest frequency of apparent resistivity, as shown in Figure 6-3, give a clear indication of an anomaly which fits with the mapped Nussir mineralisation in the eastern part. In this part the geophysical profiles are perpendicular to the mineralisation. In the western part the outline of the mineralisation is swinging north, and the geophysical profiles are parallel. In this area the geophysical anomalies are not easy to interpret.
The geophysical study show that lakes and strong faults also give the same anomaly as the mineralised zone, and it is not easy to distinguish the three. There are a lot of lakes and faults in the area.
| Adam Wheeler | September 2025 |
| Technical Report on the Mineral Resources of the Nussir and Ulveryggen Projects | 35 |
Figure 6-3. Profile Plot of Inverse of Apparent Resistivity, Hz 34133.
[Source: NGU]
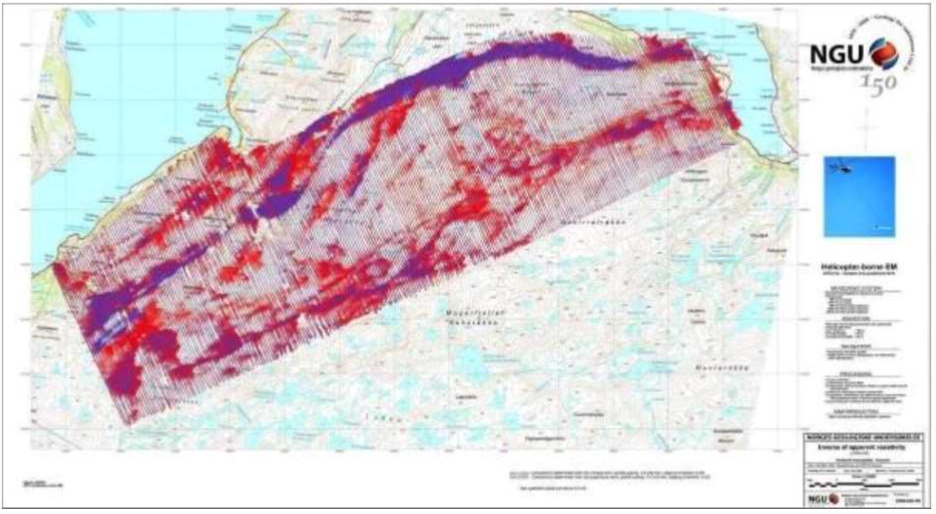
| Adam Wheeler | September 2025 |
| Technical Report on the Mineral Resources of the Nussir and Ulveryggen Projects | 36 |
| 6.2 | Ulveryggen |
| 6.2.1 | Initial Exploration and Historical Open Pit Mining |
The Repparfjord deposit was identified around 1900. The first trenches and shafts were opened in 1903 by the Swedish company “Nordiska Grufaktiebolaget”. In 1905, the company was granted a mining permit.
In 1955, 2,358 m of drilling was carried out by the Canadian company “Invex Corporation Ltd”. In 1963, a Norwegian company acquired the rights to the deposit. In the 1960s, the Norwegian company “AS National Industri” drilled around 10,000 m. Based on the geological work from this period, the deposit was estimated as 10 million ton averaging 0.72% Cu.
“Folldal Verk AS” acquired the rights to the deposit in 1970, and at the same time construction of mining and flotation facilities began. 2 years later in May 1972 the test production started, and full open pit production later the same year.
Mine development included 700 m of crosscuts, shafts and about 1,700 m of trenches, however, the grade of ore was found to be too low to allow for a profitable operation at that time. The Ulveryggen ore was mined and processed by Folldal Verk AS from 1972 until 1979.
The Repparfjord deposit produced 2 Mt of waste rock and 3 Mt of ore averaging 0.66% Cu from four small open pits. The deposit was opened by 4 open pits each 100-400 m long, 30-120 m wide and with 2-5 benches of 10 m height. For wintertime transport, a 2,500 m long haulage tunnel was driven 200 m under the open pit level. Ore was dumped through an ore pass down to the tunnel from where trucks hauled the ore to an ore pass leading to and feeding the primary crusher. An underground conveyor took the primary crushed ore to further crushing, milling and separation in the nearby processing plant.
The deposit outcrops at around 425 meter above sea level, and due the climatic conditions the crushing and processing facilities were placed at sea level around 4 km from the deposit. The ore was crushed and milled in 4 operations down to 80% under 0.074 mm in size. From the crude ore, 50,903 tons of concentrate with an average content of 35.5% Cu were processed. The copper mill recovery was 91.3% on average.
Since the closure of the mine, one of the pits has been used for disposal of cleaned drilling cuttings from the offshore oil activities. The filling is cement stabilized.
In 2011, Nussir ASA purchased the rights to the old Ulveryggen mine with all its existing facilities and access to complement the Nussir Project.
| 6.2.2 | Geophysical survey |
In October 2007 a helicopter-borne geophysical survey was completed around Ulveryggen. Measurements taken included magnetic, frequency-domain EM, spectral gamma ray radiometry data. These measurements were a small part (~40 km2) of a larger survey carried out south of Vargsundet.
| Adam Wheeler | September 2025 |
| Technical Report on the Mineral Resources of the Nussir and Ulveryggen Projects | 37 |
During acquisition the crystal for the radiometric measurements was mounted directly at the bottom of the helicopter, whereas the magnetometer and the EM-transmitter and receiver coils were mounted in a bird hanging 30 m below the helicopter. The part of the survey around the Ulveryggen comprised 101 lines with a line spacing of 100 m. The average helicopter altitude was 65 m. These flight lines are shown in Figure 6-4.
All collected data had a significant higher quality and resolution than earlier airborne data collected by the NGU in the same area in the seventieths. Maps were generated of magnetic field data, resistivity data and processed radiometric data for potassium, uranium and thorium ground concentrations.
Figure 6-4. Flight Lines of Geophysical Survey Lines, South of Repparfjord
[Source: NGU]
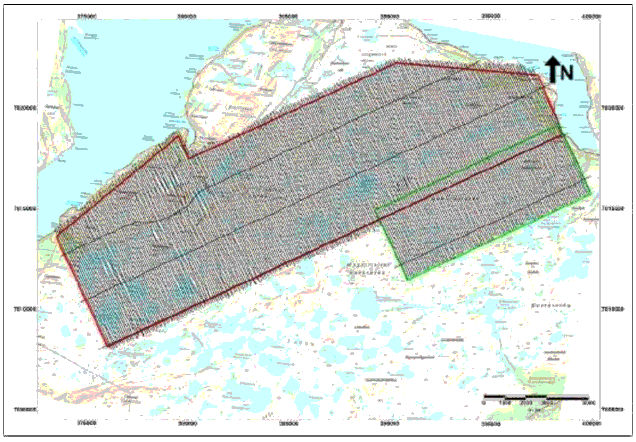
This survey showed that the delineation of EM and magnetic anomalies are related to overall district-scale structures. An example plan of the magnetic total field results are shown in Figure 6-5.
| Adam Wheeler | September 2025 |
| Technical Report on the Mineral Resources of the Nussir and Ulveryggen Projects | 38 |
Figure 6-5. Plan of Magnetic Total Field Results
[Source: NGU]
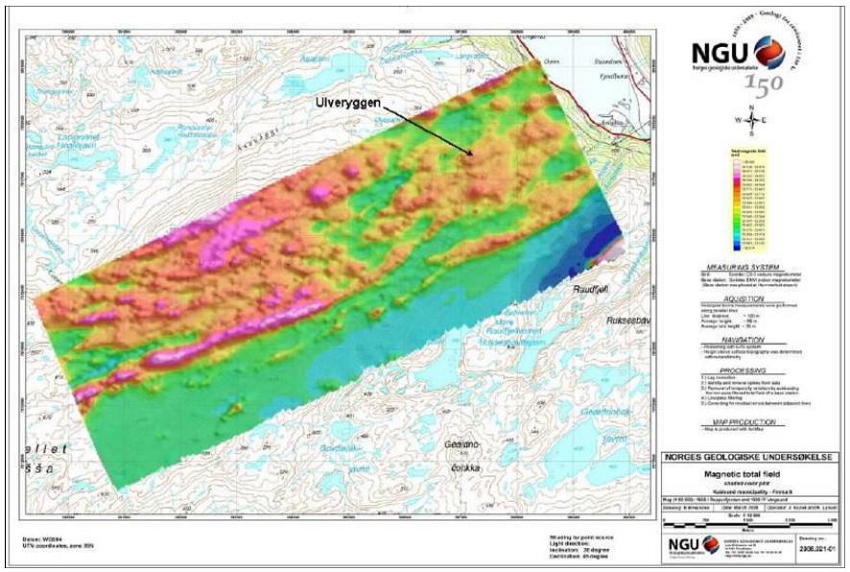
| Adam Wheeler | September 2025 |
| Technical Report on the Mineral Resources of the Nussir and Ulveryggen Projects | 39 |
| 6.2.3 | Structural Mapping and Field XRF Analyses |
Reconnaissance structural geological mapping and field XRF-analyses were carried out in the Ulveryggen area in August 2007. The preliminary conclusions from this work suggest a structural control of at least part of the mineralisation.
The plan in Figure 6-6 shows the localities of structural observations and the location of example XRF-profiles.
Figure 6-6. Plan of Structural Observation Localities
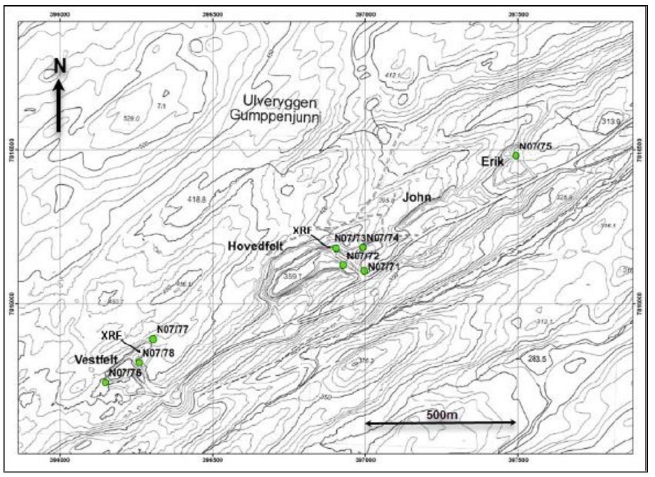
Observations at Hovedfelt suggest a relatively constant dip direction of the bedding to the NE. There appears to be a large antiform to the south of the studies area, with Ulveryggen being located on it north-western limb. At Hovedfelt and Vestfelt there is a significant brittle/ductile shear zone, seemingly associated with the high copper values within the meta-sediments. The shear zone in the Hovedfelt pit is shown in Figure 6-7. This shows a 35 m wide shear zone. The stereonet plot shows the dextral reverse kinematics of a number of sub-vertical striated fractures in the shear zone.
| Adam Wheeler | September 2025 |
| Technical Report on the Mineral Resources of the Nussir and Ulveryggen Projects | 40 |
Figure 6-7. View to NE of Hovedfelt Northeastern Face
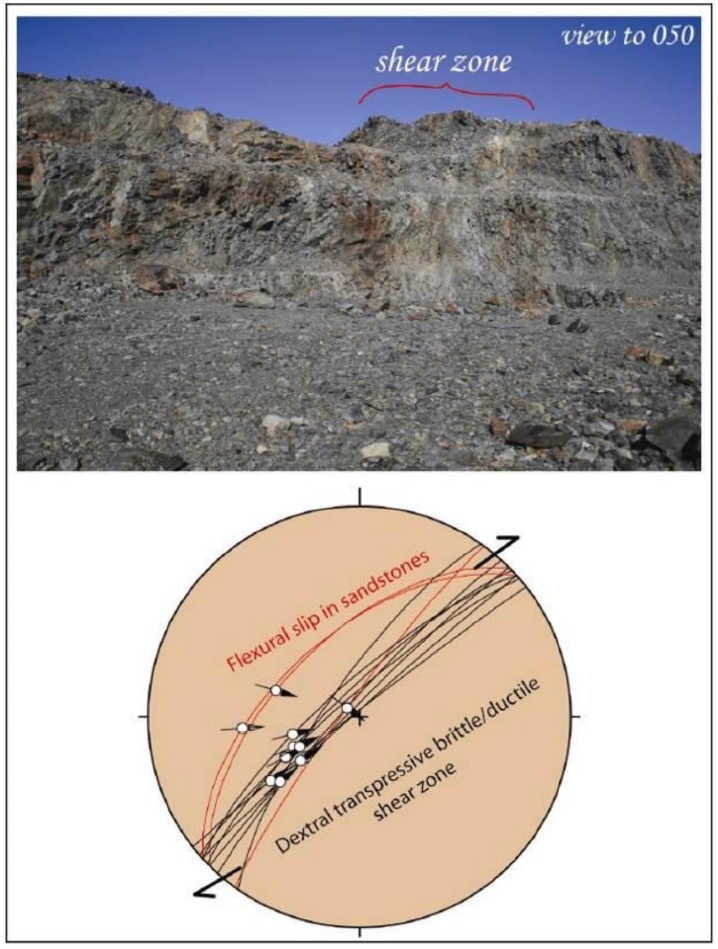
| Adam Wheeler | September 2025 |
| Technical Report on the Mineral Resources of the Nussir and Ulveryggen Projects | 41 |
XRF analyses were carried out by using a Thermo Scientific NITON XLp Analyzer. A total of 179 analyses were made, including 133 analyses along seven profiles in three of the open pits at Ulveryggen, 32 analysis from the Roar prospect, which is located 2 km SW of the mining area, and some test anaylises of various mineralised boulders. Examples of these analyses are depicted in Figure 6-8. The analyses were mostly carried out along across-strike profiles in NE facing walls within the open pits, three profiles in the 'Hovedfelt' and 'Vestfelt', and a final profile in the NE-wall of the northeasternmost Erik pit. The analyses commonly show strong variation along each profile, but there are also example of rather homogeneous values.
Figure 6-8. Cu Analyses Along lower NE wall at Hovedfelt
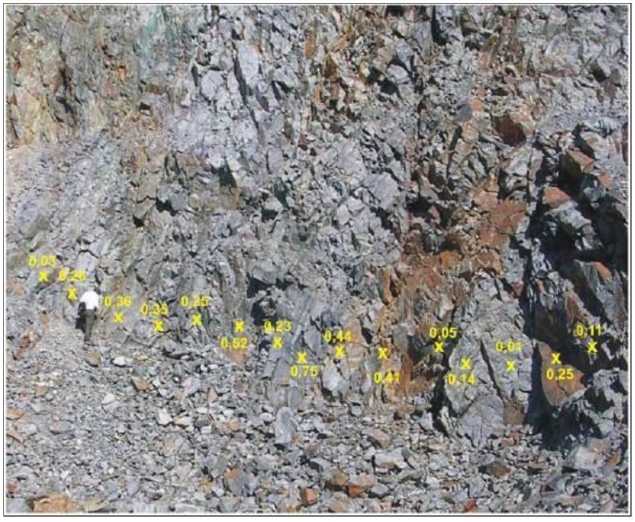
The intimate spatial association of the locally very high Cu values and sheared volumes of the Ulveryggen Formation suggests a structural control on at least part of the mineralisation. The brittle/ductile shear zones are generally characterized by complex internal architectures, with irregular distribution of highly sheared and practically undeformed domains, separated by irregular fracture networks.
| Adam Wheeler | September 2025 |
| Technical Report on the Mineral Resources of the Nussir and Ulveryggen Projects | 42 |
| 6.2.4 | Stream Sediment Sampling |
Target areas in the Repparfjord District were identified, based on interpretation of geophysics, geochemistry, known geology and the stream sediment grades, as shown in Figure 6-9. Other targets exist in presumed sub-parallel structural zones.
Figure 6-9. Identified Exploration Targets
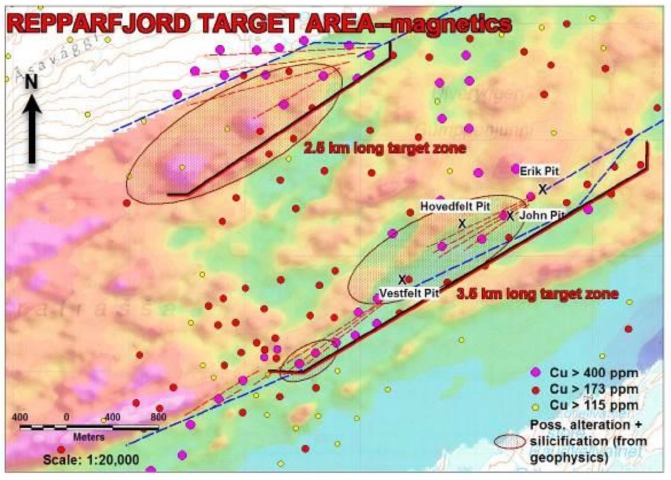
| 6.3 | Historical Mineral Resources |
There have been several historical mineral resources for the Nussir and Ulveryggen projects, which are summarized in this section. Blue Moon is not treating the historical estimates as current mineral resources or mineral reserves.
The Author of this report has not done sufficient work to classify any of the historical estimates discussed in this section as current mineral reserves or mineral resources. The Author has referred to these estimates as "historical estimates" and the reader is cautioned not to treat them, or any part of them, as current mineral resources. The historical estimates summarized below are included simply to provide the reader with a complete history of the Property. The Author of this report has reviewed the information in this section, as well as that within the cited references, and have determined that it is suitable for disclosure.
All stakeholders are cautioned that none are considered current and therefore should not rely on them due to being superseded by this report.
In 2012, the Author was commissioned by Nussir ASA for a mineral resource estimate that incorporated drilling from 1985 to 2011 (17,761 m in 90 core drill holes). The mineral resource estimate report was completed, titled “Nussir Report Estimation Updated May 2012” (Wheeler, 2012) and it is historical in nature and should not be relied upon. Subsequently in 2013, the Author was re-engaged for a mineral resource estimate update to include an additional 3,222 metres of drilling from 21 core drill holes. A report titled, “Nussir Report Estimation Updated March 2014” was completed (Wheeler, 2013), The report is considered historical in nature and should not be relied upon.
| Adam Wheeler | September 2025 |
| Technical Report on the Mineral Resources of the Nussir and Ulveryggen Projects | 43 |
In April 2016, Nussir ASA commissioned a PFS for the Nussir project. For the PFS, an updated mineral resource estimate report was completed, titled “Nussir Report Estimation Updated October 2016” that incorporated additional drilling results from 67 core drill holes totalling 19,880 metres. Both the PFS and the mineral resource are historical in nature and should not be relied upon.
The Author was commissioned by Nussir ASA in 2018 to update the mineral resource estimate to incorporate an additional 7,947 metres of drilling in 20 core drill holes. A report titled “Nussir Report Estimation Updated January 2018” was completed (Wheeler, 2018). This mineral resource is historical in nature, and it should not be relied upon.
In 2019, Nussir ASA commissioned a DFS for the Nussir project. The DFS, titled, “Nussir Feasibility Study 2023”, was supported by a mineral resource estimate that incorporated a further 3,912 metres of additional drilling in 13 core drill holes. Both the DFS and the mineral resource are historical in nature and should not be relied upon.
| Adam Wheeler | September 2025 |
| Technical Report on the Mineral Resources of the Nussir and Ulveryggen Projects | 44 |
| 7 | GEOLOGICAL SETTING AND MINERALISATION |
| 7.1 | Nussir |
| 7.1.1 | Regional Geology- Nussir |
The Nussir project area is situated within the Repparfjord-Komagfjord (Pharaoh et al. 1983) Precambrian tectonic window which was uplifted and exposed due to erosion of the overlying Caledonian nappes. The first detailed bedrock mapping of the region was carried out by Reitan (1963). Revised mapping of the northern part was done in the 1970’s by Pharaoh et al (1983). Later, more detailed mapping of the area was conducted by Nilsen & Nilsson (1996). Geochemical studies of the metavolcanic rocks were performed by Jensen (1996).
The bedrock of the window consists predominantly of metavolcanic and metasedimentary rock, as shown in Figure 7-1. The rocks are intruded by mafic, ultramafic and felsic intrusive rocks. Although geochronological constraints are generally scarce, the meta-supracrustal rocks are assumed to be primarily of Early Proterozoic age, even though the lowermost stratigraphic sequences might represent Archaean rocks, as suggested by the comparison to correlative sequences in inner Finnmark. The oldest metavolcanic unit within the Kautokeino Greenstone Belt has revealed an Archaean Age (~2780 Ma, A. Solli pers. comm. 2008). The Paleoproterozoic rocks are overlain by thin sequences of Neoproterozoic sediments. The basement rocks are overthrust by allochthonous rocks of the Caledonian Nappe Complex and have undergone multiphase deformation during the Svecokarelian and Caledonian orogenies.
| Adam Wheeler | September 2025 |
| Technical Report on the Mineral Resources of the Nussir and Ulveryggen Projects | 45 |
Figure 7-1. Nussir Geological Map
[NGU description of stratigraphic units]
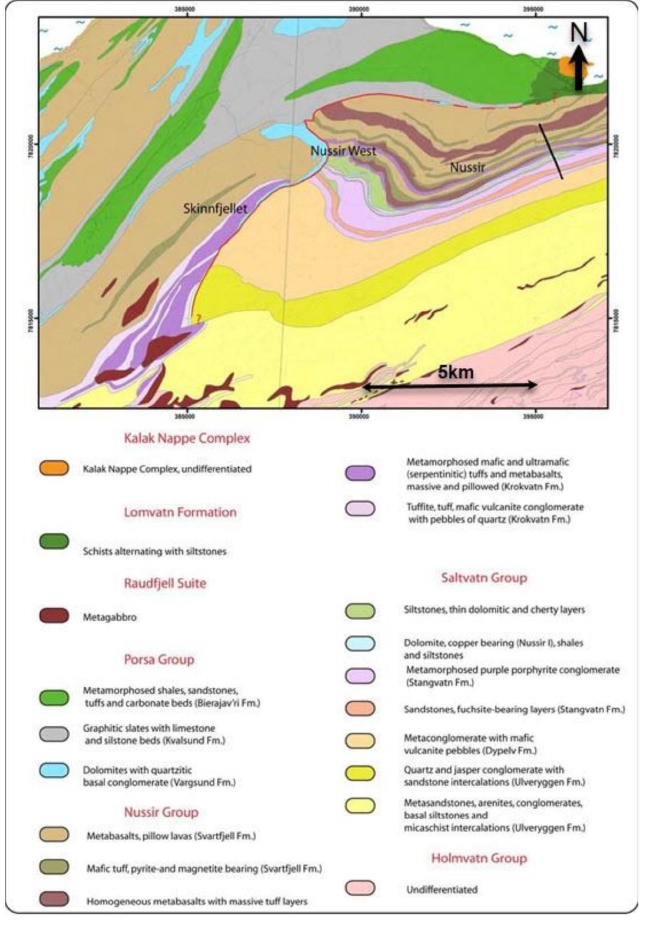
| Adam Wheeler | September 2025 |
| Technical Report on the Mineral Resources of the Nussir and Ulveryggen Projects | 46 |
| 7.1.2 | Local Geology and Mineralisation - Nussir |
The Nussir deposit mineralisation is hosted by yellowish to greenish grey, banded, fine-grained sandstones and siltstones with common carbonate-rich layers. Studies of thin sections show that the rocks have strong variations in deformation, from well-preserved primary layering to strong ductile deformation (Sandstad, 2010). These show that the major ore minerals in the eastern part of Nussir are bornite and chalcocite. They mainly comprise cement of clastic grains of the sandstone and suggest a diagenetic origin for their deposition rather than strictly epigenetic formation, related to deformation of the host rock. Accessory sulphide minerals include chalcopyrite, covelite, wittichenite, carrollite, and cinnabar.
Gold (Au) and Silver (Ag) are closely associated with the Cu-mineralisation. Electrum (AuAg) has been identified at the contact and as inclusions and cracks in bornite. Ag also occurs in minerals associated with Tellurium (Te), Lead (Pb), Selenium (Se) and Bismuth (Bi). Platinum (Pt) most frequently occurs as microscopic grains of sperrylite that form clusters of inclusions in bornite and disseminated, interstitial grains in the silicate matrix of the sandstone.
Other sulphides are rare, although pyrite and molybdenite occur locally. Malachite is observed on surface outcrops. The mineralisation occurs as fine-grained impregnation fracture fillings. The thickness of the mineralised zone varies from zero to more than 4 meters.
| Adam Wheeler | September 2025 |
| Technical Report on the Mineral Resources of the Nussir and Ulveryggen Projects | 47 |
| 7.2 | Ulveryggen |
| 7.2.1 | Regional Geology - Ulveryggen |
The prospect area is comprised of folded Precambrian metasedimentary rocks of the Ulveryggen Formation, part of the Saltvatn Group, that are exposed in the Komagfjord tectonic window, within the Caledonian mountain belt of western Finnmark. Sediments in the general prospect area are typically sandstones and quartzites, trending to what have been previously described as conglomerates in the immediate area of the old Ulveryggen Mine (Nilsen, K. 2019). Evidence of ENE-trending faulting, roughly parallel to the regional trend of bedding, is strong, as is the presence of NNE-trending faulting, particularly obvious in the mine area. Occasional small mafic dikes are also present in the mine area. The Ulveryggen sedimentary units are fault-bounded to the south by older greenstones and to the north by probably younger sedimentary units.
| 7.2.2 | Local Geology and Mineralisation - Ulveryggen |
A plan of the area is shown in Figure 7-6. The mineralization occurs along a 2-kilometer trend between the two main faults and along a fan of smaller faults located in between. NNE-trending strike slip faults offset mineralization along the order of 10’s to several 100’s of meters. Copper mineralization, typically in the form of chalcopyrite, bornite, lesser chalcocite, and secondary malachite, is present as disseminations in conglomerates (partly interpreted as mylonites), on shears, along bedding, in cracks and fractures, and in small, sometimes cross-cutting, quartz veins and veinlets. The thickness of the mineralization appears to diminish with depth as the two main faults coalesce. However, there is strong mineral potential for more to be discovered, heretofore undiscovered, copper mineralization along strike of the main system, both to the east and west.
Clay alteration is apparent in narrow ENE-trending shear zones that have been previously described as thin argillite partings. Although extremely difficult to ascertain in hand samples, mass silicification of the quartzites is probable along the main ENE-trending fault zones.
In section the mineralisation is SE-dipping (from about 60o to vertical), often significantly widening to the top and narrowing to the bottom. Generally, the horizontal length of the mineralised zone is about 2.6 km, with widths up to 200 m, and a vertical extent of approximately 150 m.
Host rocks of the deposit are notably bedded and foliated with the foliation in many cases. The foliation is not necessarily parallel to the bedding, mostly dipping NW or SE with the angles of 22˚ to 40˚, marking gentle, almost symmetrical folds. It appears that NW-dipping predominates.
Mineralized metasedimentary rocks appear to be significantly silicified. Sometimes mineralization occurs as a set of mesothermal quartz veins with rich chalcopyrite-bornite mineralization. The main part of the economic mineralization in the mined-out John open pit is bounded between to two antithetic NE-striking, NW- and SE-dipping shear zones, as shown in Figure 7-2.
| Adam Wheeler | September 2025 |
| Technical Report on the Mineral Resources of the Nussir and Ulveryggen Projects | 48 |
Figure 7-2. John Open Pit, Looking SW
[Picture by Promin AS]
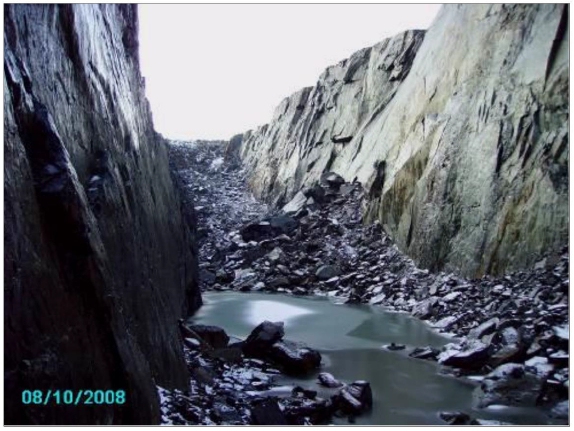
Striations observed in the Erik pit (Figure 7-3) appear flatter than striations in the Hovedfelt pit (Figure 7-4), which implies that the vertical component of the shear zone movement is progressively increasing in the SW direction, while the horizontal component is getting weaker. Kinematics of the shear zone appear to be dextral–normal (SE block uplifted), which is shown by observed shear zone fabrics (Figure 7-5), as well as by porphyroblast (pebbles) rotation.
| Adam Wheeler | September 2025 |
| Technical Report on the Mineral Resources of the Nussir and Ulveryggen Projects | 49 |
Figure 7-3. Erik Open Pit Looking N.
[Picture by Promin AS]
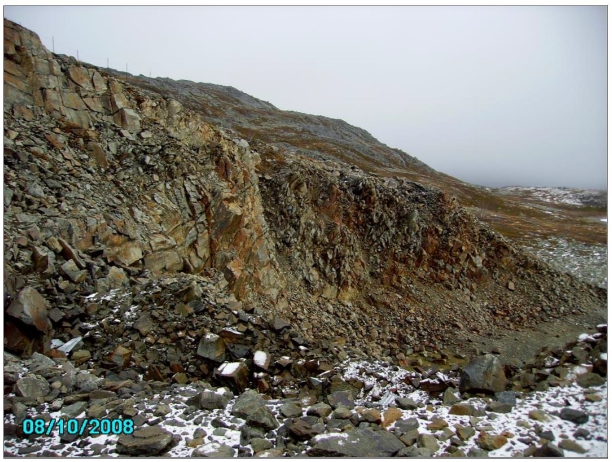
Figure 7-4. Hovedfelt Open pit, NE part, looking NE
[Picture by Promin AS]
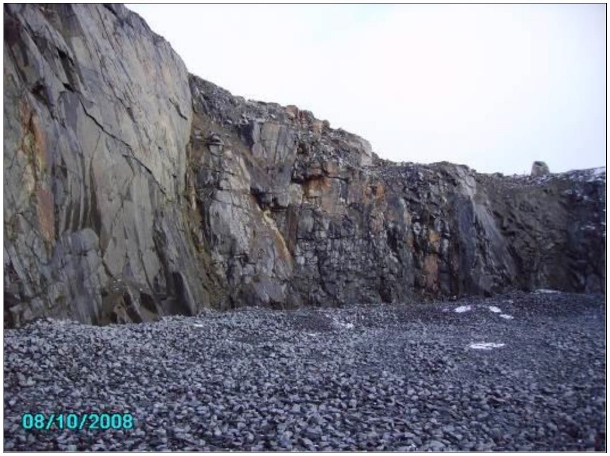
| Adam Wheeler | September 2025 |
| Technical Report on the Mineral Resources of the Nussir and Ulveryggen Projects | 50 |
Figure 7-5. NW-dipping Mineralisation in Erik Open Pit
[Picture by Promin AS]
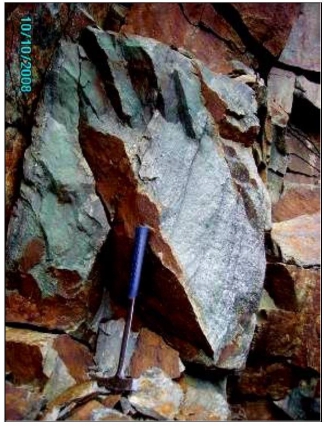
Numerous ductile shear zones with NW orientation cut and displace mineralization, while being mineralized themselves. The shear zone offsets on a larger scale affect the major ore bodies, as shown by the position of the existing pits. Some of the faults also demonstrate the presence of vertical movement component. The faults appear to be reverse in the mineralized faults and normal in the non-mineralized.
The appearance of the dextral shear zones suggests a model of a contractional imbricate fan. of a dextral (and of course reverse) shear zone. The northern (SE-dipping) shear zone appears to be the main structure, while the southern (NW-dipping) structures are in the form of a set of splays (shears), as shown in Figure 7-7. Vertically the shears are reverse, as would result from NW orientated compression, which is supported by the presence of NW-oriented tension gashes observed in the field.
Opening of both NW- and SE-dipping foliation planes due to more recent NE-orientated stresses is also suggested, as suggested by northern tension gashes. It appears that the higher-grade mineralization is related to the intersection of the NW-striking cross-faults with the main structure. Superposition of all or some of these factors caused the formation of the Ulveryggen mineralization, characterized by disseminated and fracture filling texture.
Impressions from the 2017 logging of drill cores indicate that parts of the conglomeratic zones may have been formed by alteration (silicification- carbonatization) of exhalitic volcanics, possibly in combination with larger scale alteration, mobilization and eventually Cu-mineralization by precipitation in the pressure shadows within shear zones. Chlorite in the “conglomerate” matrix and relatively higher Ni- and Cr- background levels in correlation with Cu, may indicate a possible mafic volcanic source for the Ulveryggen mineralisation. Further studies of the Cu-genesis, high Cu-background data from old stream samples, as well as shear-zones, could help define possible promising exploration targets in vicinity of Ulveryggen area.
| Adam Wheeler | September 2025 |
| Technical Report on the Mineral Resources of the Nussir and Ulveryggen Projects | 51 |
Figure 7-6. Plan of Deposit Area and Main Tectonic Features
[After E. Plyuschev, 2008]
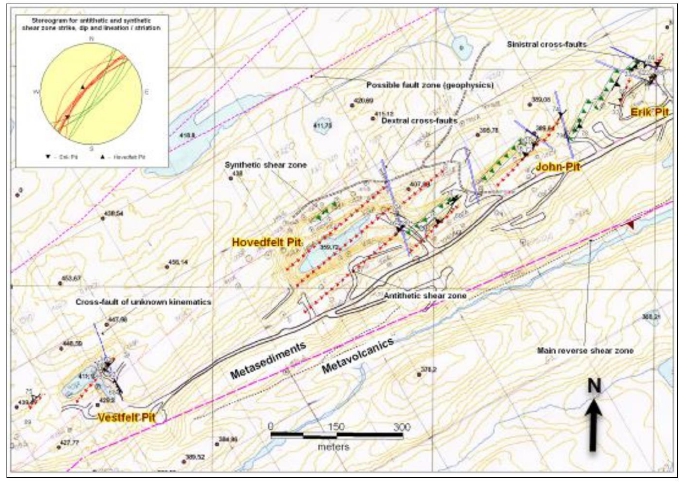
Green triangles – synthetic to main fault zone
Red triangles – antithetic to main fault zone
Figure 7-7. Section of Simplified Tectonic Framework
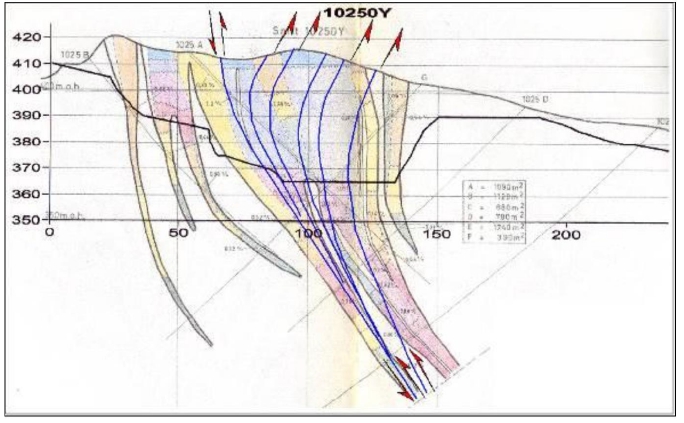
| Adam Wheeler | September 2025 |
| Technical Report on the Mineral Resources of the Nussir and Ulveryggen Projects | 52 |
| 8 | DEPOSIT TYPE |
| 8.1 | Background |
The two Cu-deposits, Nussir and Ulveryggen, have a similar composition of Cu-bearing sulphides. They are probably the result of a similar geological system. They represent examples of sedimentary-associated type of deposits, with many common features found in the Copperbelt in central Africa and Kupferschiefer in Poland and Germany, which include a continental rift environment, hot sub-aquatic conditions, shale/dolomite/conglomerate sequences, stratabound disseminated veinlets of Cu minerals, partly extensive alteration, syngenetic-diagenetic settings and epigenetic events
| 8.2 | Nussir |
The Nussir deposit is considered to be a stratabound sediment hosted copper deposit, and the mineralisation is interpreted as post-diagenetic. The Nussir deposit is a generally homogenous, Cu-ore zone with Ag, Au, some Pt and Pd. It was primarily deposited as a continuous dolomite-schist layer on the sea floor, with relatively little deviation in grade, thickness and other factors. Later events with folding, shearing and alterations have partly affected primary features.
Description of the Copperbelt deposits has many similarities with the mineralisation in the Repparfjord area, in particular with the Nussir deposit. They both have a base of conglomerates overlaid by dolomites and siltstones. Both are interpreted to be associated with deposition in rift basins.
Similar stratigraphy can also be seen in the Kupferschiefer in Poland. At the base there are clastic materials lying in a series of basins, mainly red sandstones and conglomerates, and the uppermost sections are composed of arenites and carbonates.
| 8.3 | Ulveryggen |
The Ulveryggen deposit is also considered to be a stratabound sediment hosted copper deposit, with a similar composition of copper-bearing sulphides to Nussir, but the general mineralogy and genetic setting is different. The Ulveryggen deposit constitutes a more complex orebody, described as sedimentary deposition of copper minerals within layers in sandstone-conglomeratic sequences. The Ulveryggen mineralisation has a different setting, interpreted as syngenetic shear-zones. The Au- Ag and Pt- Pd content is considerably lower at Ulveryggen than at Nussir.
The main Ulveryggen deposit area is dominated by two sub-parallel ENE-trending faults, dipping steeply towards each other. Known mineralization occurs in several pods along a 2-kilometer trend between the two main faults and along a fan of smaller faults located in between. The thickness of mineralization appears to diminish with depth as the two main faults coalesce. However, there is potential for more, heretofore undiscovered, copper mineralization along strike of the main system, both to the east and west.
| Adam Wheeler | September 2025 |
| Technical Report on the Mineral Resources of the Nussir and Ulveryggen Projects | 53 |
| 9 | EXPLORATION |
Blue Moon has not carried out any exploration work on the property. For a description of historical exploration work, including that completed by Nussir ASA and its predecessor companies (AS Prospektering and Terra Holdings), refer to Section 6 - History.
| 10 | DRILLING |
Blue Moon has not carried out any drilling activities on either Nussir or Ulveryggen deposits, and all drilling on these properties and for the mineral resource estimation exercises were completed by prior operators. The current mineral resource estimate is presented in Section 14 of this report with an effective date of January 20th, 2025.
| 10.1 | Nussir |
A total of 211 exploration diamond drillholes, covering over 52,700 m, have been drilled on the Nussir project up to 2019. One drillhole (no.212) was delayed out of the 2019 resource estimation and was drilled in 2020 and confirmed the modelled grade and width. A few additional drillholes were performed in 2024, however, these were solely for metallurgical and processing test work, in order to achieve enough core material to perform material sorting tests and were not intended or used for mineral resource estimation, because they were all twin drill holes of older, successfully completed drillholes. In addition, ten channel samples have been collected from mineralized surface outcropping. A total of approximately 2,600 samples has been assayed.
In 1984, ten channel samples were collected from mineralized surface outcrops. The drilling started in 1985 with six relatively short diamond drill holes, all less than 80 m in length and a dip varying between 50 to 70 degrees. In 1986, further two diamond drillholes were drilled to check the continuity of the mineralization at depth. One of the drillholes confirmed the vertical extension of the mineralization to more than 250 m below surface. The laboratory Mercury Analytical Ltd. was used to analyse the core from the first eight drillholes.
In 1988, six diamond drill holes were drilled. The core was analysed by Caleb Brett Laboratories. A total of 35 diamond drill holes were drilled in the period between 1990 and 1996. Between 1985 and 1996, a total of 600 samples were analysed from 43 drill holes. All samples were analysed for Cu, and partly for Ag and Au. The samples were analysed by different laboratories with unknown analytical methods. For verification purposes, 69 samples from 1990 were assayed in 2008, as described in Section 11. The older samples were not independently used to define blocks defined as Indicated Resources in the current study.
In 2002, 63 samples from nine diamond drillholes were analysed by OMAC Laboratories, Ireland for 47 elements using Aqua Regia digestion and ICP. Ag was the only of the precious metals analysed. However, only a few meters of each of the drill holes were analysed. Typically, the analysed core section analysed was one meter per sample.
The drilling continued in 2006 with the drilling of seven diamond holes. A total of 32 samples from four holes were analysed by OMAC Laboratories, Ireland using 46 elements by Aqua Regia digestion and ICP-OES. In addition, Au was analysed by Fire Assay/AA on 30 g samples.
| Adam Wheeler | September 2025 |
| Technical Report on the Mineral Resources of the Nussir and Ulveryggen Projects | 54 |
407 samples from 9 holes were analysed in 2008 for 46 elements by Aqua Regia digestion and ICP-OES by OMAC Laboratories, Ireland. The digestion is partial for some elements especially Al, Ba, Cr, K, Na, Sn, Sr, Ta, Ti, V and W. In addition, Au, Pt and Pd were analysed by Fire Assay/AA on 30 g samples. The whole cores from drill holes Bh 39 (117.6 m), 40 (43.2 m) and 60 (120 m) were analysed, whereas parts of Bh 19, 20, 54, 55, 57 and 90 were analysed. The analysed core lengths were 1-2 m.
In 2011, a total of six diamond drillholes (1996 m) were drilled on the Nussir deposit. Five of the drill holes (1,432 m) were drilled as infill holes in the eastern part of the deposit to decrease the drill spacing from 250 m to 125 m. In addition, one deep diamond drill hole (564 m) was drilled in the central part of the Nussir deposit to confirm the extension of the mineralization in this previous undrilled zone. The drill hole successfully confirmed an 8.6 m intersection zone (7m true width) averaging 0.69% Cu (including 3.6 m averaging 1,09% Cu) from 541 m downhole. From the 2011 drill campaign, a total of 164 samples (including standards and blanks) were submitted to ALS Chemex laboratory in Piteå. All samples were analysed by 33 element four acid ICP-AES and Au, Pt and Pd 30 g Fire Assay ICP. In the mineralized zone the core was normally analysed on one-meter intervals. However, additional samples of varying length were sampled in zones of interest.
All pre-2011 drill hole collar locations were originally surveyed using a DPOS GPS (TOPCON) with an accuracy of 1-2 dm. The 2011 drill holes were surveyed using a handheld GPS with and later surveyed by DPOS GPS (TOPCON) in 2012. Downhole surveys have been done for all intact drillholes in 2012 using a pee-wee magnetic survey tool. The registered azimuth values in the upper part of some holes were influenced by magnetic rocks and had to be corrected. Gyro based downhole surveying was chosen during 2013 campaign to avoid this problem.
In 2017, 89 drillhole collars were re-measured using a more accurate (within 1-2cm) CPOS GPS instrument, in a re-survey program completed by the company GeoNord. The collar database used in the resource estimation covered in this report is summarised in, with respect to the positioning system used.
Table 10-1. Summary of Collar Positioning Systems – Nussir
| Method | Number | Proportion |
| Unknown (Channels) | 10 | 5% |
| Hand GPS | 15 | 7% |
| DPOS | 107 | 48% |
| CPOS | 89 | 40% |
| TOTAL | 221 | 100% |
Most of the drill holes have been drilled with success. However, in the central parts of the 9 km long mineralized horizon, four drill holes were abandoned before they reached the mineralization. This was due to strongly fractured rocks in an interpreted fault zone.
All cores were transported down to a warehouse with logging facilities and logged for geological, sampling and geotechnical purposes by in-house personnel.
Geotechnical data have been collected from some pre-2011 drill holes, including RQD, core recovery, fracture density and orientation, hardness and joint data. All core drilled from 2008 have been photographed. Data collected on the six diamond drillholes drilled from 2011, includes geology, down hole survey, sample, RQD, core recovery and assay data.
| Adam Wheeler | September 2025 |
| Technical Report on the Mineral Resources of the Nussir and Ulveryggen Projects | 55 |
A summary of the current database, with relation to the different diamond drilling campaigns, to date is shown in Error! Reference source not found. Table 10-2
Table 10-2. Nussir Diamond Drilling Summary
| Year | Number of Holes |
Length (m) | Average Hole Length (m) |
Hole Size |
Core Diameter (mm) |
Drilling Company | Drill Rig |
| 1985 | 6 | 264 | 44 | AQ | 27 | - | - |
| 1986 | 2 | 496 | 248 | AQ | 27 | - | - |
| 1988 | 6 | 1,325 | 221 | AQ | 27 | - | - |
| 1990 | 24 | 1,893 | 78 | AQ | 27 | - | - |
| 1995 | 4 | 724 | 181 | AQ | 27 | - | - |
| 1996 | 4 | 1,182 | 296 | AQ | 27 | - | - |
| 2006 | 7 | 2,687 | 384 | - | 18 | Diamantboring Nord AS | Diamec 262 |
| 2007 | 1 | 78 | 78 | AQ | 27 | - | - |
| 2008 | 30 | 7,116 | 233 | BQTK | 36.5 | Arctic Drilling AS | Diamec 252 |
| 2011 | 6 | 1,996 | 333 | BQTK | 40.7 | Arctic Drilling AS | Diamec 252 |
| 2013 | 21 | 3,222 | 153 | BQTK | 40.7 | ADC Ltd. Oy | K1 with Sandvik drill |
| 2014 | 34 | 9,308 | 274 | NQ/BQ | 47.6/36.5 | Arctic Drilling AS | Atlas U6 and 264 |
| 2015 | 33 | 10,572 | 320 | NQ | 47.6 | Arctic Drilling AS | Atlas U6/264 |
| 2017 | 20 | 7,947 | 397 | NQ | 47.6 | Arctic Drilling AS/Rockma | Atlas U6/264, Sandvik DE 140 MT |
| 2019 | 13 | 3,912 | 301 | NQ | 47.6 | Arctic Drilling AS/Rockma | Atlas U6/264, Sandvik DE 140 MT |
| Total | 211 | 52,722 | 250 |
The 10 lines of channel samples that were taken in 1985 covered an average sampled length of 35 m/line. In 2006, 20 air percussive holes were also drilled, with an average length of 20 m, but samples from these percussive holes were not used in the current resource estimate. Selected core material including intersections from 2013 campaigns are stored in Skaidi, nearby the deposit. Core from 35 older holes is stored at the Norwegian Geological Survey in Løkken.
The drillhole collar locations for all Nussir holes, directions, dips and lengths are shown in Table 10-3 and Table 10-4. Summaries of the main Nussir drillhole intersections are shown in Table 10-5 and Table 10-6.
A plan and cross-sections of the drillhole data are shown in Figure 10-1 and Figure 10-2.
| Adam Wheeler | September 2025 |
| Technical Report on the Mineral Resources of the Nussir and Ulveryggen Projects | 56 |
Table 10-3. Nussir Drillhole Collars, 1985-2011
| Collar Coordinates (m) | |||||||
| YEAR | BHID | Easting | Northing | Elev'n | Azimuth (o) |
Dip (o) |
Length (m) |
| 1985 | NUS-CH-85-001 | 390,533 | 7,818,095 | 371 | 33 | 0 | 3 |
| NUS-CH-85-002 | 390,539 | 7,818,091 | 375 | 33 | 0 | 4 | |
| NUS-CH-85-003 | 391,432 | 7,818,155 | 410 | 340 | 0 | 4 | |
| NUS-CH-85-004 | 393,097 | 7,818,573 | 360 | 330 | 0 | 3 | |
| NUS-CH-85-005 | 395,195 | 7,819,588 | 314 | 330 | 0 | 3 | |
| NUS-CH-85-006 | 395,431 | 7,819,627 | 279 | 340 | 0 | 2 | |
| NUS-CH-85-007 | 390,239 | 7,818,657 | 400 | 80 | 0 | 5 | |
| NUS-CH-85-008 | 390,116 | 7,819,012 | 410 | 50 | 0 | 4 | |
| NUS-CH-85-009 | 390,062 | 7,819,058 | 402 | 50 | 0 | 5 | |
| NUS-CH-85-010 | 396,948 | 7,820,005 | 173 | 340 | 0 | 3 | |
| NUS-DD-85-001 | 395,480 | 7,819,652 | 278 | 170 | 60 | 25 | |
| NUS-DD-85-002 | 395,477 | 7,819,656 | 278 | 170 | 70 | 42 | |
| NUS-DD-85-003 | 395,286 | 7,819,638 | 297 | 155 | 60 | 28 | |
| NUS-DD-85-004 | 393,839 | 7,819,021 | 323 | 160 | 50 | 80 | |
| NUS-DD-85-005 | 392,843 | 7,818,531 | 399 | 158 | 59 | 64 | |
| NUS-DD-85-007 | 390,544 | 7,818,140 | 375 | 197 | 48 | 25 | |
| 1986 | NUS-DD-86-001 | 396,070 | 7,820,037 | 208 | 165 | 60 | 293 |
| NUS-DD-86-002 | 390,259 | 7,819,114 | 405 | 250 | 75 | 203 | |
| 1988 | NUS-DD-88-001 | 396,069 | 7,820,037 | 208 | 165 | 80 | 373 |
| NUS-DD-88-002 | 395,454 | 7,819,765 | 278 | 170 | 80 | 191 | |
| NUS-DD-88-003 | 394,939 | 7,819,647 | 366 | 145 | 85 | 277 | |
| NUS-DD-88-004 | 395,270 | 7,819,656 | 298 | 160 | 80 | 109 | |
| NUS-DD-88-005 | 396,729 | 7,820,053 | 218 | 155 | 60 | 180 | |
| NUS-DD-88-006 | 396,418 | 7,819,991 | 227 | 170 | 65 | 195 | |
| 1990 | NUS-DD-90-001 | 390,231 | 7,819,047 | 414 | 238 | 30 | 93 |
| NUS-DD-90-002 | 390,232 | 7,819,047 | 414 | 239 | 60 | 99 | |
| NUS-DD-90-003 | 390,312 | 7,818,805 | 403 | 261 | 46 | 55 | |
| NUS-DD-90-004 | 390,311 | 7,818,805 | 403 | 253 | 79 | 72 | |
| NUS-DD-90-006 | 390,286 | 7,818,504 | 413 | 288 | 48 | 50 | |
| NUS-DD-90-007 | 390,286 | 7,818,503 | 413 | 290 | 75 | 68 | |
| NUS-DD-90-008 | 390,343 | 7,818,487 | 423 | 270 | 80 | 120 | |
| NUS-DD-90-009 | 390,650 | 7,818,096 | 394 | 186 | 45 | 34 | |
| NUS-DD-90-010 | 390,667 | 7,818,146 | 398 | 187 | 81 | 106 | |
| NUS-DD-90-011 | 391,153 | 7,818,148 | 432 | 171 | 45 | 63 | |
| NUS-DD-90-012 | 391,153 | 7,818,148 | 432 | 172 | 80 | 95 | |
| NUS-DD-90-013 | 391,724 | 7,818,289 | 421 | 165 | 45 | 70 | |
| NUS-DD-90-014 | 391,724 | 7,818,289 | 421 | 165 | 80 | 114 | |
| NUS-DD-90-015 | 392,276 | 7,818,371 | 441 | 170 | 45 | 84 | |
| NUS-DD-90-016 | 392,276 | 7,818,370 | 441 | 170 | 75 | 90 | |
| NUS-DD-90-017 | 392,843 | 7,818,531 | 399 | 157 | 80 | 89 | |
| NUS-DD-90-018 | 393,414 | 7,818,776 | 346 | 153 | 80 | 55 | |
| NUS-DD-90-019 | 393,414 | 7,818,775 | 346 | 163 | 43 | 44 | |
| NUS-DD-90-020 | 393,398 | 7,818,804 | 351 | 154 | 80 | 110 | |
| NUS-DD-90-021 | 393,838 | 7,819,022 | 323 | 160 | 80 | 118 | |
| NUS-DD-90-022 | 393,859 | 7,818,980 | 316 | 153 | 45 | 43 | |
| NUS-DD-90-023 | 394,329 | 7,819,219 | 335 | 155 | 45 | 56 | |
| NUS-DD-90-024 | 394,329 | 7,819,220 | 335 | 155 | 80 | 57 | |
| NUS-DD-90-026 | 394,960 | 7,819,564 | 336 | 145 | 45 | 110 | |
| 1995 | NUS-DD-95-001 | 390,480 | 7,818,709 | 416 | 281 | 69 | 197 |
| NUS-DD-95-002 | 390,415 | 7,818,382 | 425 | 222 | 42 | 124 | |
| NUS-DD-95-003 | 390,415 | 7,818,383 | 425 | 245 | 87 | 150 | |
| NUS-DD-95-004 | 392,791 | 7,818,660 | 454 | 160 | 70 | 253 | |
| Collar Coordinates (m) | |||||||
| YEAR | BHID | Easting | Northing | Elev'n | Azimuth (o) |
Dip (o) |
Length (m) |
| 1996 | NUS-DD-96-001 | 390,622 | 7,818,678 | 435 | 270 | 80 | 368 |
| NUS-DD-96-002 | 391,009 | 7,818,364 | 425 | 165 | 78 | 319 | |
| NUS-DD-96-003 | 391,650 | 7,818,480 | 455 | 165 | 75 | 356 | |
| NUS-DD-96-005 | 396,110 | 7,819,872 | 190 | 155 | 70 | 140 | |
| 2006 | NUS-DD-06-001 | 396,410 | 7,820,160 | 207 | 176 | 80 | 427 |
| NUS-DD-06-002 | 390,826 | 7,818,485 | 433 | 135 | 85 | 520 | |
| NUS-DD-06-003 | 392,730 | 7,818,841 | 435 | 160 | 85 | 403 | |
| NUS-DD-06-004 | 390,824 | 7,818,484 | 434 | 195 | 80 | 469 | |
| NUS-DD-06-005 | 390,824 | 7,818,486 | 434 | 270 | 85 | 306 | |
| NUS-DD-06-006 | 390,360 | 7,819,359 | 444 | 210 | 80 | 443 | |
| NUS-DD-06-007 | 389,972 | 7,819,200 | 398 | 178 | 59 | 120 | |
| 2007 | NUS-DD-07-001 | 391,457 | 7,818,203 | 416 | 180 | 60 | 78 |
| 2008 | NUS-DD-08-001 | 396,203 | 7,819,984 | 200 | 150 | 58 | 230 |
| NUS-DD-08-002 | 396,204 | 7,819,984 | 201 | 150 | 71 | 248 | |
| NUS-DD-08-003 | 396,019 | 7,819,922 | 213 | 140 | 60 | 210 | |
| NUS-DD-08-004 | 396,019 | 7,819,922 | 213 | 150 | 80 | 260 | |
| NUS-DD-08-005 | 395,912 | 7,819,891 | 226 | 138 | 60 | 184 | |
| NUS-DD-08-006 | 395,912 | 7,819,892 | 226 | 140 | 75 | 237 | |
| NUS-DD-08-007 | 395,687 | 7,819,938 | 266 | 160 | 50 | 257 | |
| NUS-DD-08-008 | 395,687 | 7,819,939 | 266 | 160 | 60 | 320 | |
| NUS-DD-08-009 | 395,564 | 7,819,781 | 273 | 160 | 90 | 268 | |
| NUS-DD-08-010 | 395,569 | 7,819,756 | 269 | 160 | 60 | 164 | |
| NUS-DD-08-011 | 395,384 | 7,819,700 | 292 | 160 | 90 | 201 | |
| NUS-DD-08-012 | 395,384 | 7,819,699 | 292 | 160 | 70 | 110 | |
| NUS-DD-08-013 | 395,191 | 7,819,851 | 344 | 160 | 75 | 395 | |
| NUS-DD-08-014 | 395,067 | 7,819,846 | 335 | 160 | 60 | 373 | |
| NUS-DD-08-015 | 394,648 | 7,819,706 | 384 | 160 | 60 | 445 | |
| NUS-DD-08-016 | 394,455 | 7,819,617 | 408 | 160 | 60 | 420 | |
| NUS-DD-08-019 | 395,349 | 7,819,913 | 323 | 160 | 65 | 378 | |
| NUS-DD-08-020 | 395,349 | 7,819,912 | 323 | 160 | 80 | 497 | |
| NUS-DD-08-021 | 396,918 | 7,820,104 | 186 | 160 | 60 | 160 | |
| NUS-DD-08-022 | 396,918 | 7,820,104 | 185 | 160 | 80 | 200 | |
| NUS-DD-08-023 | 397,173 | 7,820,148 | 162 | 160 | 75 | 144 | |
| NUS-DD-08-024 | 397,173 | 7,820,147 | 162 | 160 | 90 | 184 | |
| NUS-DD-08-025 | 396,404 | 7,819,842 | 194 | 160 | 90 | 59 | |
| NUS-DD-08-026 | 396,231 | 7,819,871 | 187 | 150 | 80 | 115 | |
| NUS-DD-08-027 | 397,438 | 7,820,242 | 59 | 160 | 55 | 120 | |
| NUS-DD-08-028 | 397,438 | 7,820,242 | 59 | 160 | 70 | 140 | |
| NUS-DD-08-029 | 397,756 | 7,820,292 | 44 | 160 | 90 | 161 | |
| NUS-DD-08-030 | 395,796 | 7,819,753 | 221 | 160 | 90 | 116 | |
| NUS-DD-08-031 | 398,089 | 7,820,385 | 17 | 80 | 86 | 360 | |
| NUS-DD-08-032 | 390,858 | 7,818,205 | 416 | 190 | 60 | 164 | |
| 2011 | NUS-DD-11-001 | 395,133 | 7,819,635 | 321 | 140 | 86 | 200 |
| NUS-DD-11-002 | 395,224 | 7,819,701 | 320 | 160 | 77 | 194 | |
| NUS-DD-11-003 | 395,224 | 7,819,702 | 320 | 160 | 90 | 238 | |
| NUS-DD-11-004 | 395,412 | 7,819,854 | 310 | 160 | 90 | 462 | |
| NUS-DD-11-005 | 395,304 | 7,819,899 | 330 | 160 | 55 | 339 | |
| NUS-DD-11-006 | 392,731 | 7,818,849 | 456 | 160 | 82 | 563 | |
| Adam Wheeler | September 2025 |
| Technical Report on the Mineral Resources of the Nussir and Ulveryggen Projects | 57 |
Table 10-4. Nussir Drillhole Collars, 2013-2019
| Collar Coordinates (m) | |||||||
| YEAR | BHID | Easting | Northing | Elev'n | Azimuth (o) |
Dip (o) |
Length (m) |
|
2013 |
NUS-DD-13-001 | 389,769 | 7,819,221 | 382 | 170 | 50 | 112 |
| NUS-DD-13-002 | 389,523 | 7,819,182 | 345 | 180 | 55 | 154 | |
| NUS-DD-13-003 | 389,280 | 7,819,335 | 312 | 208 | 52 | 162 | |
| NUS-DD-13-004 | 389,763 | 7,819,478 | 402 | 178 | 81 | 437 | |
| NUS-DD-13-005 | 389,706 | 7,819,124 | 367 | 178 | 51 | 175 | |
| NUS-DD-13-006 | 389,711 | 7,819,154 | 368 | 0 | 90 | 14 | |
| NUS-DD-13-007 | 389,172 | 7,819,372 | 293 | 208 | 50 | 64 | |
| NUS-DD-13-008 | 389,048 | 7,819,584 | 290 | 160 | 55 | 247 | |
| NUS-DD-13-009 | 390,824 | 7,818,070 | 388 | 180 | 44 | 61 | |
| NUS-DD-13-010 | 390,635 | 7,818,086 | 391 | 170 | 46 | 51 | |
| NUS-DD-13-011 | 389,605 | 7,819,222 | 360 | 174 | 45 | 71 | |
| NUS-DD-13-012 | 389,513 | 7,819,207 | 343 | 182 | 44 | 51 | |
| NUS-DD-13-013 | 389,200 | 7,819,315 | 302 | 275 | 44 | 36 | |
| NUS-DD-13-014 | 389,251 | 7,819,352 | 308 | 342 | 44 | 111 | |
| NUS-DD-13-015 | 389,175 | 7,819,181 | 298 | 346 | 44 | 54 | |
| NUS-DD-13-016 | 389,228 | 7,819,121 | 310 | 42 | 46 | 29 | |
| NUS-DD-13-017A | 389,019 | 7,819,449 | 262 | 197 | 45 | 23 | |
| NUS-DD-13-017B | 389,030 | 7,819,450 | 263 | 197 | 45 | 45 | |
| NUS-DD-13-018 | 389,343 | 7,819,524 | 331 | 203 | 81 | 600 | |
| NUS-DD-13-019 | 390,232 | 7,819,047 | 414 | 239 | 60 | 120 | |
| NUS-DD-13-020 | 393,594 | 7,819,259 | 382 | 139 | 83 | 604 | |
|
2014 |
NUS-DD-14-001 | 391,209 | 7,818,993 | 453 | 226 | 85 | 1,101 |
| NUS-DD-14-002 | 393,477 | 7,819,510 | 432 | 167 | 83 | 979 | |
| NUS-DD-14-003B | 391,601 | 7,818,802 | 470 | 154 | 83 | 905 | |
| NUS-DD-14-003C | 391,601 | 7,818,802 | 470 | 154 | 83 | 899 | |
| NUS-DD-14-004 | 392,616 | 7,819,071 | 477 | 154 | 83 | 908 | |
| NUS-DD-14-005 | 390,623 | 7,819,427 | 470 | 224 | 83 | 751 | |
| NUS-DD-14-006 | 394,565 | 7,819,323 | 315 | 157 | 45 | 64 | |
| NUS-DD-14-007 | 394,070 | 7,819,093 | 320 | 153 | 50 | 36 | |
| NUS-DD-14-008 | 393,828 | 7,819,039 | 328 | 161 | 83 | 161 | |
| NUS-DD-14-009 | 393,646 | 7,818,889 | 324 | 153 | 45 | 32 | |
| NUS-DD-14-010 | 393,146 | 7,818,627 | 365 | 158 | 45 | 31 | |
| NUS-DD-14-011 | 392,984 | 7,818,553 | 379 | 163 | 60 | 32 | |
| NUS-DD-14-012 | 392,946 | 7,818,539 | 386 | 163 | 55 | 30 | |
| NUS-DD-14-013 | 392,917 | 7,818,514 | 385 | 160 | 60 | 34 | |
| NUS-DD-14-014 | 392,882 | 7,818,492 | 385 | 160 | 60 | 8 | |
| NUS-DD-14-014B | 392,883 | 7,818,494 | 387 | 160 | 15 | ||
| NUS-DD-14-015 | 392,853 | 7,818,495 | 394 | 160 | 60 | 26 | |
| NUS-DD-14-016 | 392,843 | 7,818,538 | 402 | 343 | 85 | 164 | |
| NUS-DD-14-017 | 392,843 | 7,818,534 | 403 | 160 | 87 | 111 | |
| NUS-DD-14-018 | 392,825 | 7,818,487 | 398 | 163 | 55 | 31 | |
| NUS-DD-14-019 | 392,797 | 7,818,479 | 401 | 168 | 50 | 35 | |
| NUS-DD-14-020 | 392,768 | 7,818,468 | 407 | 163 | 55 | 37 | |
| NUS-DD-14-021 | 392,735 | 7,818,457 | 409 | 163 | 50 | 50 | |
| NUS-DD-14-022 | 392,548 | 7,818,373 | 409 | 343 | 45 | 40 | |
| NUS-DD-14-022B | 392,548 | 7,818,373 | 409 | 153 | 50 | 31 | |
| NUS-DD-14-023 | 391,941 | 7,818,296 | 420 | 158 | 55 | 55 | |
| NUS-DD-14-024 | 391,426 | 7,818,341 | 452 | 168 | 83 | 327 | |
| NUS-DD-14-025 | 393,396 | 7,818,806 | 349 | 330 | 77 | 236 | |
| NUS-DD-14-026 | 392,844 | 7,818,533 | 401 | 339 | 74 | 282 | |
| NUS-DD-14-027 | 392,842 | 7,818,539 | 403 | 339 | 77 | 212 | |
| NUS-DD-14-028 | 392,844 | 7,818,534 | 403 | 343 | 87 | 150 | |
| NUS-DD-14-029B | 392,275 | 7,818,373 | 442 | 340 | 76 | 300 | |
| NUS-DD-14-030 | 391,662 | 7,818,575 | 469 | 162 | 83 | 571 | |
| NUS-DD-14-031 | 392,183 | 7,818,664 | 499 | 157 | 83 | 584 | |
| Collar Coordinates (m) | |||||||
| YEAR | BHID | Easting | Northing | Elev'n | Azimuth (o) |
Dip (o) |
Length (m) |
| 2015 | NUS-DD-15-001 | 395,635 | 7,819,958 | 267 | 160 | 75 | 422 |
| NUS-DD-15-002 | 395,846 | 7,820,008 | 231 | 160 | 71 | 357 | |
| NUS-DD-15-003 | 396,324 | 7,820,019 | 219 | 160 | 83 | 312 | |
| NUS-DD-15-004 | 396,083 | 7,819,819 | 191 | 160 | 79 | 63 | |
| NUS-DD-15-006 | 393,834 | 7,819,048 | 324 | 340 | 78 | 376 | |
| NUS-DD-15-007 | 393,710 | 7,818,986 | 325 | 340 | 77 | 342 | |
| NUS-DD-15-008 | 393,627 | 7,818,912 | 327 | 340 | 85 | 170 | |
| NUS-DD-15-009 | 393,514 | 7,818,858 | 335 | 340 | 78 | 225 | |
| NUS-DD-15-010 | 393,241 | 7,818,725 | 362 | 340 | 72 | 203 | |
| NUS-DD-15-011 | 393,083 | 7,818,604 | 368 | 340 | 73 | 90 | |
| NUS-DD-15-012 | 393,063 | 7,818,616 | 373 | 340 | 68 | 336 | |
| NUS-DD-15-013 | 392,622 | 7,818,417 | 408 | 340 | 76 | 96 | |
| NUS-DD-15-014 | 392,106 | 7,818,334 | 435 | 160 | 82 | 121 | |
| NUS-DD-15-015 | 392,055 | 7,818,473 | 477 | 160 | 83 | 350 | |
| NUS-DD-15-016 | 392,404 | 7,818,552 | 486 | 160 | 83 | 330 | |
| NUS-DD-15-017 | 392,584 | 7,818,628 | 477 | 160 | 84 | 362 | |
| NUS-DD-15-018 | 391,590 | 7,818,230 | 419 | 175 | 80 | 83 | |
| NUS-DD-15-019 | 391,862 | 7,818,486 | 456 | 160 | 84 | 402 | |
| NUS-DD-15-020 | 392,001 | 7,818,608 | 482 | 160 | 84 | 552 | |
| NUS-DD-15-021 | 392,472 | 7,818,786 | 471 | 160 | 83 | 563 | |
| NUS-DD-15-022 | 392,938 | 7,818,961 | 456 | 160 | 83 | 575 | |
| NUS-DD-15-023 | 393,186 | 7,819,008 | 448 | 160 | 84 | 510 | |
| NUS-DD-15-024 | 393,432 | 7,819,101 | 393 | 160 | 83 | 418 | |
| NUS-DD-15-025 | 391,422 | 7,818,464 | 458 | 175 | 83 | 472 | |
| NUS-DD-15-026 | 391,180 | 7,818,496 | 434 | 175 | 83 | 522 | |
| NUS-DD-15-027 | 391,210 | 7,818,343 | 439 | 175 | 79 | 326 | |
| NUS-DD-15-028 | 391,282 | 7,818,190 | 428 | 175 | 80 | 116 | |
| NUS-DD-15-029 | 394,055 | 7,819,131 | 322 | 160 | 85 | 164 | |
| NUS-DD-15-030 | 393,848 | 7,819,314 | 393 | 160 | 81 | 482 | |
| NUS-DD-15-031 | 393,063 | 7,818,616 | 379 | 340 | 73 | 246 | |
| NUS-DD-15-032 | 393,958 | 7,819,089 | 320 | 340 | 78 | 242 | |
| NUS-DD-15-033 | 394,139 | 7,819,237 | 351 | 160 | 84 | 326 | |
| NUS-DD-15-034 | 393,650 | 7,819,205 | 379 | 160 | 82 | 404 | |
| 2017 | NUS-DD-179 | 395,890 | 7,819,786 | 211 | 160 | 80 | 100 |
| NUS-DD-180 | 392,868 | 7,818,888 | 452 | 160 | 70 | 470 | |
| NUS-DD-181 | 396,206 | 7,820,022 | 205 | 340 | 84 | 461 | |
| NUS-DD-182 | 393,047 | 7,818,899 | 452 | 160 | 79 | 480 | |
| NUS-DD-183 | 396,048 | 7,820,000 | 209 | 310 | 80 | 504 | |
| NUS-DD-184 | 393,135 | 7,819,028 | 457 | 160 | 82 | 610 | |
| NUS-DD-185 | 395,839 | 7,819,933 | 239 | 340 | 82 | 499 | |
| NUS-DD-186 | 396,597 | 7,820,127 | 219 | 20 | 78 | 473 | |
| NUS-DD-187 | 396,570 | 7,820,091 | 225 | 160 | 85 | 299 | |
| NUS-DD-188 | 396,604 | 7,819,902 | 175 | 340 | 77 | 56 | |
| NUS-DD-189 | 392,377 | 7,818,702 | 481 | 160 | 78 | 512 | |
| NUS-DD-190 | 392,630 | 7,818,789 | 468 | 160 | 71 | 465 | |
| NUS-DD-191 | 393,353 | 7,819,181 | 401 | 180 | 73 | 577 | |
| NUS-DD-192 | 393,479 | 7,819,172 | 385 | 170 | 81 | 531 | |
| NUS-DD-193 | 394,195 | 7,819,185 | 328 | 345 | 82 | 185 | |
| NUS-DD-194 | 393,786 | 7,819,317 | 394 | 164 | 79 | 569 | |
| NUS-DD-195 | 393,991 | 7,819,401 | 405 | 169 | 85 | 625 | |
| NUS-DD-196 | 393,971 | 7,819,045 | 314 | 342 | 83 | 86 | |
| NUS-DD-197 | 392,450 | 7,818,284 | 407 | 339 | 45 | 132 | |
| NUS-DD-198 | 393,287 | 7,818,720 | 356 | 165 | 83 | 71 | |
| 2019 | NUS-DD-199 | 396,748 | 7,820,206 | 204 | 216 | 85 | 488 |
| NUS-DD-200 | 397,019 | 7,820,171 | 173 | 179 | 66 | 200 | |
| NUS-DD-201 | 396,988 | 7,820,171 | 176 | 276 | 80 | 300 | |
| NUS-DD-202 | 397,218 | 7,820,181 | 151 | 105 | 60 | 200 | |
| NUS-DD-203 | 397,218 | 7,820,181 | 151 | 317 | 72 | 350 | |
| NUS-DD-204 | 396,761 | 7,820,172 | 198 | 182 | 74 | 328 | |
| NUS-DD-205 | 396,572 | 7,820,092 | 225 | 176 | 77 | 330 | |
| NUS-DD-206 | 396,766 | 7,819,930 | 185 | 338 | 41 | 30 | |
| NUS-DD-207 | 396,777 | 7,819,922 | 177 | 346 | 51 | 93 | |
| NUS-DD-208 | 397,007 | 7,820,220 | 175 | 321 | 83 | 428 | |
| NUS-DD-209 | 397,440 | 7,820,348 | 48 | 243 | 78 | 270 | |
| NUS-DD-210 | 397,596 | 7,820,276 | 43 | 160 | 68 | 120 | |
| NUS-DD-211 | 397,504 | 7,820,391 | 42 | 96 | 71 | 330 | |
| Adam Wheeler | September 2025 |
| Technical Report on the Mineral Resources of the Nussir and Ulveryggen Projects | 58 |
Table 10-5. Nussir – Main Drillhole intersections, 1985-2011
| YEAR | BHID | FROM | TO | Cu | Length | True Thickness |
| m | m | % | m | m | ||
| 1985 | NUS-DD-85-001 | 15.0 | 17.7 | 1.07 | 2.7 | 2.4 |
| NUS-DD-85-002 | 26.0 | 28.3 | 1.41 | 2.3 | 1.9 | |
| NUS-DD-85-003 | 19.2 | 22.6 | 2.46 | 3.4 | 3.1 | |
| NUS-DD-85-004 | 67.0 | 72.0 | 1.10 | 5.0 | 4.6 | |
| NUS-DD-85-005 | 53.0 | 57.7 | 1.59 | 4.7 | 4.3 | |
| NUS-DD-85-007 | 17.6 | 21.6 | 1.48 | 4.0 | 3.5 | |
| 1986 | NUS-DD-86-001 | 275.2 | 279.7 | 1.70 | 4.5 | 4.1 |
| NUS-DD-86-002 | 140.3 | 148.0 | 1.25 | 7.7 | 4.4 | |
| 1988 | NUS-DD-88-001 | 350.8 | 352.6 | 1.59 | 1.8 | 1.6 |
| NUS-DD-88-002 | 176.2 | 182.8 | 1.10 | 6.6 | 5.2 | |
| NUS-DD-88-003 | 269.7 | 271.0 | 0.70 | 1.4 | 1.2 | |
| NUS-DD-88-004 | 57.0 | 57.5 | 0.78 | 0.5 | 0.4 | |
| NUS-DD-88-005 | 147.0 | 148.7 | 0.09 | 1.7 | 1.5 | |
| NUS-DD-88-006 | 188.9 | 191.9 | 1.20 | 3.0 | 2.6 | |
| 1990 | NUS-DD-90-001 | 40.0 | 43.0 | 1.00 | 3.0 | 2.1 |
| NUS-DD-90-002 | 44.0 | 49.0 | 0.66 | 5.0 | 3.7 | |
| NUS-DD-90-003 | 41.0 | 45.0 | 1.15 | 4.0 | 3.9 | |
| NUS-DD-90-004 | 59.0 | 65.0 | 1.33 | 6.0 | 4.9 | |
| NUS-DD-90-006 | 40.0 | 45.0 | 1.10 | 5.0 | 4.8 | |
| NUS-DD-90-007 | 48.0 | 53.3 | 1.31 | 5.3 | 4.5 | |
| NUS-DD-90-008 | 96.0 | 101.0 | 1.32 | 5.0 | 4.1 | |
| NUS-DD-90-009 | 24.0 | 28.0 | 1.47 | 4.0 | 2.8 | |
| NUS-DD-90-010 | 96.0 | 103.0 | 0.95 | 7.0 | 5.4 | |
| NUS-DD-90-011 | 56.0 | 60.0 | 1.24 | 4.0 | 3.9 | |
| NUS-DD-90-012 | 80.0 | 86.0 | 0.93 | 6.0 | 4.7 | |
| NUS-DD-90-013 | 55.0 | 58.0 | 0.10 | 3.0 | 3.0 | |
| NUS-DD-90-014 | 99.0 | 101.0 | 0.64 | 2.0 | 1.5 | |
| NUS-DD-90-015 | 74.0 | 75.0 | 1.02 | 1.0 | 1.0 | |
| NUS-DD-90-017 | 73.9 | 77.7 | 1.82 | 3.8 | 2.7 | |
| NUS-DD-90-018 | 52.1 | 54.9 | 0.55 | 2.8 | 2.0 | |
| NUS-DD-90-019 | 37.0 | 40.0 | 1.33 | 3.0 | 2.9 | |
| NUS-DD-90-020 | 94.0 | 97.0 | 1.40 | 3.0 | 2.2 | |
| NUS-DD-90-021 | 97.0 | 100.0 | 1.23 | 3.0 | 2.0 | |
| NUS-DD-90-022 | 19.0 | 22.0 | 1.17 | 3.0 | 2.8 | |
| NUS-DD-90-023 | 23.0 | 25.0 | 0.79 | 2.0 | 1.9 | |
| NUS-DD-90-024 | 37.0 | 41.0 | 0.80 | 4.0 | 2.8 | |
| NUS-DD-90-026 | 90.0 | 91.0 | 0.57 | 1.0 | 1.0 | |
| 1995 | NUS-DD-95-001 | 184.0 | 192.0 | 0.84 | 8.0 | 6.8 |
| NUS-DD-95-002 | 116.0 | 122.0 | 0.98 | 6.0 | 5.2 | |
| NUS-DD-95-003 | 133.9 | 140.0 | 1.19 | 6.2 | 4.6 | |
| NUS-DD-95-004 | 243.0 | 246.0 | 1.17 | 3.0 | 2.5 |
| YEAR | BHID | FROM | TO | Cu | Length | True Thickness |
| m | m | % | m | m | ||
|
1996 |
NUS-DD-96-001 | 355.0 | 362.0 | 1.51 | 7.0 | 5.5 |
| NUS-DD-96-002 | 309.0 | 313.0 | 1.29 | 4.0 | 2.9 | |
| NUS-DD-96-003 | 343.0 | 347.5 | 1.58 | 4.5 | 3.4 | |
| NUS-DD-96-005 | 127.0 | 130.0 | 0.98 | 3.0 | 2.1 | |
|
2006 |
NUS-DD-06-001 | 415.0 | 417.0 | 0.54 | 2.0 | 1.4 |
| NUS-DD-06-002 | 505.0 | 512.5 | 1.26 | 7.5 | 5.2 | |
| NUS-DD-06-004 | 438.1 | 442.2 | 1.50 | 4.1 | 3.9 | |
| NUS-DD-06-007 | 24.3 | 29.0 | 1.27 | 4.7 | 4.1 | |
| 2007 | NUS-DD-07-001 | 52.0 | 56.0 | 1.29 | 4.0 | 3.6 |
|
2008 |
NUS-DD-08-001 | 195.0 | 198.0 | 0.98 | 3.0 | 2.8 |
| NUS-DD-08-002 | 232.7 | 235.0 | 2.06 | 2.3 | 1.9 | |
| NUS-DD-08-003 | 174.2 | 177.1 | 0.48 | 2.9 | 2.6 | |
| NUS-DD-08-004 | 258.0 | 260.0 | 0.54 | 2.0 | 1.5 | |
| NUS-DD-08-005 | 174.6 | 177.5 | 1.35 | 2.9 | 2.6 | |
| NUS-DD-08-006 | 207.6 | 210.9 | 1.29 | 3.3 | 2.5 | |
| NUS-DD-08-008 | 309.0 | 313.8 | 1.39 | 4.8 | 4.3 | |
| NUS-DD-08-009 | 259.4 | 265.0 | 1.25 | 5.6 | 3.2 | |
| NUS-DD-08-010 | 132.6 | 139.0 | 1.48 | 6.4 | 6.0 | |
| NUS-DD-08-011 | 134.5 | 144.4 | 1.60 | 9.9 | 5.7 | |
| NUS-DD-08-012 | 85.2 | 89.0 | 1.05 | 3.8 | 3.0 | |
| NUS-DD-08-013 | 374.0 | 378.9 | 0.27 | 4.9 | 4.0 | |
| NUS-DD-08-014 | 320.2 | 324.0 | 0.63 | 3.8 | 3.6 | |
| NUS-DD-08-015 | 422.9 | 425.6 | 0.43 | 2.7 | 2.5 | |
| NUS-DD-08-016 | 405.2 | 407.3 | 0.51 | 2.1 | 2.0 | |
| NUS-DD-08-019 | 357.3 | 361.8 | 0.61 | 4.5 | 4.0 | |
| NUS-DD-08-020 | 485.4 | 488.7 | 0.57 | 3.3 | 2.4 | |
| NUS-DD-08-021 | 125.1 | 128.8 | 1.37 | 3.7 | 2.9 | |
| NUS-DD-08-022 | 154.7 | 158.8 | 0.14 | 4.1 | 2.5 | |
| NUS-DD-08-023 | 124.0 | 129.9 | 1.12 | 5.9 | 4.3 | |
| NUS-DD-08-024 | 168.3 | 173.1 | 0.66 | 4.8 | 2.8 | |
| NUS-DD-08-025 | 30.4 | 32.7 | 2.34 | 2.3 | 1.3 | |
| NUS-DD-08-026 | 93.5 | 95.7 | 2.00 | 2.2 | 1.7 | |
| NUS-DD-08-027 | 99.1 | 103.1 | 0.79 | 4.0 | 3.3 | |
| NUS-DD-08-028 | 101.7 | 104.9 | 1.82 | 3.2 | 2.9 | |
| NUS-DD-08-030 | 111.9 | 114.5 | 0.54 | 2.6 | 1.5 | |
| NUS-DD-08-032 | 147.5 | 152.5 | 1.06 | 5.0 | 4.2 | |
|
2011 |
NUS-DD-11-001 | 120.0 | 123.0 | 0.81 | 3.0 | 1.9 |
| NUS-DD-11-002 | 146.7 | 150.0 | 0.31 | 3.3 | 2.5 | |
| NUS-DD-11-003 | 223.0 | 228.3 | 0.19 | 5.3 | 3.0 | |
| NUS-DD-11-004 | 454.1 | 459.8 | 0.38 | 5.8 | 3.9 | |
| NUS-DD-11-005 | 314.0 | 318.0 | 0.75 | 4.0 | 3.7 | |
| NUS-DD-11-006 | 541.4 | 550.0 | 0.69 | 8.6 | 7.0 |
| Adam Wheeler | September 2025 |
| Technical Report on the Mineral Resources of the Nussir and Ulveryggen Projects | 59 |
Table 10-6. Nussir – Main Drillhole intersections, 2013-2019
| YEAR | BHID | FROM | TO | Cu | Length | True Thickness |
| m | m | % | m | m | ||
| 2013 | NUS-DD-13-001 | 17.0 | 21.8 | 1.18 | 4.8 | 4.5 |
| NUS-DD-13-003 | 142.6 | 146.7 | 1.81 | 4.1 | 3.5 | |
| NUS-DD-13-004 | 380.2 | 389.5 | 1.30 | 9.3 | 6.3 | |
| NUS-DD-13-010 | 9.0 | 12.1 | 1.20 | 3.1 | 2.5 | |
| NUS-DD-13-011 | 24.0 | 30.0 | 1.87 | 6.0 | 5.4 | |
| NUS-DD-13-012 | 11.5 | 13.2 | 0.62 | 1.8 | 1.7 | |
| NUS-DD-13-018 | 417.2 | 427.2 | 0.00 | 10.0 | 6.4 | |
| NUS-DD-13-019 | 45.5 | 50.4 | 0.64 | 4.9 | 3.3 | |
| NUS-DD-13-020 | 588.7 | 594.9 | 1.33 | 6.2 | 4.9 | |
| 2014 | NUS-DD-14-001 | 1078.8 | 1088.4 | 0.93 | 9.7 | 7.4 |
| NUS-DD-14-002 | 950.4 | 954.2 | 0.85 | 3.8 | 3.3 | |
| NUS-DD-14-003C | 888.5 | 891.9 | 3.12 | 3.4 | 2.9 | |
| NUS-DD-14-004 | 803.8 | 808.0 | 0.97 | 4.2 | 3.6 | |
| NUS-DD-14-005 | 722.4 | 730.0 | 1.11 | 7.6 | 4.9 | |
| NUS-DD-14-006 | 10.2 | 12.7 | 0.53 | 2.5 | 2.5 | |
| NUS-DD-14-008 | 143.0 | 147.0 | 2.41 | 4.0 | 2.8 | |
| NUS-DD-14-011 | 15.2 | 18.5 | 0.92 | 3.3 | 3.0 | |
| NUS-DD-14-013 | 6.3 | 9.0 | 1.24 | 2.7 | 2.4 | |
| NUS-DD-14-014B | 5.4 | 9.7 | 1.20 | 4.3 | 3.9 | |
| NUS-DD-14-015 | 17.8 | 22.0 | 1.57 | 4.2 | 3.8 | |
| NUS-DD-14-016 | 152.4 | 163.0 | 1.04 | 10.6 | 5.2 | |
| NUS-DD-14-017 | 98.3 | 102.8 | 1.58 | 4.6 | 2.8 | |
| NUS-DD-14-018 | 19.9 | 22.0 | 0.59 | 2.1 | 2.0 | |
| NUS-DD-14-019 | 27.3 | 28.9 | 0.94 | 1.6 | 1.5 | |
| NUS-DD-14-020 | 29.5 | 32.7 | 0.70 | 3.2 | 3.0 | |
| NUS-DD-14-024 | 313.1 | 316.5 | 1.26 | 3.4 | 2.6 | |
| NUS-DD-14-025 | 218.7 | 225.1 | 0.92 | 6.4 | 2.6 | |
| NUS-DD-14-026 | 259.5 | 267.7 | 0.36 | 8.2 | 2.9 | |
| NUS-DD-14-027 | 203.5 | 217.1 | 1.18 | 13.6 | 5.2 | |
| NUS-DD-14-028 | 121.0 | 125.7 | 1.48 | 4.7 | 2.6 | |
| NUS-DD-14-029B | 271.4 | 275.0 | 1.04 | 3.6 | 1.4 | |
| NUS-DD-14-031 | 557.4 | 562.0 | 0.78 | 4.6 | 3.8 |
| YEAR | BHID | FROM | TO | Cu | Length | True Thickness |
| m | m | % | m | m | ||
|
2015 |
NUS-DD-15-001 | 398.8 | 403.5 | 1.49 | 4.7 | 4.1 |
| NUS-DD-15-002 | 342.6 | 345.9 | 1.62 | 3.3 | 2.7 | |
| NUS-DD-15-003 | 296.7 | 300.3 | 1.12 | 3.6 | 2.6 | |
| NUS-DD-15-004 | 54.3 | 57.7 | 0.93 | 3.4 | 2.5 | |
| NUS-DD-15-006 | 238.0 | 245.4 | 1.71 | 7.4 | 2.8 | |
| NUS-DD-15-007 | 200.7 | 208.2 | 1.66 | 7.5 | 3.5 | |
| NUS-DD-15-008 | 83.0 | 98.5 | 1.44 | 15.5 | 8.4 | |
| NUS-DD-15-009 | 207.5 | 216.1 | 1.14 | 8.6 | 3.0 | |
| NUS-DD-15-010 | 180.0 | 190.5 | 0.59 | 10.5 | 4.2 | |
| NUS-DD-15-011 | 74.0 | 81.1 | 0.84 | 7.1 | 2.2 | |
| NUS-DD-15-013 | 80.6 | 88.5 | 0.87 | 7.9 | 3.4 | |
| NUS-DD-15-016 | 318.2 | 329.0 | 0.74 | 10.8 | 9.5 | |
| NUS-DD-15-017 | 340.8 | 345.0 | 1.64 | 4.2 | 3.6 | |
| NUS-DD-15-018 | 50.2 | 54.6 | 1.20 | 4.4 | 3.0 | |
| NUS-DD-15-020 | 531.9 | 536.5 | 1.43 | 4.6 | 4.0 | |
| NUS-DD-15-021 | 548.8 | 552.3 | 1.18 | 3.5 | 2.9 | |
| NUS-DD-15-022 | 560.2 | 572.0 | 1.24 | 11.8 | 9.9 | |
| NUS-DD-15-023 | 443.3 | 447.7 | 0.98 | 4.4 | 3.9 | |
| NUS-DD-15-024 | 397.7 | 401.0 | 1.44 | 3.3 | 2.9 | |
| NUS-DD-15-025 | 441.9 | 445.9 | 0.92 | 4.0 | 3.6 | |
| NUS-DD-15-026 | 512.0 | 518.0 | 0.92 | 6.0 | 4.9 | |
| NUS-DD-15-027 | 308.7 | 313.0 | 1.16 | 4.3 | 3.2 | |
| NUS-DD-15-028 | 101.2 | 107.0 | 1.24 | 5.8 | 4.0 | |
| NUS-DD-15-029 | 131.7 | 137.6 | 1.08 | 5.9 | 3.9 | |
| NUS-DD-15-030 | 445.6 | 449.2 | 1.22 | 3.6 | 3.2 | |
| NUS-DD-15-031 | 176.0 | 191.0 | 1.37 | 15.0 | 4.8 | |
| NUS-DD-15-032 | 221.0 | 231.0 | 1.32 | 10.0 | 4.3 | |
| NUS-DD-15-033 | 296.0 | 300.6 | 0.94 | 4.6 | 2.2 | |
| NUS-DD-15-034 | 393.1 | 397.6 | 1.16 | 4.5 | 4.0 | |
2017 |
NUS-DD-179 | 86.8 | 91.0 | 2.01 | 4.2 | 3.1 |
| NUS-DD-180 | 459.8 | 465.5 | 0.53 | 5.7 | 4.8 | |
| NUS-DD-181 | 403.9 | 407.9 | 0.53 | 4.0 | 2.7 | |
| NUS-DD-182 | 469.4 | 475.0 | 0.59 | 5.6 | 4.3 | |
| NUS-DD-183 | 481.9 | 484.6 | 0.79 | 2.7 | 1.8 | |
| NUS-DD-184 | 601.0 | 608.5 | 0.72 | 7.5 | 5.6 | |
| NUS-DD-185 | 493.5 | 496.4 | 0.60 | 2.9 | 1.3 | |
| NUS-DD-187 | 449.5 | 453.3 | 0.89 | 3.8 | 1.8 | |
| NUS-DD-188 | 20.5 | 38.0 | 1.93 | 17.5 | 7.2 | |
| NUS-DD-189 | 493.7 | 497.5 | 1.59 | 3.8 | 3.1 | |
| NUS-DD-190 | 446.8 | 451.0 | 1.18 | 4.2 | 3.6 | |
| NUS-DD-191 | 561.9 | 565.3 | 1.08 | 3.4 | 2.7 | |
| NUS-DD-192 | 508.0 | 513.0 | 1.25 | 5.0 | 3.7 | |
| NUS-DD-193 | 168.0 | 178.5 | 0.69 | 10.5 | 5.1 | |
| NUS-DD-194 | 552.9 | 561.2 | 0.88 | 8.3 | 6.2 | |
| NUS-DD-195 | 610.7 | 617.2 | 0.95 | 6.5 | 4.7 | |
| NUS-DD-196 | 74.2 | 81.6 | 0.95 | 7.4 | 3.7 | |
| NUS-DD-197 | 122.1 | 127.4 | 0.35 | 5.3 | 1.2 | |
| NUS-DD-198 | 52.0 | 56.2 | 2.18 | 4.2 | 2.8 | |
2019 |
NUS-DD-199 | 465.0 | 468.0 | 0.68 | 3.0 | 1.9 |
| NUS-DD-200 | 160.0 | 164.0 | 1.03 | 4.0 | 3.4 | |
| NUS-DD-201 | 277.0 | 280.6 | 1.79 | 3.6 | 2.2 | |
| NUS-DD-202 | 166.0 | 172.5 | 1.46 | 6.5 | 5.1 | |
| NUS-DD-203 | 298.9 | 301.0 | 1.92 | 2.1 | 0.8 | |
| NUS-DD-204 | 309.9 | 311.5 | 1.33 | 1.6 | 1.2 | |
| NUS-DD-205 | 292.3 | 296.0 | 0.86 | 3.7 | 2.8 | |
| NUS-DD-207 | 38.0 | 41.0 | 0.55 | 3.0 | 0.3 | |
| NUS-DD-208 | 417.0 | 422.0 | 1.27 | 0.0 | 2.6 | |
| NUS-DD-209 | 245.5 | 247.5 | 1.07 | 0.0 | 1.2 |
| Adam Wheeler | September 2025 |
| Technical Report on the Mineral Resources of the Nussir and Ulveryggen Projects | 60 |
Figure 10-1. Plan of Drill Holes – Nussir
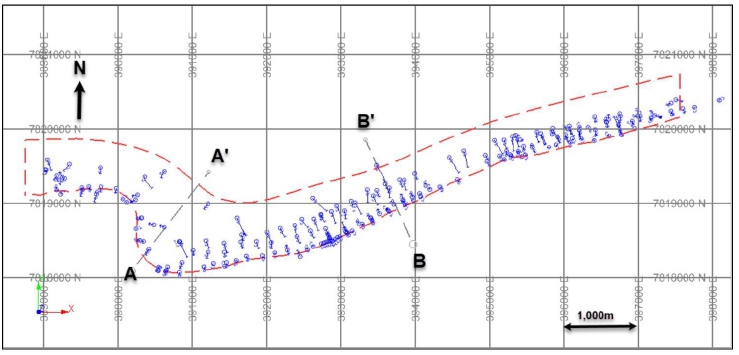
Figure 10-2. Example Drill Hole Cross-Sections – Nussir
[Sections’ Orientation shown in Figure 10-1]
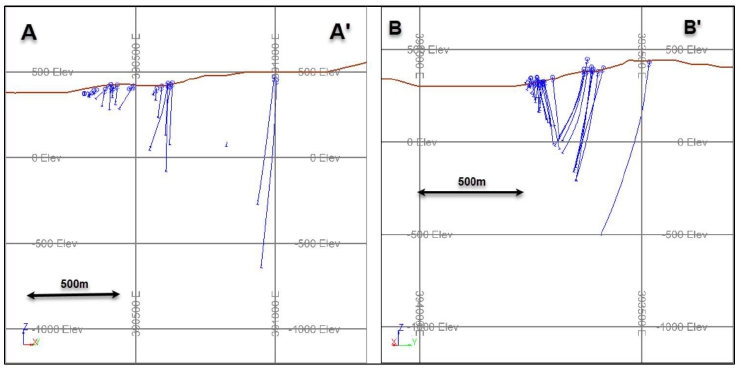
| Adam Wheeler | September 2025 |
| Technical Report on the Mineral Resources of the Nussir and Ulveryggen Projects | 61 |
10.2 Ulveryggen
Complete sets of data from 134 diamond drillholes have now been collated for Ulveryggen, as summarised in Error! Reference source not found.. A plan and 3D view of these data are shown in Error! Reference source not found. Figure 10-3 and Figure 10-4Error! Reference source not found., respectively, with the wireframe models generated of the interpreted mineralised zones.
All the 2014 and 2017 drillholes are of NQ (47.6 mm) diameter. For the drilling since 2010, all remaining core is stored in the National core-storage facility at Løkken, except for core lengths near or inside the mineralised zones, which is kept at Blue Moon’s facility in Skaidi.
Table 10-7. Ulveryggen Drilling Summary
| Sample Type | YEAR | Holes/ Channels |
Length (m) | Avg. Length/ Hole (m) |
Cu Samples |
|
| Surface Drillholes | pre-2010 | 83 | 11,141 | 134 | 3,988 | |
| 2014 | 1 | 412 | 412 | 24 | ||
| 2017 | 7 | 967 | 138 | 88 | ||
| Sub-total | 91 | 12,520 | 138 | 4,100 | ||
| U/g Drillholes | pre-2010 | 22 | 2,754 | 125 | 325 | |
| 2010 | 21 | 1,464 | 70 | 455 | ||
| Sub-total | 43 | 4,219 | 98 | 780 | ||
| Total | 134 | 16,738 | 125 | 4,880 | ||
A summary of the drill hole collars is shown in Table 10-3 and Table 10-4, for underground and surface holes, respectively. A summary of the main drill hole intersections is shown in Table 10-5 and Table 10-6.
A reference plan and some typical example drill hole sections are shown in Figure 10-5 and Figure 10-6.
| Adam Wheeler | September 2025 |
| Technical Report on the Mineral Resources of the Nussir and Ulveryggen Projects | 62 |
Table 10-8. Ulveryggen Drillhole Collars – Underground Drill Holes
| Collar Coordinates (m) | |||||||
| YEAR | BHID | Easting | Northing | Elev'n | Azimuth | Dip | Length |
| (o) | (o) | (m) | |||||
Pre-2009 |
10255 | 396,804.2 | 7,816,084.1 | 228.4 | 340 | -2 | 180 |
| 10256 | 396,806.2 | 7,816,080.1 | 228 | 155 | -47 | 34 | |
| 10257 | 396,806.2 | 7,816,080.1 | 228 | 155 | 0 | 63 | |
| 10258 | 396,806.2 | 7,816,080.1 | 228 | 155 | 60 | 75 | |
| 10259 | 396,805.2 | 7,816,082.1 | 227 | 0 | 90 | 147.1 | |
| 10411 | 396,960.2 | 7,816,150.1 | 231 | 150 | 10 | 74.6 | |
| 10631 | 397,143.2 | 7,816,265.1 | 226.3 | 326 | -0 | 150 | |
| 10632 | 397,143.2 | 7,816,265.1 | 228.5 | 334 | -35 | 149.5 | |
| 10633 | 397,143.2 | 7,816,264.1 | 226.1 | 330 | 46 | 166.8 | |
| 10721 | 397,218.2 | 7,816,314.1 | 227 | 325 | -38 | 140.4 | |
| 10722 | 397,218.2 | 7,816,314.1 | 225.3 | 325 | -1 | 157.8 | |
| 10781 | 397,265.2 | 7,816,352.1 | 225 | 330 | 0 | 150 | |
| 102510 | 396,804.2 | 7,816,084.1 | 228 | 340 | 30 | 170 | |
| 102511 | 396,806.2 | 7,816,080.1 | 228 | 160 | 65 | 85.5 | |
| 104331 | 396,970.2 | 7,816,162.1 | 231.4 | 335 | 20 | 195 | |
| 104342 | 396,975.2 | 7,816,157.1 | 231.4 | 150 | 0 | 49 | |
| 104831 | 397,010.2 | 7,816,188.1 | 226 | 330 | -20 | 150 | |
| 105313 | 397,060.2 | 7,816,218.1 | 226 | 324 | -4 | 150 | |
| 105324 | 397,060.2 | 7,816,218.1 | 228.2 | 325 | -33 | 150.3 | |
| 105812 | 397,100.2 | 7,816,238.1 | 226 | 330 | 0 | 150 | |
| 110431 | 397,490.2 | 7,816,490.1 | 220 | 150 | 0 | 98.6 | |
| 110442 | 397,490.2 | 7,816,490.1 | 220 | 150 | -80 | 35.6 | |
|
2010 |
201001 | 396,912.3 | 7,816,130.9 | 232.7 | 150 | -60 | 79.4 |
| 201002 | 396,912.3 | 7,816,130.9 | 228.9 | 150 | 0 | 94.1 | |
| 201003 | 396,974.5 | 7,816,162.8 | 228.2 | 150 | 0 | 65.8 | |
| 201004 | 396,974.5 | 7,816,162.8 | 230.4 | 150 | -45 | 62.3 | |
| 201005 | 396,949.0 | 7,816,149.7 | 229.5 | 150 | 0 | 62.25 | |
| 201006 | 396,949.0 | 7,816,149.7 | 227.5 | 150 | 35 | 75.9 | |
| 201007 | 397,021.3 | 7,816,186.2 | 228 | 150 | 0 | 51.25 | |
| 201008 | 397,021.3 | 7,816,186.2 | 226.5 | 150 | 35 | 30 | |
| 201009 | 397,021.3 | 7,816,186.2 | 230.5 | 150 | -45 | 30 | |
| 201010 | 397,059.1 | 7,816,208.9 | 228 | 150 | 0 | 71.1 | |
| 201011 | 397,059.1 | 7,816,208.9 | 230.1 | 150 | -45 | 30 | |
| 201012 | 397,117.5 | 7,816,248.9 | 228 | 150 | 0 | 30 | |
| 201013 | 396,923.8 | 7,816,144.5 | 230.2 | 330 | -30 | 166.8 | |
| 201014 | 396,839.9 | 7,816,091.4 | 230 | 154 | 0 | 101.5 | |
| 201015 | 396,839.9 | 7,816,091.4 | 232.5 | 150 | -45 | 36.9 | |
| 201016 | 396,839.9 | 7,816,091.4 | 228.5 | 150 | 30 | 43.7 | |
| 201017 | 396,879.7 | 7,816,114.1 | 230 | 150 | 0 | 56.1 | |
| 201018 | 396,879.7 | 7,816,114.1 | 228.8 | 150 | 35 | 84 | |
| 201019 | 396,879.7 | 7,816,114.1 | 232.5 | 150 | -45 | 50 | |
| 201020 | 396,897.0 | 7,816,122.5 | 230 | 150 | 0 | 53.1 | |
| 201021 | 396,793.3 | 7,816,074.1 | 230 | 204 | 0 | 54 | |
| Adam Wheeler | September 2025 |
| Technical Report on the Mineral Resources of the Nussir and Ulveryggen Projects | 63 |
Table 10-9. Ulveryggen Drillhole Collars – Surface Drill Holes
| Collar Coordinates (m) | |||||||
| YEAR | BHID | Easting | Northing | Elev'n | Azimuth | Dip | Length |
| (o) | (o) | (m) | |||||
|
Pre-2010 |
4451 | 397,473.3 | 7,816,499.6 | 330.0 | 330.0 | 90.0 | 15.0 |
| 4453 | 397,477.8 | 7,816,514.4 | 330.0 | 330.0 | -90.0 | 15.0 | |
| 9371 | 396,050.2 | 7,815,635.1 | 409.0 | 150.0 | 45.0 | 92.0 | |
| 9401 | 396,060.2 | 7,815,658.1 | 420.0 | 150.0 | 45.0 | 65.6 | |
| 9501 | 396,177.2 | 7,815,672.1 | 421.0 | 330.0 | 45.0 | 98.7 | |
| 9502 | 396,235.2 | 7,815,580.1 | 395.0 | 330.0 | 45.0 | 246.0 | |
| 9541 | 396,175.2 | 7,815,751.1 | 419.0 | 330.0 | 45.0 | 74.0 | |
| 9581 | 396,230.2 | 7,815,730.1 | 427.9 | 330.0 | 27.0 | 112.7 | |
| 9582 | 396,230.2 | 7,815,730.1 | 427.6 | 330.0 | 46.0 | 119.5 | |
| 9621 | 396,230.2 | 7,815,800.1 | 423.0 | 330.0 | 45.0 | 80.0 | |
| 9622 | 396,240.2 | 7,815,775.1 | 422.0 | 330.0 | 50.0 | 104.5 | |
| 9661 | 396,286.2 | 7,815,802.1 | 427.9 | 330.0 | 29.7 | 120.3 | |
| 9662 | 396,285.2 | 7,815,790.1 | 426.6 | 330.0 | 42.3 | 54.8 | |
| 9663 | 396,290.2 | 7,815,792.1 | 426.6 | 330.0 | 41.8 | 115.1 | |
| 9681 | 396,290.2 | 7,815,836.1 | 426.0 | 330.0 | 43.5 | 72.3 | |
| 9701 | 396,300.2 | 7,815,842.1 | 420.0 | 330.0 | 45.0 | 70.0 | |
| 9702 | 396,318.2 | 7,815,822.1 | 430.0 | 330.0 | 44.5 | 116.2 | |
| 9703 | 396,308.2 | 7,815,845.1 | 426.6 | 330.0 | 16.3 | 72.3 | |
| 9721 | 396,345.2 | 7,815,835.1 | 432.8 | 330.0 | 29.0 | 121.8 | |
| 9751 | 396,350.2 | 7,815,877.1 | 431.5 | 330.0 | 42.0 | 76.9 | |
| 9752 | 396,372.2 | 7,815,860.1 | 433.2 | 330.0 | 43.4 | 110.4 | |
| 9753 | 396,350.2 | 7,815,877.1 | 431.5 | 330.0 | 15.2 | 57.3 | |
| 9781 | 396,366.2 | 7,815,904.1 | 433.8 | 330.0 | 34.3 | 61.8 | |
| 9801 | 396,420.2 | 7,815,888.1 | 434.3 | 330.0 | 44.5 | 128.6 | |
| 9802 | 396,380.2 | 7,815,924.1 | 438.8 | 330.0 | 20.0 | 55.0 | |
| 9803 | 396,380.2 | 7,815,924.1 | 438.7 | 330.0 | 24.0 | 17.2 | |
| 9804 | 396,392.2 | 7,815,905.1 | 436.9 | 330.0 | 45.0 | 108.1 | |
| 9805 | 396,380.2 | 7,815,924.1 | 438.7 | 330.0 | 45.0 | 86.0 | |
| 9871 | 396,455.2 | 7,815,925.1 | 431.0 | 150.0 | 45.0 | 91.5 | |
| 9951 | 396,558.2 | 7,816,002.1 | 423.0 | 150.0 | 60.0 | 101.8 | |
| 10051 | 396,580.2 | 7,816,065.1 | 426.0 | 150.0 | 45.0 | 144.5 | |
| 10091 | 396,625.2 | 7,816,075.1 | 417.0 | 150.0 | 45.0 | 126.7 | |
| 10121 | 396,660.2 | 7,816,088.1 | 417.5 | 150.0 | 45.0 | 61.0 | |
| 10122 | 396,648.2 | 7,816,108.1 | 416.5 | 150.0 | 47.0 | 158.6 | |
| 10161 | 396,698.2 | 7,816,100.1 | 424.0 | 150.0 | 45.0 | 104.3 | |
| 10162 | 396,675.2 | 7,816,130.1 | 417.0 | 150.0 | 46.0 | 141.0 | |
| 10163 | 396,664.2 | 7,816,148.1 | 417.0 | 150.0 | 50.0 | 191.7 | |
| 10164 | 396,768.2 | 7,815,974.1 | 392.5 | 330.0 | 50.0 | 303.6 | |
| 10201 | 396,720.2 | 7,816,131.1 | 413.0 | 150.0 | 44.0 | 132.7 | |
| 10202 | 396,705.2 | 7,816,160.1 | 413.0 | 150.0 | 49.0 | 185.8 | |
| 10251 | 396,764.2 | 7,816,154.1 | 414.0 | 150.0 | 45.0 | 130.0 | |
| 10252 | 396,744.2 | 7,816,190.1 | 410.0 | 150.0 | 50.0 | 148.0 | |
| 10253 | 396,860.2 | 7,816,000.1 | 386.0 | 330.0 | 45.0 | 301.9 | |
| 10254 | 396,830.2 | 7,816,040.1 | 394.0 | 330.0 | 46.0 | 127.0 | |
| 10281 | 396,778.2 | 7,816,200.1 | 402.0 | 150.0 | 35.0 | 129.8 | |
| 10321 | 396,815.2 | 7,816,215.1 | 397.0 | 150.0 | 50.0 | 176.3 | |
| Collar Coordinates (m) | |||||||
| YEAR | BHID | Easting | Northing | Elev'n | Azimuth | Dip | Length |
| (o) | (o) | (m) | |||||
| 10322 | 396,900.2 | 7,816,054.1 | 383.0 | 330.0 | 50.0 | 285.1 | |
| 10323 | 396,880.2 | 7,816,103.1 | 395.0 | 330.0 | 35.0 | 187.6 | |
| 10361 | 396,929.4 | 7,816,105.3 | 390.0 | 330.0 | 60.0 | 325.6 | |
| 10362 | 396,889.4 | 7,816,161.7 | 408.0 | 330.0 | 30.0 | 133.8 | |
| 10431 | 397,002.2 | 7,816,112.1 | 371.0 | 330.0 | 40.0 | 264.8 | |
| 10432 | 396,980.2 | 7,816,140.1 | 379.0 | 330.0 | 17.0 | 192.5 | |
| 10481 | 397,033.2 | 7,816,151.1 | 379.0 | 330.0 | 36.0 | 217.9 | |
| 10531 | 396,986.2 | 7,816,328.1 | 374.0 | 150.0 | 30.0 | 99.5 | |
| 10532 | 397,025.2 | 7,816,276.1 | 390.0 | 330.0 | 48.0 | 45.5 | |
| 10533 | 397,160.2 | 7,816,032.1 | 329.5 | 330.0 | 45.0 | 43.1 | |
| 10581 | 397,105.2 | 7,816,227.1 | 379.0 | 330.0 | 45.0 | 39.4 | |
| 10601 | 397,200.2 | 7,816,105.1 | 342.0 | 330.0 | 45.0 | 39.9 | |
| 10611 | 397,062.2 | 7,816,375.1 | 375.0 | 150.0 | 30.0 | 85.1 | |
| 10681 | 397,113.2 | 7,816,413.1 | 375.0 | 150.0 | 25.0 | 168.0 | |
| 10682 | 397,226.2 | 7,816,225.1 | 356.0 | 330.0 | 60.0 | 256.7 | |
| 10731 | 397,232.2 | 7,816,300.1 | 370.0 | 330.0 | 45.0 | 83.7 | |
| 10732 | 397,310.2 | 7,816,152.1 | 330.0 | 330.0 | 45.0 | 38.2 | |
| 10921 | 397,380.2 | 7,816,418.1 | 360.0 | 330.0 | 45.0 | 55.9 | |
| Pre-2010 | 10981 | 397,450.2 | 7,816,441.1 | 338.0 | 330.0 | 30.0 | 67.2 |
| 11041 | 397,485.2 | 7,816,485.1 | 330.0 | 330.0 | 45.0 | 98.0 | |
| 11042 | 397,520.2 | 7,816,446.1 | 330.0 | 330.0 | 45.0 | 62.0 | |
| 11581 | 398,050.2 | 7,816,600.1 | 272.0 | 330.0 | 75.0 | 135.0 | |
| 11861 | 398,280.2 | 7,816,750.1 | 245.0 | 330.0 | 90.0 | 152.9 | |
| 11862 | 398,280.2 | 7,816,750.1 | 245.0 | 150.0 | 45.0 | 134.9 | |
| 19685 | 396,660.2 | 7,815,940.1 | 400.0 | 330.0 | 43.0 | 115.0 | |
| 19686 | 396,745.2 | 7,816,000.1 | 391.0 | 330.0 | 45.0 | 130.0 | |
| 19687 | 396,808.2 | 7,816,076.1 | 402.0 | 330.0 | 47.0 | 172.0 | |
| 19688 | 396,905.4 | 7,816,132.2 | 397.0 | 330.0 | 43.0 | 211.0 | |
| 95023 | 396,195.2 | 7,815,650.1 | 421.0 | 330.0 | 15.0 | 126.8 | |
| 95034 | 396,195.2 | 7,815,650.1 | 421.0 | 330.0 | 25.0 | 129.8 | |
| 95412 | 396,214.2 | 7,815,690.1 | 425.6 | 330.0 | 16.7 | 119.9 | |
| 95423 | 396,223.2 | 7,815,675.1 | 420.2 | 330.0 | 25.5 | 132.1 | |
| 196811 | 397,181.2 | 7,816,295.1 | 380.0 | 330.0 | 45.0 | 195.0 | |
| 196820 | 396,968.2 | 7,816,065.1 | 370.0 | 330.0 | 46.0 | 280.0 | |
| 196821 | 397,058.2 | 7,816,125.1 | 366.0 | 330.0 | 47.0 | 275.0 | |
| 196822 | 397,144.2 | 7,816,172.1 | 365.0 | 330.0 | 45.0 | 245.0 | |
| 196823 | 397,212.2 | 7,816,256.1 | 365.0 | 330.0 | 46.0 | 245.0 | |
| 196824 | 397,300.2 | 7,816,352.1 | 365.0 | 330.0 | 45.0 | 250.0 | |
| 2014 | ULV-DD-14-001 | 397,054.4 | 7,816,046.2 | 353.7 | 324.0 | 70.0 | 412.0 |
| ULV-DD-17-01 | 397,009.5 | 7,816,093.8 | 370.3 | 330.0 | 53.5 | 135.0 | |
| ULV-DD-17-02 | 397,081.4 | 7,816,143.8 | 368.3 | 330.0 | 46.0 | 96.7 | |
| ULV-DD-17-03 | 397,081.8 | 7,816,142.9 | 368.1 | 330.0 | 62.5 | 136.3 | |
| 2017 | ULV-DD-17-04 | 396,985.0 | 7,816,079.0 | 370.0 | 330.0 | 55.0 | 109.2 |
| ULV-DD-17-05 | 396,985.0 | 7,816,079.0 | 370.0 | 310.0 | 57.3 | 127.5 | |
| ULV-DD-17-06 | 396,766.9 | 7,815,973.2 | 385.6 | 330.0 | 60.0 | 171.6 | |
| ULV-DD-17-07 | 396,767.0 | 7,815,973.0 | 385.6 | 332.0 | 64.5 | 190.3 | |
| Adam Wheeler | September 2025 |
| Technical Report on the Mineral Resources of the Nussir and Ulveryggen Projects | 64 |
Table 10-10. Summary of Main Intersections- Ulveryggen (1 of 2)
| Complete Intersections | Intersections >0.3%Cu | ||||||||
| BHID | Zone | FROM | TO | Length | True Thickness |
Cu | Length | True Thickness |
Cu |
| m | m | m | m | % | m | m | % | ||
| ULV-DD-14-001 | 4 | 170.3 | 184.5 | 14.2 | 10.5 | 0.62 | 11.8 | 8.8 | 0.73 |
| ULV-DD-17-01 | 4 | 69.1 | 111.3 | 42.2 | 38.7 | 0.47 | 22.3 | 20.5 | 0.86 |
| ULV-DD-17-03 | 4 | 116.3 | 126.5 | 10.2 | 8.5 | 0.20 | 5.1 | 4.2 | 0.39 |
| ULV-DD-17-04 | 4 | 53.7 | 100.4 | 46.7 | 41.4 | 0.23 | 14.7 | 13.1 | 0.51 |
| ULV-DD-17-05 | 4 | 70.2 | 127.5 | 57.3 | 45.1 | 0.03 | 2.5 | 2.0 | 0.78 |
| ULV-DD-17-06 | 2 | 93.4 | 120.3 | 26.9 | 23.9 | 0.36 | 17.1 | 15.2 | 0.48 |
| ULV-DD-17-07 | 2 | 121.1 | 128.8 | 7.7 | 6.3 | 0.63 | 7.7 | 6.3 | 0.63 |
| 10051 | 2 | 73.0 | 117.0 | 44.0 | 20.0 | 0.09 | 4.9 | 2.2 | 0.43 |
| 10091 | 2 | 29.0 | 123.0 | 94.0 | 33.5 | 0.24 | 32.2 | 11.5 | 0.50 |
| 10121 | 2 | 3.0 | 61.0 | 58.0 | 19.8 | 0.27 | 20.2 | 6.9 | 0.57 |
| 10122 | 2 | 48.0 | 139.0 | 91.0 | 33.2 | 0.52 | 53.1 | 19.6 | 0.75 |
| 10161 | 2 | 0.0 | 70.0 | 70.0 | 26.3 | 0.64 | 60.0 | 22.6 | 0.74 |
| 10162 | 2 | 30.0 | 141.0 | 111.0 | 45.8 | 0.63 | 83.3 | 33.9 | 0.80 |
| 10163 | 2 | 89.0 | 192.0 | 103.0 | 40.1 | 0.35 | 55.3 | 21.5 | 0.56 |
| 10164 | 2 | 98.0 | 129.0 | 31.0 | 29.2 | 0.71 | 23.3 | 21.9 | 0.90 |
| 10201 | 2 | 0.0 | 98.0 | 98.0 | 43.0 | 0.57 | 72.9 | 32.8 | 0.72 |
| 10202 | 2 | 3.6 | 170.0 | 166.4 | 63.9 | 0.36 | 77.0 | 28.4 | 0.64 |
| 10251 | 2 | 0.0 | 83.5 | 83.5 | 30.5 | 0.75 | 65.8 | 24.0 | 0.91 |
| 102511 | 2 | 44.0 | 77.0 | 33.0 | 0.2 | 0.69 | 33.0 | 0.2 | 0.69 |
| 10252 | 2 | 24.0 | 125.0 | 101.0 | 38.6 | 0.64 | 98.5 | 37.6 | 0.71 |
| 10253 | 2 | 116.0 | 125.0 | 9.0 | 8.7 | 0.90 | 9.0 | 8.7 | 0.90 |
| 10253 | 3 | 287.5 | 290.6 | 3.1 | 3.1 | 1.62 | 3.1 | 3.1 | 1.62 |
| 10254 | 2 | 77.0 | 103.0 | 26.0 | 24.7 | 0.61 | 18.2 | 17.3 | 0.81 |
| 10255 | 3 | 140.0 | 150.0 | 10.0 | 8.8 | 0.70 | 7.5 | 6.6 | 0.87 |
| 10256 | 2 | 11.0 | 32.0 | 21.0 | 19.4 | 0.69 | 18.4 | 17.0 | 0.79 |
| 10257 | 2 | 13.0 | 24.0 | 11.0 | 9.9 | 0.89 | 11.0 | 9.9 | 0.89 |
| 10258 | 2 | 40.0 | 73.0 | 33.0 | 2.8 | 0.42 | 27.9 | 2.4 | 0.46 |
| 10281 | 2 | 16.0 | 129.8 | 113.8 | 61.6 | 0.38 | 61.8 | 33.3 | 0.54 |
| 10321 | 2 | 8.0 | 250.8 | 242.8 | 62.8 | 0.32 | 110.1 | 28.5 | 0.72 |
| 10322 | 2 | 109.0 | 138.0 | 29.0 | 27.4 | 0.19 | 7.3 | 6.9 | 0.43 |
| 10322 | 3 | 262.0 | 266.0 | 4.0 | 3.9 | 0.82 | 4.0 | 3.9 | 0.82 |
| 10323 | 2 | 63.0 | 124.6 | 61.6 | 61.2 | 0.12 | 2.6 | 2.6 | 0.40 |
| 10323 | 3 | 174.0 | 177.0 | 3.0 | 3.0 | 0.32 | 3.0 | 3.0 | 0.32 |
| 10361 | 3 | 235.0 | 237.0 | 2.0 | 1.8 | 0.62 | 2.0 | 1.8 | 0.62 |
| 10362 | 2 | 11.4 | 39.0 | 27.6 | 27.5 | 1.08 | 25.1 | 25.0 | 1.17 |
| 10431 | 3 | 237.0 | 255.0 | 18.0 | 17.9 | 0.47 | 12.9 | 12.8 | 0.56 |
| 10431 | 4 | 34.0 | 88.0 | 54.0 | 52.9 | 0.30 | 24.5 | 24.0 | 0.49 |
| 10432 | 4 | 1.0 | 55.0 | 54.0 | 53.3 | 0.51 | 29.5 | 29.1 | 0.79 |
| 104331 | 3 | 139.0 | 148.0 | 9.0 | 8.9 | 0.69 | 9.0 | 8.9 | 0.69 |
| 104342 | 4 | 22.0 | 48.0 | 26.0 | 23.6 | 0.62 | 18.2 | 16.5 | 0.82 |
| 10481 | 4 | 28.0 | 56.0 | 28.0 | 27.7 | 0.53 | 22.9 | 22.6 | 0.59 |
| 10531 | 3 | 32.0 | 58.0 | 26.0 | 15.6 | 0.10 | 2.6 | 1.6 | 0.32 |
| 105313 | 6 | 112.0 | 117.0 | 5.0 | 4.3 | 0.32 | 2.5 | 2.2 | 0.36 |
| 10532 | 3 | 36.7 | 42.0 | 5.3 | 4.9 | 0.49 | 2.7 | 2.4 | 0.80 |
| Complete Intersections | Intersections >0.3%Cu | ||||||||
| BHID | Zone | FROM | TO | Length | True Thickness |
Cu | Length | True Thickness |
Cu |
| m | m | m | m | % | m | m | % | ||
| 10581 | 4 | 20.0 | 32.0 | 12.0 | 11.3 | 0.62 | 12.0 | 11.3 | 0.62 |
| 10611 | 3 | 9.0 | 37.0 | 28.0 | 16.1 | 0.28 | 12.7 | 7.3 | 0.40 |
| 10681 | 3 | 23.0 | 40.0 | 17.0 | 11.3 | 0.39 | 14.6 | 9.7 | 0.43 |
| 10682 | 4 | 128.0 | 130.0 | 2.0 | 1.9 | 1.02 | 2.0 | 1.9 | 1.02 |
| 10721 | 3 | 118.0 | 126.0 | 8.0 | 3.7 | 0.41 | 5.3 | 2.4 | 0.49 |
| 10721 | 6 | 27.0 | 33.0 | 6.0 | 2.7 | 0.38 | 3.0 | 1.4 | 0.51 |
| 10731 | 4 | 21.0 | 39.0 | 18.0 | 17.0 | 0.93 | 18.0 | 17.0 | 0.93 |
| 10781 | 5 | 113.0 | 145.0 | 32.0 | 29.0 | 0.27 | 12.3 | 11.2 | 0.52 |
| 10921 | 6 | 32.5 | 41.0 | 8.5 | 8.0 | 0.64 | 8.5 | 8.0 | 0.64 |
| 1103 | 6 | 0.0 | 20.0 | 20.0 | 17.9 | 0.45 | 20.0 | 17.9 | 0.45 |
| 1104 | 6 | 0.0 | 6.0 | 6.0 | 5.4 | 1.10 | 6.0 | 5.4 | 1.10 |
| 11041 | 6 | 27.0 | 31.0 | 4.0 | 3.8 | 0.94 | 4.0 | 3.8 | 0.94 |
| 110431 | 6 | 62.0 | 72.0 | 10.0 | 9.1 | 0.39 | 7.5 | 6.8 | 0.46 |
| 1105 | 6 | 21.0 | 39.0 | 18.0 | 15.6 | 0.89 | 18.0 | 15.6 | 0.89 |
| 1107 | 6 | 0.0 | 13.0 | 13.0 | 11.7 | 0.60 | 13.0 | 11.7 | 0.60 |
| 1110 | 6 | 0.0 | 38.0 | 38.0 | 34.4 | 0.65 | 38.0 | 34.4 | 0.65 |
| 1111 | 6 | 12.0 | 23.0 | 11.0 | 8.6 | 0.44 | 11.0 | 8.6 | 0.44 |
| 1112 | 1 | 0.0 | 9.0 | 9.0 | 8.2 | 0.75 | 9.0 | 8.2 | 0.75 |
| 1113 | 1 | 0.0 | 9.0 | 9.0 | 8.2 | 0.70 | 9.0 | 8.2 | 0.70 |
| 1114 | 1 | 6.0 | 9.0 | 3.0 | 2.7 | 0.80 | 3.0 | 2.7 | 0.80 |
| 1115 | 1 | 0.0 | 8.0 | 8.0 | 7.3 | 0.53 | 5.3 | 4.8 | 0.80 |
| 1116 | 1 | 0.0 | 4.0 | 4.0 | 3.6 | 1.50 | 4.0 | 3.6 | 1.50 |
| 1117 | 1 | 8.0 | 29.0 | 21.0 | 19.0 | 1.69 | 21.0 | 19.0 | 1.69 |
| 1118 | 1 | 0.0 | 6.0 | 6.0 | 5.4 | 0.40 | 6.0 | 5.4 | 0.40 |
| 1119 | 1 | 4.0 | 31.0 | 27.0 | 24.5 | 0.51 | 19.6 | 17.8 | 0.60 |
| 1120 | 1 | 20.0 | 34.0 | 14.0 | 12.7 | 1.23 | 14.0 | 12.7 | 1.23 |
| 196811 | 3 | 131.0 | 151.9 | 20.9 | 20.4 | 0.27 | 5.2 | 5.1 | 0.43 |
| 196811 | 4 | 4.5 | 27.5 | 23.0 | 21.7 | 1.24 | 23.0 | 21.7 | 1.24 |
| 196820 | 3 | 241.5 | 267.7 | 26.2 | 26.2 | 1.01 | 26.2 | 26.2 | 1.01 |
| 196821 | 4 | 86.0 | 95.5 | 9.5 | 9.3 | 0.50 | 7.1 | 7.0 | 0.56 |
| 196822 | 4 | 97.5 | 99.0 | 1.5 | 1.4 | 0.50 | 1.5 | 1.4 | 0.50 |
| 196823 | 3 | 188.3 | 189.7 | 1.4 | 1.4 | 0.47 | 1.4 | 1.4 | 0.47 |
| 196823 | 4 | 71.5 | 84.0 | 12.5 | 12.0 | 0.83 | 12.5 | 12.0 | 0.83 |
| 196823 | 6 | 132.0 | 144.5 | 12.5 | 12.2 | 0.82 | 12.5 | 12.2 | 0.82 |
| 196824 | 5 | 167.5 | 179.5 | 12.0 | 11.3 | 0.47 | 4.8 | 4.5 | 0.86 |
| 19685 | 2 | 65.5 | 115.0 | 49.5 | 48.8 | 0.16 | 5.0 | 4.9 | 1.54 |
| 19686 | 2 | 54.5 | 106.5 | 52.0 | 50.4 | 0.57 | 37.1 | 35.9 | 0.71 |
| 19687 | 2 | 7.0 | 75.4 | 68.4 | 64.1 | 0.58 | 38.0 | 35.7 | 0.94 |
| 19688 | 2 | 65.0 | 79.0 | 14.0 | 13.6 | 0.97 | 14.0 | 13.6 | 0.97 |
| 19688 | 3 | 169.5 | 190.5 | 21.0 | 21.0 | 0.64 | 15.8 | 15.7 | 0.83 |
| 201001 | 2 | 27.0 | 28.0 | 1.0 | 0.8 | 0.62 | 1.0 | 0.8 | 0.62 |
| 201002 | 4 | 47.3 | 49.4 | 2.1 | 1.9 | 2.46 | 2.1 | 1.9 | 2.46 |
| 201003 | 4 | 30.0 | 52.0 | 22.0 | 19.9 | 0.85 | 19.6 | 17.7 | 0.93 |
| 201004 | 4 | 20.0 | 54.0 | 34.0 | 31.9 | 0.92 | 29.1 | 27.4 | 1.03 |
| Adam Wheeler | September 2025 |
| Technical Report on the Mineral Resources of the Nussir and Ulveryggen Projects | 65 |
Table 10-11. Summary of Main Intersections- Ulveryggen (2 of 2)
| Complete Intersections | Intersections >0.3%Cu | ||||||||
| BHID | Zone | FROM | TO | Length | True Thickness |
Cu | Length | True Thickness |
Cu |
| m | m | m | m | % | m | m | % | ||
| 201005 | 4 | 28.0 | 46.0 | 18.0 | 16.3 | 0.17 | 5.1 | 4.7 | 0.32 |
| 201006 | 4 | 57.0 | 63.0 | 6.0 | 3.0 | 0.35 | 3.0 | 1.5 | 0.46 |
| 201006 | 6 | 5.0 | 9.0 | 4.0 | 2.0 | 0.47 | 2.0 | 1.0 | 0.67 |
| 201007 | 4 | 7.0 | 14.0 | 7.0 | 6.3 | 1.02 | 7.0 | 6.3 | 1.02 |
| 201008 | 4 | 13.0 | 19.0 | 6.0 | 3.0 | 0.97 | 6.0 | 3.0 | 0.97 |
| 201009 | 4 | 8.0 | 29.0 | 21.0 | 19.7 | 0.40 | 7.9 | 7.4 | 0.79 |
| 2010101 | 4 | 0.0 | 0.5 | 0.5 | 0.0 | 0.81 | 0.5 | 0.0 | 0.81 |
| 201014 | 2 | 1.0 | 18.7 | 17.7 | 16.0 | 0.24 | 7.8 | 7.1 | 0.36 |
| 201015 | 2 | 0.0 | 16.0 | 16.0 | 15.0 | 0.24 | 5.3 | 5.0 | 0.37 |
| 201016 | 2 | 0.0 | 19.0 | 19.0 | 10.9 | 0.51 | 14.3 | 8.2 | 0.61 |
| 201017 | 2 | 0.0 | 48.0 | 48.0 | 43.5 | 0.07 | 5.1 | 4.6 | 0.47 |
| 201017 | 4 | 52.0 | 54.0 | 2.0 | 1.8 | 0.48 | 2.0 | 1.8 | 0.48 |
| 201018 | 2 | 1.0 | 45.7 | 44.7 | 22.3 | 0.14 | 8.1 | 4.1 | 0.56 |
| 201019 | 2 | 1.0 | 54.0 | 53.0 | 49.8 | 0.07 | 5.5 | 5.2 | 0.47 |
| 201020 | 4 | 48.0 | 52.0 | 4.0 | 3.6 | 0.78 | 4.0 | 3.6 | 0.78 |
| 201021 | 2 | 11.0 | 26.0 | 15.0 | 8.0 | 0.37 | 10.0 | 5.3 | 0.47 |
| 2206 | 2 | 0.0 | 15.0 | 15.0 | 13.4 | 0.94 | 15.0 | 13.4 | 0.94 |
| 2207 | 2 | 0.0 | 13.0 | 13.0 | 11.6 | 0.58 | 13.0 | 11.6 | 0.58 |
| 2208 | 2 | 0.0 | 38.0 | 38.0 | 33.9 | 1.26 | 38.0 | 33.9 | 1.26 |
| 2209 | 2 | 7.0 | 21.0 | 14.0 | 12.5 | 0.97 | 14.0 | 12.5 | 0.97 |
| 2210 | 2 | 0.0 | 69.0 | 69.0 | 61.6 | 0.92 | 69.0 | 61.6 | 0.92 |
| 2212 | 2 | 0.0 | 9.0 | 9.0 | 8.0 | 1.65 | 9.0 | 8.0 | 1.65 |
| 2213 | 2 | 0.0 | 10.0 | 10.0 | 9.0 | 1.90 | 10.0 | 9.0 | 1.90 |
| 2214 | 2 | 0.0 | 9.0 | 9.0 | 8.1 | 0.60 | 9.0 | 8.1 | 0.60 |
| 2215 | 2 | 0.0 | 88.0 | 88.0 | 79.5 | 1.33 | 88.0 | 79.5 | 1.33 |
| 2216 | 2 | 0.0 | 10.0 | 10.0 | 9.0 | 0.50 | 10.0 | 9.0 | 0.50 |
| 2217 | 2 | 24.0 | 104.0 | 80.0 | 72.2 | 0.80 | 55.0 | 49.7 | 1.06 |
| 2218 | 2 | 44.0 | 87.0 | 43.0 | 38.8 | 2.03 | 43.0 | 38.8 | 2.03 |
| 2218 | 4 | 0.0 | 15.0 | 15.0 | 13.5 | 1.01 | 10.0 | 9.0 | 1.47 |
| 3301 | 4 | 10.0 | 39.0 | 29.0 | 26.3 | 1.02 | 24.2 | 21.9 | 1.18 |
| 3302 | 4 | 0.0 | 18.0 | 18.0 | 16.1 | 1.52 | 18.0 | 16.1 | 1.52 |
| 3303 | 4 | 0.0 | 34.0 | 34.0 | 30.7 | 1.08 | 34.0 | 30.7 | 1.08 |
| 3304 | 4 | 10.0 | 27.0 | 17.0 | 15.4 | 0.46 | 4.9 | 4.4 | 1.53 |
| 3305 | 4 | 16.0 | 28.0 | 12.0 | 10.8 | 1.70 | 12.0 | 10.8 | 1.70 |
| 3306 | 4 | 0.0 | 13.0 | 13.0 | 11.7 | 2.50 | 13.0 | 11.7 | 2.50 |
| 3307 | 4 | 0.0 | 12.0 | 12.0 | 10.9 | 0.68 | 12.0 | 10.9 | 0.68 |
| 3350 | 4 | 2.0 | 32.0 | 30.0 | 27.2 | 0.42 | 22.5 | 20.4 | 0.56 |
| 3351 | 4 | 0.0 | 25.0 | 25.0 | 2.0 | 1.95 | 25.0 | 2.0 | 1.95 |
| 3352 | 4 | 0.0 | 25.0 | 25.0 | 22.7 | 1.30 | 22.5 | 20.4 | 1.42 |
| 3353 | 4 | 0.0 | 22.0 | 22.0 | 19.6 | 1.13 | 22.0 | 19.6 | 1.13 |
| 3354 | 4 | 0.0 | 11.0 | 11.0 | 10.0 | 0.70 | 11.0 | 10.0 | 0.70 |
| 3401 | 3 | 0.0 | 24.0 | 24.0 | 21.8 | 0.70 | 24.0 | 21.8 | 0.70 |
| 3402 | 3 | 0.0 | 19.0 | 19.0 | 17.2 | 1.08 | 11.9 | 10.8 | 1.70 |
| 3403 | 3 | 0.0 | 23.0 | 23.0 | 20.8 | 0.70 | 23.0 | 20.8 | 0.70 |
| Complete Intersections | Intersections >0.3%Cu | ||||||||
| BHID | Zone | FROM | TO | Length | True Thickness |
Cu | Length | True Thickness |
Cu |
| m | m | m | m | % | m | m | % | ||
| 3404 | 3 | 10.0 | 40.0 | 30.0 | 26.8 | 0.40 | 30.0 | 26.8 | 0.40 |
| 4401 | 6 | 7.0 | 14.0 | 7.0 | 6.3 | 1.54 | 7.0 | 6.3 | 1.54 |
| 4402 | 6 | 8.0 | 24.0 | 16.0 | 14.3 | 1.29 | 16.0 | 14.3 | 1.29 |
| 4450 | 6 | 0.0 | 46.0 | 46.0 | 41.7 | 2.04 | 46.0 | 41.7 | 2.04 |
| 4451 | 6 | 0.0 | 27.5 | 27.5 | 11.6 | 1.10 | 27.5 | 11.6 | 1.10 |
| 4452 | 6 | 4.0 | 20.0 | 16.0 | 14.5 | 1.61 | 16.0 | 14.5 | 1.61 |
| 4453 | 6 | 0.0 | 15.0 | 15.0 | 6.3 | 2.36 | 15.0 | 6.3 | 2.36 |
| 9371 | 6 | 47.0 | 80.0 | 33.0 | 11.3 | 0.25 | 22.2 | 7.6 | 0.38 |
| 9401 | 6 | 50.0 | 65.0 | 15.0 | 5.1 | 0.23 | 2.5 | 0.9 | 0.45 |
| 9501 | 1 | 76.0 | 98.0 | 22.0 | 20.7 | 0.20 | 4.9 | 4.6 | 0.47 |
| 9501 | 6 | 11.0 | 38.0 | 27.0 | 25.4 | 0.26 | 9.8 | 9.2 | 0.42 |
| 9502 | 1 | 194.0 | 201.0 | 7.0 | 6.6 | 0.22 | 2.3 | 2.2 | 0.44 |
| 95023 | 1 | 103.0 | 105.0 | 2.0 | 2.0 | 0.82 | 2.0 | 2.0 | 0.82 |
| 95034 | 1 | 85.0 | 97.0 | 12.0 | 12.0 | 0.39 | 9.6 | 9.6 | 0.47 |
| 9541 | 1 | 0.0 | 35.4 | 35.4 | 33.3 | 0.84 | 27.8 | 26.1 | 1.01 |
| 95412 | 1 | 70.0 | 101.0 | 31.0 | 30.7 | 0.64 | 20.7 | 20.5 | 0.85 |
| 95423 | 1 | 85.0 | 125.0 | 40.0 | 40.0 | 0.43 | 14.3 | 14.3 | 0.66 |
| 9581 | 1 | 91.0 | 95.0 | 4.0 | 4.0 | 0.33 | 4.0 | 4.0 | 0.33 |
| 9582 | 1 | 51.0 | 113.0 | 62.0 | 57.9 | 0.39 | 42.8 | 40.0 | 0.65 |
| 9621 | 1 | 0.0 | 57.0 | 57.0 | 53.6 | 1.35 | 54.9 | 51.6 | 1.48 |
| 9622 | 1 | 70.0 | 95.0 | 25.0 | 22.7 | 0.45 | 17.5 | 15.9 | 0.55 |
| 9661 | 1 | 37.0 | 85.0 | 48.0 | 47.8 | 0.55 | 27.4 | 27.4 | 0.84 |
| 9662 | 1 | 32.0 | 54.8 | 22.8 | 21.8 | 0.27 | 12.7 | 12.1 | 0.36 |
| 9663 | 1 | 49.0 | 115.1 | 66.1 | 63.2 | 0.46 | 29.8 | 28.5 | 0.86 |
| 9681 | 1 | 28.0 | 61.0 | 33.0 | 31.3 | 0.73 | 20.3 | 19.3 | 1.14 |
| 9701 | 1 | 37.0 | 58.0 | 21.0 | 19.7 | 0.76 | 18.4 | 17.3 | 0.84 |
| 9702 | 1 | 92.0 | 116.2 | 24.2 | 22.8 | 0.89 | 14.5 | 13.7 | 1.39 |
| 9703 | 1 | 22.0 | 40.0 | 18.0 | 17.8 | 0.88 | 12.9 | 12.7 | 1.22 |
| 9721 | 1 | 73.0 | 98.0 | 25.0 | 24.9 | 0.53 | 10.0 | 10.0 | 1.15 |
| 9721 | 6 | 40.0 | 51.0 | 11.0 | 11.0 | 0.54 | 8.3 | 8.2 | 0.71 |
| 9751 | 1 | 65.8 | 76.2 | 10.4 | 9.9 | 1.47 | 10.4 | 9.9 | 1.47 |
| 9751 | 6 | 13.0 | 16.0 | 3.0 | 2.9 | 0.48 | 3.0 | 2.9 | 0.48 |
| 9752 | 6 | 15.0 | 22.0 | 7.0 | 6.6 | 0.46 | 7.0 | 6.6 | 0.46 |
| 9753 | 1 | 51.0 | 53.0 | 2.0 | 2.0 | 0.51 | 2.0 | 2.0 | 0.51 |
| 9753 | 6 | 6.0 | 34.0 | 28.0 | 27.6 | 0.53 | 28.0 | 27.6 | 0.53 |
| 9781 | 1 | 43.0 | 44.0 | 1.0 | 1.0 | 0.43 | 1.0 | 1.0 | 0.43 |
| 9801 | 6 | 19.0 | 44.0 | 25.0 | 23.6 | 0.73 | 25.0 | 23.6 | 0.73 |
| 9802 | 1 | 0.0 | 14.0 | 14.0 | 13.9 | 0.44 | 14.0 | 13.9 | 0.44 |
| 9803 | 1 | 0.0 | 17.2 | 17.2 | 17.2 | 0.28 | 9.8 | 9.8 | 0.48 |
| 9804 | 1 | 27.0 | 37.0 | 10.0 | 9.4 | 0.29 | 5.0 | 4.7 | 0.42 |
| 9805 | 1 | 0.0 | 19.0 | 19.0 | 17.9 | 0.36 | 14.3 | 13.4 | 0.43 |
| 9951 | 2 | 5.0 | 37.8 | 32.8 | 2.9 | 0.44 | 22.7 | 2.0 | 0.56 |
| Adam Wheeler | September 2025 |
| Technical Report on the Mineral Resources of the Nussir and Ulveryggen Projects | 66 |
Figure 10-3. Plan of Drillholes and Mineralised Zones - Ulveryggen
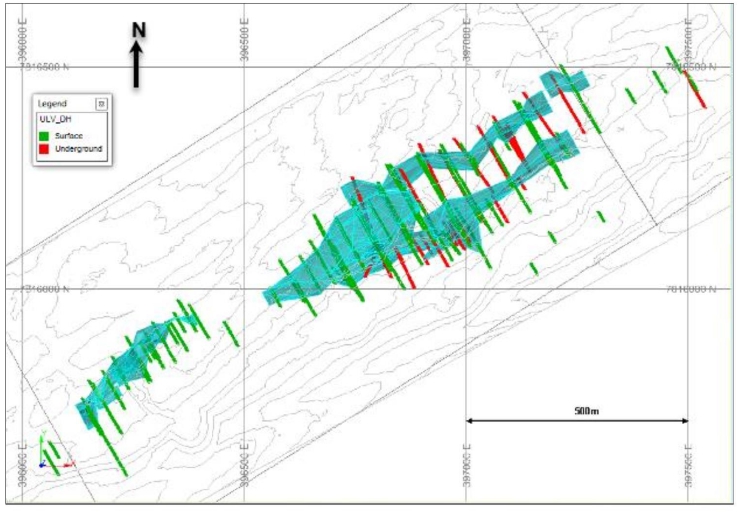
Figure 10-4. 3D View of Drillholes Looking NE - Ulveryggen
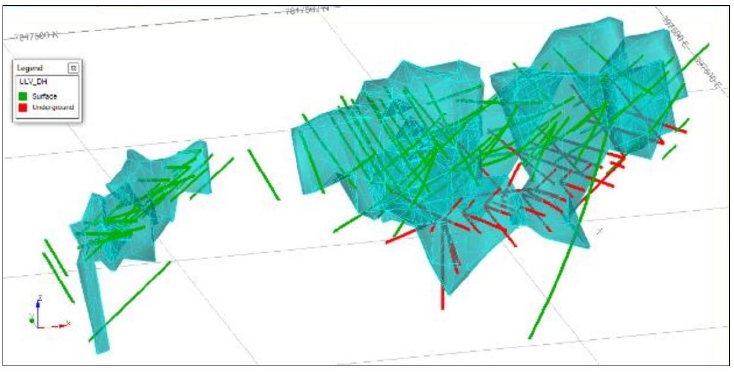
| Adam Wheeler | September 2025 |
| Technical Report on the Mineral Resources of the Nussir and Ulveryggen Projects | 67 |
Figure 10-5. Plan of Drill Holes
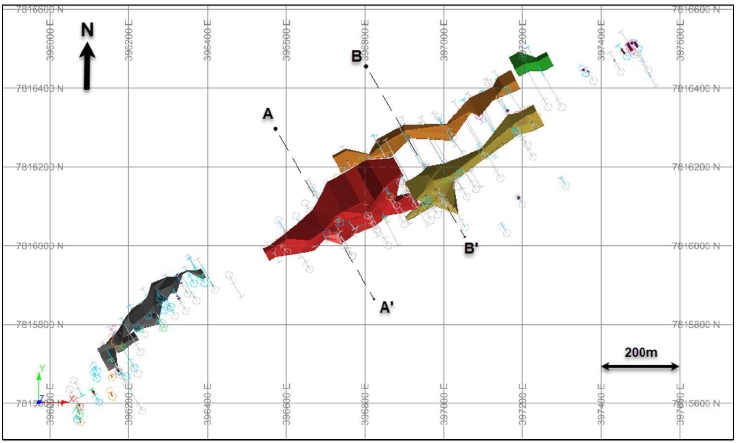
Figure 10-6. Example Drill Hole Sections
[Sections lines referenced in Figure 10-5]
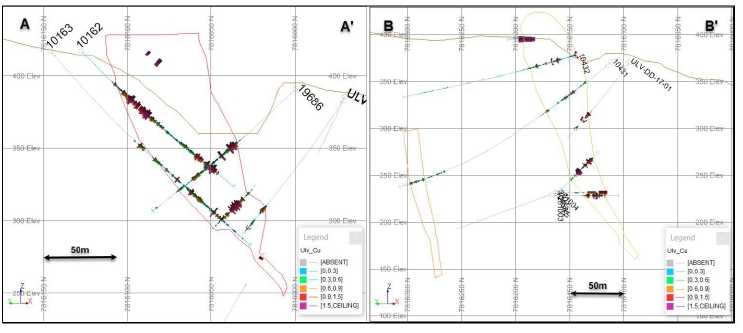
| Adam Wheeler | September 2025 |
| Technical Report on the Mineral Resources of the Nussir and Ulveryggen Projects | 68 |
11 SAMPLE PREPARATION, ANALYSIS AND SECURITY
11.1 Nussir
11.1.1 1984 to 1996
Descriptions of historical sampling methods, preparation and analysis by ASPRO have been recorded. The sample intervals are well defined. The sample intervals were picked based on mineralized or geological boundaries. Chemical analysis was normally made for one-meter intervals.
No cores before 1986 are available. Cores from 1986 to 1996 are stored at the central Norwegian core facility at the Norwegian Geological Survey, Lokken in Trondheim. Sampling and splitting of the cores were done by the company at the site, and sample preparation such as crushing and pulverizing was done by the laboratories.
Mercury Analytical Ltd. was responsible for assay analysis from 1984 to 1985. In 1988, six diamond drill holes were drilled. The holes were analysed by Caleb Brett Laboratories, England. In both cases, the analytical methods are not known, and the analysed core lengths are usually one meter or shorter.
These pre-2000 samples were analysed for Cu, Ag and Au. Cu-oxide mineralization is confined typically to the upper level of the deposit and, historically, non-sulphide Cu was not universally quantified by analysis of soluble Cu.
In 2002, 63 samples from nine holes were re-analysed for 47 elements by Aqua Regia digestion and ICP by OMAC Laboratories, Ireland. Only Ag among the precious metals was analysed. The samples are from drill holes Bh 21, 25, 26, 27, 28, 29, 35, 38 and 40, but only a few meters of each of the drill holes were analysed. The core was usually analysed for one-meter sections.
11.1.2 Terra Control/Nussir ASA 2006 to 2019
From 2006 to 2008, TerraControl (now Nussir ASA) and Nussir ASA drilled 43 (five were abandoned) diamond drill holes on the Nussir property.
Most of the core samples from 2006 and 2007 were marked on core boxes, and cut in half by the on-site geologist, Kjell Nilsen. The samples were placed in boxes and shipped to OMAC, Ireland, for analysis. The drill core boxes from the 2008 drilling campaign were shipped to ALS Chemex in Sweden, which did all the sample preparation based on the marked intervals made by Nussir`s on-site geologist.
Between 2006 and 2008, samples from 20 percussion drillholes and nine diamond drill holes were analysed for 46 elements using Aqua Regia digestion and ICP-OES by OMAC Laboratories, Ireland.
In 2008, 199 samples from four diamond drillholes (Bh 19, 20, 39, 40) were re-analysed for 46 elements, using four-acid ICP-AES and Pt, Pd, Au 30g Fire Acid ICP. Samples from 30 diamond drillholes were analysed in 2008 by 46 elements four-acid ICP-AES and Pt, Pd, Au 30g Fire Acid ICP.
| Adam Wheeler | September 2025 |
| Technical Report on the Mineral Resources of the Nussir and Ulveryggen Projects | 69 |
In 2011, six diamond drillholes were analysed by ALS Chemex laboratory in Sweden by 33 element four acid ICP-AES and Au, Pt and Pd 30 g Fire Assay ICP. In this campaign, intersections for assaying were identified by initial assaying using handheld XRF. In 2011 and 2013, external check samples were sent to SGS.
For the drilling campaigns in 2015, 2017 and 2019, ALS Chemex was used as the primary laboratory, and Labtium as the external check laboratory.
Sample preparation work has been done using ALS Chemex in Piteå, under instructions from Nussir’s geologists, using the following steps:
| 1. | Sawing of core into two halves. | |
| 2. | Crushing of one-half sample, 70% < 2mm. | |
| 3. | Riffle splitting of crushed sample. | |
| 4. | Pulverising to 85% < 75 µm. | |
| 5. | Taking of sample for analysis. |
| Adam Wheeler | September 2025 |
| Technical Report on the Mineral Resources of the Nussir and Ulveryggen Projects | 70 |
11.1.3 Quality Assurance/ Quality Control
2008
During 2008, 1443 assay measurements were also made by OMAC, from core stemming from the 1990 drilling campaigns. Most of these were taken to provide measurements of previously unassayed core, but 69 overlapped with previous assays, measured in either Mercury Analytical or Caleb Brett laboratories. A diagram depicting these reassayed duplicates is shown in Figure 11-1 and a check analysis study of this data is summarised in Table 11-1.
Figure 11-1. Nussir - Reassayed Grade Comparison
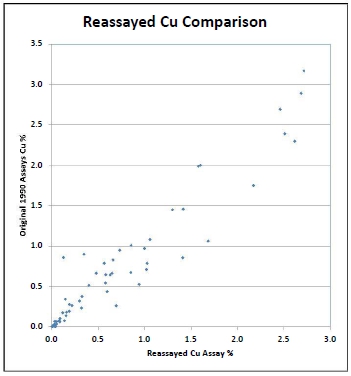
Table 11-1. Summary of Reassay Cu Analysis - 2008
| HARD | Slope of | |||
| Number of | Precision | Correlation | Regression | Proportion |
| Pairs | @90% Rank | Coefficient | Line | Misclassified |
| 69 | 31% | 95.7% | 0.993 | 7.6% |
Notes
. Misclassification based on 0.3% Cu
. HARD = Half Absolute Relative Difference
. In HARD calculation, 10pmm used as level of precision
| Adam Wheeler | September 2025 |
| Technical Report on the Mineral Resources of the Nussir and Ulveryggen Projects | 71 |
2009-2011
This combined set of 110 check samples was analysed for the 2009 campaign, and the Cu grades are displayed diagrammatically in Figure 11-2.
Figure 11-2. Check Assay Scatterplot – 2009 Campaign.
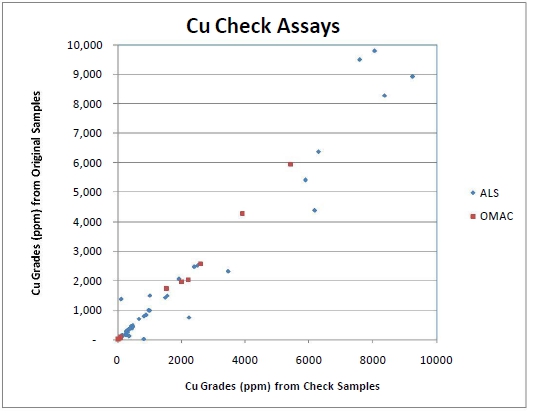
| Adam Wheeler | September 2025 |
| Technical Report on the Mineral Resources of the Nussir and Ulveryggen Projects | 72 |
The results of an additional 2011 check analysis study are shown in the table below.
Table 11-2. Summary of 2011 Nussir Cu Check Assay Analysis
| HARD | Slope of | |||
| Number of | Precision | Correlation | Regression | Proportion |
| Pairs | @90% Rank | Coefficient | Line | Misclassified |
| 110 | 17.0% | 97.98% | 1.018 | 3.60% |
Notes
. Misclassification based on 0.3% Cu
. HARD = Half Absolute Relative Difference
. In HARD calculation, 10pmm used as level of precision
For the samples associated with the 2011 drilling campaign, the following quality control measures were taken:
| - | Standards (certified by Geostat Pty. Ltd.) and blanks were inserted for every ten samples, and at the start of every batch. |
| - | ALS inserted their own internal duplicates in the laboratory. Of the 141 samples assayed for the 2011 campaign, 4 internal duplicates were taken, as depicted in diagram in Figure 11-3 and summarised in Table 11-3. |
Figure 11-3. ALS Internal Duplicate Assays – 2011 Drilling Campaign
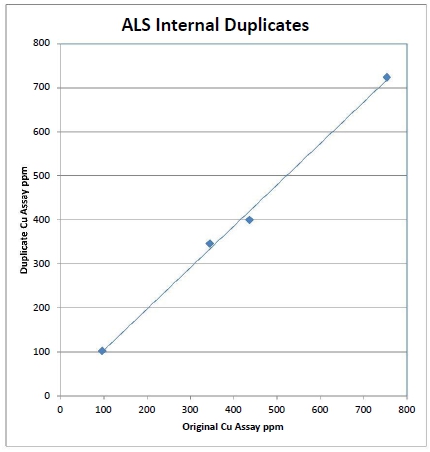
| Adam Wheeler | September 2025 |
| Technical Report on the Mineral Resources of the Nussir and Ulveryggen Projects | 73 |
Table 11-3. Summary of 2011 ALS Internal Duplicates
| Slope of | |||
| Number | Correlation | Regression | Proportion |
| of Pairs | Coefficient | Line | Misclassified |
| 4 | 99.8% | 0.997 | 0.0% |
Notes
. Misclassification based on 0.3% Cu
. All HARD (Half Absolute Relative Difference) levels below 5%
2013
For the 2013 campaign, 6-7 internal coarse duplicates were taken, out of 152 primary assays. The results from these duplicates are shown in Figure 11-4 and Table 11-4.
Figure 11-4. Internal Coarse Cu Duplicates - 2013
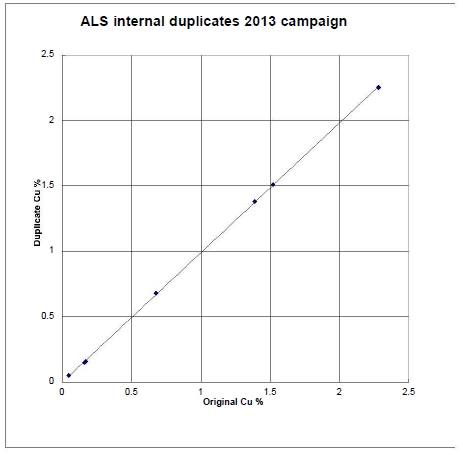
Table 11-4. Summary of Internal Coarse Duplicates - 2013
| Slope of | |||
| Metal | Number of | Correlation | Regression |
| Pairs | Coefficient | Line | |
| Cu | 7 | 99.9% | 0.99 |
| Au | 6 | 99.9% | 1.12 |
| Pd | 6 | 99.7% | 0.92 |
| Adam Wheeler | September 2025 |
| Technical Report on the Mineral Resources of the Nussir and Ulveryggen Projects | 74 |
During the 2013 campaign one blank was inserted for approximately every 10 samples. These blanks were prepared from local gabbro source. Of these 26 samples, only 2 showed any Cu grades above expected blank levels, as shown in Figure 11-5, representing 8% of the samples analysed. The cause of the 2 error values is not known.
Figure 11-5. Blanks’ Results – 2013
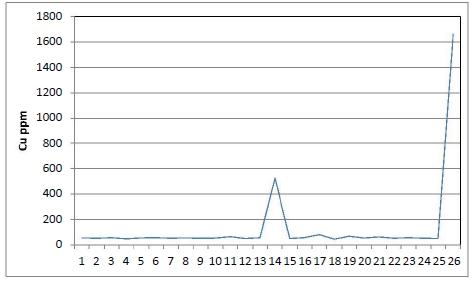
During 2013, 27 external duplicates were assayed at SGS, stemming from pulp material returned by ALS from the 2011 and spring 2013 campaigns. These results are summarised in Figure 11-6 and Table 11-5.
Figure 11-6. External Duplicates - 2013
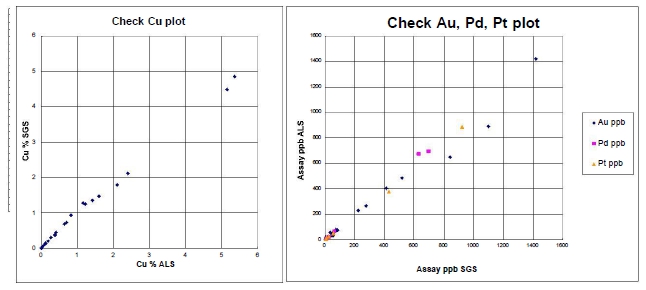
| Adam Wheeler | September 2025 |
| Technical Report on the Mineral Resources of the Nussir and Ulveryggen Projects | 75 |
Table 11-5. External Duplicates’ Summary – 2013
| HARD | Slope of | ||||
| Metal | Number | Precision | Correlation | Regression | Proportion |
| of Pairs | @90% Rank | Coefficient | Line | Misclassified | |
| Cu | |||||
| Ag | 27 | 25.0% | 99.1% | 0.980 | |
| Au | 27 | 28.0% | 99.2% | 1.090 | |
| Pd | 24 | 29.0% | 99.9% | 0.963 | |
| Pt | 12 | 14.0% | 99.9% | 1.060 |
Notes
. Misclassification based on 0.3% Cu
. HARD = Half Absolute Relative Difference
Three external standard samples were purchased from Geostat. The results of assays on two of these standards are shown in Figure 11-7. These cover both 2011 and 2013 results.
Figure 11-7. Standards’ Results - 2013
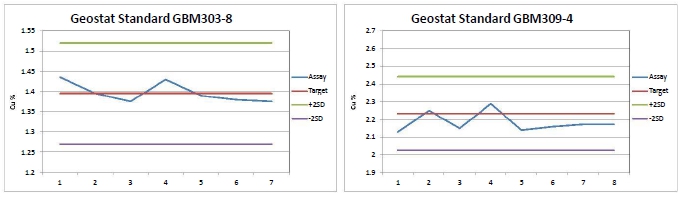
The results from these 2 standards are acceptable, with no check assays outside of 2 x standard deviation limits. Another lower grade standard was also assayed, and produced consistent results, but there appears to have been a misallocation of the standard ID, and so these results have not been used.
| Adam Wheeler | September 2025 |
| Technical Report on the Mineral Resources of the Nussir and Ulveryggen Projects | 76 |
2014-2015
A summary of the QA/QC samples taken through the 2014 and 2015 campaigns is shown below in Table 11-6.
Table 11-6. Summary of QAQC Samples – 2014 and 2015
| Type of Control |
|
Number of Samples |
Number | Frequency | |
| Twin Samples | TS | 265 | 24 | 9% | |
| Coarse Duplicates | CD | 265 | 2 | 0.8% | |
| Fine Duplicates | PD | 265 | 19 | 7% | |
| Standards | STD | 265 | 16 | 6% | |
| Coarse Blanks | CB | 265 | 16 | 6% | |
| Fine Blanks | FB | 265 | 21 | 8% | |
| External Controls | EC | 265 | 30 | 11% | |
| Total | 48% |
A summary of the 2015 field duplicates’ results is shown in Figure 11-8. These results show a relatively high proportion of errors. The 2014 and 2015 pulp duplicates’ results are shown in Figure 11-9. Both sets of results are acceptable.
In the 2014 campaign, primary samples were assayed at Labtium, with external assaying done at ALS. In the 2015 campaign, primary samples were assayed at ALS, with external assaying done at Labtium.
| Adam Wheeler | September 2025 |
| Technical Report on the Mineral Resources of the Nussir and Ulveryggen Projects | 77 |
Figure 11-8. 2015 Field Duplicates – Precision Analysis
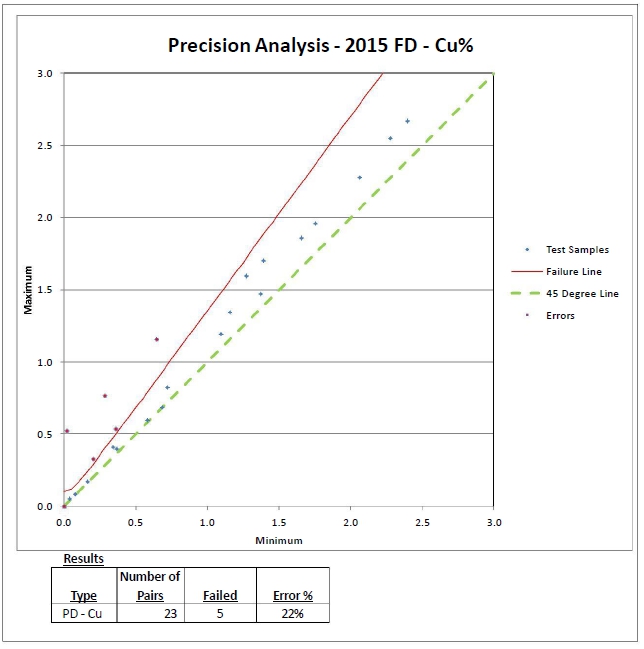
Figure 11-9. Pulp Duplicates’ Analyses – 2014 and 2015
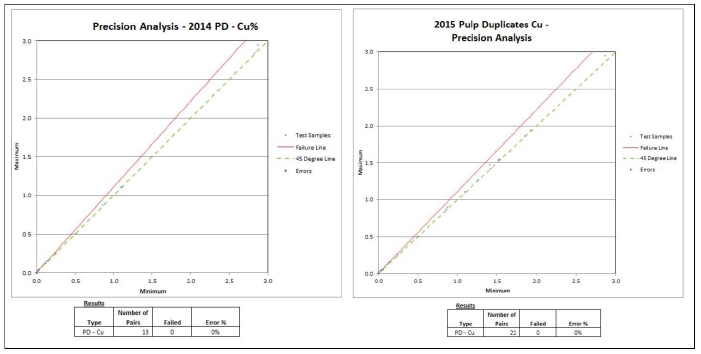
| Adam Wheeler | September 2025 |
| Technical Report on the Mineral Resources of the Nussir and Ulveryggen Projects | 78 |
The external duplicates’ results are shown in Figure 11-10. These results are acceptable.
Figure 11-10. External Duplicates’ Analyses – 2014 and 2015
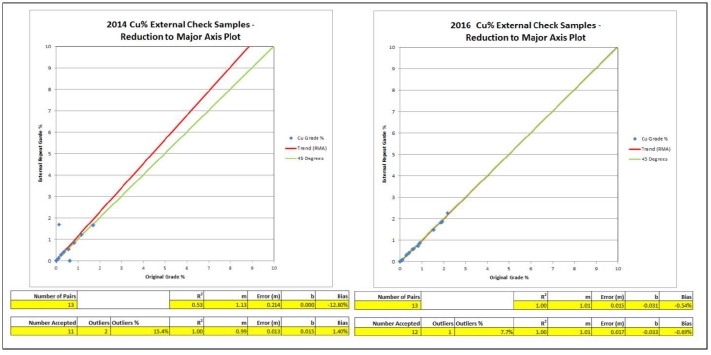
The coarse blanks’ results are shown in Figure 11-11. These results are acceptable.
Figure 11-11. Blanks’ Analyses – 2014 and 2015
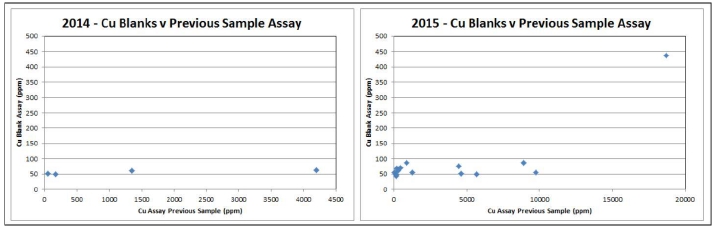
| Adam Wheeler | September 2025 |
| Technical Report on the Mineral Resources of the Nussir and Ulveryggen Projects | 79 |
2017
A summary of the QA/QC samples taken through the 2017 drilling campaign is shown in Table 11-7.
Table 11-7. Summary of QAQC Samples – 2017
| Type of Control | Number of | Number | Frequency | ||
| Samples | |||||
| Twin Samples | TS | 265 | 24 | 9% | |
| Coarse Duplicates | CD | 265 | 2 | 0.8% | |
| Fine Duplicates | PD | 265 | 19 | 7% | |
| Standards | STD | 265 | 16 | 6% | |
| Coarse Blanks | CB | 265 | 16 | 6% | |
| Fine Blanks | FB | 265 | 21 | 8% | |
| External Controls | EC | 265 | 30 | 11% | |
| Total | 48% |
Precision analysis results for field duplicates are summarised in Figure 11-12 and Table 11-8. The proportion of errors is greater than the usual 10% error threshold for acceptability. However, one of the error pairs is almost directly on the error limit failure line. If this one error was removed, the proportion of errors would be reduced to 13%.
Figure 11-12. Precision Analysis – Field Duplicates - 2017
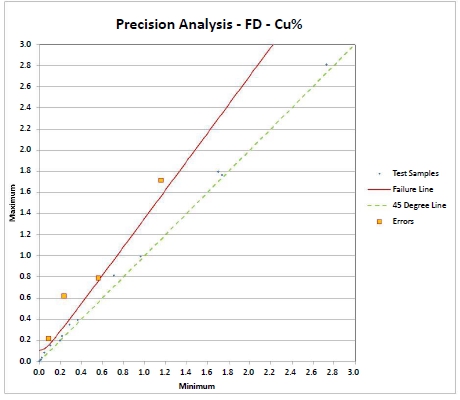
Table 11-8. Precision Analysis – Field Duplicates - 2017
| Number of | |||
| Type | Pairs | Failed | Error % |
| PD - Cu | 24 | 4 | 17% |
| Adam Wheeler | September 2025 |
| Technical Report on the Mineral Resources of the Nussir and Ulveryggen Projects | 80 |
Coarse duplicate measurements were very limited but are shown graphically in Figure 11-13. Precision analysis results for pulp duplicates are summarised in Figure 11-14 and Table 11-9. These results are quite acceptable.
Figure 11-13. Precision Analysis – Coarse Duplicates - 2017
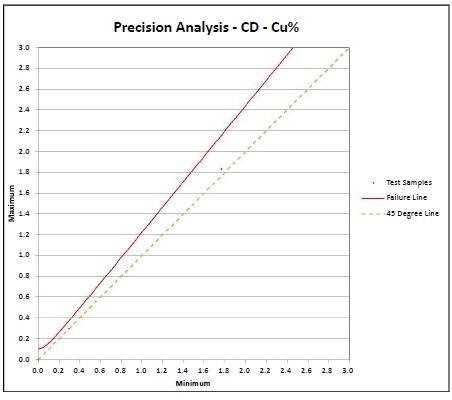
Figure 11-14. Precision Analysis – Pulp Duplicates - 2017
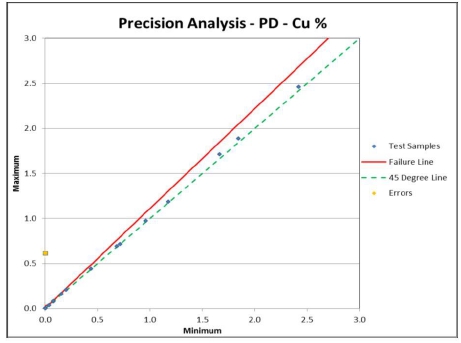
Table 11-9. Precision Analysis – Pulp Duplicates - 2017
| Type | Number of Pairs | Failed | Error % |
| PD - Cu | 18 | 1 | 5.6% |
Results for standards’ analysis are shown in Figure 11-15 and Table 11-10. These results are consistently acceptable.
| Adam Wheeler | September 2025 |
| Technical Report on the Mineral Resources of the Nussir and Ulveryggen Projects | 81 |
Figure 11-15. Standard Analyses’ Graphs – Cu% - 2017
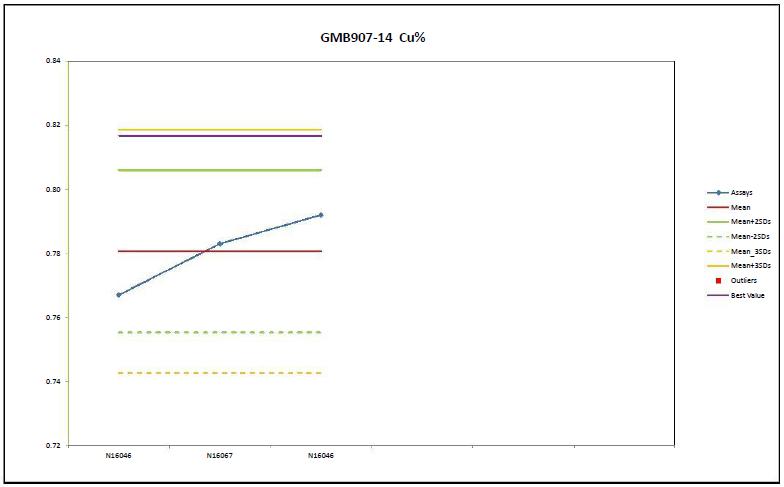
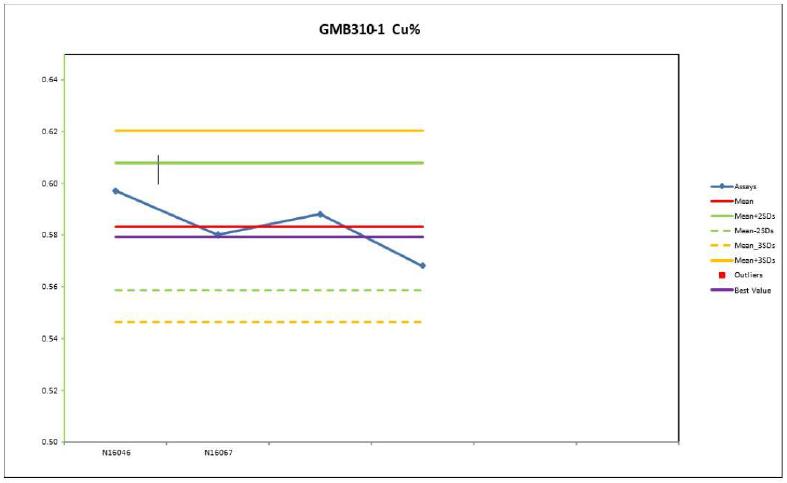
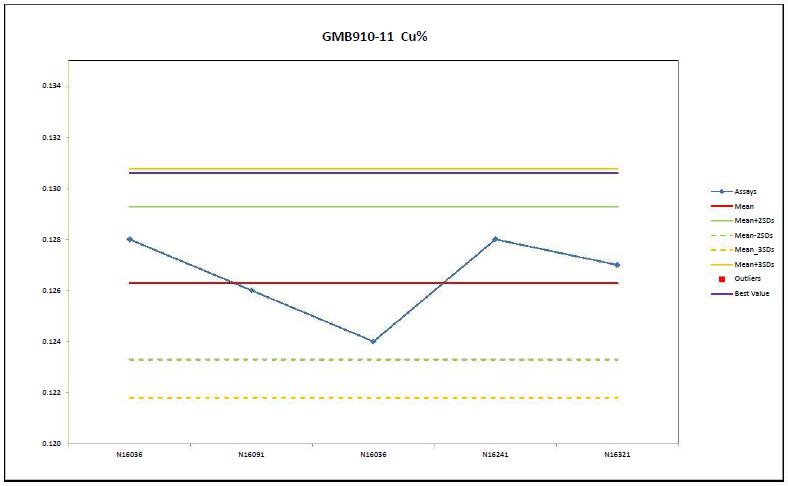
| Adam Wheeler | September 2025 |
| Technical Report on the Mineral Resources of the Nussir and Ulveryggen Projects | 82 |
Table 11-10. Standards’ Results Summary and Global Accuracy - 2017
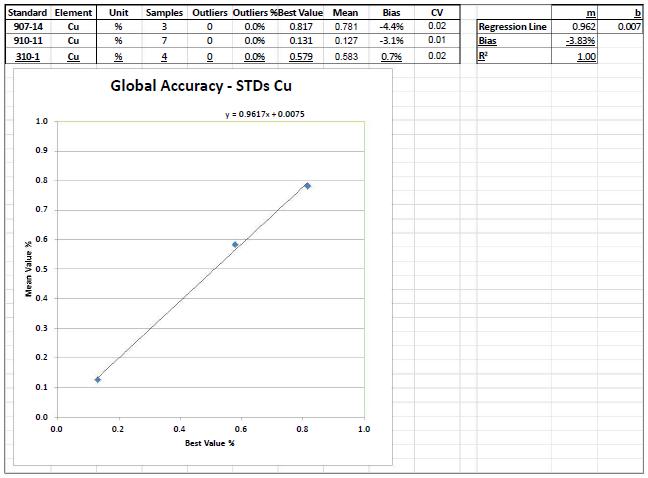
| Adam Wheeler | September 2025 |
| Technical Report on the Mineral Resources of the Nussir and Ulveryggen Projects | 83 |
Coarse blanks’ results are summarised in Figure 11-16. This shows consistently acceptable results, as well as no relationship with previous assays, indicating no contamination during sample preparation.
Figure 11-16. Coarse Blanks’ Assays - 2017
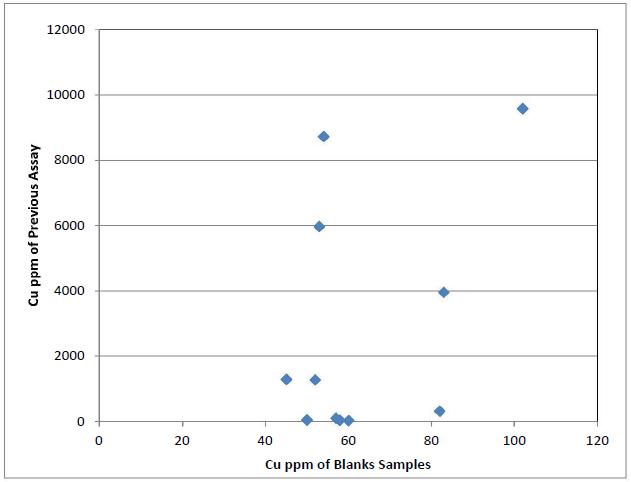
All fine blanks’ Cu assays were below the level of detection, indicating no contamination during analysis.
The lack of coarse duplicates results means there is no direct measure of the precision of sample preparation. That withstanding, it may be concluded that overall, the 2017 QA/QC results are generally acceptable.
| Adam Wheeler | September 2025 |
| Technical Report on the Mineral Resources of the Nussir and Ulveryggen Projects | 84 |
2019
A summary of the QA/QC samples taken through the 2019 drilling campaign is shown in Table 11-11.
Table 11-11. Summary of QAQC Samples – 2019
| Type of | Number of | |||
| Control | Primary Samples | Number | Frequency | |
| Twin Samples | TS | 100 | 9 | 9% |
| Coarse Duplicates | CD | 100 | 11 | 11% |
| Fine Duplicates | PD | 100 | 11 | 11% |
| Standards | STD | 100 | 5 | 5% |
| Coarse Blanks | CB | 100 | 9 | 9% |
| Fine Blanks | FB | 100 | 0 | 0% |
| External Controls | EC | 100 | 10 | 10% |
| Total | 55% |
Precision analysis results for all forms of duplicates are shown in Figure 11-17, Figure 11-18 and Figure 11-19: no errors were apparent.
Standards’ results are summarised in Figure 11-21 and Figure 11-22; no errors were apparent.
Coarse blanks’ results are shown in Figure 11-20. Although of the assays are rather high, there appears to be no relationship with the previous assays.
Figure 11-12 and Table 11-8. The proportion of errors is greater than the usual 10% error threshold for acceptability. However, one of the error pairs is almost directly on the error limit failure line. If this one error was removed, the proportion of errors would be reduced to 13%.
Results for the external check Cu samples, which were sent to Labtium, are shown in Figure 11-23. The show very low bias results, and those check samples which were outliers had extremely low grades, of less than 0.005% Cu.
| Adam Wheeler | September 2025 |
| Technical Report on the Mineral Resources of the Nussir and Ulveryggen Projects | 85 |
Figure 11-17. Field Duplicates’ Results -2019
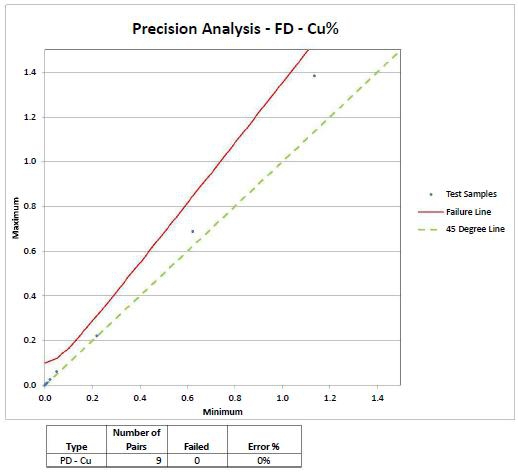
Figure 11-18. Coarse Duplicates’ Results -2019
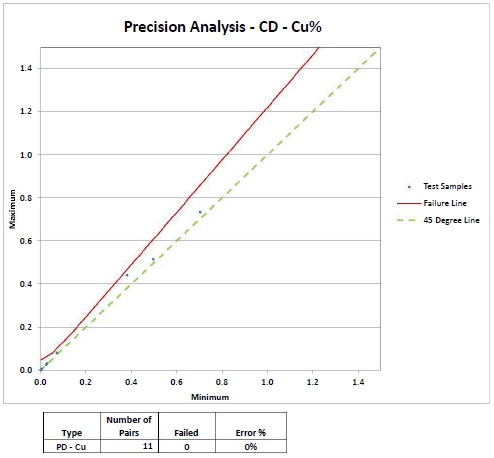
| Adam Wheeler | September 2025 |
| Technical Report on the Mineral Resources of the Nussir and Ulveryggen Projects | 86 |
Figure 11-19. Pulp Duplicates’ Results -2019
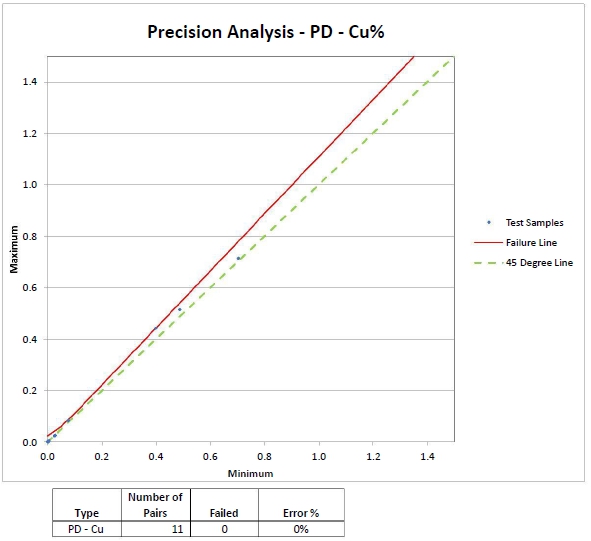
Figure 11-20. Coarse Blanks’ Results – 2019
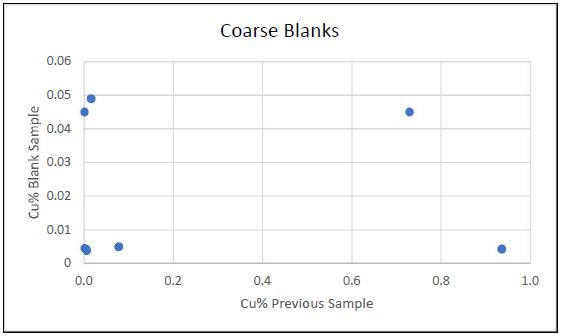
| Adam Wheeler | September 2025 |
| Technical Report on the Mineral Resources of the Nussir and Ulveryggen Projects | 87 |
Figure 11-21. Standard 910-11 Results 2017-2019
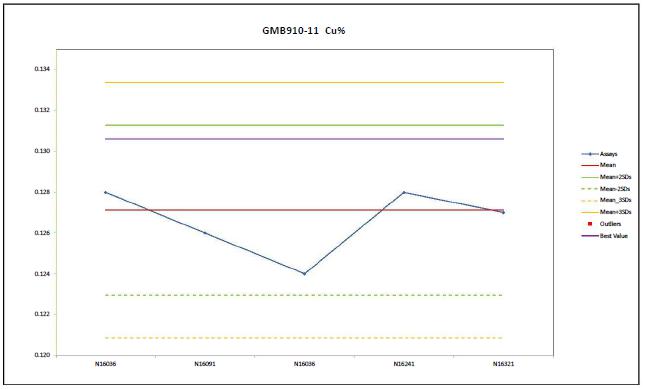
Figure 11-22. Standard 310-1 Results 2017-2019
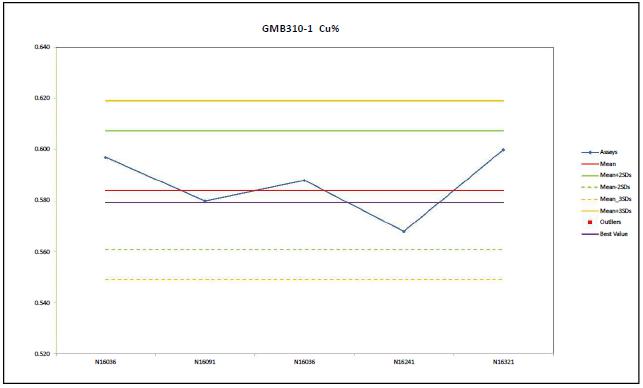
| Adam Wheeler | September 2025 |
| Technical Report on the Mineral Resources of the Nussir and Ulveryggen Projects | 88 |
Figure 11-23. External Check Sample Results – 2019
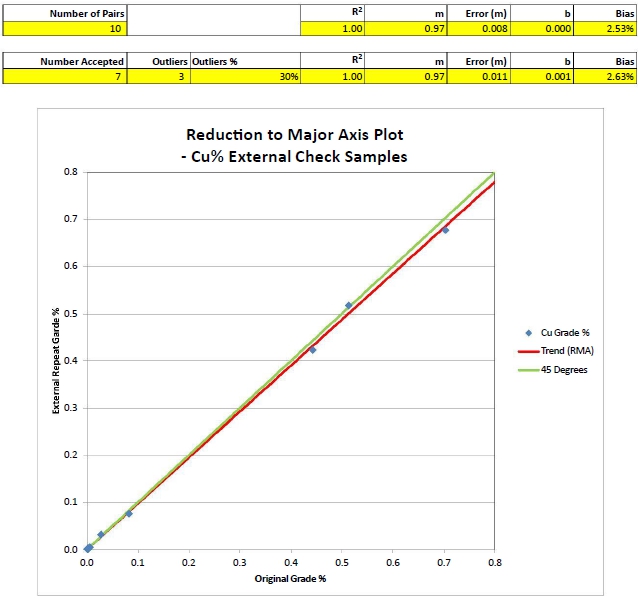
| Adam Wheeler | September 2025 |
| Technical Report on the Mineral Resources of the Nussir and Ulveryggen Projects | 89 |
11.1.4 Density Measurements
Density measurements were done by Promin. Selected drill core billets were accurately cut and then polished to have a cut that was as close to 90° as possible (at SINTEF). The length was then measured four times around the circumference of the drill core and averaged.
The same was done with the diameter of the core; measured 4 times and averaged. The resulting volume was then used as the volume for the core billet. Along with the dry weight, the density was then calculated. The drill cores were also inspected for any chippings or other damage to the cylinder shape, to check the volume calculation was not affected.
11.1.5 Summary
Up to the end of 2013, the Nussir deposit database stemmed primarily from 108 drillholes, with 1,974 samples. In the 2009 sampling campaign, assays were obtained from OMAC and ALS laboratories. During April-May 2011, 93 samples were sent for check assay to the ALS laboratory (which had originally been assayed by OMAC) and 17 samples were sent for check assay to the OMAC laboratory (which had originally been assayed by ALS). Up to the end of 2009, this gave 110 check assay measurements, approximately 1 in 12 of the available assays, which was considered an acceptable proportion of samples.
For the 2011 and 2013 drilling campaigns, primary samples were analysed by ALS Chemex in Sweden, using four-acid ICP-AES. External duplicates were analysed at SGS laboratories in Bor, Serbia.
In the 2014 campaign, primary samples were assayed at Labtium, with external assaying done at ALS. In the 2015-2019 campaigns, primary samples were assayed at ALS, with external assaying done at Labtium.
The standards (Geostats Pty, Ltd.) used for Nussir work are summarised below:
Table 11-12. Summary of Sample Standards
| Campaigns | Standard | Certified Cu Grade |
| Cu % | ||
| Prior to 2014 | GBM303-8 | 1.395 |
| GBM309-4 | 2.233 | |
| 2014 -2019 | GBM907-14 | 0.813 |
| GBM310-1 | 0.579 | |
| GBM910-11 | 0.131 |
11.2 Ulveryggen
11.2.1 Sample Preparation and Analysis
In 2014 and 2017, the diamond drillhole samples were analysed by ALS Chemex laboratory in Sweden by four acid ICP-AES. The selection of intersections for assaying was also assisted by initial assaying using handheld XRF.
| Adam Wheeler | September 2025 |
| Technical Report on the Mineral Resources of the Nussir and Ulveryggen Projects | 90 |
Sample preparation work has been done using ALS Chemex in Piteå, under instructions from Nussir’s geologists, using the following steps:
| 1. | Sawing of core into two halves. | |
| 2. | Crushing of one-half sample, 70% < 2mm. | |
| 3. | Riffle splitting of crushed sample. | |
| 4. | Pulverising to 85% < 75 µm. | |
| 5. | Taking of sample for analysis. |
| Adam Wheeler | September 2025 |
| Technical Report on the Mineral Resources of the Nussir and Ulveryggen Projects | 91 |
11.2.2 Quality Assurance/ Quality Control
2014
In terms of sample preparation and QA/QC, the Ulveryggen drillholes completed in 2014 were part of the drilling campaign for the neighbouring Nussir deposit. A summary of the QA/QC samples taken through the 2014 and 2015 campaigns for Nussir is shown below in Table 11-13.
Table 11-13. Summary of QAQC Samples – 2014 and 2015
| 2014 | 2015 | Combined | ||||
| Number | Proportion | Number | Proportion | Number | Proportion | |
| Primary Samples | 324 | 247 | 571 | |||
| Field Duplicates | 0 | 0.0% | 23 | 9.3% | 23 | 4.0% |
| Pulp Duplicates | 4 | 1.2% | 21 | 8.5% | 25 | 4.4% |
| External Duplicates | 14 | 4.3% | 13 | 5.3% | 27 | 4.7% |
| Blanks | 4 | 1.2% | 12 | 4.9% | 16 | 2.8% |
| Standards | 14 | 4.3% | 18 | 7.3% | 32 | 5.6% |
| Total | 11.1% | 35.2% | 21.5% | |||
A summary of the 2015 field duplicates’ results is shown in Figure 11-2. These results show a relatively high proportion of errors. The 2014 and 2015 pulp duplicates’ results are shown in Figure 11-25. Both sets of results are acceptable.
In the 2014 campaign, primary samples were assayed at Labtium, with external assaying done at ALS. In the 2015 campaign, primary samples were assayed at ALS, with external assaying done at Labtium.
Standards’ results were acceptable, and although there were not sufficient of them for the same standard ID to present graphically. The standards used are summarised below.
Table 11-14. Summary of Standards Used for Ulveryggen
| Standards | Target Range |
| Cu ppm | |
| GBM908-5 | 447-549 |
| MRGeo08 | 567-695 |
| OGGeo08 | 7680-9400 |
| OREAS-45P | 992-1215 |
| Adam Wheeler | September 2025 |
| Technical Report on the Mineral Resources of the Nussir and Ulveryggen Projects | 92 |
Figure 11-24. 2015 Field Duplicates – Precision Analysis
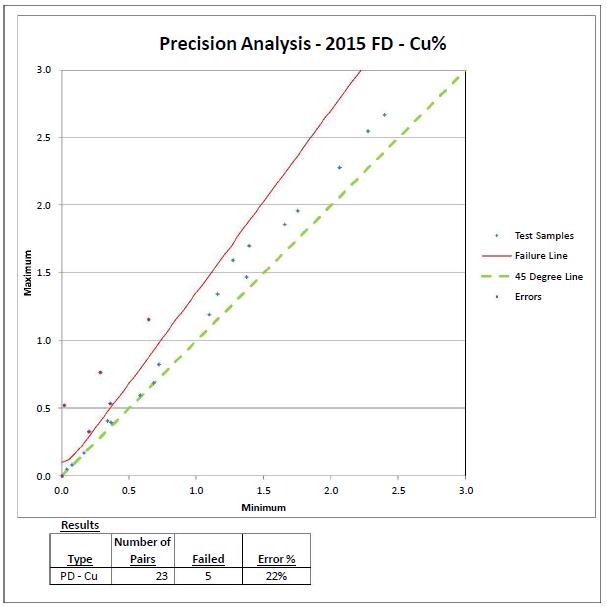
Figure 11-25. Pulp Duplicates’ Analyses – 2014 and 2015
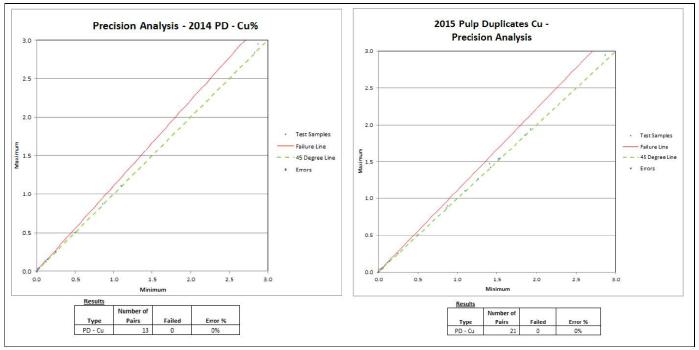
| Adam Wheeler | September 2025 |
| Technical Report on the Mineral Resources of the Nussir and Ulveryggen Projects | 93 |
The external duplicates’ results are shown in Figure 11-26. These results are acceptable.
Figure 11-26. External Duplicates’ Analyses – 2014 and 2015
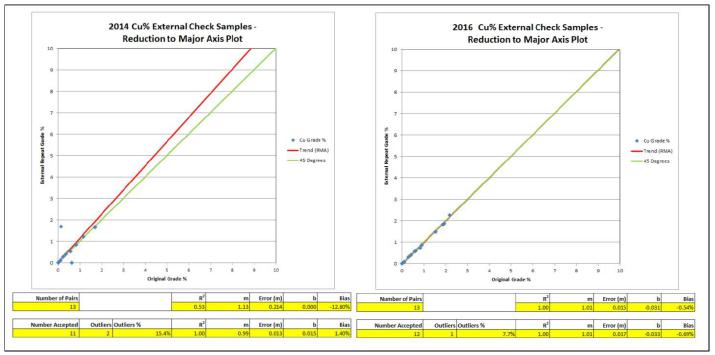
The coarse blanks’ results are shown in Figure 11-27. These results are acceptable.
Figure 11-27. Blanks’ Analyses – 2014 and 2015
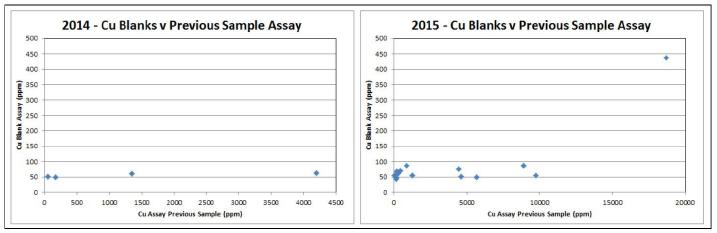
| Adam Wheeler | September 2025 |
| Technical Report on the Mineral Resources of the Nussir and Ulveryggen Projects | 94 |
2017
In terms of sample preparation and QA/QC, the seven Ulveryggen drillholes completed in 2017 were part of the drilling campaign for the neighbouring Nussir deposit. A summary of the QA/QC samples taken through the 2017 campaign for Nussir is shown below in Table 11-15. Of the 265 total primary samples assayed, 177 came from the Nussir drilling, 88 came from Ulveryggen.
Table 11-15. Summary of QAQC Samples – 2017
| Type of Control | Number of | Number | Frequency | ||
| Samples | |||||
| Twin Samples | TS | 265 | 24 | 9% | |
| Coarse Duplicates | CD | 265 | |||
| Fine Duplicates | PD | 265 | 19 | 7% | |
| Standards | STD | 265 | 16 | 6% | |
| Coarse Blanks | CB | 265 | 16 | 6% | |
| Fine Blanks | FB | 265 | 21 | 8% | |
| External Controls | EC | 265 | 30 | 11% | |
| Total | 48% |
Precision analysis results for field duplicates are summarised in Figure 11-28 and Table 11-16. The proportion of errors is greater than the usual 10% error threshold for acceptability. However, one of the error pairs is almost directly on the error limit failure line. If this one error was removed, the proportion of errors would be reduced to 13%.
Figure 11-28. Precision Analysis – Field Duplicates - 2017
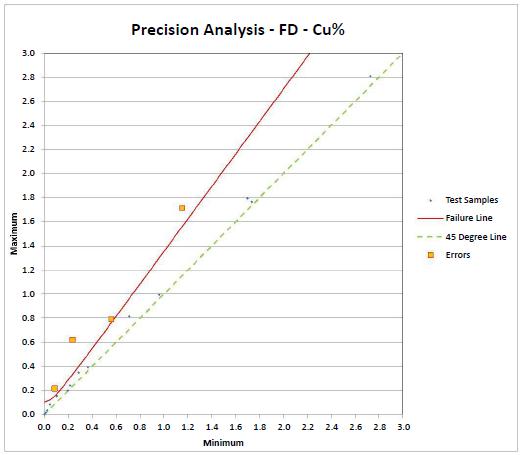
| Adam Wheeler | September 2025 |
| Technical Report on the Mineral Resources of the Nussir and Ulveryggen Projects | 95 |
Table 11-16. Precision Analysis – Field Duplicates - 2017
| Number of | |||
| Type | Pairs | Failed | Error % |
| PD - Cu | 24 | 4 | 17% |
Precision analysis results for pulp duplicates are summarised in Figure 11-29 and Table 11-17 These results are quite acceptable.
Figure 11-29. Precision Analysis – Pulp Duplicates - 2017
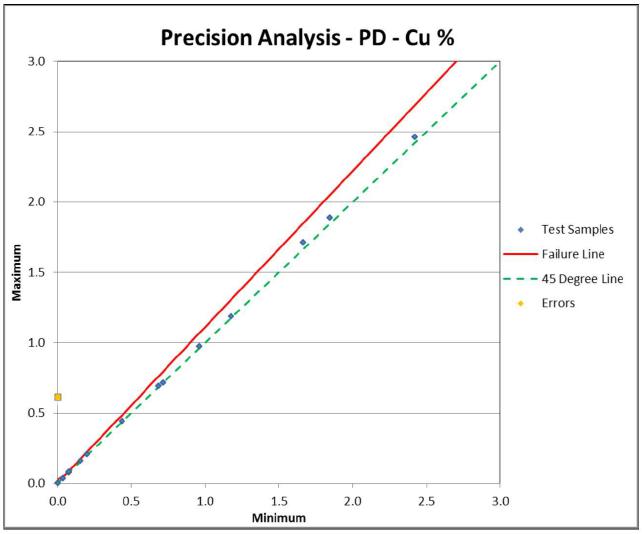
Table 11-17. Precision Analysis – Pulp Duplicates - 2017
| Type | Number of Pairs | Failed | Error % |
| PD - Cu | 18 | 1 | 5.6% |
Results for standards’ analysis are shown in Figure 11-30 and Table 11-18. These results are consistently acceptable.
Coarse blanks’ results are summarised in Figure 11-31. This shows consistently acceptable results, as well as no relationship with previous assays, indicating no contamination during sample preparation.
| Adam Wheeler | September 2025 |
| Technical Report on the Mineral Resources of the Nussir and Ulveryggen Projects | 96 |
Figure 11-30. Standard Analyses’ Graphs – Cu% - 2017
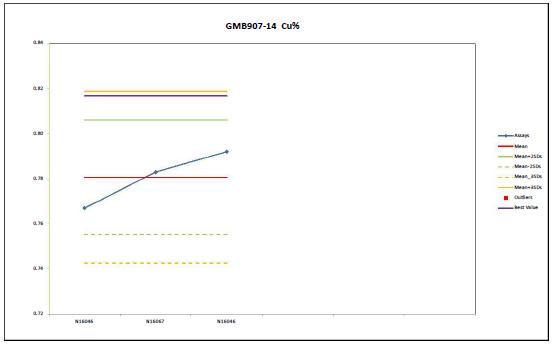
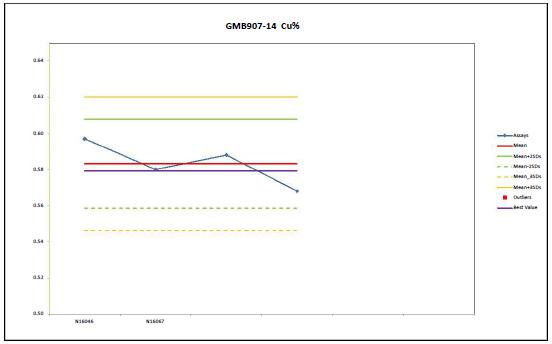
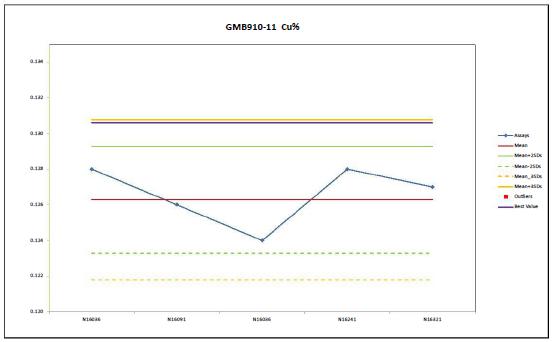
| Adam Wheeler | September 2025 |
| Technical Report on the Mineral Resources of the Nussir and Ulveryggen Projects | 97 |
Table 11-18. Standards’ Results Summary and Global Accuracy - 2017
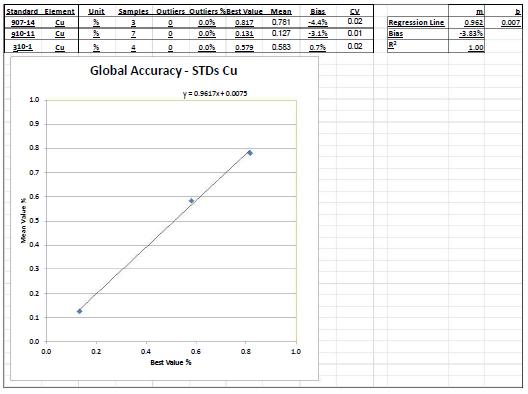
Figure 11-31. Coarse Blanks’ Assays - 2017
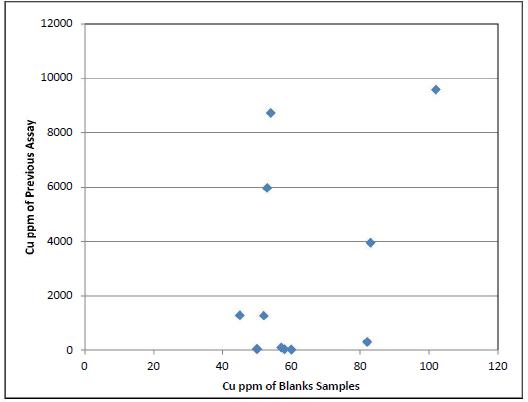
All fine blanks’ Cu assays were below the level of detection, indicating no contamination during analysis. The absence of coarse duplicates results means there is no direct measure of the precision of sample preparation. That withstanding, it may be concluded that overall the 2017 QA/QC results are generally acceptable.
| Adam Wheeler | September 2025 |
| Technical Report on the Mineral Resources of the Nussir and Ulveryggen Projects | 98 |
11.3 Core and Sample Storage
Drill core is stored at Blue Moon’s’s facility at Skaidi and at the NGU national archive in Løkken. Both are secure lockable facilities. The Author has visited them both. A summary of the core inventories is shown in Table 11-8.
Table 11-19. Summary of Core Inventories
| Location | Description | Holes | Length | Average Length | ||
| m | per Hole (m) | |||||
| Skaidi | Nussir | Complete Holes | 11 | 3,028 | 275 | |
| Nussir | Mineralised Intersections | 79 | 1,162 | 15 | ||
| Lokken | Nussir | 166 | 33,909 | 204 | ||
| Ulveryggen | 23 | 1,805 | 78 | |||
Rejects and pulp material from 29 Nussir holes (all from 2014) and 1 Ulveryggen hole are stored at Løkken, stemming from the preparation of 289 samples. There is also reject and pulp material at the core shack in Skaidi, but there is no inventory available for this at the current time.
11.4 Overview
There have been five laboratories associated with the Nussir and Ulveryggen project over the year (Table 11-20). Three of the five laboratories have ISO 17025 accreditation. It should be noted that none of the laboratories involved in either project have or have had interests in the project or the operators, which includes Nussir ASA.
In the opinion of the Author, the QA/QC results overall are acceptable and support the use of the available samples for resource estimation purposes on the Nussir and Ulveryggen deposits.
Table 11-20. Summary of Analytical Laboratories
| Years | Accreditation | |
| Mercury Analytical | 1984-1985 | |
| Caleb Brett Laboratories | 1988 | |
| OMAC Laboratories | 2002-2008 | ISO/IEC 17025 |
| Labtium | 2014 | ISO/IEC 17025 |
| ALS Chemex | 2008-2019 | ISO/IEC 17025 |
| Adam Wheeler | September 2025 |
| Technical Report on the Mineral Resources of the Nussir and Ulveryggen Projects | 99 |
12 DATA VERIFICATION
During the most recent site visit, the Author undertook the following data verification steps completed by the Author include:
| · | Site visits to Nussir, before, during, and after exploration drilling campaigns. |
| · | Site visit to Ulveryggen, including open pits and exploration adit. |
| · | Check review of example Nussir and Ulveryggen deposit drill core, at Skaidi and the NGU core storage in Lokken. |
| · | Check of collar positions relative to surface maps. |
| · | Check of data base integrity through drillhole data processing, statistical analysis, visualisation and plotting. |
| · | Additional checking of Ulveryggen sample data relative to underground adit model. |
12.1 Site Visits
In 2007, the Author walked the entire strike length of the Nussir deposit outcrop and project area. In 2014, the Author visited Nussir during that year’s drilling campaign. Pictures of the general topography at Nussir and a typical drill rig set-up are shown in Figure 12-1 and Figure 12-2, respectively. The Author most recently visited Nussir between January 14 and 16, 2025.
The Author has also done check review work of example Nussir and Ulveryggen drill core, at Skaidi (Figure 12-5) and the NGU core storage in Løkken.
The Author also visited the Ulveryggen site in 2010, which included the old open pit areas and the underground drilling locations. He also visited Ulveryggen between January 14 to 16, 2025. A picture of some of the old pit workings is shown in Figure 12-3. This shows copper-staining on the pit wall, the sheared nature of mineralized zones, and looks across to the hills just to the west of the Nussir deposit. A picture directly into the some of the old pit workings is shown in Figure 12-4.
| Adam Wheeler | September 2025 |
| Technical Report on the Mineral Resources of the Nussir and Ulveryggen Projects | 100 |
Figure 12-1. Looking West Along Topography at Nussir
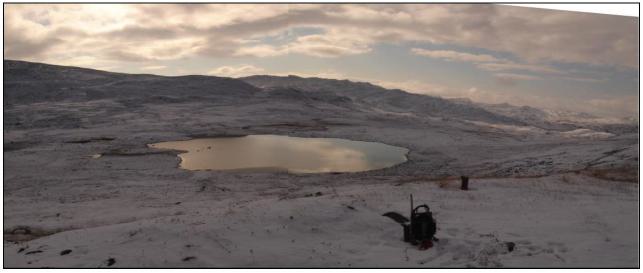
Figure 12-2. Looking North at Drilling Rig Set-Up – Nussir
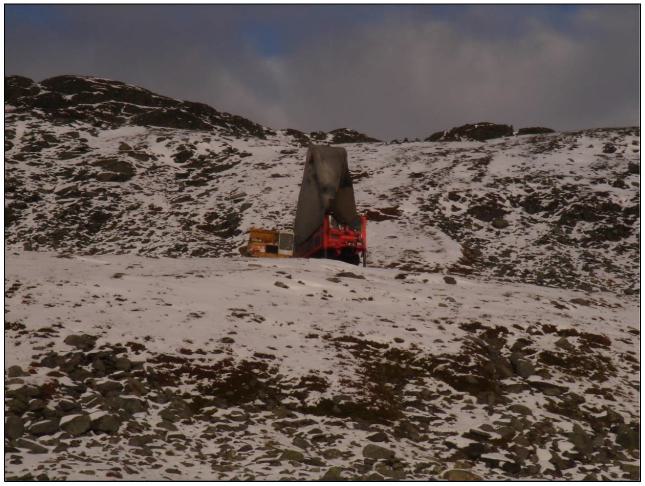
Figure 12-3. South-East Wall of Holvedfelt Pit, Ulveryggen
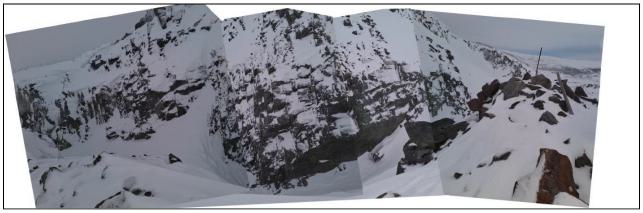
| Adam Wheeler | September 2025 |
| Technical Report on the Mineral Resources of the Nussir and Ulveryggen Projects | 101 |
Figure 12-4. Looking Eastwards into Old Pit Workings, Ulveryggen
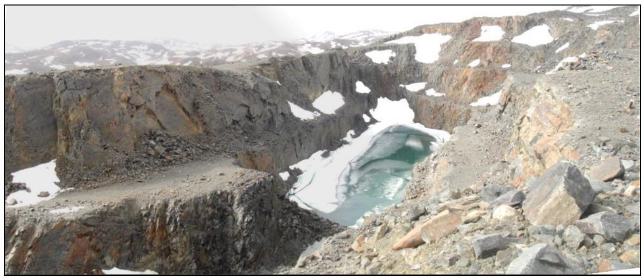
Figure 12-5. Skaidi Core Shack
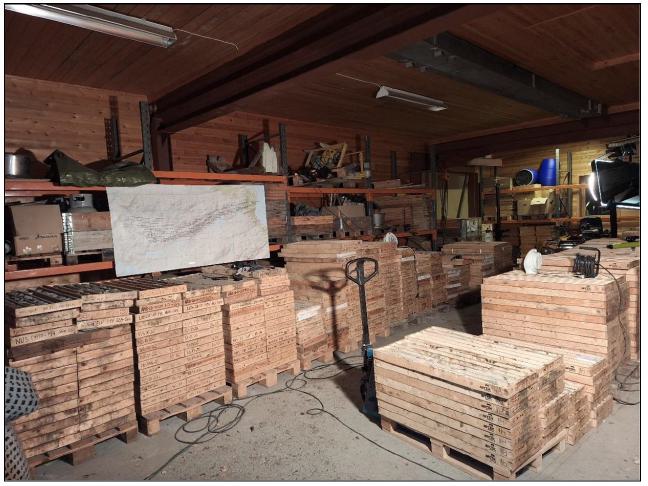
| Adam Wheeler | September 2025 |
| Technical Report on the Mineral Resources of the Nussir and Ulveryggen Projects | 102 |
12.2 Drillhole Data
12.2.1 Collar Data
The Author did his own GPS verifications of 5 historic and recent drillhole collar positions at Nussir during his 2014 site visit. Any XY errors were within 2 m accuracy of the information in the databases, and the Author found no anomalies that would be material to any mineral resource estimate.
The drillhole collars for both Nussir and Ulveryggen, which have been measured by DPOS or CPOS, have been checked for elevation against LiDAR topographical data. Histograms comparing LiDAR elevation differences, and the DPOS/CPOS systems, is shown in Figure 12-6. A summary of the elevation differences from this check exercise for Nussir is shown in Table 12-2 , and elevation differences have been plotted as histograms in Figure 12-7. A summary of the elevation differences for Ulveryggen is shown in Table 12-3, and elevation differences have been plotted as histograms in Figure 12-8.
The Author also reviewed results from a 2019 resurveying exercise of azimuths at drillhole collars. For the original survey file, 65 holes only had one measurement, i.e. 156 had a proper series of downhole measurements. Of these 65, 33 hole-collars’ azimuths were remeasured in 2019 using Devico equipment. The results of the horizontal displacements, at end of these holes due to the azimuth differences, is shown in Table 12-1.
Table 12-1. Summary of Horizontal Displacements - Azimuth Differences – Nussir
| Parameter | Value |
| Number of Collars | 30 |
| Mean | 4.90 |
| Median | 37.76 |
| Prop'n exceeding 0.5m | 33% |
| Prop'n exceeding 1m | 23.3% |
| Prop'n exceeding 5m | 10.0% |
For these check data, observations include:
| · | For Nussir deposit, there does not appear to be in appreciable difference in elevation accuracy between DPOS and CPOS measurements as verified by the Author. |
| · | The azimuth validation review by the Author has identified 3 of the holes with high differences. Two of these three holes did not intersection mineralisation, and the remaining hole has negligible effect of the zones’ interpretation. |
| · | In general, the elevation differences seem worse for Ulveryggen deposit than Nussir deposit. However, this might be due to difficult type of topography at Ulveryggen deposit, with many very steep faces and slopes left by the open pit mining, making the LiDAR pick-up more difficult without more detailed DPOS or CPOS measurements for calibration. |
| · | The distribution of LiDAR errors is near normal, not indicating any positive or negative bias in the opinion of the Author. |
| · | The proportion of +2m and +5m LiDAR errors are rather high, and efforts in the future should be made to increase the precision. |
| · | There does not appear to be any relationship between higher elevation differences and X-Y positioning, as shown in Figure 12-9. |
| · | It is considered the errors encountered from this validation exercise do not have any appreciable effect on the current MRE. |
| Adam Wheeler | September 2025 |
| Technical Report on the Mineral Resources of the Nussir and Ulveryggen Projects | 103 |
Figure 12-6. Histograms of Collars’ LiDAR Errors - Nussir
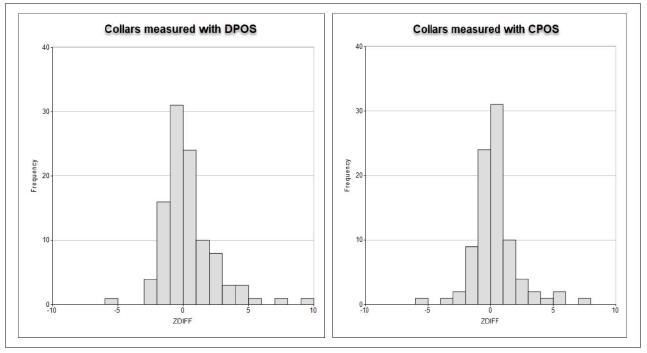
Figure 12-7. Histograms of Collars’ Elevation Differences with LiDAR - Nussir
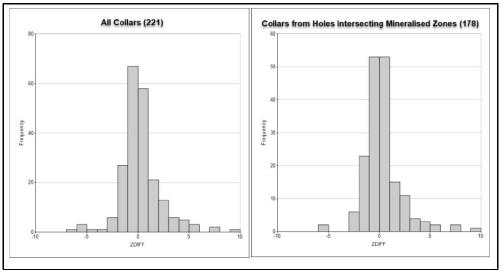
Table 12-2. Summary of Collars’ Elevation Differences with LiDAR - Nussir
| Parameter | All Holes | Mineralised | |
| Holes | |||
| Number of Collars | 221 | 178 | |
| Mean Absolute Difference (m) | 1.66 | 1.42 | |
| Median Absolute Difference (m) | 0.83 | 0.80 | |
| Prop'n exceeding Mean+3SD | 2.7% | 2.2% | |
| Prop'n exceeding 2m | 21.7% | 18.5% | |
| Prop'n exceeding 5m | 7.2% | 5.1% | |
| Prop'n exceeding 10m | 2.7% | 1.7% |
| Adam Wheeler | September 2025 |
| Technical Report on the Mineral Resources of the Nussir and Ulveryggen Projects | 104 |
Figure 12-8. Histograms of Collars’ Elevation Differences with LiDAR - Ulveryggen
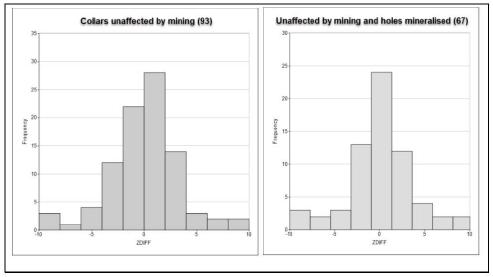
Table 12-3. Summary of Collars’ Elevation Differences with LiDAR – Ulveryggen
| Parameter | All Holes * | Mineralised | |
| Holes | |||
| Number of Collars | 93 | 67 | |
| Mean Absolute Difference (m) | 2.48 | 2.76 | |
| Median Absolute Difference (m) | 1.77 | 2.11 | |
| Prop'n exceeding Mean+3SD | 0.1% | 0.0% | |
| Prop'n exceeding 2m | 46.2% | 50.7% | |
| Prop'n exceeding 5m | 14.0% | 16.4% | |
| Prop'n exceeding 10m | 2.2% | 3.0% |
Notes
* Surface holes unaffected by open pit mining
Figure 12-9. Plan of LiDAR Differences with Collar Elevation - Nussir
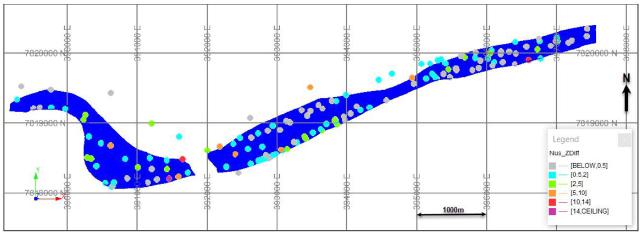
| Adam Wheeler | September 2025 |
| Technical Report on the Mineral Resources of the Nussir and Ulveryggen Projects | 105 |
12.2.2 Drillhole Core
The Author’s site visits included a review of selected Nussir and Ulveryggen deposit drill core, at Skaidi and the NGU core storage in Lokken, in order to validate and verify the information in the databases against data entry. The drill holes from which mineralised intersections were verified are summarised in Figure 12-10. The items reviewed during this work included:
| · | Correspondence between logged/database lithologies, and actual lithologies in the core boxes. |
| · | Correspondence between mineralisation and marked sample limits with the database. |
| · | Any notable aspects of copper mineralisation. |
Examples of core photos from the Author’s core review at Lokken are shown in Figure 12-11 to Figure 12-16. The red blocked-out sections are the main zone intersections, with average zone intersection grades shown above. In these reviews the mineralisation and lithologies observed correspond well with the database information.
Figure 12-10. 3D View of Holes, Showing Holes of Core Review
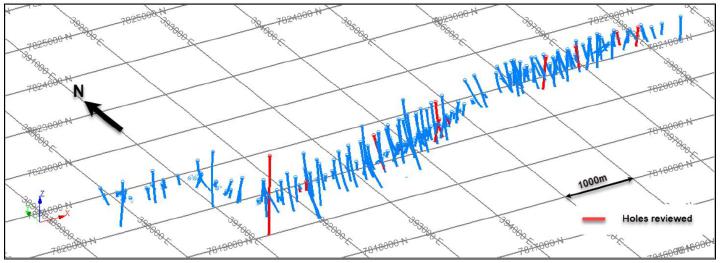
12.3 Database
Check of database integrity was through operations including:
| · | Range checks. |
| · | Checks of tabulated data against original logged data. |
| · | Drillhole data processing. |
| · | Statistical analysis |
| · | Visualisation and plotting. |
The Author completed all of the above verification steps. In the case of Ulveryggen, there was additional checking by the Author of Ulveryggen sample data relative to the underground adit model and the old open pit workings.
| Adam Wheeler | September 2025 |
| Technical Report on the Mineral Resources of the Nussir and Ulveryggen Projects | 106 |
Figure 12-11. Hole NUS-DD-90-009
[24-27.8m, 1.48%Cu, 35.3g/tAg, 0.07g/tAu]
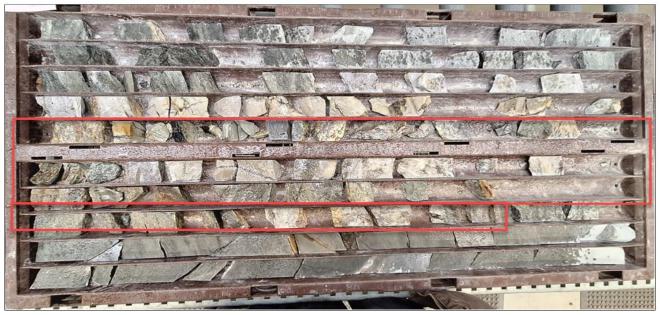
Figure 12-12. Hole NUS-DD-90-017
[73.85-77.7m; 1.82%Cu, 16.1g/tAg, 0.15g/tAu]
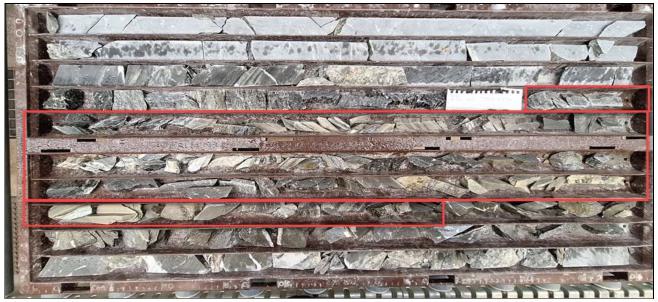
Figure 12-13. Hole NUS-DD-90-021
[97-100m; 1.23%Cu, 15.5g/tAg, 0.15g/tAu]
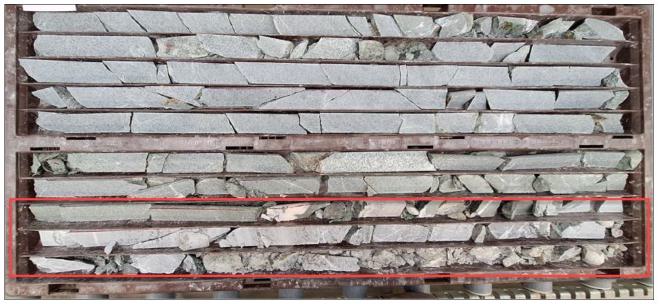
| Adam Wheeler | September 2025 |
| Technical Report on the Mineral Resources of the Nussir and Ulveryggen Projects | 107 |
Figure 12-14. Hole NUS-DD-14-001
[1078.85-1088.4m, 0.94%Cu, 11.7g/tAg, 0.28g/tAu]
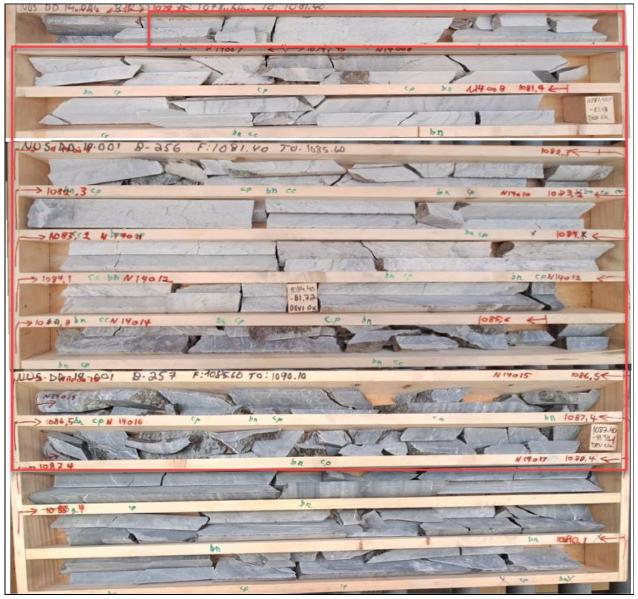
Figure 12-15. Hole NUS-DD-15-030
[445.6-449.2m; 1.22%Cu, 27.3g/tAg, 0.16g/tAu]
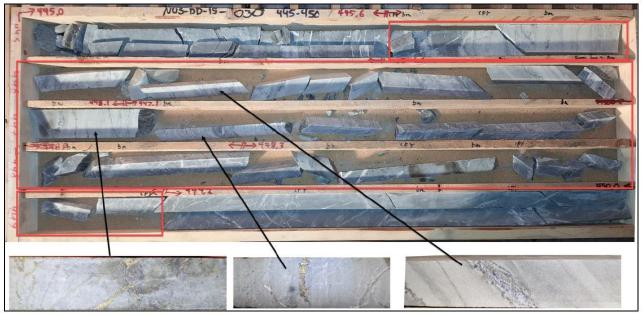
| Adam Wheeler | September 2025 |
| Technical Report on the Mineral Resources of the Nussir and Ulveryggen Projects | 108 |
Figure 12-16. Hole ULV-DD-17-06
[95.3-100.2m; 0.58%Cu]
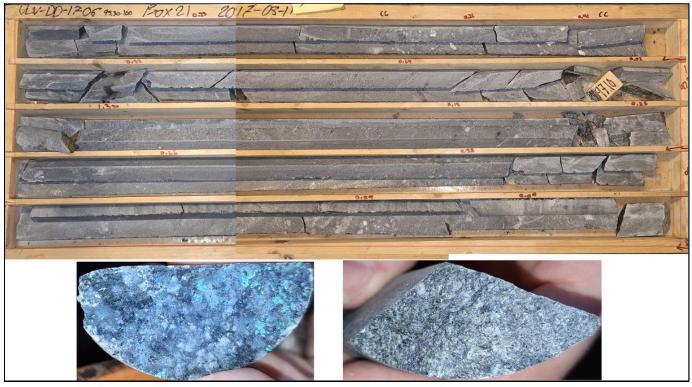
12.4 Overview
The data verification procedures applied by the Author are described in sections 12.1, 12,2 and 12.3 above. Please note that the Author was not able to verify surface drillhole collar locations at Ulveryggen deposit, owing to surface mining activities after drilling, as well as extensive snow cover at the time of the Author’s visits. However, the additional validation step of comparison drill collar locations with LIDAR data, as well as analysis of sections of the pit workings relative to drillhole data, have led the Author to believe that the Ulveryggen deposit, surface drillhole collar data are valid and therefore verified for resource estimation purposes.
In the Author’s opinion, the geological data in the databases are also adequate for the Nussir and Ulveryggen deposit, resource estimation work, and that this technical information was collected in line with industry best practices, as defined in the Canadian Institute of Mining and Metallurgy and Petroleum (CIM) Mineral Resources and Mineral Reserves Best Practice Guidelines.
| Adam Wheeler | September 2025 |
| Technical Report on the Mineral Resources of the Nussir and Ulveryggen Projects | 109 |
13 MINERAL PROCESSING AND METALLURGICAL TESTING
13.1 Overview
Several metallurgical test work programs have been executed under Nussir ASA project development on the Nussir and Ulveryggen copper deposits. Three major test work programs were performed between 2010/11 and 2019:
| · | “An Investigation into RECOVERY OF COPPER FROM THE KVALSUND DEPOSIT” prepared for NUSSIR ASA, SGS Project 12527-001 – Final report, dated May 9, 2011. |
| · | For a historical PFS in 2016; “SGS Lakefield “An Investigation into PRE-FEASIBILITY LEVEL METALLURGICAL TESTING ON SAMPLES FROM NUSSIR AND ULVERYGGEN COPPER DEPOSITS” prepared for NUSSIR ASA, SGS Project 12527-003 – Final Report, dated Aug 17, 2016. |
All test work has been done by SGS Lakefield, Canada, and are documented in separate reports. Canadian consultant and flotation provider, Woodgrove Technologies, took part in coordinating the test programs. The Ulveryggen deposit was in production from 1972 to 1979, with documented process plant performance.
The two deposits yield copper concentrate grades and copper recoveries that are very high compared to most copper deposits in the world. The reason for the high concentrate grade is due to the high amount of bornite and chalcocite in the deposits. The high copper recovery is due to the clean ore with practically no other sulphides, no oxidised ore and beneficial grind size for efficient flotation.
The following types of metallurgical samples were taken in the historical 2019 DFS testwork and sent to SGS for different metallurgical tests, including but not limited to grindability and flotation testing.
| 1. | Composite Samples. Three different spatial composites from Nussir were prepared. |
| 2. | Variability Samples. 15 were taken from Nussir, and 3 from Ulveryggen. |
The spatial composites from Nussir are summarised in Table 13-1 and are depicted in long section in Figure 13-1. QEMSCAN analysis verified their original assay results, as well as providing additional metallurgical data on the mineralogical makeup of the composites. All three composites were dominated by bornite, with lesser chalcopyrite (Composite 3) and chalcocite (Composite 1).
Table 13-1. Summary of Nussir Composite Metallurgical Samples
| Element | Unit | Comp 1 | Comp 2 | Comp 3 |
| Cu | % | 1.10 | 1.53 | 1.18 |
| Au | g/t | 0.19 | 0.16 | 0.11 |
| Ag | g/t | 17.6 | 20.1 | 12.4 |
| S | % | 0.36 | 0.67 | 0.61 |
| Total Weight | kg | 10.43 | 28.42 | 47.07 |
| Number of Holes | 3 | 5 | 6 |
A more detailed breakdown of the assays from the three prepared composites is shown in Table 13-2.
| Adam Wheeler | September 2025 |
| Technical Report on the Mineral Resources of the Nussir and Ulveryggen Projects | 110 |
Table 13-2. Assay Breakdown of Nussir Composite Metallurgical Samples
| Sample ID | Comp 1 | Comp 2 | Comp 3 |
| Au g/t | 0.19 | 0.16 | 0.11 |
| Ag g/t | 17.6 | 20.1 | 12.4 |
| Pt g/t | 0.13 | 0.16 | < 0.02 |
| S % | 0.36 | 0.67 | 0.61 |
| Cu seq H2SO4 % | 0.024 | 0.025 | 0.016 |
| Cu seq. NaCN % | 0.99 | 1.4 | 0.86 |
| Cu seq. A/R % | 0.037 | 0.14 | 0.3 |
| Cu % | 1.10 | 1.53 | 1.18 |
| Ag g/t | 17 | 21 | 11 |
| Al g/t | 46200 | 46300 | 40400 |
| As g/t | < 30 | < 30 | < 30 |
| Be g/t | 0.8 | 0.76 | 0.7 |
| Bi g/t | < 20 | < 20 | < 20 |
| Ca g/t | 130000 | 126000 | 125000 |
| Cd g/t | < 2 | < 2 | < 2 |
| Co g/t | 11 | 13 | 14 |
| Cr g/t | 31 | 30 | 27 |
| Fe g/t | 12800 | 13600 | 16500 |
| K g/t | 26200 | 24400 | 19500 |
| Li g/t | < 20 | < 20 | < 20 |
| Mg g/t | 10700 | 13300 | 36800 |
| Mn g/t | 3500 | 3110 | 4380 |
| Mo g/t | < 20 | < 20 | < 20 |
| Na g/t | 12700 | 16300 | 13800 |
| Ni g/t | < 20 | 30 | 24 |
| P g/t | 352 | 417 | 284 |
| Pb g/t | < 20 | < 20 | < 20 |
| Sb g/t | < 10 | < 10 | < 10 |
| Se g/t | < 40 | < 40 | < 40 |
| Sn g/t | < 40 | < 40 | < 40 |
| Sr g/t | 196 | 178 | 123 |
| Ti g/t | 1530 | 1510 | 1320 |
| Tl g/t | < 30 | < 30 | < 30 |
| U g/t | < 20 | < 20 | < 20 |
| V g/t | 46 | 45 | 42 |
| Y g/t | 11.2 | 10.9 | 9.2 |
| Zn g/t | < 40 | < 40 | < 40 |
| Adam Wheeler | September 2025 |
| Technical Report on the Mineral Resources of the Nussir and Ulveryggen Projects | 111 |
Figure 13-1. Nussir Long Section - Locations of Composite Metallurgical Samples
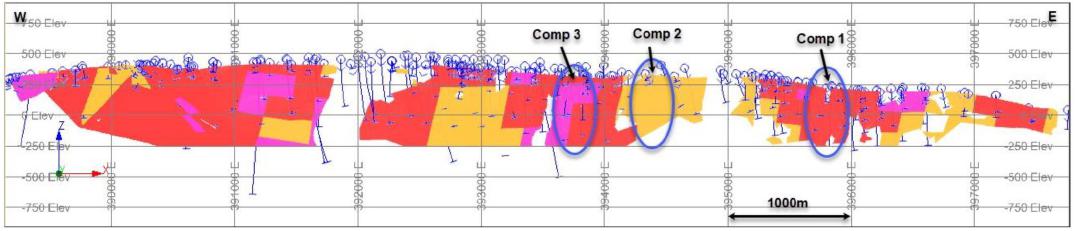
Figure 13-2. Nussir Long Section – Drillholes Used for Variability Metallurgical Samples
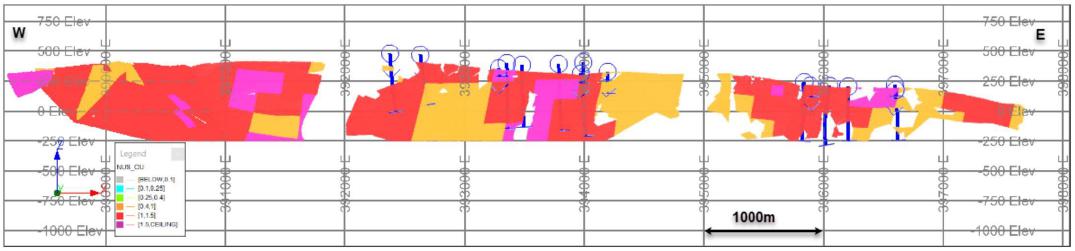
| Adam Wheeler | September 2025 |
| Technical Report on the Mineral Resources of the Nussir and Ulveryggen Projects | 112 |
13.2 Variability and Hardness Testing
The drillholes used for providing the variability samples from Nussir are depicted in long section in Figure 13-2. The grades of all the variability samples are summarised in Table 13-3. The variability samples were submitted for comminution testwork, including SAG Power Index test (SPI®), Bond Ball Mill Work Index (BWI), ModBond test, and Bond Abrasion Index (AI) test. These results are summarised in Table 13-4.
Table 13-3. Variability Samples Head Assays
| Sample ID | Bore Hold ID | Cu, % | Au, g/t | Ag, g/t | S, % |
| Nussir Deposit | |||||
| VAR 1 | NUS-DD-188 | 1.84 | 0.16 | 34.2 | 0.51 |
| VAR 2 | NUD-DD-189 | 0.31 | < 0.02 | 1.3 | 0.19 |
| VAR 3 | NUD-DD-190 | 1.11 | 0.05 | 3.8 | 0.69 |
| VAR 4 | NUS-DD-191 | 0.49 | 0.03 | 5.2 | 0.22 |
| VAR 5 | NUS-DD-192 | 1.48 | 0.19 | 14.8 | 0.64 |
| VAR 6 | NUS-DD-195 | 1.03 | 0.17 | 23.3 | 0.42 |
| VAR 7 | NUS-DD-196 | 0.12 | < 0.02 | < 0.5 | 0.10 |
| VAR 10 | NUS-DD-193 | 0.61 | 0.11 | 8.0 | 0.25 |
| VAR 11 | NUS-DD-194 | 0.77 | 0.12 | 7.0 | 0.42 |
| VAR 12 | NUS-DD-198 | 1.63 | 0.14 | 12.4 | 0.65 |
| VAR 14 | NUS-DD-179 | 1.51 | 0.93 | 20.0 | 0.50 |
| VAR 15 | NUS-DD-181 | 1.31 | 0.38 | 18.5 | 0.51 |
| VAR 16 | NUS-DD-183 | 0.83 | 0.30 | 25.4 | 0.28 |
| VAR 17 | NUS-DD-185 | 0.45 | 0.06 | 3.9 | 0.16 |
| VAR 18 | NUS-DD-186 | 0.54 | 0.18 | 8.8 | 0.27 |
| Ulveryggen Deposit | |||||
| VAR 8 | ULV-DD-17-01 | 0.84 | < 0.02 | 1.4 | 0.31 |
| VAR 9 | ULV-DD-17-04 | 0.50 | < 0.02 | 0.7 | 0.13 |
| VAR 13 | ULV-DD-17-05 | 0.95 | 0.02 | 2.1 | 0.28 |
Table 13-4. Nussir Deposit Grindability Statistics
| BWI (kWh/t) | ||||
| Statistic | SPI® | Full | Mod | AI |
| (Min) | Bond | Bond | (g) | |
| Number of samples | 21 | 4 | 23 | 3 |
| Maximum | 112 | 12.6 | 15.1 | 0.27 |
| Minimum | 34.1 | 11.6 | 9.13 | 0.13 |
| Average | 77.4 | 12.0 | 11.5 | 0.18 |
| Relative Std Dev, % | 25.0 | 3.76 | 12.5 | 44.4 |
| 75th Percentile | 87.1 | 12.2 | 12.3 | 0.20 |
| 25th Percentile | 66.6 | 11.7 | 10.7 | 0.13 |
Based on statistical analysis of the results, the SPI and BWI results indicate the Nussir material as being soft to moderately hard, and slightly abrasive. The Ulveryggen sample results were categorised as moderately hard to hard, and very abrasive.
| Adam Wheeler | September 2025 |
| Technical Report on the Mineral Resources of the Nussir and Ulveryggen Projects | 113 |
13.3 Locked Cycle Testing
A series of locked cycle tests and comparable open-circuit batch tests for each of the spatial composites. The batch and locked cycle test results compared well, with concentrate grades slightly higher in the batch tests and recoveries approximately 2-4% higher in the locked cycle tests. The two ore bodies gave similar results under the conditions tested.
Figure 13-3. Locked Cycle Test Flowsheet
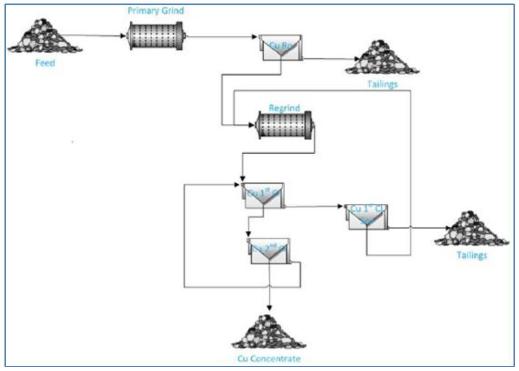
The results of the locked cycle tests and the comparable open-circuit batch tests for each composite, as well as two of the variability samples were also selected for locked cycle testing along with the comparable open-circuit batch test. The results are provided in Table 13-5.
| Adam Wheeler | September 2025 |
| Technical Report on the Mineral Resources of the Nussir and Ulveryggen Projects | 114 |
Table 13-5. Locked Cycle and Open Circuit Test Results Summary
| Composite | Test No. | Product | Assays, % Cu |
% Distribution Cu |
| Comp 1 | LCT2 | Cu Conc | 59.5 | 97.0 |
| F27 | Cu Conc | 63.9 | 93.4 | |
| Comp 2 | LCT 3 | Cu Conc | 50.1 | 95.3 |
| F26 | Cu Conc | 53.1 | 92.7 | |
| Comp 3 | LCT1 | Cu Conc | 36.9 | 96.7 |
| F25 | Cu Conc | 41.4 | 92.3 |
| Bore Hole ID | Composite | Test No. | Product | Assays,
% Cu |
% Distribution Cu |
| NUS-DD-188 | VAR 1 | LCT 4 | Cu Conc | 62.6 | 95.6 |
| F28 | Cu Conc | 62.8 | 91 .8 | ||
| ULV-DD-17-01 | VAR 8 | LCT 5 | Cu Conc | 53.6 | 95.9 |
| F35R | Cu Conc | 54.8 | 93.6 |
The average copper grade of the final concentrates was 53.3% Cu and recovery was 92.5%. The average copper grade of the final concentrates for the three Ulveryggen samples was 60.8% Cu and recovery was 90.4%.
There was no evidence of a relationship between the copper head grade and copper recovery. Overall, the test results indicated that high copper grades and recoveries are feasible for all samples under the conditions applied.
13.4 Material Sorting Studies
A sorting study on Nussir copper mineralization was conducted by Comex and it was completed on December 19, 2024. The objective of the study was to evaluate the potential of employing a multi-sensor sorting technology, utilizing X-ray Transmission (XRT) and X-ray Fluorescence (XRF) sensors. Drill core samples containing copper minerals were provided by the Nussir ASA and crushed to optimize grain shape and element release before testing. The XRT sensor classified the material into three categories: high-grade, low-grade, and waste. Initial results indicated that a significant portion of the waste fraction still contained copper, necessitating an additional refinement step using XRF to further separate copper-rich particles.
The combined sorting process achieved a pre-concentration of the feed material from 0.57% Cu to 1.28% Cu while reducing the waste fraction by 31.1% of the total input. The final waste contained only 0.11% Cu, resulting in a metal recovery efficiency of 94.4% with minimal copper losses. The study confirmed that sorting technology is a viable method for pre-concentration, allowing for the removal of low-grade material early in processing. However, Comex is recommending larger-scale tests to account for variability in the copper mineralization and therefore further optimize the sorting parameters to maximize effectiveness.
| Adam Wheeler | September 2025 |
| Technical Report on the Mineral Resources of the Nussir and Ulveryggen Projects | 115 |
14 MINERAL RESOURCE ESTIMATE
14.1 Nussir
14.1.1 Data Collation
The sample database has been updated by a Norwegian geologist (who has a mining degree from the Norwegian university of Science and Technology), culminating in a single updated Excel workbook, with separate sheets including:
| · | Collar coordinates. As compared with previous estimates, all coordinates have been updated for the UTM system, WGS84, zone 35. All of the drillhole collars from 1985 to 2019 were measured by DPOS GPS, with an accuracy of 0.2-0.5 m. After this, drillhole collars have been measured with a handheld GPS, with an accuracy of approximately 5 m. During 2017, there was a CPOS survey campaign (tied into a base station), campaign going over old and current drill holes, with an accuracy of 2-5 cm. This was done for almost all drill holes, and also included re-measuring of drillholes’ collars from 2008 or later, that had not been previously measured with DPOS. |
| · | Downhole Survey data. Measurements in holes from 2008, 2011 and resurveying of 21 holes drilled in 1990 and 94, stem from a magnetic PeeWee tool rented from Devico in Norway. All 21 holes drilled in 2013 were surveyed by the drilling crew using a Reflex gyro instrument. 16 holes were surveyed prior to 2011 with magnetic equipment and 30 diamond drill holes, and 20 percussion holes remain un-surveyed. Since 2014, two different Devico devices were used. A Deviflex instrument has been mostly used, which employs lasers and gravitation, where the azimuth Is dependent on the first assumed azimuth. A Devishot instrument has also been used (in approximately 9% of survey measurements), which is a magnetic instrument. |
| · | Assay Results. The contained assayed grades of Cu, reassayed Cu (handheld XRF, where measured), Ag, Au, reassayed Au, Pd and Pt. A summary of all drillholes and Cu sample data is shown in Table 14-1. |
| · | Lithology Logs. This contained log data fields which included: |
| · | Geological grouping | |
| · | Formation | |
| · | Lithological code | |
| · | Mineralisation codes | |
| · | Alteration code | |
| · | Structural code | |
| · | Geological description |
| · | Density Measurements. |
After import of these data sets into Datamine, the data files were combined and then ‘desurveyed’ so as to obtain the complete three-dimensional coordinates of each sample. These data could then be viewed in three-dimensions, plan, cross-section or long-section.
| Adam Wheeler | September 2025 |
| Technical Report on the Mineral Resources of the Nussir and Ulveryggen Projects | 116 |
Table 14-1. Holes and Cu Sample Data Summary - Nussir
| Sample | Holes/ | Cu | |||
| Type | YEAR | Channels | Length (m) | Samples | |
| Channel | 1985 | 10 | 35 | 10 | |
| Samples | |||||
| 1985 | 6 | 264 | 31 | ||
| 1986 | 2 | 496 | 28 | ||
| 1988 | 6 | 1,325 | 69 | ||
| 1990 | 24 | 1,893 | 431 | ||
| 1995 | 4 | 724 | 59 | ||
| 1996 | 4 | 1,182 | 66 | ||
| 2006 | 7 | 2,687 | 101 | ||
| Diamond | 2007 | 1 | 78 | 17 | |
| Drillholes | 2008 | 30 | 7,116 | 605 | |
| 2011 | 6 | 1,996 | 141 | ||
| 2013 | 21 | 3,222 | 126 | ||
| 2014 | 34 | 9,308 | 326 | ||
| 2015 | 33 | 10,572 | 283 | ||
| 2017 | 20 | 7,947 | 186 | ||
| 2019 | 13 | 3,912 | 100 | ||
| Total DD | 211 | 52,723 | 2,569 | ||
| Total ALL | 221 | 52,757 | 2,579 |
In the process of this data collation, the following validation steps were taken:
| a) | Range checks |
| b) | Sequential FROM-TO checks |
| c) | Visual examination |
| d) | Cross-referencing different log-types and reports |
These checks enabled some few small transcription errors in assay and survey data to be resolved.
| Adam Wheeler | September 2025 |
| Technical Report on the Mineral Resources of the Nussir and Ulveryggen Projects | 117 |
14.1.2 Interpretation
The Nussir Cu-mineralized zone is an almost continuous layer over a strike length of 10 km, which is dolomite-dominated in the west and mostly calcite-dominated sandstone-limestone, along with medium dark schist with chalcocite/bornite dissemination, in the east. This mineralized zone is within the Gorohatjohca sedimentary formation, which predominantly consists of claystone, and is 200- 400m thick in the west, thinning out to a few metres wide in the east. The Gorohatjohca overlies the Stangvatn conglomerate formation and underlies the Nussir volcanic formation.
Interpretation of the mineralized zone was based primarily on a 0.3% Cu cut-off, along with the physical controls of the lithologies within the Gorohatjohca formation. Leapfrog Geo software (version 4.3.1 in 2018 and version 5.0.3 in 2019) was used in this interpretation work, creating wireframe models of the mineralized zone and the Gorohatjohca formation. In the western-most 3 km of the deposit, the mineralized layer is folded in an S-shaped macroscopic structure with the axial plane dipping moderately to the north-west.
There is a specific break in Cu mineralisation in the central part of the deposit, representing an effective ‘dry zone’ about 400m along strike length. It is situated along the southern flank of the major fold and is interpreted as a local extensional normal fault where the mineralized layers have been pulled apart. It has not been possible to model the continuation of this fault zone, and other faults between adjacent drillholes. This is due to lower number of drillholes in this area. In future work, it is recommended that more drilling is needed in this area, and corresponding analysis of any fault outlines from topographic data.
For subsequent resource modelling, the interpreted mineralized zones have in general been extrapolated a maximum distance of approximately 100 m, both laterally and down-dip, from the outer-most drillhole intersections. The drilling grid spacing used generally has been 200-250m, so this extrapolation distance is approximately half of the typical grid spacing. An extrapolation of 100 m - 250 m would seem a reasonable extent for consideration an exploration target category.
A horizontal section at 0 m elevation, of the eastern part of the deposit, is shown in Figure 14-1, showing the mineralized zone as well as the Gorohatjohca formation. Example sections of the same structures (with reference lines shown in Figure 14-1) are shown in Figure 14-2. A plan view of the mineralized zone is shown in Figure 14-3, with 3D views in Figure 14-4 and Figure 14-5.
Figure 14-1. Nussir Horizontal Section at 0mRL, with Lithological Interpretation
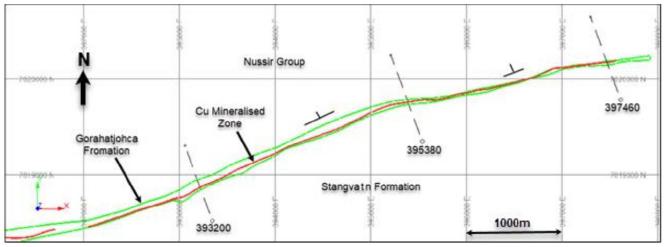
| Adam Wheeler | September 2025 |
| Technical Report on the Mineral Resources of the Nussir and Ulveryggen Projects | 118 |
Figure 14-2. Nussir Example Sections - Lithological Interpretation
[All sections looking westwards]
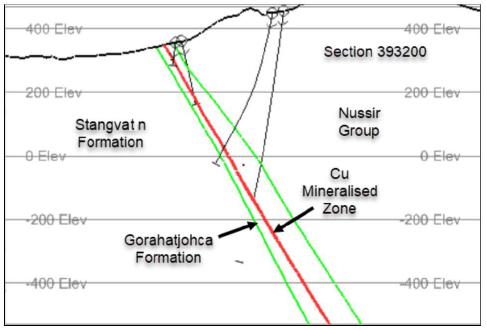
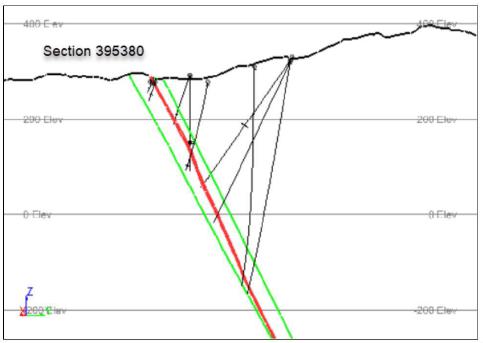
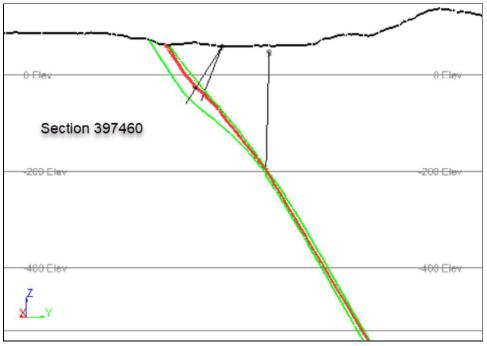
| Adam Wheeler | September 2025 |
| Technical Report on the Mineral Resources of the Nussir and Ulveryggen Projects | 119 |
Figure 14-3. Plan View of Drillholes and Interpretation Limits - Nussir
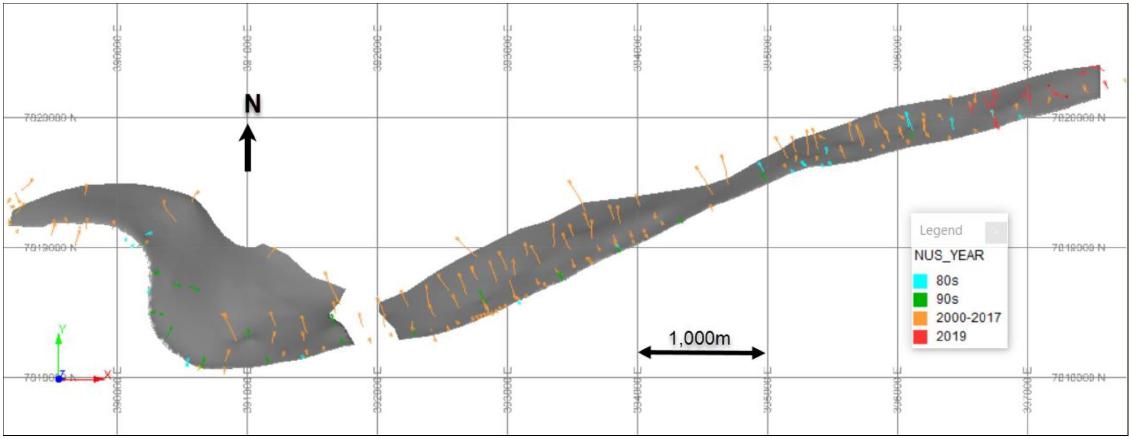
| Adam Wheeler | September 2025 |
| Technical Report on the Mineral Resources of the Nussir and Ulveryggen Projects | 120 |
Figure 14-4. 3D View of Nussir Mineralized Zones – East Side
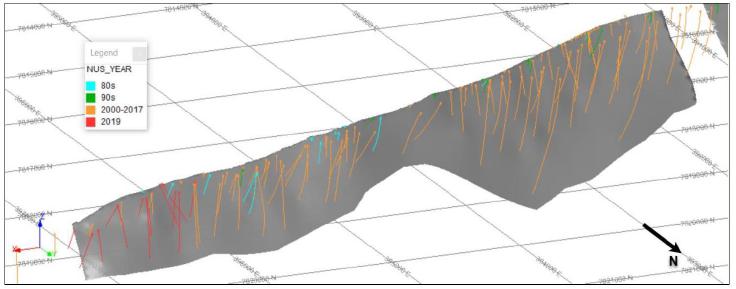
Figure 14-5. 3D View of Nussir Mineralized Zones – West Side
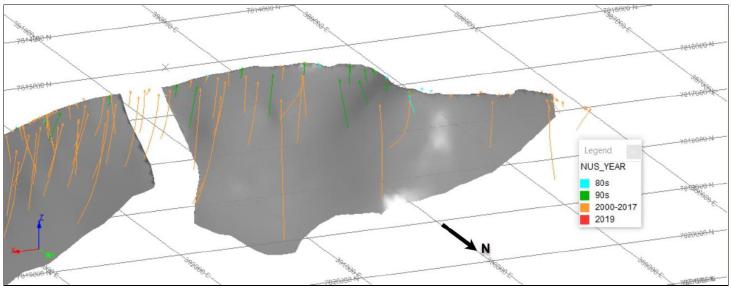
| Adam Wheeler | September 2025 |
| Technical Report on the Mineral Resources of the Nussir and Ulveryggen Projects | 121 |
14.1.3 Exploratory Data Analysis
Some intersections with grades lower than 0.3% Cu were also included in the mineralized interpretation for continuity purposes. Summary statistics were generated for all sample data, as well as just for the sample data inside the revised intersections, and are shown in Table 14-2. A histogram of original sample lengths is shown in Figure 14-8.
Table 14-2. Sample Statistics – Nussir
| Number | Log | Coefficient | |||||||||
| of | Number> | Standard | Estimate | of Variation | |||||||
| FIELD | Unit | Samples | Trace | Minimum | Maximum | Mean | Variance | Deviation | of Mean | % | |
| All | Cu | % | 2,947 | 2,693 | 0 | 9.44 | 0.36 | 0.51 | 0.71 | 2.44 | 198 |
| Samples | Ag | g/t | 2,947 | 1,147 | 0 | 146.5 | 4.1 | 103.5 | 10.2 | 12.8 | 249 |
| Au | g/t | 2,947 | 1,989 | 0 | 13.73 | 0.06 | 0.15 | 0.38 | 0.08 | 638 | |
| Pd | ppb | 2,947 | 1,736 | 0 | 5,800 | 20.3 | 19,394 | 139.3 | 16.8 | 685 | |
| Pt | ppb | 2,947 | 1,123 | 0 | 13,500 | 30.6 | 71,031 | 266.5 | 41.3 | 871 |
| Number | Log | Coefficient | |||||||||
| of | Number> | Standard | Estimate | of Variation | |||||||
| FIELD | Unit | Samples | Trace | Minimum | Maximum | Mean | Variance | Deviation | of Mean | % | |
| Within | Cu | % | 846 | 846 | 0.001 | 9.44 | 1.11 | 0.86 | 0.93 | 1.53 | 84 |
| Mineralized | Ag | g/t | 846 | 761 | 0 | 146.5 | 13.2 | 228.6 | 15.1 | 16.4 | 115 |
| Intersections | Au | g/t | 846 | 769 | 0 | 4.34 | 0.14 | 0.08 | 0.28 | 0.18 | 210 |
| Pd | ppb | 669 | 442 | 0 | 5,800 | 45.7 | 68,862 | 262.4 | 39.1 | 574 | |
| Pt | ppb | 669 | 217 | 0 | 13,500 | 72.2 | 284,970 | 533.8 | 214.7 | 740 |
The upper ‘All Sample’ section of the table relates to the overall extent of samples taken. The lower ‘Just Intersections’ part shows the main information for the samples inside the interpreted mineralized zones, which were processed onwards for resource estimation purposes. Log probability plots were also prepared for the intersection samples, are shown in Appendix A and Figure 14-6. For all of the metal grades, the populations are approaching log normal. For Cu grades, the lower 10% of samples, below 0.25% Cu, appear to have different characteristics. To also assist with the assessment of outlier grades, a coefficient of variation (cv) analysis was also made on the mineralized samples, along with decile analyses. The cv plots are shown overleaf, which demonstrates the top-cut levels selected, which were applied after compositing. A summary of the top-cut levels used, and the effects of these top-cut applications, is summarised in Table 14-3.
Table 14-3. Summary of Top-Cuts Applied – Nussir
| Proportion | |||||||
| Top-Cut | No. of | No . Cut | % Cut | Uncut | Cut | ||
| Metal | Unit | Level | Composites | Applied | Applied | Mean | Mean |
| Cu | % | 4.75 | 172 | - | 0.0 | 1.10 | 1.10 |
| Ag | g/t | 80 | 170 | - | 0.0 | 13.4 | 13.4 |
| Au | g/t | 1.5 | 164 | 1 | 0.6 | 0.15 | 0.15 |
| Pd | ppb | 700 | 124 | 1 | 0.8 | 64.6 | 59.4 |
| Pt | ppb | 1650 | 104 | 1 | 1.0 | 189.1 | 184.6 |
| Adam Wheeler | September 2025 |
| Technical Report on the Mineral Resources of the Nussir and Ulveryggen Projects | 122 |
Figure 14-6. Log-Probability Plots of Mineralized Zone Samples - Nussir
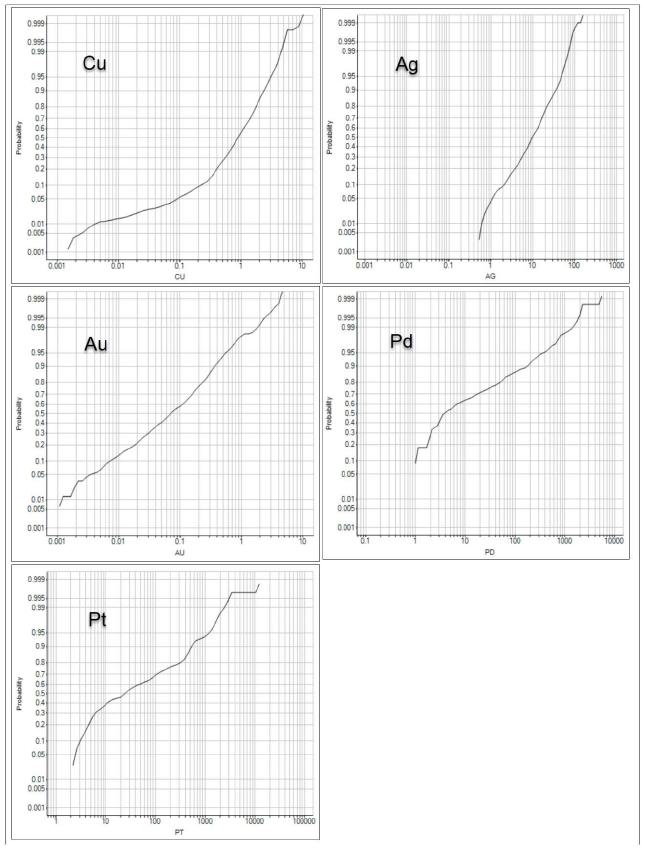
| Adam Wheeler | September 2025 |
| Technical Report on the Mineral Resources of the Nussir and Ulveryggen Projects | 123 |
Figure 14-7. Coefficient of Variation Analyses’ Graphs - Nussir
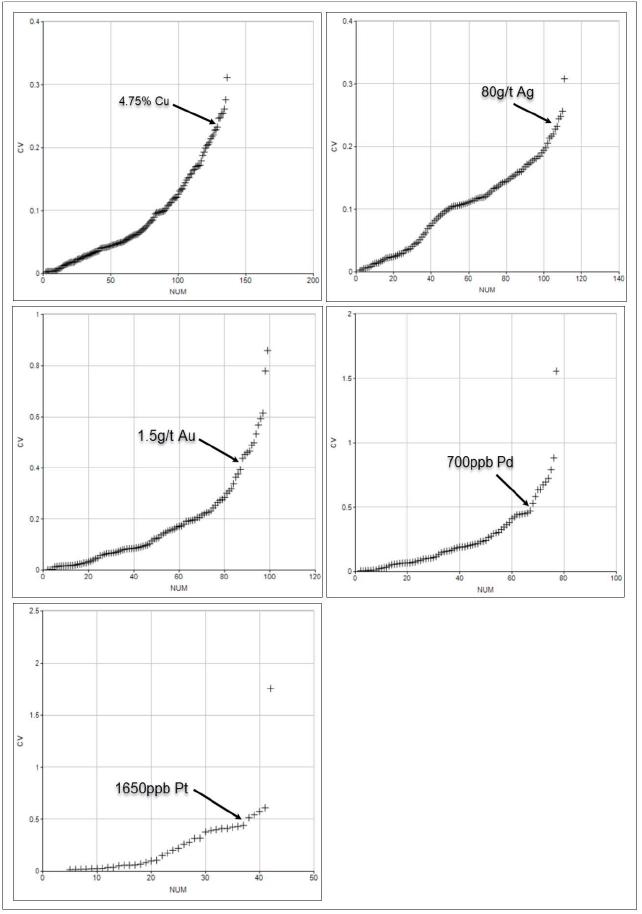
| Adam Wheeler | September 2025 |
| Technical Report on the Mineral Resources of the Nussir and Ulveryggen Projects | 124 |
Figure 14-8. Sample Length Histogram - Nussir
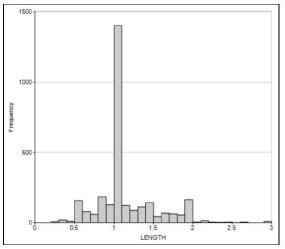
14.1.4 Compositing
Composites were created across each identified intersection. These composites were therefore of variable length. Statistics of the composite samples are summarised below in Table 14-4. True thickness values were also calculated for each intersection. The statistics summaries shown in Table 14-4 are shown for grade values directly, as well as grade values weighted by true thickness. The true thickness values have been calculated after generation of the composites and stored with the composites thereafter. This weighting has little effect on the calculated statistics. This is due to the relative uniform thickness of the mineralized zones, generally from 2 to 5 m. A histogram of all the composites’ true thickness values is shown in Figure 14-9.
Table 14-4. Composite Statistics – Nussir
| Number of | Number > | Standard | Log Estimate | Coefficient of | |||||||
| FIELD | Unit | Samples | Trace | Minimum | Maximum | Mean | Variance | Deviation | of Mean | Variation % | |
| Cu | % | 173 | 172 | 0.00 | 3.12 | 1.10 | 0.23 | 0.48 | 1.14 | 44 | |
| Ag | g/t | 173 | 170 | 0.0 | 52.5 | 13.4 | 92.8 | 9.6 | 15.0 | 72 | |
| Au | g/t | 173 | 164 | 0.00 | 1.50 | 0.15 | 0.03 | 0.16 | 0.15 | 111 | |
| Unweighted | Cu Accumulation | 173 | 172 | 0.00 | 13.94 | 3.82 | 5.81 | 2.41 | 4.15 | 63 | |
| Thickness m | 173 | 173 | 0.26 | 9.87 | 3.40 | 2.47 | 1.57 | 3.47 | 46 | ||
| Pd | ppb | 124 | 124 | 0.97 | 700 | 59.4 | 10,017 | 100.1 | 73.9 | 169 | |
| Pt | ppb | 104 | 104 | 2.19 | 1,650 | 184.6 | 80,754 | 284.2 | 273.4 | 154 | |
| Cu | % | 173 | 172 | 0.00 | 3.12 | 1.12 | 0.21 | 0.46 | 1.16 | 41 | |
| Ag | g/t | 173 | 170 | 0.0 | 52.5 | 13.6 | 91.6 | 9.6 | 15.1 | 70 | |
| Weighted | Au | g/t | 173 | 164 | 0.00 | 1.50 | 0.14 | 0.02 | 0.13 | 0.14 | 92 |
| By Length | Pd | ppb | 124 | 124 | 1.0 | 700 | 58.9 | 12,702 | 112.7 | 68.2 | 191 |
| Pt | ppb | 104 | 104 | 2.2 | 1,650 | 196.7 | 104,174 | 322.8 | 273.6 | 164 | |
Figure 14-9. Histogram of Composite True Thicknesses - Nussir
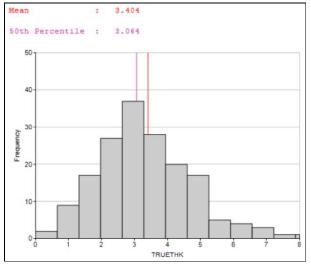
| Adam Wheeler | September 2025 |
| Technical Report on the Mineral Resources of the Nussir and Ulveryggen Projects | 125 |
14.1.5 Geostatistics
Statistical plots for the composite copper grades are shown in Figure 14-10. This also shows a scatterplot of composite grades versus true thickness, which demonstrates that there is no particular relationship between grade and thickness.
Figure 14-10. Statistical Cu Plots, Composites - Nussir
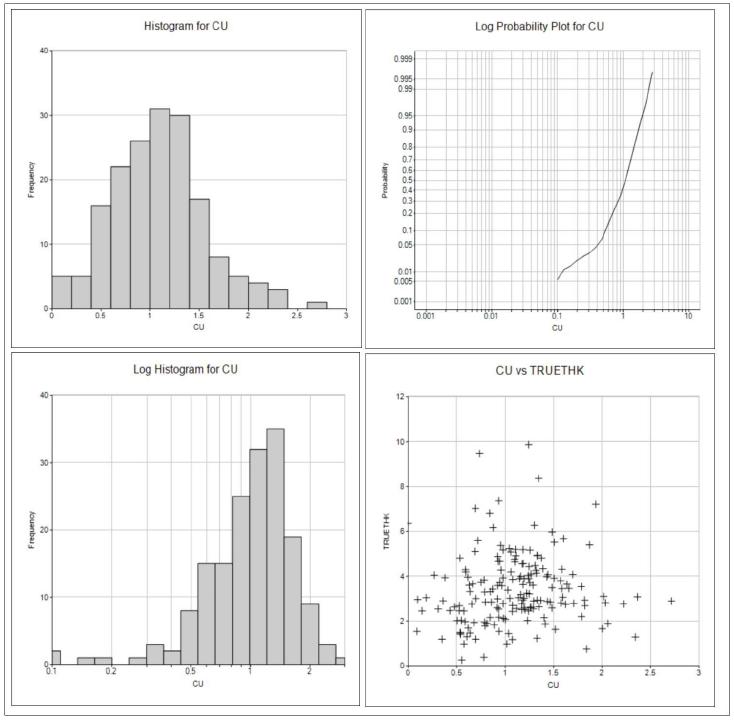
Histograms and log-probability plots for the other metals in the composites, Ag, Au, Pd and Pt, are shown in Figure 14-11. In all cases the approximately single log-normal populations are apparent.
| Adam Wheeler | September 2025 |
| Technical Report on the Mineral Resources of the Nussir and Ulveryggen Projects | 126 |
Figure 14-11. Histograms/ Log-Probability Plots- - Composites Au, Ag. Pd, Pt
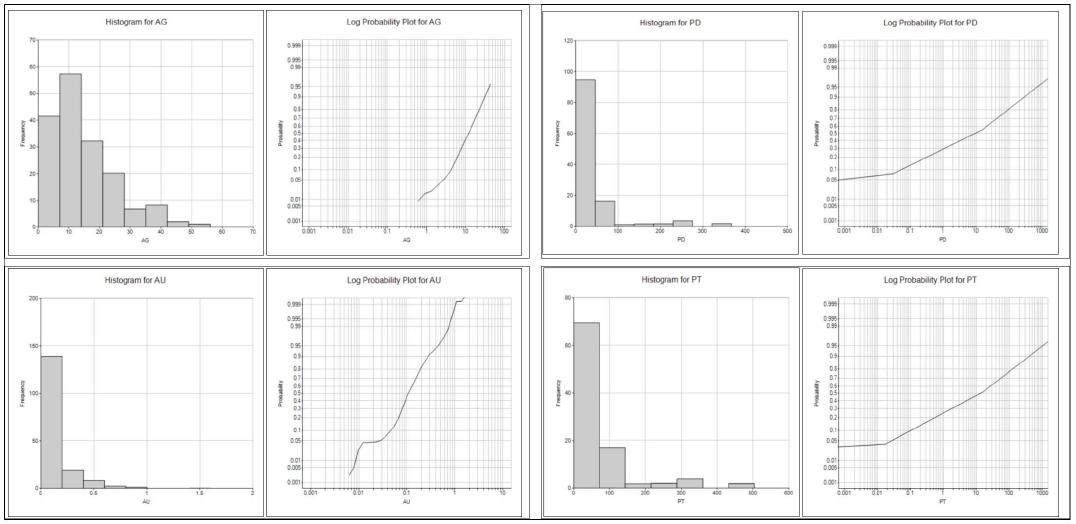
| Adam Wheeler | September 2025 |
| Technical Report on the Mineral Resources of the Nussir and Ulveryggen Projects | 127 |
The composites were used to generate experimental variograms for the composited metal grades, from which model variograms were developed, as shown in Figure 14-12. Most of the model variograms have a range of approximately 200 m. The model variogram parameters are summarised in Table 14-5. An isotropic model has been fitted in all cases, as this corresponded with the experimental variograms both along-strike and down-dip
Figure 14-12. Experimental and Model Variograms - Nussir
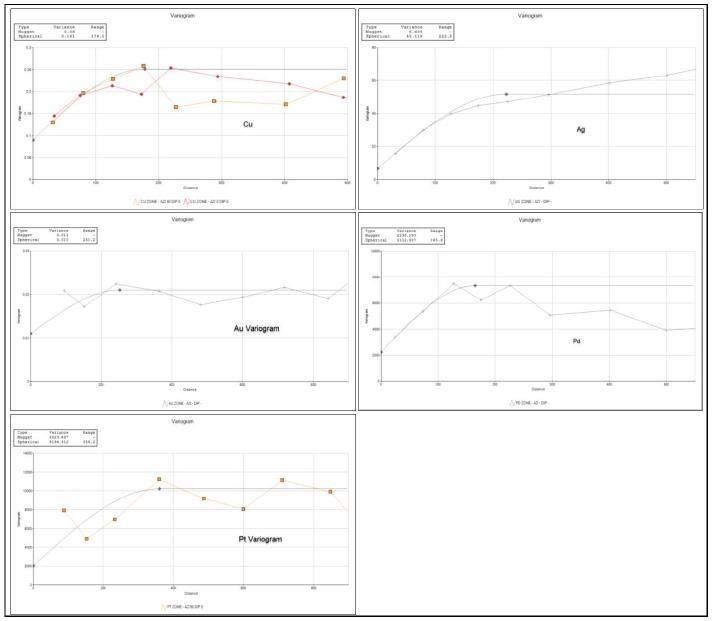
Table 14-5. Model Variogram Parameters – Nussir
| Field | Nugget | Range (m) | C1 |
| Cu | 0.09 | 177 | 0.161 |
| Ag | 6.6 | 223 | 45.1 |
| Au | 0.01 | 251 | 0.01 |
| Pd | 2,238 | 166 | 5,113 |
| Pt | 2,024 | 358 | 8,194 |
Notes
. All models isotropic
| Adam Wheeler | September 2025 |
| Technical Report on the Mineral Resources of the Nussir and Ulveryggen Projects | 128 |
14.1.6 Volumetric Modelling
The interpreted Leapfrog Geo (version 4.3.1 in 2018 and version 5.0.3 in 2019) wireframe models of the mineralized models have also been combined with the topography. The overall stratigraphic package has not been built into the block model. A plan, W-E long-sections and a three dimensional view are shown in Figure 14-14, Figure 14-15 and Figure 14-16, respectively.
Because of the overall folded nature of the deposit, three separate block models were used, each with separate rotated structures, as depicted with the model prototypes shown in Figure 14 -17. However, for evaluation purposes, three separate regions have been demarcated: western, central and eastern, as summarised below, and depicted in the plan shown in Figure 14 -13.
| a) | Western Region. West of 392,050mE. |
| b) | Central Region. This extends from 392,050mE to approximately 394,650mE. |
| c) | Eastern Region. East of 394,650mE. |
Figure 14-13. Plan of Evaluation Regions - Nussir
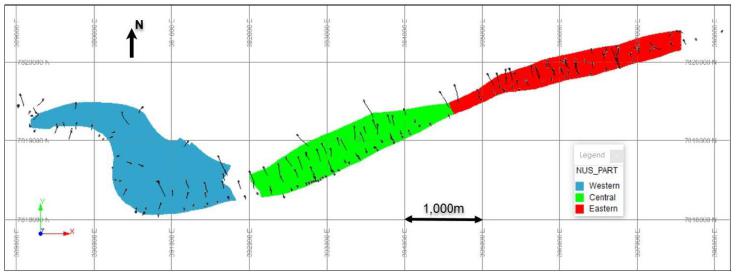
The wireframe models were used as the basis for filling the mineralized zones with blocks. A parent block size of 150m x 150m was used in the along-strike and down-dip directions. Across the true thickness of the zones, sub-blocks were used to provide single blocks across the mineralized zones at any point. The sub-blocks measured 5m along-strike, 5m down-dip and variable length across-strike, according to mineralisation thickness.
Details of these different model prototypes are shown in Table 14-6.
| Adam Wheeler | September 2025 |
| Technical Report on the Mineral Resources of the Nussir and Ulveryggen Projects | 129 |
Figure 14-14. Plan View of Mineralized Wireframe Model - Nussir
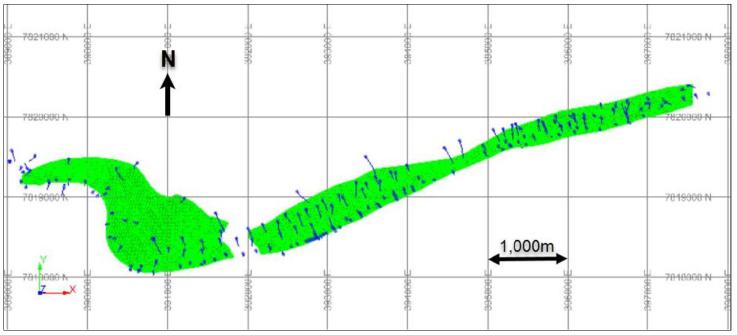
Figure 14-15. W-E Long Section of Wireframe Model - Nussir
[5:1 Vertical Exaggeration]
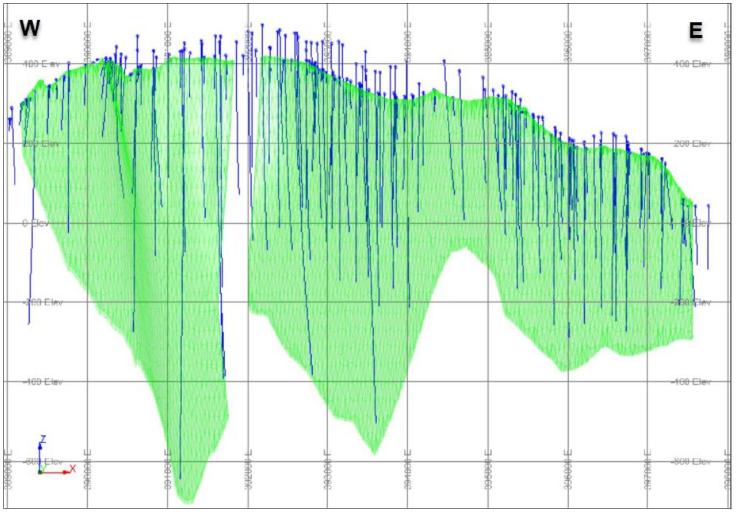
| Adam Wheeler | September 2025 |
| Technical Report on the Mineral Resources of the Nussir and Ulveryggen Projects | 130 |
Figure 14-16. 3D View of Wireframe Model – View from SW - Nussir
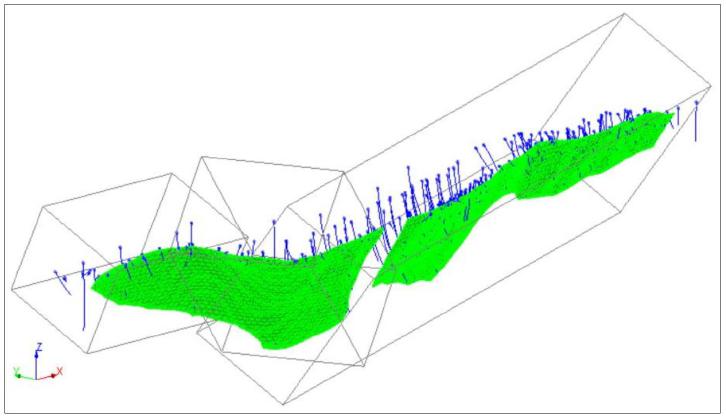
Figure 14-17. 3D View of Model Prototype Structures– View from SW - Nussir
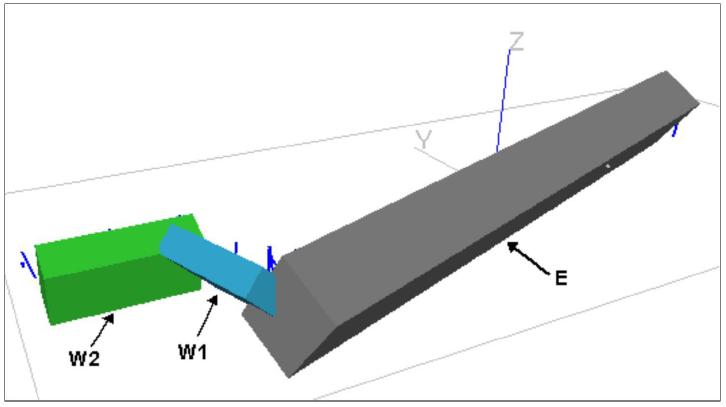
| Adam Wheeler | September 2025 |
| Technical Report on the Mineral Resources of the Nussir and Ulveryggen Projects | 131 |
Table 14-6. Model Prototype Definitions - Nussir
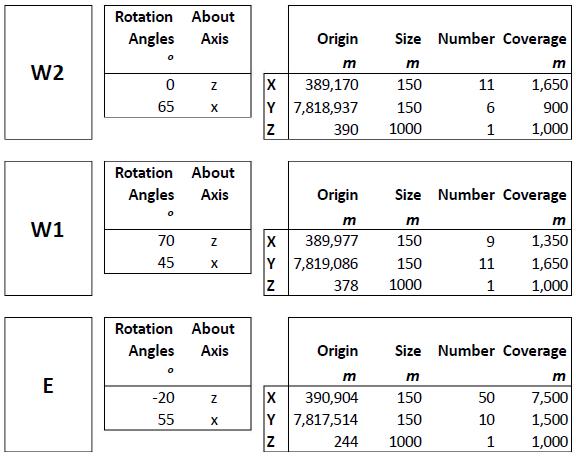
| Adam Wheeler | September 2025 |
| Technical Report on the Mineral Resources of the Nussir and Ulveryggen Projects | 132 |
14.1.7 Density
Density measurements from core samples were collated. A statistical summary of these measurements is shown in Table 14-7. Histograms displaying the density measurements by broad rock type, and by lithology, are shown in Figure 14-19 and Figure 14-20. There does not appear to be any major changes in density with lithology. A graph of Cu grade versus density values, for density measurements from the mineralized zone, is shown in Figure 14-18. There does not seem to be any clear relationship between density and Cu grade.
Figure 14-18. Grade vs Density Graph – Mineralized Zone Measurements - Nussir
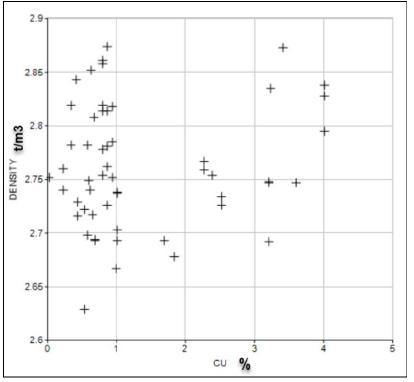
It was therefore decided to average density measurements over mineralized zone intersections and assign these to the mineralized zone composite set. A statistical summary of these composite density values is shown in Table 14-8.
Table 14-7. Statistical Summary of Density Measurements - Nussir
| DESCRIPTION | NUMBER | MINIMUM | MAXIMUM | MEAN | VARIANCE | STANDARD DEVIATION |
MEDIAN |
| Footwall | 27 | 2.66 | 2.87 | 2.71 | 0.0021 | 0.0457 | 2.71 |
| Hanging Wall | 33 | 2.66 | 3.02 | 2.79 | 0.0091 | 0.0953 | 2.77 |
| Mineralized Zone | 53 | 2.63 | 2.87 | 2.76 | 0.0034 | 0.0581 | 2.75 |
Table 14-8. Statistical Summary of Composite Densities - Nussir
| STANDARD | |||||||
| DESCRIPTION | NUMBER | MINIMUM | MAXIMUM | MEAN | VARIANCE | DEVIATION | MEDIAN |
| Mineralized Zone | 14 | 2.67 | 2.87 | 2.75 | 0.0029 | 0.0540 | 2.75 |
| Adam Wheeler | September 2025 |
| Technical Report on the Mineral Resources of the Nussir and Ulveryggen Projects | 133 |
Figure 14-19. Density Histograms by Rock Type - Nussir
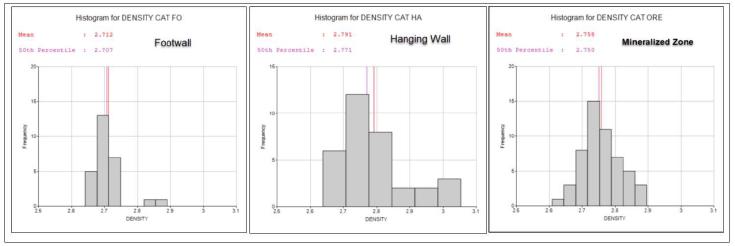
Figure 14-20. Density Histograms by Lithology - Nussir
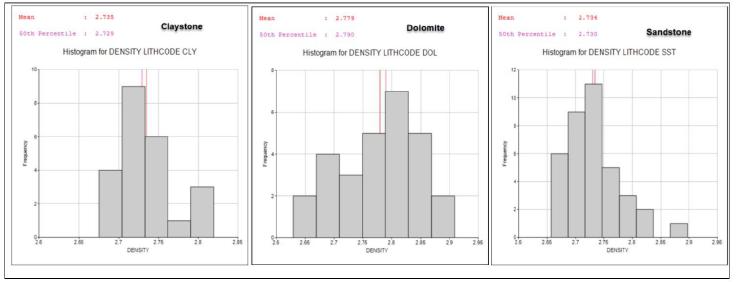
A 3D picture of the density composites is shown in Figure 14-21. It can be seen that these density measurements are all in the eastern part of the deposit. These composites were used to estimate density values into the resource model, using inverse-distance weighting. For model blocks where density composites are not nearby (over a distance of 450 m), an average density value of 2.76 t/m3 has been set.
Figure 14-21. 3D View of Density Measurement Locations - Nussir
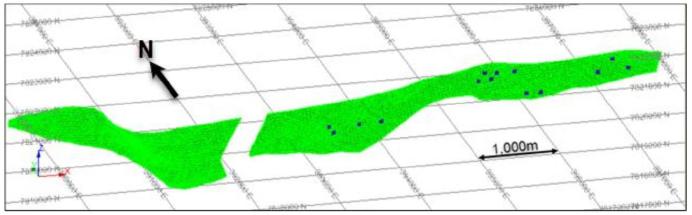
| Adam Wheeler | September 2025 |
| Technical Report on the Mineral Resources of the Nussir and Ulveryggen Projects | 134 |
14.1.8 Grade Estimation
Metal grades were estimated direct from the average grades of the intersection composites. The grade interpolation parameters applied are summarised below in Table 14-9. The primary grades were estimated using ordinary kriging (OK), using the variogram parameters shown in Table 14-5. For comparative purposes, copper grades were also interpolated by inverse-distance weighting and nearest-neighbour. Six progressively larger searches were made, so that if insufficient composites were found on the first search, the next larger search would be applied.
Table 14-9. Grade Estimation Parameters – Nussir
| Minimum No. | |||
| of | |||
| Search Distances (m) | Composites/ | ||
| Along-Strike | Down-Dip | Search | Drillholes |
| 125 | 125 | 1st | 3 |
| 225 | 225 | 2nd | 2 |
| 450 | 450 | 3rd | 2 |
| 500 | 500 | 4th | 1 |
| 750 | 750 | 5th | 1 |
| 1000 | 1000 | 6th | 1 |
Notes:
. Maximum number of composites/drillholes used = 12
. Cu, Ag, Au, Pd and Pt grades interpolated using ordinary kriging
. Check grades were also determined by NN and Inverse-Distance(^2)
. Density values estimated using inverse-distance weighting
. Estimations are done within plane of each zone, projected according to orientations:
| Dip | Direction | |
| West 1 | 45 | 70 |
| West 2 | 65 | 0 |
| East | 55 | -20 |
A 3D view of estimated Cu grades is shown in Figure 14-22. A long section depicting the variation of the estimated Cu grades are shown in Figure 14-23. Figure 14-24 shows a long section of the resource classification.
Figure 14-22. 3D View of Estimated Cu Grades - Nussir
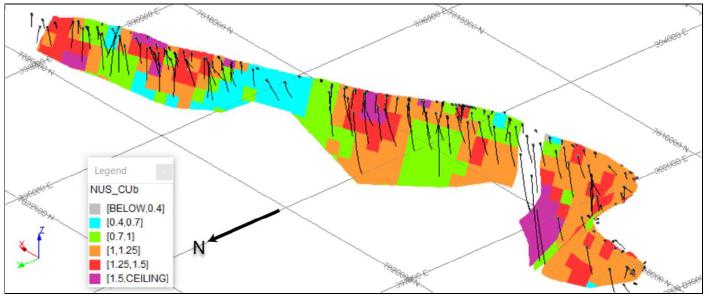
| Adam Wheeler | September 2025 |
| Technical Report on the Mineral Resources of the Nussir and Ulveryggen Projects | 135 |
Figure 14-23. Long Section of Modelled Cu Grades - Nussir
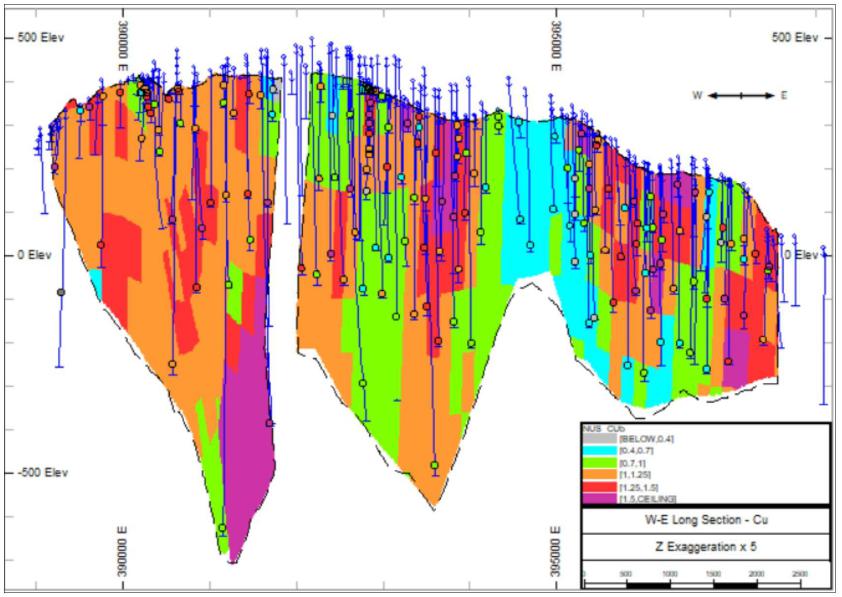
| Adam Wheeler | September 2025 |
| Technical Report on the Mineral Resources of the Nussir and Ulveryggen Projects | 136 |
Figure 14-24. Long Section of Resource Classification - Nussir
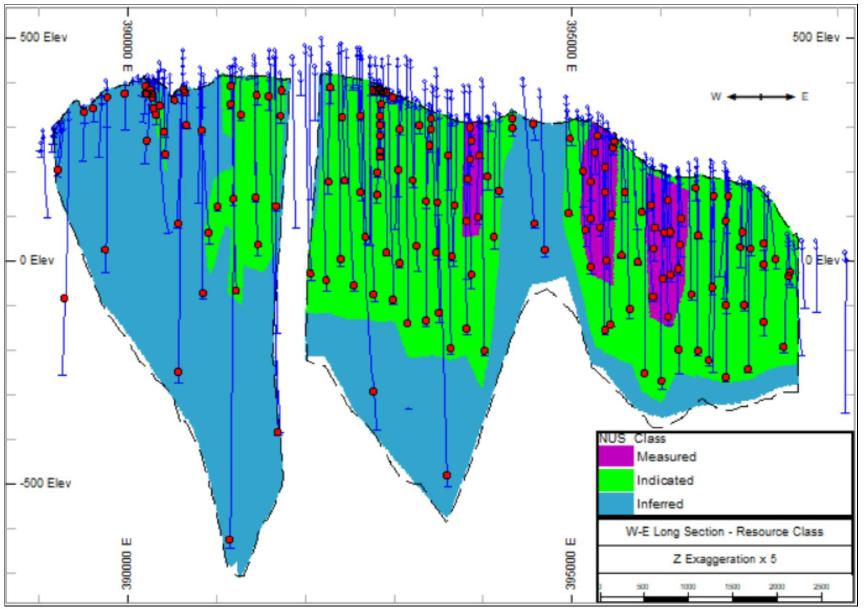
| Adam Wheeler | September 2025 |
| Technical Report on the Mineral Resources of the Nussir and Ulveryggen Projects | 137 |
14.1.9 Resource Classification
Definitions for resource categories used in this report are consistent with CIM (2014) definitions incorporated by reference into NI 43-101. In the CIM classification, a Mineral Resource is defined as “a concentration or occurrence of solid material of economic interest in or on the Earth’s crust in such form, grade or quality and quantity that there are reasonable prospects for eventual economic extraction. The location, quantity, grade or quality, continuity, and other geological characteristics of a Mineral Resource are known, estimated, or interpreted from specific geological evidence and knowledge, including sampling. Mineral Resources are classified into Measured, Indicated, and Inferred categories. A Mineral Reserve is defined as the “economically mineable part of a Measured and/or Indicated Mineral Resource” demonstrated by studies at pre-feasibility or feasibility level as appropriate. Mineral Reserves are classified into Proven and Probable categories.
In order to test resource classification criteria, a conditional simulation exercise was completed, which focussed on the precision of evaluation that may be obtained with different drillhole spacings, related to mining blocks containing more broadly equivalent to 3 months of production and 1 year of production. This analysis was completed with the following stages:
1. A panel was defined, in the eastern part of the Nussir deposit, with an assumed average thickness of 3m, and along-strike and down-dip dimensions of 245 m. These dimensions were selected, so that this block contains approximately 0.5 Mt of material, which is roughly equivalent to 3 months of production (based on an assumed production rate of 2 Mtpa). This was used to create a volumetric test model.
2. Based on all available drillholes in the same area, a grid of densely spaced pseudo-samples was generated, based on the same statistical parameters as the original distribution of actual samples. Using this data set, samples corresponding to any different theoretical drilling grids could be selected. In this way, different composite groups were created for drilling grids spaced at 25 m, 50 m, etc up to 500 m.
3. The complete composite set for the eastern part of Nussir was converted into normal score form, and used to provide experimental variograms, from which model variograms were determined, for Cu, Cu x Thickness (accumulation) and Thickness quantities. An example is shown in Figure 14-25.
4. A conditional simulation was then run using each of the different pseudo-drilling grid sets. The parameters used for these simulation runs included:
| a) | Sequential gaussian simulation. |
| b) | An internal point density of 5m x 5m inside the test area. |
| c) | 50 simulation runs were completed for each test. |
| d) | Normal transformed model variograms used. |
| e) | Horizontal search distances of 400m were used. |
| f) | Minimum/Maximum no. of composites = 2 / 20 |
5. For each conditional simulation run, and for each of the three variables, the distribution of overall average values was approximately normally distributed, as shown in the example in
| Adam Wheeler | September 2025 |
| Technical Report on the Mineral Resources of the Nussir and Ulveryggen Projects | 138 |
Figure 14-26. The standard deviation of these results was then used to calculate the relative error of the overall average grade, at the 90% probability level.
6. From these results, the relative errors at the 90% probability level were also determined for a block corresponding to approximately one year’s production.
A summary of these results is shown in Table 6-11. For the assessment of resource classification, it has been assumed that Measured Resources should be known within ±15%, with 90% confidence for a production quarter (3 months). Similarly, it has been assumed that Indicated Resources should be known within ±15%, with 90% confidence on an annual basis. This method of resource classification is gaining wide acceptance and has been applied to similar deposits as Nussir (e.g. Copperwood – AMEC).
| Adam Wheeler | September 2025 |
| Technical Report on the Mineral Resources of the Nussir and Ulveryggen Projects | 139 |
Figure 14-25. Normal Score Variogram for Cu - Nussir
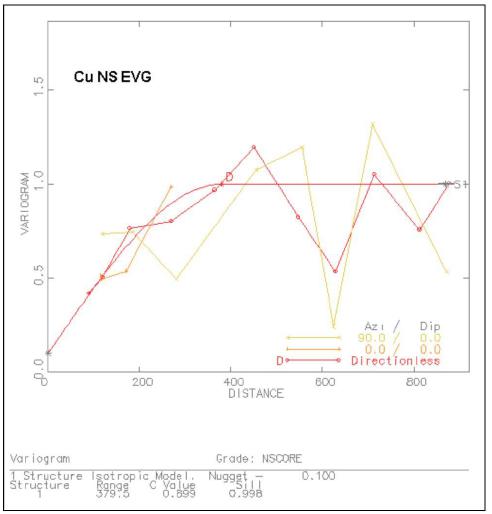
Figure 14-26. Example Histogram of Simulated Average Cu Grades
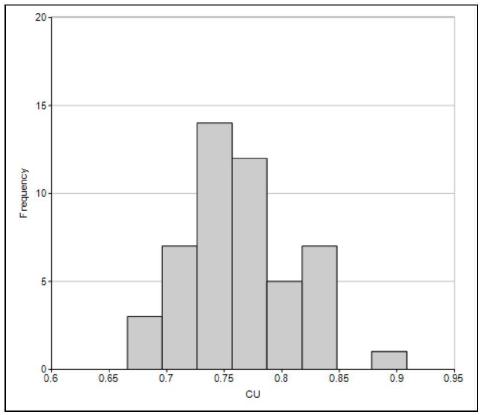
| Adam Wheeler | September 2025 |
| Technical Report on the Mineral Resources of the Nussir and Ulveryggen Projects | 140 |
Table 14-10. Conditional Simulation Results for Nussir
[3 Month and 1 Year Test Blocks]
| Results for Quarterly Mining Block(0.5 Mt) | ||||||||
| +/- | Relative | |||||||
| Tolerance | Error for | |||||||
| Drilling | at 90% | Annual | ||||||
| Grid | Probability | Relative | Block | |||||
| FIELD | Spacing | MEAN | STANDDEV | MINIMUM | MAXIMUM | Level | Error | (2Mt) |
| m | % | % | % | |||||
| CU | 25 | 0.99 | 0.02 | 0.93 | 1.03 | 0.03 | 3.5 | 1.7 |
| CU | 50 | 0.95 | 0.04 | 0.89 | 1.04 | 0.06 | 6.2 | 3.1 |
| CU | 75 | 1.03 | 0.07 | 0.86 | 1.19 | 0.11 | 11.1 | 5.5 |
| CU | 100 | 0.88 | 0.08 | 0.65 | 1.06 | 0.14 | 15.9 | 8.0 |
| CU | 125 | 0.98 | 0.10 | 0.67 | 1.20 | 0.16 | 16.5 | 8.3 |
| CU | 150 | 0.97 | 0.14 | 0.58 | 1.29 | 0.24 | 24.2 | 12.1 |
| CU | 175 | 1.13 | 0.15 | 0.70 | 1.46 | 0.25 | 21.9 | 10.9 |
| CU | 200 | 1.08 | 0.15 | 0.59 | 1.34 | 0.25 | 23.4 | 11.7 |
| CU | 225 | 0.88 | 0.15 | 0.51 | 1.17 | 0.24 | 27.1 | 13.6 |
| CU | 250 | 0.92 | 0.25 | 0.33 | 1.42 | 0.41 | 44.5 | 22.3 |
| CU | 275 | 0.98 | 0.20 | 0.48 | 1.40 | 0.32 | 33.0 | 16.5 |
| CU | 300 | 1.62 | 0.41 | 0.90 | 3.11 | 0.67 | 41.5 | 20.8 |
| CU | 325 | 1.09 | 0.28 | 0.38 | 1.83 | 0.45 | 41.5 | 20.7 |
| CU | 350 | 0.90 | 0.37 | 0.19 | 2.01 | 0.61 | 68.3 | 34.1 |
| CU | 375 | 0.92 | 0.33 | 0.23 | 1.90 | 0.54 | 59.2 | 29.6 |
| CU | 400 | 0.89 | 0.32 | 0.20 | 1.70 | 0.52 | 57.9 | 29.0 |
From the results produced for Nussir, as summarised in Table 14-11, the following conclusions have been developed with respect to resource classification:
Measured Resources. A drill grid spacing of 125m gives quarterly 90% confidence levels of ±16.5% for Cu grade.
Indicated Resources. A drill grid spacing of 225m gives annual 90% confidence levels of ±13.6% for Cu grade.
The applied resource classification criteria are summarised in Table 14-11. These categories were set into the resource block models based on perimeters defined in long section.
Table 14-11. Resource Classification Criteria - Nussir
| Category | Criteria |
| Measured | At least 3 drillholes with a spacing of at least 125m |
| Indicated | At least 3 drillholes with a spacing of at least 225m |
| Inferred | Greater grid spacings of 225m, max extrapolation of 100m |
Plan and 3D views depicting the resultant resource classifications are shown in Figure 14-27 and Figure 14-28. The areas allocated with a Measured resource category have been intersected with predominantly post-2000 diamond drilling. The parts of the block model allocated as Measured have used an average number of 5 drillholes for estimation. Those parts allocated as Indicated have used an average number of 4 drillholes for estimation.
| Adam Wheeler | September 2025 |
| Technical Report on the Mineral Resources of the Nussir and Ulveryggen Projects | 141 |
Figure 14-27. Resource Classification – Plan- Nussir
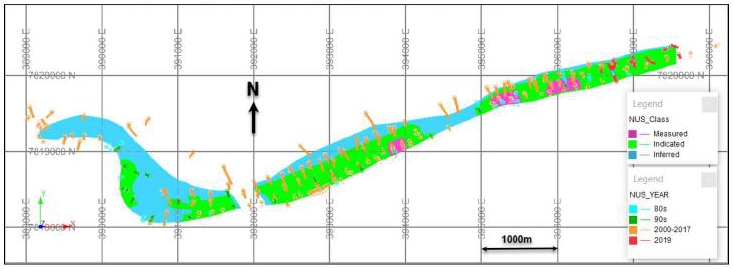
Figure 14-28. Resource Classification – 3D View from NE, With Drillholes – Nussir
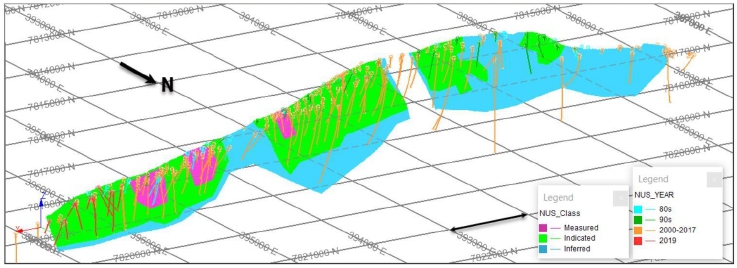
| Adam Wheeler | September 2025 |
| Technical Report on the Mineral Resources of the Nussir and Ulveryggen Projects | 142 |
14.1.10 Model Validation
Visual Examination
Long sections of the block model contents were prepared for the west and east zones. These were oriented to be approximately perpendicular to the respective zones. The models blocks shown were colour-coded, and overlain with the corresponding data from the drillhole composites.
Global Comparison of Grades
The overall average sample and composite metal grades were compared with global average grades from the block model, as interpolated by kriging, inverse-distance weighting and nearest neighbour. These results are summarised below in Table 14-12.
Table 14-12. Global Comparison of Grades – Nussir
| BLOCK MODEL | |||||||
| ZONE | FIELD | Unit | SAMPLES COMPOSITES | OK | NN | ID | |
| E | Cu | % | 1.12 | 1.12 | 1.16 | 1.19 | 1.17 |
| W1 | Cu | % | 1.17 | 1.17 | 1.13 | 1.09 | 1.12 |
| W2 | Cu | % | 1.20 | 1.07 | 1.16 | 1.22 | 1.18 |
| E | Ag | g/t | 13.7 | 12.2 | 19.9 | 20.3 | 20.1 |
| W1 | Ag | g/t | 21.9 | 21.4 | 11.8 | 11.2 | 11.5 |
| W2 | Ag | g/t | 17.8 | 15.2 | 13.9 | 13.5 | 14.2 |
| E | Au | g/t | 0.14 | 0.14 | 0.14 | 0.15 | 0.15 |
| W1 | Au | g/t | 0.11 | 0.10 | 0.14 | 0.14 | 0.14 |
| W2 | Au | g/t | 0.23 | 0.20 | 0.21 | 0.17 | 0.20 |
| E | Pd | ppb | 57.6 | 52.3 | 114.9 | 112.8 | 116.6 |
| W1 | Pd | ppb | 237.8 | 134.0 | 65.7 | 72.7 | 68.8 |
| W2 | Pd | ppb | 50.9 | 37.1 | 43.7 | 69.7 | 48.9 |
| E | Pt | ppb | 172.9 | 177.4 | 305.8 | 266.1 | 308.9 |
| W1 | Pt | ppb | 813.3 | 358.3 | 197.8 | 200.5 | 201.6 |
| W2 | Pt | ppb | 269.2 | 197.3 | 213.3 | 307.3 | 220.3 |
Notes
| . No cut-off applied | |||||||
| . Grades derived from all resource categories | |||||||
| . OK ordinary kriging | |||||||
| . NN nearest neighbour | |||||||
| . ID inverse-distance weighting (^2) | |||||||
| . ZONE IDs: | |||||||
| E | Main Eastern area | ||||||
| W1 | Main Western area | ||||||
| W2 | Western extension | ||||||
| Adam Wheeler | September 2025 |
| Technical Report on the Mineral Resources of the Nussir and Ulveryggen Projects | 143 |
Local Comparison of Grades
Average model grades along vertical columnar (200 m thick) model block slices were determined, stemming from the kriged, inverse-distance and nearest neighbour grades. These were shown, along with the average composites’ grades and total tonnages on the same slices, in comparative swath plots for all estimated metal grades, as shown in Figure 14-29. The models’ grades shown are for both all resource categories. These graphs show some degree of smoothing, but in general reflect well the trends in the corresponding average composite grades.
From this analysis it was decided to use the kriged grades as the principal estimated grades for all metals in the resource estimation.
Figure 14-29. Swath Plots - Nussir
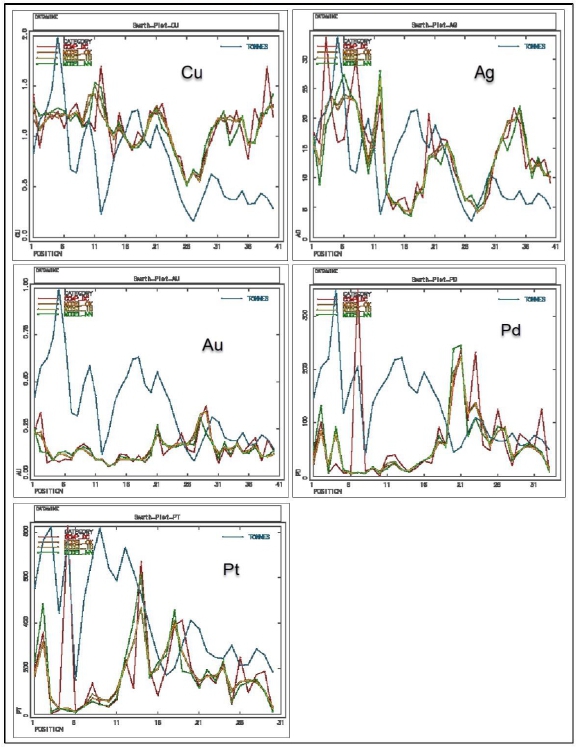
| Adam Wheeler | September 2025 |
| Technical Report on the Mineral Resources of the Nussir and Ulveryggen Projects | 144 |
14.1.11 Resource Evaluation
For reporting purposes for a resource estimate connected with a potential underground mining operation, complying with ‘reasonable prospects of eventual economic extraction’ guidelines, the following steps were completed:
| 1) | Cut-Off. An economic cut-off grade was determined, applicable to underground mining at the Nussir deposit, as summarised in Table 14-15. |
| 2) | Minimum Mining Width. The prepared in-situ block model has columnar blocks representing the true width of the mineralised zones, as interpreted. These model blocks were processed, such any parts narrower than 2m were diluted up to 2m, reducing the grades accordingly. |
| 3) | Constraining Volumes. A mineable shape optimisation was run (Datamine process MSO), to generate reasonably practical constraining wireframe volumes for a resource evaluation. The parameters used in this optimisation are summarised in Table 14-31. A long section of resultant constrained resources is shown in Figure 14-44. This applied selectivity means that a small amount of sub-0.3%Cu material is taken within the evaluation (‘must-take’) and some +0.3%Cu material is excluded. |
| 4) | Evaluation. The evaluation was broken down by resource class, as well as by west, central and eastern partitions, as depicted in Figure 14-31. The evaluation summary in Table 14-18 shows grades of Cu, Ag and Au. A grade-tonnage table of the measured and Indicated resources is shown in Table 14-17. A copper-equivalent (CuEq) grade has also been calculated, purely to provide extra information. The CuEq grade has been calculated based on the different assumed Cu, Ag and Au prices as well as average metallurgical recoveries from testwork, as shown in Table 14-15. Corresponding average true thickness values are shown in Table 14-14. |
Table 14-13. MSO Parameters – Nussir
| Factor | Unit | Value |
| Cut-Off | %Cu | 0.3 |
| Minimum width | m | 2 |
| Minimum length along -strike | m | 10 |
| Minimum length down-dip | m | 10 |
| Minimum waste pillar width | m | 10 |
| Surface crown pillar (excluded) | m | 15 |
Table 14-14. Average Resource True Thickness
[Derived from MSO Constrained Resources]
| Average True Thickness (m) | ||
| Region | Meas+Ind | Inferred |
| West | 4.2 | 6.1 |
| Central | 3.6 | 3.7 |
| East | 2.7 | 2.5 |
| Adam Wheeler | September 2025 |
| Technical Report on the Mineral Resources of the Nussir and Ulveryggen Projects | 145 |
| Table 14-15. Cut-Off Grade Calculation | ||||
| Values | ||||
| Cu Metal Price | 4.2 | $/lb | ||
| 9,259 | $/t | |||
| Processing | ||||
| Processing Recovery | 96.0% | |||
| Concentrate Grade | 45% | % Cu | ||
| Assumed Feed Grade | 0.83% | % Cu | ||
| Smelter Terms | ||||
| Minimum Deduction | ||||
| Treatment, Refining and Freight Charge | 87.5 | $/t conc | ||
| Concentrate ref | 0.0875 | |||
| Payability | 97.30% | |||
| Operating Costs | ||||
| Mining | 20 | $/t | ||
| G&A & infra & closure & royalty | 0.65 | $/t | ||
| Processing | 5.5 | $/t | ||
| Total | 26.15 | $/t | ||
| Total (excluding op devt) | 26.15 | $/t | ||
| Breakeven Cut-Off | 0.30 | %Cu | ||
| Table 14-16. Copper-Equivalent Calculations | |||||
| Unit | Values | ||||
| Prices | |||||
| Cu Price | $/lb | 4.2 | |||
| $/t | Cu_Price | 9259 | |||
| Ag Price | $/oz | 27.00 | |||
| $/g | Ag_price | 0.868 | |||
| Au Price | $/oz | 2,200 | |||
| $/g | Au_Price | 70.73 | |||
| Processing | |||||
| Cu Processing Recovery | Cu_Recov | 96.0% | |||
| Ag Processing Recovery | Ag_Recov | 80.0% | |||
| Au Processing Recovery | Au_Recov | 93.0% | |||
| Cu Equiv Coefficients - Price and Recovery | |||||
| Per g/t Ag | Ag_Coeff | 0.00781 | = Ag_Price*Ag_Recov/(Cu_Price*Cu_Recov) | ||
| Per g/t Au | Au_Coeff | 0.740 | = Au_Price*Au_Recov/(Cu_Price*Cu_Recov) | ||
| Test Calculations - Based on M&I Resource Grades | |||||
| % | Cu Grade | 1.01 | |||
| g/t | Ag Grade | 12.30 | |||
| g/t | Au Grade | 0.12 | |||
| % | Cu_Eq | 1.19 | = Cu_Grade + (Ag_Coeff*Ag_Grade) + (Au_Coeff*Au_Grade) | ||
| Adam Wheeler | September 2025 |
| Technical Report on the Mineral Resources of the Nussir and Ulveryggen Projects | 146 |
Table 14-17. Grade-Tonnage Table – Measured and Indicated Resources Only
| Cu Cut-Off | Tonnes | Cu | Ag | Au | 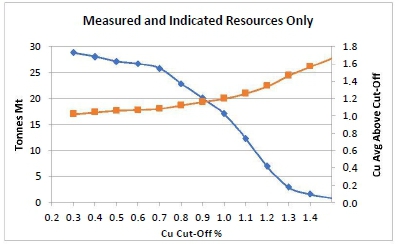 |
| % | Mt | % | g/t | g/t | |
| 0.3 | 28.72 | 1.0 | 12.33 | 0.12 | |
| 0.4 | 28.03 | 1.04 | 12.61 | 0.12 | |
| 0.5 | 27.12 | 1.06 | 12.90 | 0.11 | |
| 0.6 | 26.64 | 1.07 | 13.02 | 0.11 | |
| 0.7 | 25.75 | 1.08 | 13.20 | 0.11 | |
| 0.8 | 22.83 | 1.12 | 14.08 | 0.11 | |
| 0.9 | 20.01 | 1.16 | 14.92 | 0.12 | |
| 1.0 | 17.01 | 1.20 | 15.47 | 0.12 | |
| 1.1 | 12.30 | 1.26 | 16.28 | 0.12 | |
| 1.2 | 6.91 | 1.34 | 17.01 | 0.13 | |
| 1.3 | 2.93 | 1.46 | 18.61 | 0.12 | |
| 1.4 | 1.62 | 1.57 | 20.01 | 0.12 | |
| 1.5 | 0.86 | 1.67 | 23.08 | 0.11 |
| Adam Wheeler | September 2025 |
| Technical Report on the Mineral Resources of the Nussir and Ulveryggen Projects | 147 |
Table 14-18. Constrained Resource Evaluation Statement – Nussir deposit
Effective Date: 20th January, 2025
| Measured Resources | Indicated Resources | Measured + Indicated Resources | |||||||||||||
| Region | Tonnes | Cu | Ag | Au | Cu Eq | Tonnes | Cu | Ag | Au | Cu Eq | Tonnes | Cu | Ag | Au | Cu Eq |
| Mt | % | g/t | g/t | % | Mt | % | g/t | g/t | % | Mt | % | g/t | g/t | % | |
| West | 5.52 | 1.03 | 19.6 | 0.10 | 1.25 | 5.52 | 1.03 | 19.6 | 0.10 | 1.25 | |||||
| Central | 0.59 | 1.44 | 15.6 | 0.10 | 1.64 | 12.84 | 1.03 | 9.4 | 0.10 | 1.18 | 13.43 | 1.05 | 9.7 | 0.10 | 1.20 |
| East | 2.10 | 0.98 | 12.0 | 0.20 | 1.22 | 7.68 | 0.97 | 11.9 | 0.13 | 1.16 | 9.77 | 0.97 | 11.9 | 0.15 | 1.17 |
| TOTAL | 2.69 | 1.08 | 12.8 | 0.18 | 1.31 | 26.03 | 1.01 | 12.3 | 0.11 | 1.19 | 28.72 | 1.02 | 12.3 | 0.12 | 1.20 |
| Inferred Resources | ||||||
| Region | Tonnes | Cu | Ag | Au | Cu Eq | |
| Mt | % | g/t | g/t | % | ||
| West | 22.45 | 1.07 | 17.4 | 0.13 | 1.31 | |
| Central | 7.95 | 0.93 | 8.1 | 0.14 | 1.10 | |
| East | 1.59 | 0.60 | 6.5 | 0.17 | 0.78 | |
| TOTAL | 31.99 | 1.01 | 14.6 | 0.14 | 1.23 | |
Notes:
| 1 . | CIM definitions were followed for MRE. |
| 2 . | A minimum mining width of 2.0 m was applied in making the MRE constraint wireframes. These wireframes were generated using a preliminary MSO. |
| 3 . | Density values for Nussir were estimated from density sample values or assigned default average values where insufficient samples occur nearby. |
| 4 . | MRE constraint wireframes were generated for a cut-off grade of 0.30%Cu, related to potential underground mining. |
| 5 . | Metal prices assumed for this MRE were US$4.20/lb Cu, US$27.00/Oz Ag and US$2,200oz Au, which represent reasonable long-term consensus metal pricing. |
| 6 . | Metallurgy recovery assumptions were 96% Cu, 80% Ag and 93% Au, which stem from SGS metallurgical testwork completed in 2022. |
| 7 . | The cut-off grade of 0.30% Cu was derived from the price and recovery values above, as well as a smelter payability of 97.3% and an assumed total operating cost $26.20/t of ore. |
| 8 . | Rounding may result in apparent summation differences between tonnes, grades and metal content; not considered material. |
| 9 . | Mineral Resources are not Mineral Reserves and do not have demonstrated economic viability. |
| Adam Wheeler | September 2025 |
| Technical Report on the Mineral Resources of the Nussir and Ulveryggen Projects | 148 |
Figure 14-30. Constrained Resource Evaluation Long Section – Nussir (looking north)
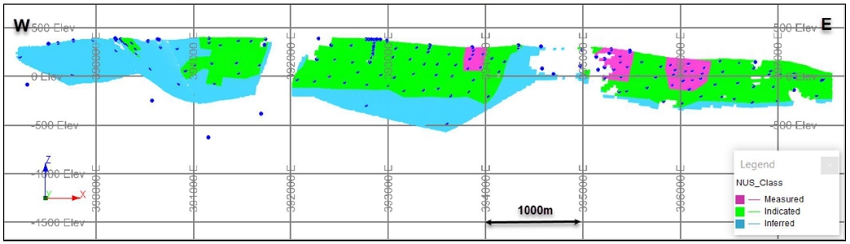
Figure 14-31. Long Section - Resource Model Partitions – Nussir (looking north)
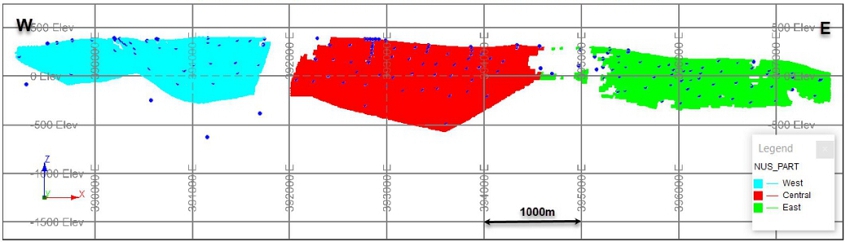
| Adam Wheeler | September 2025 |
| Technical Report on the Mineral Resources of the Nussir and Ulveryggen Projects | 149 |
14.2 Ulveryggen
14.2.1 Data Collation
The sample database has been updated by a Norwegian geologist, culminating in a single updated Excel workbook, with separate sheets for:
| · | Collar coordinates. As compared with previous estimates, all coordinates have been updated for the UTM system, WGS84, zone 35. All the drillhole collars from 1985 to 2008 were measured by DPOS GPS, with an accuracy of 0.2-0.5m. Drillhole collars from the 2014 and 2017 campaigns have been measured by CPOS by Geonord. |
| · | Downhole Survey data. A Deviflex instrument has been used which used lasers and gravitation, where the azimuth Is dependent on the first assumed azimuth. A Devishot instrument has also been used, which is a magnetic instrument. |
| · | Assay Results. Grades of Cu, re-assayed Cu (where measured), Ag, Au, re-assayed Au, |
| · | Lithology Logs. These include logged codes lithology, mineralisation and alteration. |
| · | Geotechnical Logs. These include RQD and Q values. |
| · | Magnetization Logs. |
After import of these data sets into Datamine, the different assay, collars and survey data files were combined and then ‘de-surveyed’ to obtain the complete three-dimensional coordinates of each sample. A summary of all processed sample data is shown in Table 14-19.
Table 14-19. Sample Data Summary - Ulveryggen
| Sample Type | YEAR | Holes/ Trenches |
Length (m) | Avg. Length/ Hole (m) |
Cu Samples |
| pre-2010 | 83 | 11,141 | 134 | 3,988 | |
| Surface | |||||
| Drillholes | 2014 | 1 | 412 | 412 | 24 |
| 2017 | 7 | 967 | 138 | 88 | |
| Sub-total | 91 | 12,520 | 138 | 4,100 | |
| pre-2010 | 22 | 2,754 | 125 | 325 | |
| U/g Drillholes | 2010 | 21 | 1,464 | 70 | 455 |
| Sub-total | 43 | 4,219 | 98 | 780 | |
| Surface | |||||
| trenches | pre-2010 | 51 | 1,421 | 28 | 116 |
| Total | 185 | 18,159 | 98 | 4,996 |
| Adam Wheeler | September 2025 |
| Technical Report on the Mineral Resources of the Nussir and Ulveryggen Projects | 150 |
In the process of this data collation, the following validation steps were taken, which enabled some few small transcription errors in assay and survey data to be resolved.
| a) | Range checks |
| b) | Sequential FROM-TO checks |
| c) | Visual examination |
| d) | Cross-referencing previous data and reports |
14.2.2 Interpretation
Discussions with Nussir geologists, as well considerations of potential economic grades, led to the use of 0.3%Cu cut-off in the re-interpretation of overall mineralized zone limits. This was applied in the interpretation of zone limits on 36 different profiles. Most of these profiles were spaced approximately 40m apart, with a small number of other profiles spaced at either 20m or 15m apart.
Internal waste zones were created during the generation of the resource block model by projecting these zones directly from <0.3% intersections, which essentially reflect the gaps between shear-hosted mineralisation. An example of the resultant interpretation is shown in the example below in Figure 14-32, for Section 20.
Figure 14-32. Example Interpretation of Ulveryggen Mineralized Zones – Section 20
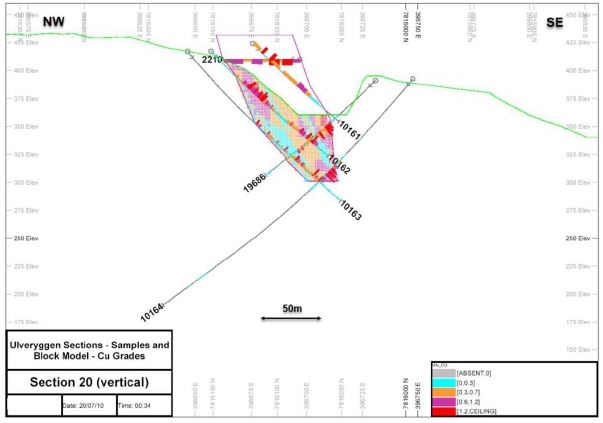
Most of the interpreted outer envelopes were linked together to form three-dimensional wireframe models. In some cases where the zones were not continuous, the individual perimeters were used directly during the modelling process. Six different physical zones were identified, as shown in a plan, long section and a 3D view in Figure 14-33 - Figure 14-35.
| Adam Wheeler | September 2025 |
| Technical Report on the Mineral Resources of the Nussir and Ulveryggen Projects | 151 |
Figure 14-33. Plan View of Interpreted Mineralized Zones – Ulveryggen
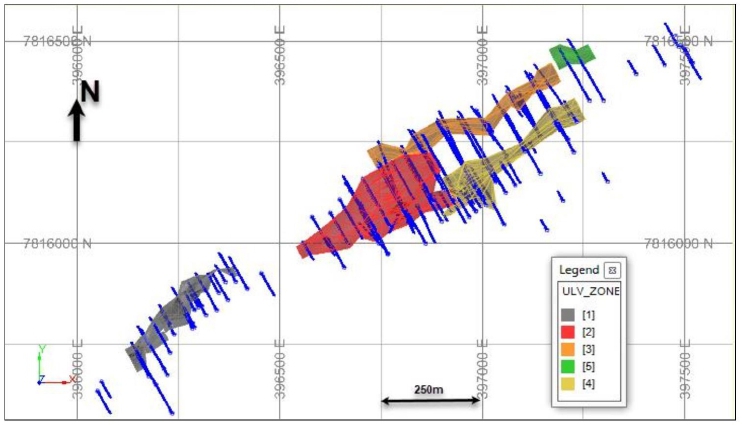
Figure 14-34. Long Section of Mineralized Zones - Ulveryggen
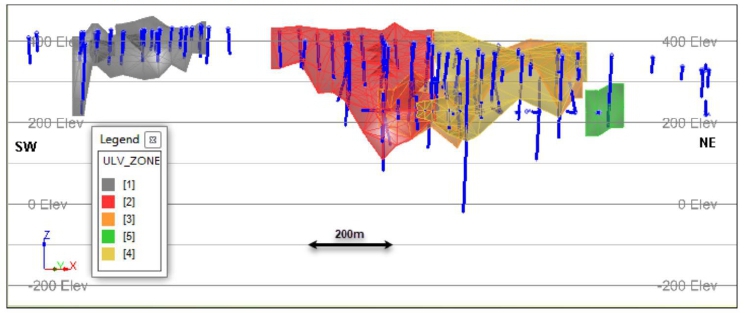
| Adam Wheeler | September 2025 |
| Technical Report on the Mineral Resources of the Nussir and Ulveryggen Projects | 152 |
Figure 14-35. 3D View of Mineralized Zones, Looking North-East - Ulveryggen
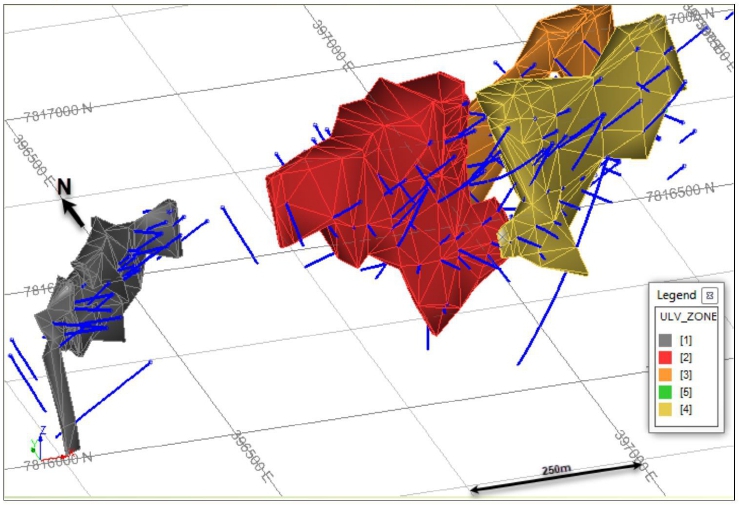
| Adam Wheeler | September 2025 |
| Technical Report on the Mineral Resources of the Nussir and Ulveryggen Projects | 153 |
14.2.3 Exploratory Data Processing
Sample Selection
The interpreted wireframe zones were used to create a selected sample set, which included all samples inside the interpreted structures. A breakdown of the whole selected sample set is shown in Table 14-20.
Table 14-20. Summary of Selected Samples - Ulveryggen
| Sample Type |
YEAR | Holes/ Trenches |
Length (m) |
Avg. Length/ Hole (m) |
Cu Samples |
| 2009 | 75 | 2,798 | 37 | 2,135 | |
| Surface | 2014 | 1 | 14 | 14 | 9 |
| Drillholes | |||||
| 2017 | 7 | 199 | 28 | 54 | |
| Sub-Total | 83 | 3,011 | 36 | 2,198 | |
| 2009 | 11 | 204 | 19 | 106 | |
| U/g | |||||
| Drillholes | 2010 | 19 | 432 | 23 | 254 |
| Sub-Total | 30 | 636 | 21 | 360 | |
| Surface | |||||
| Trenches | 2009 | 47 | 1,049 | 22 | 91 |
| Total | 160 | 4,696 | 29 | 2,649 |
The majority of these drillhole samples were 1m or less in length.
| Adam Wheeler | September 2025 |
| Technical Report on the Mineral Resources of the Nussir and Ulveryggen Projects | 154 |
Statistics
Summary statistics were generated for all selected sample data, as well as just for the sample data inside +0.3% Cu intersections, and are shown in Table 14-21.
Table 14-21. Cu Sample Statistics - Ulveryggen
| Number | Log | ||||||||
| of | Standard | Estimate | Coefficient | ||||||
| ZONE | Samples | Minimum | Maximum | Mean | Variance | Deviation | of Mean | of Variation | |
| All selected samples | All | 2,694 | 0.00 | 4.72 | 0.69 | 0.42 | 0.65 | 0.90 | 93.3 |
| 1 | 325 | 0.30 | 4.72 | 0.96 | 0.49 | 0.70 | 0.95 | 73.3 | |
| 2 | 755 | 0.30 | 4.00 | 0.90 | 0.34 | 0.58 | 0.89 | 64.8 | |
| Just | 3 | 94 | 0.30 | 2.95 | 0.74 | 0.22 | 0.47 | 0.73 | 63.7 |
| samples | 4 | 275 | 0.30 | 3.51 | 1.09 | 0.45 | 0.67 | 1.10 | 61.0 |
| >0.3% Cu | 5 | 13 | 0.32 | 1.58 | 0.74 | 0.17 | 0.42 | 0.73 | 56.5 |
| 6 | 94 | 0.32 | 2.79 | 1.09 | 0.43 | 0.66 | 1.09 | 60.5 | |
| All | 1,556 | 0.30 | 4.72 | 0.95 | 0.39 | 0.63 | 0.94 | 65.9 |
A log probability plots was prepared for all selected samples, as shown in Figure 14-36. This shows a marked break at around 0.2-0.3%Cu and so supports the use of 0.3%Cu for the separate modelling of internal waste. Otherwise, the grade population is approximately log normal. A decile analysis was also completed, as shown in Table 14-22, which does not indicate any outlier grade values.
Figure 14-36. Log Probability Plot of All Selected Samples - Ulveryggen
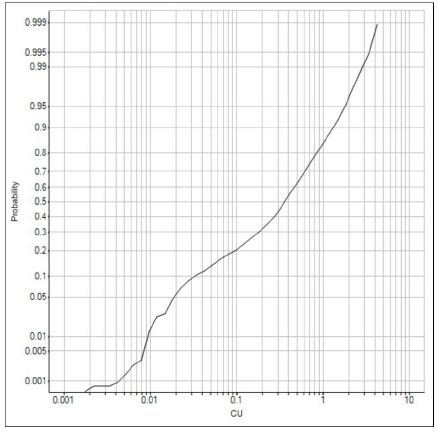
| Adam Wheeler | September 2025 |
| Technical Report on the Mineral Resources of the Nussir and Ulveryggen Projects | 155 |
Table 14-22. Decile Analysis of Selected Samples >0.3% Cu, - Ulveryggen
| DECILE | COUNT | CU | MIN | MAX | ACCUM | PERCENT |
| 0-10 | 156 | 0.32 | 0.30 | 0.35 | 69.0 | 2.6 |
| 10-20 | 156 | 0.37 | 0.35 | 0.39 | 73.0 | 2.7 |
| 20-20 | 156 | 0.42 | 0.39 | 0.46 | 124.7 | 4.6 |
| 30-40 | 156 | 0.50 | 0.46 | 0.54 | 95.4 | 3.5 |
| 40-50 | 156 | 0.59 | 0.54 | 0.64 | 164.7 | 6.1 |
| 50-60 | 156 | 0.70 | 0.64 | 0.75 | 238.0 | 8.8 |
| 60-70 | 156 | 0.85 | 0.76 | 0.94 | 182.4 | 6.8 |
| 70-80 | 156 | 1.07 | 0.94 | 1.22 | 379.2 | 14.1 |
| 80-90 | 156 | 1.46 | 1.22 | 1.70 | 511.8 | 19.0 |
| 90-100 | 152 | 2.18 | 1.70 | 4.72 | 854.8 | 31.7 |
| 90-91 | 16 | 1.74 | 1.70 | 1.80 | 28.6 | 1.1 |
| 91-92 | 16 | 1.83 | 1.80 | 1.89 | 87.3 | 3.2 |
| 92-93 | 16 | 1.93 | 1.89 | 1.95 | 96.9 | 3.6 |
| 93-94 | 16 | 1.98 | 1.96 | 2.03 | 109.0 | 4.0 |
| 94-95 | 16 | 2.05 | 2.03 | 2.15 | 223.0 | 8.3 |
| 95-96 | 16 | 2.24 | 2.16 | 2.33 | 48.9 | 1.8 |
| 96-97 | 16 | 2.43 | 2.36 | 2.51 | 100.4 | 3.7 |
| 97-98 | 16 | 2.75 | 2.51 | 2.88 | 69.5 | 2.6 |
| 98-99 | 16 | 3.21 | 2.89 | 3.51 | 54.9 | 2.0 |
| 99-100 | 8 | 4.04 | 3.55 | 4.72 | 36.3 | 1.3 |
| TOTAL | 1,556 | 0.95 | 2,693 | 100.0 |
| Adam Wheeler | September 2025 |
| Technical Report on the Mineral Resources of the Nussir and Ulveryggen Projects | 156 |
14.2.4 Compositing
The compositing procedure used may be outlined as follows:
| a) | All selected samples were first composited to 2.5 m. This composite length was applied slightly variable, to provide equal length composites across each intersection. |
| b) | These composites were then flagged as being either below or above 0.3%Cu. This demarcation was made for the modelling and separate grade handling of internal waste zones. |
The breakdown of composites by zone is shown in Table 14-23.
Table 14-23. Summary of 2.5m Composites - Ulveryggen
| ZONE | Waste <0.3% Cu |
Mineralised >=0.3% Cu |
| 1 | 88 | 178 |
| 2 | 402 | 577 |
| 3 | 36 | 87 |
| 4 | 115 | 221 |
| 5 | 11 | 7 |
| 6 | 21 | 125 |
| Total | 673 | 1,195 |
As discussed in Section 4.2, composites were created across each identified intersection, with a length of 2.5 m. Those composites with average Cu grade values below 0.3% were then flagged as internal waste and handled separately. Statistics of the composite samples are summarised in Table 14-24.
Table 14-24. Composite Statistics – Ulveryggen
| Log | |||||||||
| Standard | Estimate of | Coefficient | |||||||
| ZONE | Number | Minimum | Maximum | Mean | Variance | Deviation | Mean | of Variation | |
| All | <0.3% Cu | 496 | 0.00 | 0.30 | 0.10 | 0.01 | 0.10 | 0.18 | 95.2 |
| Composites | >=0.3% Cu | 1195 | 0.30 | 4.00 | 0.89 | 0.31 | 0.56 | 0.88 | 62.9 |
| 1 | 178 | 0.30 | 2.88 | 0.88 | 0.33 | 0.57 | 0.87 | 65.0 | |
| +0.3%Cu | 2 | 577 | 0.30 | 4.00 | 0.84 | 0.26 | 0.51 | 0.83 | 61.2 |
| Composites | 3 | 87 | 0.32 | 2.00 | 0.71 | 0.18 | 0.42 | 0.70 | 59.3 |
| By Zone | 4 | 221 | 0.31 | 2.87 | 1.02 | 0.38 | 0.62 | 1.02 | 61.0 |
| 5 | 7 | 0.32 | 1.22 | 0.62 | 0.09 | 0.29 | 0.62 | 47.1 | |
| 6 | 125 | 0.31 | 2.36 | 1.04 | 0.41 | 0.64 | 1.05 | 61.5 |
A log-probability plot of the composite data in the different zones is shown in Figure 14-37. Although there are some differences in populations (particularly zones 3 and 5, which have much fewer composites), the grade populations are quite similar.
| Adam Wheeler | September 2025 |
| Technical Report on the Mineral Resources of the Nussir and Ulveryggen Projects | 157 |
Figure 14-37. Log Probability Plot of +0.3%Cu Composites - Ulveryggen
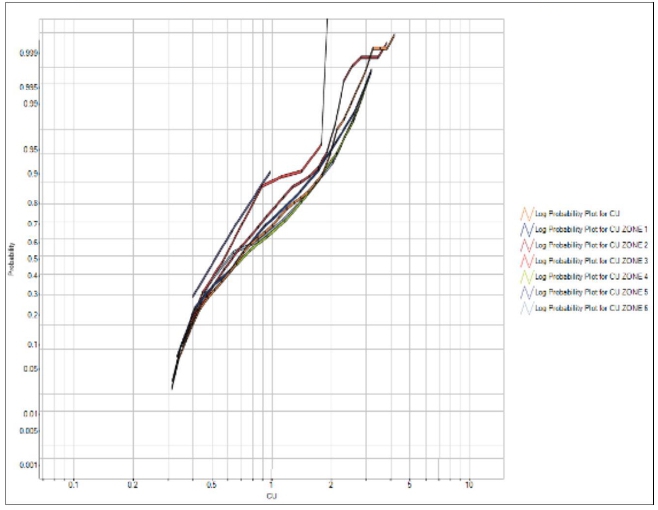
| Adam Wheeler | September 2025 |
| Technical Report on the Mineral Resources of the Nussir and Ulveryggen Projects | 158 |
14.2.5 Geostatistics
Owing to the similarity between copper grade distributions for the +0.3% Cu composites, experimental directional variograms were generated with the complete set of +0.3% Cu composites, and subsequently modelled, as shown in Figure 14-38.
Figure 14-38. Cu Variogram Models - Ulveryggen
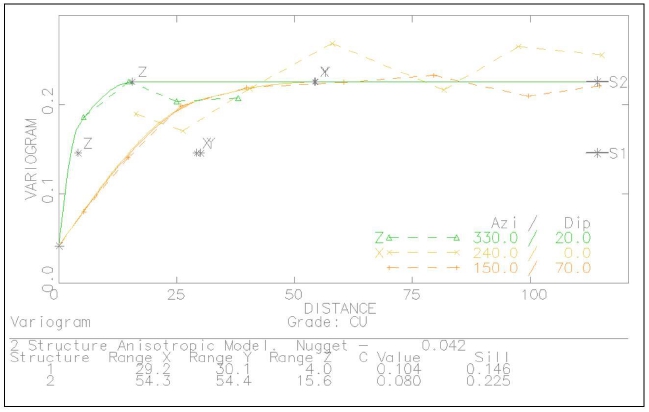
These variograms show a range along-strike and down-dip of approximately 50 m, with a much shorter range of influence cross-strike. This pairwise relative variogram model was subsequently used in setting up kriging and other model estimation parameters. The model variogram parameters are summarised below in Table 14-25.
Table 14-25. Model Variogram Parameters - Ulveryggen
| 1st Structure | 2nd Structure | |||||||
| NUGGET | Ranges | Ranges | ||||||
| Co | X | Y | Z | C1 | X | Y | Z | C2 |
| 0.042 | 29 | 30 | 4 | 0.104 | 54 | 54 | 16 | 0.080 |
Notes
. Rotation used of 150o about Z-axis, then 70o about X-axis
| Adam Wheeler | September 2025 |
| Technical Report on the Mineral Resources of the Nussir and Ulveryggen Projects | 159 |
14.2.6 Volumetric Modelling
The mineralized zone wireframes, and additional sectional perimeters, were used in the generation of a volumetric block model for the Ulveryggen deposit. The model prototype parameters used are summarised below in Table 14-26.
Table 14-26. Model Prototype - Ulveryggen
| Origin | Size (m) | Number | Range | |
| X | 396,069 | 10 | 179 | 1,790 |
| Y | 7,815,497 | 5 | 131 | 655 |
| Z | 58 | 10 | 47 | 470 |
Notes
. A model rotation of -30 degrees was use d about the z-axis, so that the rotated axes become:
| X | along-strike |
| Y | cross-strike |
| Z | down-dip |
. Sub-cells down to a minimum width of 2.5m were use d for modelling internal waste
14.2.7 Grade Estimation
During the modelling process, internal waste blocks were first generated from <0.3% Cu composites. The projection of internal waste, as well as subsequent grade interpolation, was also controlled by a set of centreline dip and strike strings, to allow for directional anisotropy within the deposit. Example vertical and horizontal sections, showing the resultant block model structure, are shown in Figure 14-39 and Figure 14-40.
| Adam Wheeler | September 2025 |
| Technical Report on the Mineral Resources of the Nussir and Ulveryggen Projects | 160 |
Figure 14-39. Example Vertical Section of Block Model Structure- Ulveryggen
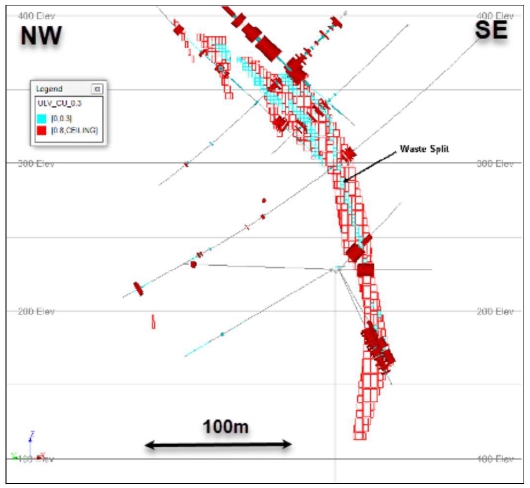
Figure 14-40. Example Horizontal Section of Block Model Structure – Ulveryggen
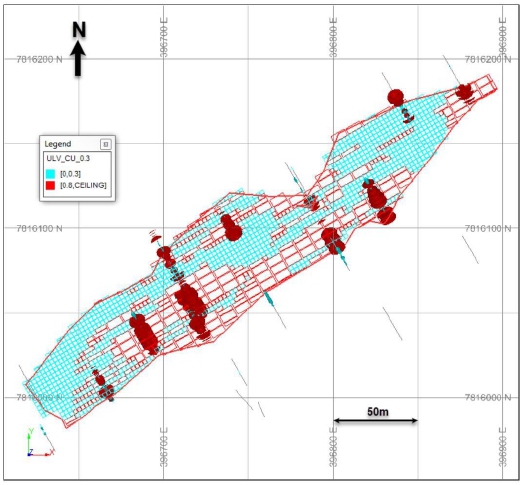
| Adam Wheeler | September 2025 |
| Technical Report on the Mineral Resources of the Nussir and Ulveryggen Projects | 161 |
Based on the model variograms generated, copper grades were interpolated using ordinary kriging. The internal waste demarcation of 0.3% Cu was used as a hard boundary – so only composites flagged as +0.3% Cu were used for grade estimation into the main +0.3% mineralized blocks. For comparative and validation purposes, copper grades were also interpolated by two other ways - inverse-distance weighting and nearest-neighbour. Three progressively larger searches were made, so that if insufficient composites were found on the first search, the next larger search would be applied, and so on. The search distances used stemmed from the model variograms – the first search was based on 2/3 of the variability of the model variogram, and then the next search was based on the variogram ranges. If blocks still had not encountered enough composites, a much larger search was made to try to ensure that all blocks modelled as mineralized did receive grades. The grade estimation parameters are summarised below in Table 14-27.
Table 14-27. Grade Estimation Parameters - Ulveryggen
| Search Distances (m) | Search | Minimum | ||
| Along-Strike | Down-Dip | Cross-Strike | Composites | |
| 20 | 20 | 5 | 1st | 5 |
| 50 | 50 | 12.5 | 2nd | 3 |
| 60 | 60 | 15 | 3rd | 1 |
Notes:
. Maximum number of composites used = 24
. All grades interpolated using ordinary kriging
. Alternative grades also determined by IPD(^2) and NN
. Zones' orientations modelling using directional anisotropy
| Adam Wheeler | September 2025 |
| Technical Report on the Mineral Resources of the Nussir and Ulveryggen Projects | 162 |
14.2.8 Density
20 density measurements were taken from core samples in six of the holes in the 2010 drilling campaigns. 42 density measurements were also taken from core samples in two of the holes in the 2017 drilling campaigns. Measurements were derived from dry core weights in air and then suspended in water. No wax was used.
These results are summarised in Table 14-28. A histogram of density results in mineralised samples is shown in Figure 14-41.
Table 14-28. Summary of Density Measurements - Ulveryggen
| Campaign | Type | Number of Samples |
Average Density t/m 3 |
Standard Deviation |
|
2010
|
Mineralised | 14 | 2.71 | 0.043 |
| Unmineralised | 6 | 2.69 | 0.014 | |
|
2017
|
Mineralised | 28 | 2.71 | 0.015 |
| Unmineralised | 14 | 2.70 | 0.022 |
Figure 14-41. Histogram of Densities – Mineralised Samples 2017 - Ulveryggen
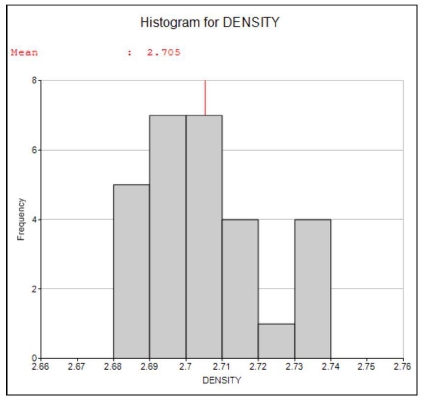
The average value for mineralised rock, 2.71 t/m3, was used as the global density value for subsequent evaluation purposes.
| Adam Wheeler | September 2025 |
| Technical Report on the Mineral Resources of the Nussir and Ulveryggen Projects | 163 |
14.2.9 Resource Classification
The resource classification system was also based predominantly on the variography results. The system applied is summarised below in Table 14-29.
Table 14-29. Resource Classification System - Ulveryggen
| Measured | At 5 composites, within a 20m x 20m x 5m search, from at least 3 drillholes or trench lines. |
| Indicated | At 5 composites, within a 50m x 50m x 12.5m search, from at least 3 drillholes or trench lines. |
| Inferred | Within delineated zones - max extrapolation of 60m. |
An example section of the applied resource classification system is shown in Figure 14-42.
Very little material has been drilled off sufficiently closely to be classified as measured, so all the resources in this case have been classified as either indicated or inferred.
| Adam Wheeler | September 2025 |
| Technical Report on the Mineral Resources of the Nussir and Ulveryggen Projects | 164 |
Figure 14-42. Example Block Model Section, Showing Resource Classes – Ulveryggen
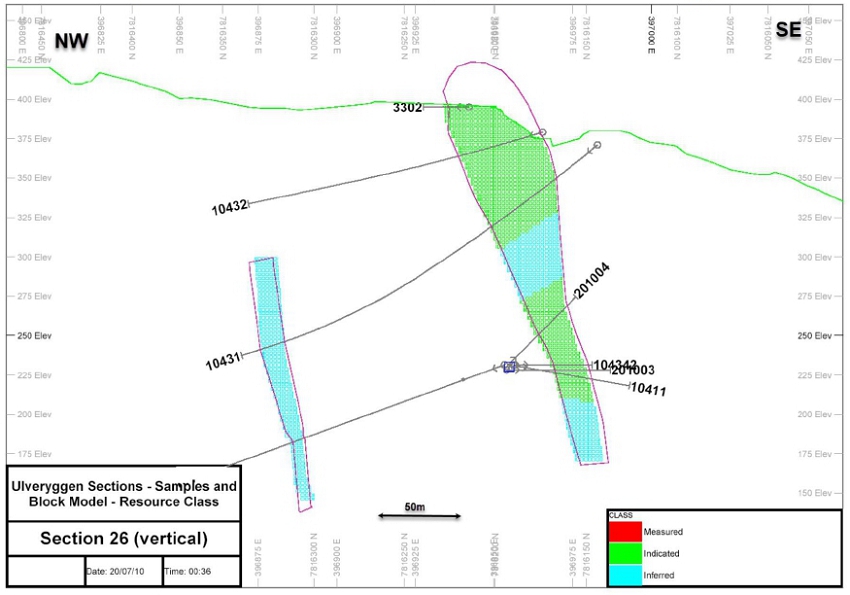
| Adam Wheeler | September 2025 |
| Technical Report on the Mineral Resources of the Nussir and Ulveryggen Projects | 165 |
14.2.10 Model Validation
Based on the block models generated, the following model validation steps were taken.
Visual Examination
Cross-sections through all the zones were generated, as shown in Appendix F. These compared the block model grades with the original sample grades, and in general compared well.
Global Comparison of Grades
The overall average sample and composite copper grades were compared with global average grades from the block model, as interpolated by kriging, inverse-distance weighting and nearest neighbour. These results are summarised below in Table 14-30. It can be seen that these results compare fairly well.
Table 14-30. Global Comparison of Cu Grades - Ulveryggen
| Block Model Average Grades | |||||
| Zone | Samples | Composites | OK | ID | NN |
| 1 | 0.96 | 0.88 | 0.89 | 0.86 | 0.90 |
| 2 | 0.90 | 0.84 | 0.71 | 0.70 | 0.71 |
| 3 | 0.74 | 0.71 | 0.67 | 0.67 | 0.68 |
| 4 | 1.09 | 1.02 | 0.89 | 0.84 | 0.88 |
| 5 | 0.74 | 0.62 | 0.64 | 0.65 | 0.64 |
| 6 | 1.09 | 1.04 | 0.81 | 0.79 | 0.81 |
Notes
. Evaluation restricted to +0.3% blocks/samples
. Block model evaluation - indicated + inferred
. OK ordinary kriging
. ID inverse distance weighting (^2)
. NN nearest neighbour
| Adam Wheeler | September 2025 |
| Technical Report on the Mineral Resources of the Nussir and Ulveryggen Projects | 166 |
Local Comparison of Grades
Average model grades along vertical columnar model block slices were determined, stemming from both the kriged and nearest neighbour grades. A comparative swath plot was then produced for copper, as shown in Figure 14-43. This shows that the kriged grades are smoothed within the extremes exhibited by the nearest neighbour grades, but in general all 3 grades show the same trends. All three grades are much closer together in the areas with the highest tonnages and more drilling.
From this analysis it was decided to use the kriged copper grade as the principal copper grade for the resource estimation.
Figure 14-43. Cu Swath Plot - Ulveryggen
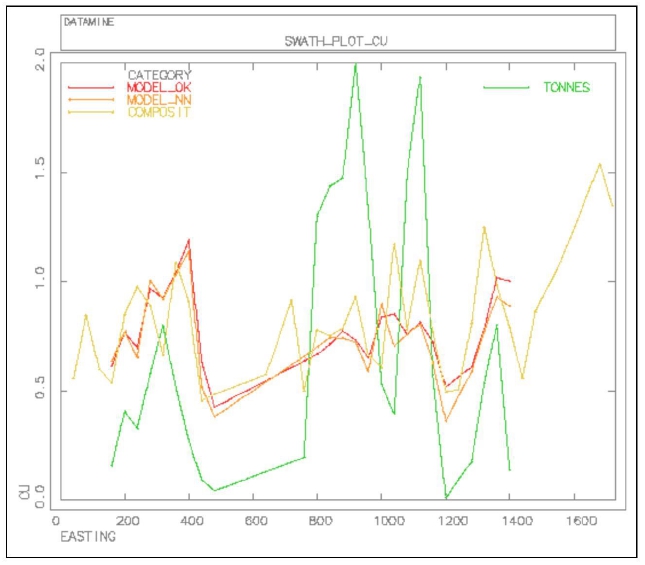
| Adam Wheeler | September 2025 |
| Technical Report on the Mineral Resources of the Nussir and Ulveryggen Projects | 167 |
14.2.11 Resource Evaluation
For reporting purposes for a resource estimate connected with a potential underground mining operation, and complying with ‘reasonable prospects of eventual economic extraction’ guidelines, the following steps were completed:
| 1) | Cut-Off. An economic cut-off grade was determined, applicable to underground mining at Nussir and Ulveryggen, as summarised in Table 14-15. |
| 2) | Constraining Volumes. A preliminary mineable shape optimisation was run (Datamine process MSO) to generate reasonably practical constraining wireframe volumes for a resource evaluation. The parameters used in this optimisation are summarised in Table 14-31. A 3D plot of the output constraining envelopes is shown in Figure 14-44. |
| 3) | Evaluation. The evaluation was broken down by resource class and zone, as shown in Table 14-32. A grade-tonnage table for the Indicated resources is shown in Table 14-33. Approximately 24% of the Indicated material, and 13% of the Inferred material, is within 15 m of the current pit and natural topography. Owing to the complex geometry of mineralised zones, true thickness values are not applicable and were therefore not calculated. |
Table 14-31. MSO Parameters - Ulveryggen
| Factor | Unit | Value |
| Cut-Off | %Cu | 0.3 |
| Minimum width | m | 3 |
| Minimum length along -strike | m | 10 |
| Minimum length down-dip | m | 10 |
| Minimum waste pillar width | m | 10 |
Figure 14-44. 3D Plot of MSO Stopes Shapes – Ulveryggen
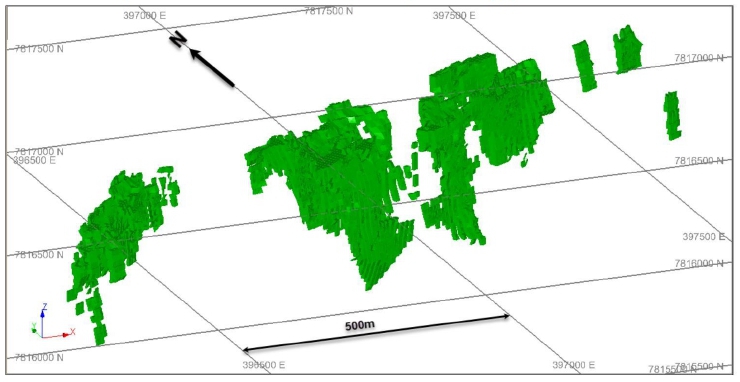
| Adam Wheeler | September 2025 |
| Technical Report on the Mineral Resources of the Nussir and Ulveryggen Projects | 168 |
Table 14-32. Resource Evaluation Summary – Ulveryggen
(As of End-January, 2025)
| Indicated | Inferred | |||
| ZONE | Tonnes | Cu | Tonnes | Cu |
| Kt | % | Kt | % | |
| 1 | 761 | 0.73 | 393 | 0.70 |
| 2 | 1,936 | 0.59 | 818 | 0.56 |
| 3 | 149 | 0.48 | 1,151 | 0.62 |
| 4 | 1,205 | 0.71 | 563 | 0.90 |
| 5 | 247 | 0.51 | ||
| 6 | 525 | 0.79 | ||
| Total | 4,052 | 0.65 | 3,697 | 0.68 |
Notes
. MSO constraints based on a cut-off grade of 0.3%Cu
. Minimum thickness = 3m
. Minimum selectivity = 10m along-strike and down-dip
. Based on Dec 2018 resource block model
Table 14-33. Grade-Tonnage Table - Indicated Resources Only- Ulveryggen
Cu Cut-Off 0.3 |
Tonnes 4,048 |
Cu 0.65 |
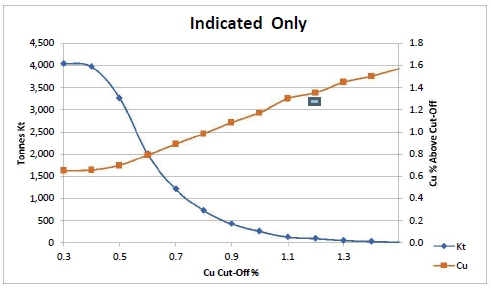 |
| 0.4 | 3,968 | 0.66 | |
| 0.5 | 3,268 | 0.70 | |
| 0.6 | 2,003 | 0.79 | |
| 0.7 | 1,212 | 0.89 | |
| 0.8 | 730 | 0.98 | |
| 0.9 | 427 | 1.08 | |
| 1.0 | 257 | 1.17 | |
| 1.1 | 131 | 1.30 | |
| 1.2 | 98 | 1.35 | |
| 1.3 | 55 | 1.45 | |
| 1.4 | 34 | 1.50 | |
| 1.5 | 17 | 1.57 |
| Adam Wheeler | September 2025 |
| Technical Report on the Mineral Resources of the Nussir and Ulveryggen Projects | 169 |
15 MINERAL RESERVE ESTIMATES
Not applicable
16 MINING METHODS
Not applicable
17 RECOVERY METHODS
Not applicable
18 PROJECT INFRASTRUCTURE
Not applicable
19 MARKET STUDIES AND CONTRACTS
Not applicable
20 ENVIRONMENTAL STUDIES, PERMITTING AND SOCIAL IMPACT
Not applicable
21 CAPITAL AND OPERATING COSTS
Not applicable
22 ECONOMIC ANALYSIS
Not applicable
| Adam Wheeler | September 2025 |
| Technical Report on the Mineral Resources of the Nussir and Ulveryggen Projects | 170 |
23 ADJACENT PROPERTIES
There are other claim holders in the Repparfjord area, as shown in the plan in Figure 23-1. The companies holding the claims, beside Nussir, are:
| · | Grønnstein AS, Norwegian exploration company. |
| · | Aurum Future Minerals AS, owned by Ireland-based Aurum Discovery Ltd |
As can be seen from the plan, these other claims are either immediately to the west or east of Nussir’s claims.
The Author has not visited these other properties and is therefore unable to verify information pertaining to the presence of mineralization on the adjacent properties. These properties are not necessarily indicative of the mineralization associated with the Nussir and Ulveryggen projects that is the subject of this report. The information provided in this section is simply intended to provide examples of other properties that exist in the region.
| Adam Wheeler | September 2025 |
| Technical Report on the Mineral Resources of the Nussir and Ulveryggen Projects | 171 |
Figure 23-1. Claims in the Repparfjord Area
[Source: Norwegian Directorate of Mining]
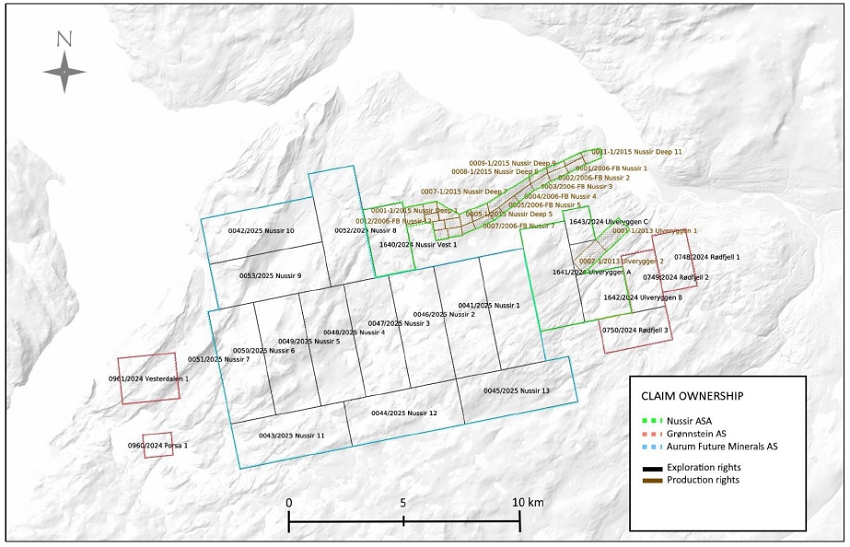
| Adam Wheeler | September 2025 |
| Technical Report on the Mineral Resources of the Nussir and Ulveryggen Projects | 172 |
24 OTHER RELEVANT DATA AND INFORMATION
Non-applicable.
25 INTERPRETATION AND CONCLUSIONS
25.1 Risks and Uncertainties
There are several risks and uncertainties associated with the Nussir and Ulveryggen projects that should be considered; however, there are also several generic risks that are associated with nearly all exploration and mining project, including but not limited to the following:
| · | Sensitivity of the mineral resource to metal pricing |
| · | Supply chain cost escalation for contractors and service providers |
| · | Possible exploration permitting difficulties, related costs, and resulting delays |
The project specific risks and uncertainties that the Author has identified are discussed in this section of the report.
25.1.1 Drillholes
There are some errors associated with elevation of drillhole collars when compared to the LiDAR data. In general, the elevation differences seem worse for the Ulveryggen deposit than at the Nussir deposit. However, this observation might be due to the sharp changes in topography at the Ulveryggen deposit, where many very steep faces and slopes are left by the historical open pit mining, making the LiDAR pick-up more difficult. The risk of errors having any appreciable effect on resource estimation is minimal. These errors can be mitigated with more accurate measurements of historical and recent drillhole collars. The Author concludes that the data management of drillholes is of sufficient quality to support the estimation of a mineral resource.
25.1.2 Density Measurements.
For both the Nussir and Ulveryggen projects, the density measurements taken do not cover the full extent of the deposit, nor do they fully cover all strata associated with the mineralization. As such, there is a risk associated with the assumed densities in some parts of the deposit. This risk can be mitigated in the future with the collection of further density measurements with each successive drilling program and by analysing these results for refinement of any future estimations of a mineral resource for the projects. The Author concludes that the density measurement are sufficient to support the estimation of a mineral resource.
25.1.3 Rejects/Pulps Inventory.
There is a small risk associated with incomplete inventories of available rejects and pulps, for both Nussir and Ulveryggen. This risk can be mitigated by preparing updated inventories for both Løkken and Skaidi.
| Adam Wheeler | September 2025 |
| Technical Report on the Mineral Resources of the Nussir and Ulveryggen Projects | 173 |
25.1.4 Historic QA/QC Procedures.
The little QAQC information is available for the data prior to 2008 at Nussir (representing approximately 30% of all current samples) and prior to 2010 at Ulveryggen (representing approximately 85% of all current samples). There is a risk of potential bias and lack of precision associated with this older data. In later years, QA/QC procedures have been applied progressively more rigorously. The weakness of this old data can be mitigated in the future with further sampling and new data. The Author concludes that the historical QAQC is sufficient to support the estimation of a mineral resource.
25.1.5 Fault Zones - Nussir.
At the Nussir deposit, there are some fault intersections in drillholes in the Eastern part of the deposit, which were could not be built into coherent fault models, so faults are not represented in the current geological model. Given the overall continuity of the mineralised structures at Nussir, and the observed outcrop continuity, it does not appear likely that faults significantly affect the resource model and subsequent estimation. However, to mitigate this risk, it is recommended that fault models are interpreted as the project develops, using additional drilling results and more detailed mapping of surface topography. The Author concludes that the continuity of strata and mineralization, along with the current interpretations of fault structures is of sufficient quality to support the estimation of a mineral resource.
25.1.6 Structural Modelling - Nussir.
The wide-spaced drilling at the Nussir deposit could be possibly picking up other structural geological features that might affect the overall geometry of mineralised zones. To mitigate this risk, it is recommended that any other structural geological details are accounted for as the project develops, using further drilling results and more detailed mapping of surface topography. The Author concludes that the current stead of the structural information available for the deposit is sufficient to support the estimation of a mineral resource.
| Adam Wheeler | September 2025 |
| Technical Report on the Mineral Resources of the Nussir and Ulveryggen Projects | 174 |
25.2 Results and Interpretations
There are several opportunities to improve the current results that should be investigated further as part of the ongoing development of the Nussir and Ulveryggen projects.
25.2.1 Exploration Targets - Nussir.
The Nussir deposit is open to the west and to depth. In particular, the current limit of Inferred category resources excludes the influence of thee deep drillhole intersections, because they are excessively distant to the grid of holes above. The exploration target potential was derived by modelling the identified mineralization. The volume of the modelled areas determines the potential tonnage statement in the exploration target. The grade range given in the exploration target is determined with consideration to the drill results within the modelled exploration target area and consideration of the geological setting in an established mineral resource estimate area. The potential tonnages and grades are therefore conceptual in nature and are based on previous drill results that defined the approximate length, thickness, depth and grade of the portion of the mineral resource estimate. There has been insufficient exploration and data collection to define a current mineral resource for the exploration target and the Issuer cautions that there is a risk that further exploration will not result in the delineation of a mineral resource. The exploration target around these deeper intersections therefore represents a tonnage between 8.5 Mt and 16.5Mt, and a Cu grade between 0.7 and 1.3% Cu, between 9 and 17 g/t silver, and 0.1 and 0.15g/t gold.
There are also a number of mineralized targets occur both downdip and along strike of the mineralized exploration target that has been defined. This mineral potential has not been properly tested by drilling. Additionally, a number of mineral targets currently outside of the resource area of the Nussir and Ulveryggen deposits are supported by geological mapping and limited drilling. This means that additional infill and exploration drilling is warranted to more fully test favourable stratigraphy both regionally and directly at Nussir and Ulveryggen deposits.
25.2.2 Exploration Targets - Ulveryggen
The Ulveryggen deposit is open to depth, and based on geochemical sampling and geophysics, there are drilling targets both along strike and down-dip.
| Adam Wheeler | September 2025 |
| Technical Report on the Mineral Resources of the Nussir and Ulveryggen Projects | 175 |
25.2.3 Double Mineralised Intersections – Nussir deposit
There are some instances at Nussir, mainly in the more folded west end, of single drillholes picking up two mineralised intersections. This could be due to reverse faulting, and when drilled sufficiently in the future, could lead to an improved interpretation with more mineralised material that is currently modelled. These potentially repeated strata are only known to occur over 2.5 of the 10 km strike length of known mineralization. Limited drilling has been done to date to fully test the mineral potential of this possible extension. Given the presence of a mineral resource adjacent to this parallel zone of favourable strata, it means additional drilling is warranted but there is no guarantee that additional drilling will result in the delineation of a mineral resource in these areas.
25.2.4 Inferred Resource Conversion – Nussir deposit
The Nussir deposit is open to depth over much of its strike length, as well as westwards. If the project progresses and the proposed underground development commences, this could allow much closer and offset access for drilling of deeper zones. This would provide an opportunity to significantly extend Indicated resources to depth and westwards. Additional drilling should be designed in order to enable a significant proportion of the deposit to be reclassified into a higher category of confidence, such as Indicated category, as well as provide a more accurate interrelation and structural geology and mineralised zones. Stakeholders should be cautioned that addition drilling is not a guarantee for upgrading the resource category.
Inferred Resource Conversion – Ulveryggen deposit
There are numerous areas currently modelled at the Ulveryggen deposit, where the current drilling density does not support an Indicated resource categorisation. Additional drilling should be designed to enable a significant proportion of the deposit to be reclassified into a higher category of confidence, such as Indicated category, as well as provide a more accurate interrelation and structural geology and mineralised zones. Stakeholders should be cautioned that additional drilling is not a guarantee for upgrading the resource category.
| Adam Wheeler | September 2025 |
| Technical Report on the Mineral Resources of the Nussir and Ulveryggen Projects | 176 |
25.3 Conclusions
The updated mineral resource estimate with an effective date of January 20, 2025, has these conclusions from the Author and are as follows:
| · | The geological setting and character of the sedimentary-hosted copper mineralization identified to date on the Project, and specifically at the Nussir and Ulveryggen deposits, are of sufficient enough merit to justify additional exploration expenditures. |
| · | The majority of drill holes completed to date were targeting the mineral resource totalling 345 core drill holes for 69,440 metres. |
| · | Drilling has identified extensive, conformable, sedimentary strata that are well mineralized that remain open for growth. Geological mapping on surface and drilling both along strike and downdip of the mineral resource have identified the same favorable host rocks for copper mineralization indicating mineral potential warranting additional drilling to more fully test these favorable strata both regionally and at the Nussir and Ulveryggen deposits. |
| · | There is a parallel zone of mineralization that has been identified that is believed to be a potential fault repetition, tested only by limited drilling over a 2.5 km stretch of the 10 km strike extent of the favorable strata. A number of additional mineral occurrences occur outside of the deposits, such as the Western zone, that require addition exploration beyond infill and exploration drilling directly around the mineral resource wireframes. |
| · | There is general support for the project at the exploration stage of mineral resource development from the affected communities in the area, as those communities will benefit from local employment. |
| · | The Author has reviewed the procedures for drilling, sampling, sample preparation and analysis, and is of the opinion that they are appropriate for the deposit style and mineralization. |
| · | The Author has reviewed the quality control results (QA/QC) and did not find any material issues, so the Author is of the opinion that the databases for the mineral resource are of sufficient quality to estimate mineral resources. |
| · | Mineral resources were estimated using a 0.30% copper cutoff value for potential underground extraction that will need to be studied further in the future. |
| · | Measured mineral resources for the Nussir deposit are presented in Table 25-1. |
| · | For the Ulveryggen deposit, the Indicated mineral resources are presented in Table 25-2. |
| Adam Wheeler | September 2025 |
| Technical Report on the Mineral Resources of the Nussir and Ulveryggen Projects | 177 |
Table 25-25-1. Nussir Resource Estimation Summary
Effective Date: 20th January, 2025
| Category | Tonnes | Cu | Ag | Au | Cu Eq | Cu Metal | Ag Metal | Au Metal |
| Mt | % | g/t | g/t | % | Kt | Koz | Koz | |
| Measured | 2.69 | 1.08 | 12.8 | 0.18 | 1.31 | 29 | 1,103 | 16 |
| Indicated | 26.03 | 1.01 | 12.3 | 0.11 | 1.19 | 263 | 10,288 | 92 |
| Meas+Ind | 28.72 | 1.02 | 12.3 | 0.12 | 1.20 | 292 | 11,391 | 108 |
| Inferred | 31.99 | 1.01 | 14.6 | 0.14 | 1.23 | 324 | 14,972 | 143 |
Notes:
| 1 . | CIM definitions were followed for MRE. |
| 2 . | A minimum mining width of 2.0 m was applied in making the MRE constraint wireframes. These wireframes were generated using a preliminary MSO. |
| 3 . | Density values for Nussir were estimated from density sample values or assigned default average values where insufficient samples occur nearby. |
| 4 . | MRE constraint wireframes were generated for a cut-off grade of 0.30% Cu, related to potential underground mining. |
| 5 . | Metal prices assumed for this MRE were US$4.20 lb Cu, US$27.00/Oz Ag and US$2,200oz Au, which represent reasonable long-term consensus metal pricing. |
| 6 . | Metallurgy recovery assumptions were 96% Cu, 80% Ag and 93% Au, which stem from SGS metallurgical testwork completed in 2022. |
| 7 . | The cut-off grade of 0.30% Cu was derived from the price and recovery values above, as well as a smelter payability of 97.3% and an assumed total operating cost $26.20/t of ore. |
| 8 . | Rounding may result in apparent summation differences between tonnes, grades and metal content; not considered material. |
| 9 . | Mineral Resources are not Mineral Reserves and do not have demonstrated economic viability. |
| Adam Wheeler | September 2025 |
| Technical Report on the Mineral Resources of the Nussir and Ulveryggen Projects | 178 |
Table 25-25-2. Ulveryggen Resource Estimation Summary
Effective Date: 20th January, 2025
| Resource | Tonnes | Cu | Cu Metal |
| Category | Mt | % | Kt |
| Indicated | 4.05 | 0.65 | 26.3 |
| Inferred | 3.70 | 0.68 | 25.0 |
Notes:
| 1 . | CIM definitions were followed for MRE. |
| 2 . | A minimum mining width of 2.0 m was applied in making the MRE constraint wireframes. These wireframes were generated using a preliminary MSO. |
| 3 . | A global density value was assigned for Ulveryggen, based on analysis of density measurements. |
| 4 . | MRE constraint wireframes generated for a cut-off grade of 0.30% Cu, related to potential underground mining. |
| 5 . | The assumed metal price assumed for this MRE was 4.20 $/lb Cu, which represents a reasonable long-term value. |
| 6 . | The assumed metallurgical recovery was 96% Cu, which stems from SGS metallurgical testwork completed in 2022. |
| 7 . | The cut-off grade of 0.30% Cu was derived from the price and recovery values above, as well as a smelter payability of 97.3% and an assumed total operating cost $26.20/t of ore. |
| 8 . | Rounding may result in apparent summation differences between tonnes, grades and metal content; not considered material. |
| 9 . | Mineral Resources are not Mineral Reserves and do not have demonstrated economic viability. |
26 RECOMMENDATIONS
26.1 Sample Preparation, Analyses, and Security
| · | Develop rigorous quality control and quality assurance (“QA/QC”) policy for standards, blanks and duplicate sample when drilling that is monitored on a batch-by-batch basis when data is received from the accredited laboratory. |
| · | Consider the use of prep- and or reject duplicate samples to enhance the QA/QC |
| · | Select certified reference material (CRM) that are more aligned to the grades of the Nussir and Ulveryggen deposits for copper, gold and silver; being mindful that if geochemically testing for platinum and or palladium, it might require a different CRM. |
| · | Develop an umpire or secondary independent laboratory, remitting approximately 10 to 15% of the total samples, and select analysis methodologies that are similar to the primary laboratory. This will provide future assurances that the range of grades seen in the analytical certificates are valid and respected. |
| · | Consider centralizing all pulp and reject storage |
| Adam Wheeler | September 2025 |
| Technical Report on the Mineral Resources of the Nussir and Ulveryggen Projects | 179 |
26.2 Data Verification
| · | Finish the drill collar validations done in 2019, referencing the Devisight system from Devico for the X and Y coordinates, and then validating elevation (or Z) data between the surveys for each of the drill collar locations against the LiDAR survey. Having a valid elevation data strengthens the respect of the mineral resource modelling. |
| · | Consider a more rigorous check analysis program, if the analytical pulps are available from prior drilling program results. At a minimum, select approximately 100 to 200 pulps from each round of drilling that would be re-run at both the primary and secondary laboratory. |
| · | Consider moving point and vector data from drilling into a proper database management system such as MX Deposit. This includes but is not limited to drill collar information, lithological data, structural data, sample data, and analytical results. The advantage of such a cloud-based database management system is that it negates expensive software purchasing and it can be linked to major 3D modelling programs such as Seequent’s Leapfrog Geo and other programs. |
26.3 Further Studies
| · | An optimization and or trade-off study should be done to assess a conventional tailings facility approach for any future engineering studies |
| · | Consider building a Leapfrog Geo model of all lithological units and structures that is maintained and updated regularly when new surficial mapping and or drilling is completed. This will help better guide future studies and mineral resource estimation processes. |
| · | Consider adding RMR to the geomechanical (rock mechanics) data collection in addition to the RQD work already part of the core logging process. This methodology is typically done for deposits that potentially could be extracted through an underground. |
| · | Consider adding point load testing (“PLT”) to the geomechanical data collection process in the coreshack. The addition of this process will provide rock quality and strength information that will be invaluable when assessing ground stability in future engineering studies. It will also provide a large dataset that can be used in conjunction with any analytical program carried out at a rock mechanics laboratory |
| · | Consider a regular analytical process at a rock mechanics laboratory to backstop geomechanical data collection. Testing could include UCS, BTS, and Triaxial measurements. If a PLT is collecting |
| · | Consider taking a coreshack measurement of specific gravity for each sample marked for collection or add an analytical pulp or reject measurement at the primary laboratory. The addition of a larger number of specific gravity measurements will greatly enhance the estimation of the tonnes on a block by block basis in the mineral resource model, as currently the estimations are using average values for lithologies. |
| Adam Wheeler | September 2025 |
| Technical Report on the Mineral Resources of the Nussir and Ulveryggen Projects | 180 |
26.4 Exploration Program and Budget
For further development of the project, The Author recommends a work program at the Nussir and Ulveryggen projects that includes the preparation of the development of an exploration decline (including logistics and support), exploration drilling and optimization studies including engineering. A summary breakdown of this work program is presented below along with associated estimated costs expected to cost C$13.0 million (Table 26-1).
Table 26-1. Proposed Budget
| Item | (C$000) |
| Underground access (decline) preparation, exploration logistics and support | 4,000 |
| Exploration – drilling 25,000 to 30,000 m | 6,000 |
| Optimization studies including engineering studies | 3,000 |
| Total | 13,000 |
| Adam Wheeler | September 2025 |
| Technical Report on the Mineral Resources of the Nussir and Ulveryggen Projects | 181 |
27 REFERENCES
Dalsegg, Einar. Elvebakk, Harald and Rønning, Jan S. 2013. Geofysiske bakke- og borehullsmålinger ved Nussir i 2013, Kvalsund kommune, Finnmark. Trondheim : Norwegian Geological Survey, 2013.052 ISSN0800-3416.
Dalsegg, Einar and Rønning, Jan S. 2011. Geofysiske målinger Nussir- Ulveryggen, Kvalsund kommune, Finnmark. Trondheim : Norwegian Geological Survey, 2011.072 ISSN0800-3416.
Girard, Romain, Pullman, Bryan, and Balding, Barry. Nussir & Ulveryggen Copper Project PFS, 2017.
Heincke, Bjørn H. Koziel, Janusz. Walker, Peter and Lynum, Rolf. 2008. Helicopter-borne geophysical measurements for mineral exploration at Nussir, Kvalsund, Finnmark. Trondheim : Norwegian Geological Survey, 2008.020 ISSN0800-3416.
Hitzman, Murray W. 2008. A New view of the Zambian Copperbelt. Misty Hills, South Africa : Colorado School of mines, 2008.
Nilsen, Kjell S., 2019. Nussir and Ulveryggen – Geological Report.
Pharaoh, Tim C, Jansen, Øystein and Ramsey, Donald M. 1983. Stratigraphy and structure of the northern part of Repparfjord-Komagfjord Window, Finnmark, Northern Norway. Trondheim : Universitetsforlaget, 1983. B0007B7JF6.
Rønning, Jan S., Dalsegg, Einar and Walker, Peter. 2007. Vurdering av helikoptergeofysikk over Nussirforekomsten. Trondheim : Norwegian Geological Survey, 2007. ISSN0800-3416.
Sandstad, Jan Sverre., Viola, G. & Nilsson, L. 2007. Reconnaissance structural geologic mapping and field XRF analyses of the Ulveryggen copper deposit, Finnmark, Norway. Norges geologiske undersøkelse Report 2007.060.
Sandstad, Jan Sverre. 2010. Microscope and SEM investigations of thin sections from the Nussir copper deposit, Kvalsund, Finnmark, Northern Norway. Trondheim : Norges geologiske institutt, 2010.025 ISSN0800-3416.
SGS, 2019. An Investigation into the Recovery of Copper from the Nussir Deposit. Project 12527-04 0 Report 2.
Simonsen Vogtwiig, 19/12/2024. “Title and Corporate Opinion’ from Blue Moon”.
Viola, Giulio. Sandstad, Jan S. Nilsson, Lars P. Heincke, Bjørn. 2008. Structural and ore geological studies in the northwestern part of the Repparfjord Window, Kvalsund, Finnmark, Norway. Trondheim : Norgesgeologiske institutt, 2008.029, ISSN0800-3416.
Wheeler, Adam. May 2012. “Nussir Report Estimation Updated May 2012”.
Wheeler, Adam. March 2014. “Nussir Report Estimation Updated March 2014”.
Wheeler, Adam. October 2016. “Nussir Report Estimation Updated May 2016”.
Wheeler, Adam. January 2018. “Nussir Report Estimation Updated May 2018”.
| Adam Wheeler | September 2025 |