Exhibit 99.78
REPORT NI 43-101
TECHNICAL REPORT ON THE
MINERAL RESOURCES OF THE
SULITJELMA PROJECT, NORWAY
Prepared for
Blue Moon Metals Inc.
by
Qualified Person:
Adam Wheeler, B.Sc, M.Sc, C. Eng., Eur Ing.
| Effective Date of MRE: | 20th February 2025 |
| Date of Report: | 20th May 2025 |
Adam Wheeler,
Mining Consultant, C. Eng, Eur Ing,
Cambrose Farm,
Redruth,
Cornwall, TR16 4HT,
England.
20th May, 2025
| Technical Report on the Mineral Resources of the Sulitjelma Project | 2 |
QUALIFIED PERSONS CERTIFICATE
Certificate Of Author
Adam Wheeler, Mining Consultant,
Cambrose Farm, Redruth, Cornwall, TR16 4HT, England.
Tel/Fax: (44) 1209-899042; E-mail: adamwheeler@btinternet.com
As the author of this “Technical Report on the Mineral Resources of the Sulitjelma Project, Norway”, I, A. Wheeler do hereby certify that:
| 1. | I am an independent mining consultant, based at Cambrose Farm, Redruth, Cornwall, TR16 4HT, England. |
| 2. | I hold the following academic qualifications: |
| B.Sc. (Mining) | Camborne School of Mines | 1981 | |
| M.Sc. (Mining Engineering) | Queen’s University (Canada) | 1982 |
| 3. | I am a registered Chartered Engineer (C. Eng and Eur. Ing) with the Engineering Council (UK). Reg. no. 371572. |
| 4. | I am a professional fellow (FIMMM) in good standing of the Institute of Materials, Minerals and Mining. |
| 5. | I have worked as a mining engineer in the minerals industry for over 40 years. I have experience with a wide variety of mineral deposits, resource and reserve estimation techniques. |
| 6. | I have read NI 43-101 and the technical report, which is the subject of this certificate, has been prepared in compliance with NI 43-101. By reason of my education, experience and professional registration, I fulfil the requirements of a “qualified person” as defined by NI 43-101. My work experience includes 5 years at an underground gold mine, 7 years as a mining engineer in the development and application of mining and geological software, and 30 years as an independent mining consultant, involved with resource and reserve estimation, evaluation and planning projects for both open pit and underground mining projects. |
| 7. | I am responsible for the preparation of the technical report titled “Technical Report on the Mineral Resources of the Sulitjelma Project, Norway”, and dated May 20th, 2025. I visited the project property on 2/12/2024. |
| 8. | As of the date hereof, to the best of my knowledge, information and belief, the technical report, which is the subject of this certificate, contains all scientific and technical information that is required to be disclosed to make such a technical report not misleading. |
| 9. | I am independent of Blue Moon Metals Inc, pursuant to section 1.5 of NI 43-101. |
| 10. | I have read the National Instrument and Form 43-101F1 (the “Form”) and the Technical Report has been prepared in compliance with NI 43-101 and the Form. |
| Adam Wheeler | 20th May 2025 |
| Technical Report on the Mineral Resources of the Sulitjelma Project | 3 |
DATE AND SIGNATURES PAGE
Herewith, my report entitled “Technical Report on the Mineral Resources of the Sulitjelma Project, Norway”, dated May 20th, 2025.
| “signed” | ||
| A. Wheeler, C.Eng., Eur. Ing. | Dated the 20th of May 2025 |
| Adam Wheeler | 20th May 2025 |
| Technical Report on the Mineral Resources of the Sulitjelma Project | 4 |
TABLE OF CONTENTS
| Page | |||
| QUALIFIED PERSONS CERTIFICATE | 2 | ||
| 1 | SUMMARY | 9 | |
| 1.1 | Overview | 9 | |
| 1.2 | Ownership | 9 | |
| 1.3 | Geology and Mineralisation | 9 | |
| 1.4 | Database and Resource Estimation | 10 | |
| 1.5 | Exploration Status | 11 | |
| 1.6 | Mineral Resource Estimation | 11 | |
| 1.7 | Results and Interpretations | 13 | |
| 1.8 | Conclusions | 13 | |
| 1.9 | Recommendations | 14 | |
| 1.9.1 Sample Preparation, Analyses, and Security | 14 | ||
| 1.9.2 Data Verification | 14 | ||
| 1.9.3 Exploration Program and Budget | 15 | ||
| 2 | INTRODUCTION | 16 | |
| 2.1 | Author | 16 | |
| 2.2 | Terms of Reference | 16 | |
| 2.3 | Units and Currency | 17 | |
| 3 | RELIANCE ON OTHER EXPERTS | 17 | |
| 4 | PROPERTY DESCRIPTION AND LOCATION | 17 | |
| 4.1 | Location | 17 | |
| 4.2 | Licenses | 19 | |
| 4.3 | Fees and Royalties | 23 | |
| 4.4 | Environmental Liabilities | 23 | |
| 5 | ACCESSIBILITY, CLIMATE, LOCAL RESOURCES, INFRASTRUCTURE AND PHYSIOGRAPHY | 24 | |
| 5.1 | Accessibility | 24 | |
| 5.2 | Site Description | 24 | |
| 5.3 | Climate | 26 | |
| 5.4 | Local Resources | 26 | |
| 5.5 | Infrastructure | 26 | |
| 5.6 | Power Supply | 27 | |
| 5.7 | Water Supply | 27 | |
| 6 | HISTORY | 29 | |
| 6.1 | Mining History | 29 | |
| 6.2 | Drilling | 30 | |
| 6.3 | Exploration | 31 | |
| 6.4 | Recent Project Developments | 33 | |
| 7 | GEOLOGICAL SETTING AND MINERALISATION | 34 | |
| 7.1 | Regional Geology | 34 | |
| 7.2 | Local Geology | 36 | |
| 7.3 | Mineralisation | 38 | |
| 8 | DEPOSIT TYPE | 40 | |
| 9 | EXPLORATION | 41 | |
| 10 | DRILLING | 41 | |
| 11 | SAMPLE PREPARATION, ANALYSIS AND SECURITY | 41 | |
| 12 | DATA VERIFICATION | 44 | |
| 12.1 | Site Visit | 44 | |
| 12.2 | Drill hole Core | 47 | |
| 12.3 | Collar Data | 50 | |
| 12.4 | Database | 51 | |
| 12.5 | Drill hole Data | 51 | |
| 12.6 | Density | 54 | |
| 13 | MINERAL PROCESSING AND METALLURGICAL TESTING | 55 | |
| 14 | MINERAL RESOURCE ESTIMATE | 58 | |
| 14.1 | Data Collation | 58 | |
| 14.2 | Interpretation | 60 | |
| 14.3 | Exploratory Data Analysis | 65 | |
| Adam Wheeler | 20th May 2025 |
| Technical Report on the Mineral Resources of the Sulitjelma Project | 5 |
| 14.4 | Compositing | 68 | ||
| 14.5 | Geostatistics | 69 | ||
| 14.7 | Volumetric Modelling | 72 | ||
| 14.8 | Grade Estimation | 74 | ||
| 14.9 | Resource Classification | 76 | ||
| 14.10 | Model Validation | 77 | ||
| 14.10.1 | Cross-Sections | 77 | ||
| 14.10.2 | Global Comparison of Grades | 77 | ||
| 14.10.3 | Local Comparison of Grades | 77 | ||
| 14.11 | Resource Evaluation | 79 | ||
| 15 | MINERAL RESERVE ESTIMATES | 83 | ||
| 16 | MINING METHODS | 83 | ||
| 17 | RECOVERY METHODS | 83 | ||
| 18 | PROJECT INFRASTRUCTURE | 83 | ||
| 19 | MARKET STUDIES AND CONTRACTS | 83 | ||
| 20 | ENVIRONMENTAL STUDIES, PERMITTING AND SOCIAL IMPACT | 83 | ||
| 21 | CAPITAL AND OPERATING COSTS | 83 | ||
| 22 | ECONOMIC ANALYSIS | 83 | ||
| 23 | ADJACENT PROPERTIES | 84 | ||
| 24 | OTHER RELEVANT INFORMATION | 86 | ||
| 25 | INTERPRETATION AND CONCLUSIONS | 86 | ||
| 25.1 | Risks and Uncertainties | 86 | ||
| 25.1.1 | Drill holes | 86 | ||
| 25.1.2 | Density Measurements | 86 | ||
| 25.1.3 | Historic QA/QC Procedures | 86 | ||
| 25.1.4 | Mined-Out Areas | 87 | ||
| 25.2 | Results and Interpretations | 87 | ||
| 25.3 | Conclusions | 88 | ||
| 26 | RECOMMENDATIONS | 89 | ||
| 26.1 | Sample Preparation, Analyses, and Security | 89 | ||
| 26.2 | Data Verification | 89 | ||
| 26.3 | Exploration Program and Budget | 90 | ||
| 27 | REFERENCES | 91 | ||
APPENDICES
| A | Summary of Drill hole Intersections |
| B | Resource Cross-Sections – Rupsi/Dypet |
| C | Resource Cross-Sections – Hankabakken II |
| D | Resource Cross-Sections - Sagmo |
| Adam Wheeler | 20th May 2025 |
| Technical Report on the Mineral Resources of the Sulitjelma Project | 6 |
LIST OF TABLES
| Page | ||
| Table 1-1. | Sulitjelma Deposit Resource Estimation Summary | 12 |
| Table 1-2. | Proposed Budget | 15 |
| Table 4-1. | Summary of License Areas | 19 |
| Table 6-1. | Sulitjelma Mine Production Summary | 30 |
| Table 6-2. | Sulitjelma Drilling Summary | 30 |
| Table 6-3. | Summary of Core Diameters | 31 |
| Table 6-4. | Summary of Drake Exploration Sample Results | 31 |
| Table 11-1. | Summary of Limits of Detection | 42 |
| Table 12-1. | Summary of Check Density Measurements | 54 |
| Table 13-1. | Summary of 1984 Mill Production | 55 |
| Table 14-1. | Summary of Drill hole Database | 58 |
| Table 14-2. | Statistical Summaries – Interpreted Samples | 65 |
| Table 14-3. | Top-Cut Levels | 68 |
| Table 14-4. | Zone Orientations | 68 |
| Table 14-5. | Compositing Parameters | 68 |
| Table 14-6. | Statistical Summary– RD Composites | 70 |
| Table 14-7. | Statistical Summary– H2 Composites | 70 |
| Table 14-8. | Statistical Summary– SM Composites | 70 |
| Table 14-9. | Summary of Model Prototypes | 72 |
| Table 14-10. | Grade Estimation Parameters | 74 |
| Table 14-11. | Global Comparison of Average Grades | 77 |
| Table 14-12. | MSO Parameters | 79 |
| Table 14-13. | Cut-Off Grade and Cu_Eq Parameters | 80 |
| Table 14-14. | Grade-Tonnage Table – RD Region, Inferred Resources Only | 81 |
| Table 14-15. | Grade-Tonnage Table – H2 Region, Inferred Resources Only | 81 |
| Table 14-16. | Grade-Tonnage Table – SM Region, Inferred Resources Only | 81 |
| Table 14-17. | Grade-Tonnage Table – RD, H2 and SM Regions, Inferred Resources Only | 82 |
| Table 14-18. | Constrained Mineral Resource Estimate Statement | 82 |
| Table 26-1. | Proposed Budget | 90 |
| Adam Wheeler | 20th May 2025 |
| Technical Report on the Mineral Resources of the Sulitjelma Project | 7 |
LIST OF FIGURES
| Page | ||
| Figure 4-1. | Overall Map of Sulitjelma Location | 18 |
| Figure 4-2. | Northern Norway Map of Sulitjelma Location | 18 |
| Figure 4-3. | Plan of License Areas - Overall | 20 |
| Figure 4-4. | Plan of License Areas – North | 21 |
| Figure 4-5. | Plan of License Areas – South | 22 |
| Figure 5-1. | Plan of Local Sulitjelma Area | 25 |
| Figure 5-2. | Plan of Sulitjelma and Old Mine Workings | 25 |
| Figure 5-3. | Plan of Sandnes Water Supply | 27 |
| Figure 5-4. | Plan of Hydroelectric Power Plants in Sulitjelma Area | 28 |
| Figure 5-5. | Plan of Power Lines and Transformers in Sulitjelma Area | 28 |
| Figure 6-1. | Plan of VTEM Survey Extents – Drake Exploration 2014 | 32 |
| Figure 6-2. | Main Areas in Project Development | 33 |
| Figure 7-1. | Simplified Map of Scandinavian Caledonides | 34 |
| Figure 7-2. | Outline Geological Map Scandinavian Caledonides | 35 |
| Figure 7-3. | Profile Between Bodø and Sulitjelma | 35 |
| Figure 7-4. | Stratigraphy of Sulitjelma Ophiolite Complex – Pre-Folding/Faulting | 36 |
| Figure 7-5. | Simplified Geology Plan of Sulitjelma Area | 37 |
| Figure 7-6. | Profile of Sulitjelma Fold Nappe | 37 |
| Figure 7-7. | Stratigraphic Column of Sulitjelma in Northern Mineralisation Area | 38 |
| Figure 7-8. | S-N Profile Across Langvann Antiform | 38 |
| Figure 7-9. | Example of Folding in Giken II Mineralisation | 39 |
| Figure 11-1. | Histogram of Drilling Sample Lengths | 42 |
| Figure 11-2. | Photo of NGU Core Storage Facility – Lokken | 43 |
| Figure 12-1. | Pictures – Underground at Rupsi | 45 |
| Figure 12-2. | Surface Infrastructure - Former Processing Facilities | 45 |
| Figure 12-3. | Looking Westwards from Giken Mine | 46 |
| Figure 12-4. | Looking Southward towards Former Sagmo Mine Area | 46 |
| Figure 12-5. | Hole RUP-168 | 48 |
| Figure 12-6. | Hole RUP-136 | 49 |
| Figure 12-7. | Hole RUP-137 | 49 |
| Figure 12-8. | Histogram of Check Collar Elevation Differences – Rupsi and Sagmo | 50 |
| Figure 12-9. | Plan of Underground Drill holes vs Historical Map - Rupsi | 52 |
| Figure 12-10. | Plan of Underground Drill holes vs Historical Map - Sagmo | 52 |
| Figure 12-11. | Plan of Underground Drill holes vs Historical Map - Hankabakken | 52 |
| Figure 12-12. | Historic Profile | 53 |
| Figure 12-13. | Profile 6 with Imported Data | 53 |
| Figure 12-14. | Point Plot of Cu grade vs Density | 55 |
| Figure 13-1. | Photograph of As-Received Sample- for SGS Flotation Testing | 56 |
| Figure 13-2. | Test Flotation Flowsheet | 57 |
| Figure 14-1. | 3D View of All Drill holes, Looking North-West | 58 |
| Figure 14-2. | Plan Plot of Drill holes | 58 |
| Figure 14-3. | 3D View of RD Drill holes – Looking North-West | 59 |
| Figure 14-4. | 3D View of H2 Drill holes – Looking North-West | 59 |
| Figure 14-5. | 3D View of SM Drill holes – Looking North-West | 59 |
| Figure 14-6. | RD – Plan of Interpreted Veins | 61 |
| Figure 14-7. | 3D View of RD Interpreted Veins, Looking South-West | 61 |
| Adam Wheeler | 20th May 2025 |
| Technical Report on the Mineral Resources of the Sulitjelma Project | 8 |
| Figure 14-8. | Overall S-N Section Through RD Region | 62 |
| Figure 14-9. | S-N Section Through RD Mineralised Zones | 62 |
| Figure 14-10. | Plan of H2 Interpreted Zones | 63 |
| Figure 14-11. | 3D View of H2 Interpreted Zones, Looking South-West | 63 |
| Figure 14-12. | Plan of SM Interpreted Zones | 64 |
| Figure 14-13. | WE Long-Section of SM Interpreted Zones | 64 |
| Figure 14-14. | Log-Probability Plots of Cu Samples Within Interpreted Zones | 66 |
| Figure 14-15. | Log-Probability Plots of Zn Samples Within Interpreted Zones | 66 |
| Figure 14-16. | Point Plots of Cu vs Zn Grades | 66 |
| Figure 14-17. | Histograms of Vein True Thickness Values | 67 |
| Figure 14-18. | Sample Length Histograms by Zone | 67 |
| Figure 14-19. | Log-Probability Plots for Composites - Cu | 69 |
| Figure 14-20. | Log-Probability Plots for Composites – Zn | 69 |
| Figure 14-21. | RD – Cu Experimental Isotropic Variograms | 71 |
| Figure 14-22. | H2 - Cu Experimental Isotropic Variograms | 71 |
| Figure 14-23. | Plan of Model Prototypes | 73 |
| Figure 14-24. | Example Cross-Section – RD | 74 |
| Figure 14-25. | Example Cross-Section – H2 | 75 |
| Figure 14-26. | Example Cross-Section – SM | 75 |
| Figure 14-27. | Swath Plots – Cu | 78 |
| Figure 23-1. | Plan of Sulis Green Future License Areas | 84 |
| Figure 23-2. | Plan of VMS Exploration License Areas | 85 |
| Adam Wheeler | 20th May 2025 |
| Technical Report on the Mineral Resources of the Sulitjelma Project | 9 |
1 SUMMARY
1.1 Overview
Mr. Adam Wheeler, (C. Eng, Eur Ing.) was retained by Blue Moon Metals Inc. (“Blue Moon”), a TSX Venture Exchange listed (TSX-V.: MOON) company focused on the exploration and development of deposits in Norway and the USA, to prepare an independent Technical Report on the mineral resources of the Sulitjelma Project located in Nordland County, northern Norway. Sulitjelma Project is a former producer and a potential underground copper mining project. This Technical Report conforms to National Instrument 43-101 Standards of Disclosure for Mineral Projects (NI 43-101). The Author has visited the Project on December 2nd, 2024. He also visited the central Norwegian core facility at the Norwegian Geological Survey (NGU), Lokken, on December 3rd, 2024, to inspect drill hole core from Sulitjelma.
The overall Sulitjelma Projects was former underground mining operations, occurring from 1891 – 1991. The mineral resource estimate described in this report reflects all the drilling data currently available. It should be noted that there are several different orebodies on the Sulitjelma Project, with one overall region measuring approximately 7km by 2km, and another smaller region about 3km away, measuring approximately 2km by 1km. The mineral resource estimation described here has focused on four deposit regions.
Resource estimation work was done using the Datamine mining software system, Studio RM, Version 2.1.125.0.
1.2 Ownership
Nye Sulitjelma Gruver (“NSG”) has 14 extraction licences and 16 exploration licences covering the Sulitjelma deposit areas within the Nordland district. Part of the Sagmo area is inside the Junkerdal National Park. Otherwise there are no protected areas for the other parts of the deposit.
Blue Moon acquired 100% of the issued and outstanding shares of NSG pursuant to a share purchase agreement dated December 19, 2024. As consideration, Blue Moon issued 56,079,997 common shares of Blue Moon to former NSG shareholders, who will also receive US$3M in cash milestone payments related to permitting for tailings discharge followed by receipt of the operating permit for the Sulitjelma Project.
1.3 Geology and Mineralisation
The volcanogenic massive sulphide (“VMS”) sulphide deposits at Sulitjelma Project are situated at the contact between submarine basalts and overlying sediments and they are interpreted to have been formed by volcanic-associated hydrothermal sedimentary exhalative processes on the Ordovician seafloor within a fault-controlled basin and are classified as being of Cyprus type VMS deposit.
Each deposit has a well-developed subjacent zone of hydrothermal alteration, the core of which appears abnormally enriched in potassium relative to the surrounding strata. Distinct mineralization facies are recognised as products of primary hydrothermal alteration, regional amphibolite-grade metamorphism and accompanying tectonic deformation. The widespread brecciation associated with the mineralised zones can partly explained by tectonism, but it may also be evidence of a cyclic catastrophic stage, during the evolution of the enclosing basalts.
| Adam Wheeler | 20th May 2025 |
| Technical Report on the Mineral Resources of the Sulitjelma Project | 10 |
The overall district hosting the Sulitjelma Project is about 100 km2 in size, containing about 25 individual deposits. The VMS deposits are tabular and elongated, reaching 1,200 m in length and 300 m in width, typically dipping between 10 degrees and 45 degrees. The high-grade parts of the deposits that were mined historically rarely exceeded 5 m in thickness and typically averaged 2 m.
The mineralised zones typically consist of massive pyrite, pyrrhotite, chalcopyrite and sphalerite. Mineralisation can also be semi-massive, brecciated as well as disseminated. Well-known in the Sulitjelma Project area are large, rounded pyrite crystals, within a matrix of chalcopyrite, sphalerite and pyrrhotite.
Historically, the bulk of the material extracted at Sulitjelma Project was in what is known as the Northern Ore Field located north of Lake Langvann. The current resource estimation includes the Rupsi/Dypet and Hankabakken deposits, which are part of this Northern Ore Field. The other zone being evaluated in the current study is the Sagmo deposit, which is in the Southern Ore Field, south of Lake Langvann.
1.4 Database and Resource Estimation
In 2021, Norwegian geologists started to compile all available drill hole information and its related data, into Excel spreadsheets. The compiled information was transferred to Datamine, as separate .csv files for collar coordinates, drill hole survey data, assay results and lithology logs. After import of these data sets into Datamine, the different assay, collars and survey data files were combined into individual single files for each zone for work in 3D.
For the Sulitjelma Project, complete sets of data from 601 diamond drill holes have been collated, covering 78,144 m. Of these, 286 diamond drill holes have intersected mineralisation for the three regions which have been evaluated in the current study. 51 of these holes were drilled from surface, with the other 235 holes being drilled from underground.
The drilling data was then used to develop a sectional interpretation of mineralised intersections, based on lithology as well as a cut-off of broadly 0.3% CuEq. The interpreted zones have been extrapolated a maximum distance of approximately 100 m beyond the furthest intersection, both laterally and down-dip, from the outer-most drill hole intersections. The drilling grid spacing used was generally 200 to 250 m, so the extrapolation distance is generally half of the typical grid spacing.
Three separate block models were developed, for the Rupsi/Dypet, Hankabakken and Sagmo deposits. For each deposit, the same modelling methodology was applied. A digital terrain model (DTM) was generated, based on the centre points on each drill hole intersection. Approximate apparent thickness values were then estimated and used to develop a three-dimensional block model of each zone. Composite grades for copper and zinc were then estimated, based on inverse-distance weighting (squared). The previously exploited areas were allocated as mined by using perimeters from historical mine plans. These mined-out areas are therefore excluded from the current mineral resource estimation in this report.
| Adam Wheeler | 20th May 2025 |
| Technical Report on the Mineral Resources of the Sulitjelma Project | 11 |
1.5 Exploration Status
The Sulitjelma Project is at development stage, and Blue Moon is evaluating a restart of operations of this historical producer. Historical diamond drilling was carried out between 1945 and 1988, during which operators completed 816 core drill holes for a total of 137,700 m. Other exploration work in the Sulitjelma Project area has included ground and airborne geophysical studies, geological mapping, outcrop and mine dump grab sampling, and regional lithogeochemical rock sampling for rocktype fingerprinting. In addition to the 25 deposits that have been identified, there are several mineralized occurrences both around the deposits and regionally that are either untested or only supported by limited drilling. This means that additional infill and exploration drilling is warranted to more fully test favourable stratigraphy both around the deposits and regionally.
Blue Moon has not yet done any active exploration work on the Sulitjelma Project since acquiring the property but is developing plans to do so.
The current exploration plan is to extend the existing Rupsi tunnel by approximately 1 km. From this new development access underground, a diamond drilling program of 10,000 m is planned. The new drilling data is expected to greatly assist with further geological and geotechnical modelling.
1.6 Mineral Resource Estimation
This Mineral Resource Estimation (“MRE”) work was carried out and prepared in compliance with Canadian National Instrument 43-101, and the mineral resources in this estimate were calculated using the Canadian Institute of Mining, Metallurgy and Petroleum (CIM), CIM Standards on Mineral Resources and Reserves, Definitions and Guidelines prepared by the CIM Standing Committee on Reserve Definitions and adopted by CIM Council May 10th, 2014.
Conforming with guidelines for “reasonable prospects for eventual economic extraction”, constrained evaluations were completed using a Mineable Shape Optimiser (MSO) to generate wireframes.
This mineral resource estimate of the Sulitjelma deposit is summarised in Table 1-1, related to a cut-off grade of 0.6% CuEq and a minimum thickness of 2.2 m.
| Adam Wheeler | 20th May 2025 |
| Technical Report on the Mineral Resources of the Sulitjelma Project | 12 |
Table 1-1. Sulitjelma Deposit Resource Estimation Summary
Effective Date: 20th February 2025
| Inferred Resources | ||||
| Deposit | Tonnes | Cu | Zn | Cu_Eq |
| Kt | % | % | % | |
| Rupsi | 7,874 | 1.18 | 0.33 | 1.23 |
| Dypet | 1,384 | 1.23 | 0.20 | 1.27 |
| Hankabakken II | 4,955 | 0.88 | 0.06 | 0.89 |
| Sagmo | 2,853 | 0.98 | 0.16 | 1.00 |
| Total | 17,066 | 1.06 | 0.21 | 1.10 |
Notes:
| 1. | CIM definitions were followed for MRE. |
| 2. | All resources reported are categorised Inferred; there are no Measured or Indicated resources. |
| 3. | A minimum mining thickness of 2.2 m was applied in making the MRE constraint wireframes. |
| 4. | The MRE constraint wireframes were generated using a preliminary MSO, based on a cut-off grade of 0.6% Cu_Eq, related to potential underground mining. |
| 5. | Assumed parameters for the cut-off grade and Cu-equivalent (Cu_Eq) calculations included: |
| Prices: | USD4.20/lb Cu, USD1.25/lb Zn |
| Processing recoveries: | 92% Cu, 57% Zn |
| Payabilities: | 96.5% Cu, 86% Zn |
| 6. | For the cut-off grade calculation, the assumed total operating cost was $50/t of ore. |
| 7 . | A global density value of 3 t/m3 was assumed. |
| 8. | Rounding may result in apparent summation differences between tonnes, grades and metal content; not considered material. |
| 9. | Mineral Resources are not Mineral Reserves and do not have demonstrated economic viability. |
| Adam Wheeler | 20th May 2025 |
| Technical Report on the Mineral Resources of the Sulitjelma Project | 13 |
1.7 Results and Interpretations
There are several opportunities to improve the current results presented in this report, which should be investigated further as part of the ongoing development of the Sulitjelma Project. Most of the deposits evaluated in this mineral resource estimation have some parts that are densely sampled, notably in areas in or close to the old underground workings. Going down-dip, the drill hole spacings are generally much wider, with more reliance on much longer underground drill holes, often with very poor intersection angles, or on relatively few surface drill holes.
Further drilling campaigns would therefore have a significant effect on the development of the project, in terms of:
| · | The use of twin drill holes to help verify all or part of the historical drilling data. |
| · | Potentially increase Inferred category material through additional drilling both down-dip and along-strike. |
| · | Decreasing drill spacing would greatly help in the estimation of Indicated category material. To achieve Indicated resource categorisation using any of the historical drill hole data, the results from twin drilling would have to help verify the use of all or part of the historical drill hole database. |
1.8 Conclusions
The updated mineral resource estimate as of February 20th, 2025, has these conclusions from the Author, which are as follows:
| · | The Sulitjelma mine processed approximately 26 Mt of ore over just under 100 years of production, with average grades of 1.80% Cu and 0.82% Zn. Approximately 10 Mt of ore were produced from zones nearby to the zones which have been evaluated in the current study. |
| · | The geological setting and character of the VMS mineralization identified to date on the Sulitjelma Project are of sufficient enough to justify additional exploration expenditures. |
| · | Most drill holes in the current database are related to the mineral resources at Sulitjelma Project in the four deposits, totalling 601 core drill holes for 78,144 metres. There is no core on site, but at the NGU core inventory at Lokken, approximately 19,330m Sulitjelma core are stored, from 469 holes that were drilled in and around the Sulitjelma zones being considered in this study. |
| · | Drilling has identified extensive, conformable, metasediments and metavolcanics with quite distinct mineralized zones, that remain open with respect to further exploration, and which in some areas have been mined extensively in the past. |
| · | The drilling related to the zones being currently evaluated took place between 1952 and 1988, while the mine was in production. There is very little information available about the drilling, sampling, sample preparation and analysis procedures. Similarly, there is almost no QAQC data available. |
| · | Very little data is available for rock density measurements. |
| · | Due to the proximity of the underground workings and the geometry of the deposit, many of the underground drill hole intersection angles are very poor, which complicates geological modelling. |
| Adam Wheeler | 20th May 2025 |
| Technical Report on the Mineral Resources of the Sulitjelma Project | 14 |
| · | Because of these factors, the author has assigned all of the current resource estimation to the Inferred category. |
1.9 Recommendations
1.9.1 Sample Preparation, Analyses, and Security
| · | QAQC Program. A rigorous quality control and quality assurance (“QAQC”) policy needs to be developed for standards, blanks and duplicate samples, for all on-going drilling and sampling work. This QAQC program will also need to use certified reference material (“CRM”) samples with similar lithologies and Cu/Zn grades to Sulitjelma Project. |
| · | Core Shack. A secure premises will be required for core logging and storage of drill core, as well as all returned pulp and reject material from the analytical laboratory. |
| · | Density Measurement equipment and procedures need to be set-up for any new drilling as well as check density measurements of historical core at Lokken. |
1.9.2 Data Verification
| · | Relogging of Drill Core. A relogging program should be completed of Sulitjelma Project historical drill core stored at Lokken. This work would be more extensive than any previous relogging exercise; noting that relogging will be difficult, as much of the core is extremely dirty. If possible, some check sampling should also be completed while relogging is ongoing, although in most cases there is little, or no drill core left in the core boxes from the originally sampled intersections. As well, additional sampling of previously unsampled drill core should be done, noting that at current cut-off levels for the mineral resource estimate, there are potentially extended or new mineralised intersections that could warrant follow-up. |
| · | Drilling Database. The current database needs to be enhanced so that YEAR identification data is recorded for each drill hole. This is very important, as in on-going verification and estimation work, it may be necessary to filter the historic data with relation to the date of age of the data available. |
| · | Twin Drilling. A twin drilling program should be completed during the next work program, to help verify all or part of the historical drilling data for each deposit. NSG have already planned the extension of an existing underground adit, the Rupsi tunnel, for the purpose of providing drilling access. A suggested starting proportion of twinning could be 5%, with respect to historic drill holes for each deposit. When the assay results are returned from the laboratory and analysed, it can be determined if and where further twin drilling would be required. |
| · | Drill Hole Collars. During summer, historic surface drill hole collars should be found and resurveyed, where possible. Depending on the extent of underground access, the location and resurveying of underground drill hole collars should also be attempted. |
| · | Mined-Out Extents. Depending on underground access, surveys should be made of mined-out areas adjacent to the evaluated resources. Modern equipment, including the use of drones, could help with this check survey process. |
| · | Metallurgical Program. A full metallurgical audit should be undertaken regarding the production recoveries and any reports on file. Once there is new material available from drilling that is representative of the deposits, a new metallurgical program should be planned to encompass flotation test work, variability analysis, and lock cycle testing to ensure process design in the plant is setup for maximizing metal recovery. |
| Adam Wheeler | 20th May 2025 |
| Technical Report on the Mineral Resources of the Sulitjelma Project | 15 |
1.9.3 Exploration Program and Budget
For further development of the project, the Author recommends implementation of an exploration program. This work covers extension of the existing Rupsi tunnel by 1 km, in order to allow access, and then using of this new tunnel access to complete approximately 10,000 m of diamond drilling from underground. The intent of the drilling is to enable potentially increasing confidence in the resources in the Rupsi deposit, with upgrading of some material from an Inferred category to an Indicated category.
A summary breakdown of this work program is presented below, along with associated estimated costs expected to total approximately 4.6 M USD (Table 1-2).
Table 1-2. Proposed Budget
| Work Planned | Cost |
| M USD | |
| Extension of Rupsi Tunnel (1 km) | 3.4 |
| Diamond drilling (~10,000 m) | 1.2 |
| Total | 4.6 |
| Adam Wheeler | 20th May 2025 |
| Technical Report on the Mineral Resources of the Sulitjelma Project | 16 |
2 INTRODUCTION
2.1 Author
This report was prepared by qualified person (QP) Adam Wheeler (C. Eng, Eur Ing, Fellow, Institute of Materials, Minerals and Mining) – herein referred to as the Author. He is an independent mining consultant and worked with assistance from Blue Moon technical personnel; to present updated mineral resource estimates as of February 20th, 2025. Adam Wheeler’s involvement with Sulitjelma started in 2021, with a site visit on 2nd December 2024 (1 Day). He also reviewed various drill core from Sulitjelma at the NGU core storage facilities in Løkken, on 3rd December 2024 (1 Day).
2.2 Terms of Reference
This independent Technical Report was commissioned by Blue Moon in connection with its acquisition of Nye Sulitjelma Gruver AS (NSG), and completed by the Author, an independent mining consultant. Blue Moon, Nussir ASA (“Nussir”) and NSG announced that they have entered into separate share purchase agreements on December 19, 2024, pursuant to which Blue Moon agreed to acquire all of the issued and outstanding common shares of Nussir and NSG. Both Nussir and NSG are private Norwegian companies with properties in northern Norway. Upon closing, Blue Moon acquired a 93.55% interest in Nussir for US$51.7M and a 100% interest in NSG for US$12M, both of which were satisfied in common shares of Blue Moon (the “Blue Moon Shares”) at a deemed price of C$0.30 per Blue Moon Share. Former NSG shareholders will also receive US$3M in cash milestone payments (the “Cash Milestone Payments”) related to permitting for tailings discharge followed by receipt of the operating permit for the Sulitjelma Project. For additional details, please refer to Blue Moon’s news releases dated November 27, 2024, December 19, 2024 and February 27, 2025 (available on Blue Moon’s profile in SEDAR+ at www.sedarplus.ca).
The Author was previously retained by NSG to provide initial resource estimations during 2021 and 2022. The mineral resources presented herein have used resource block models generated from these periods, but with the evaluation updated so as to provide results according to 43-101 guidelines.
The Author has subsequently been retained by Blue Moon to provide an independent Technical Report on the Mineral Resources for the Sulitjelma Project that meets the provisions of CIM - Standards of Disclosure for Mineral Projects. The purpose of this current report is to provide an independent Technical Report in conformance with the standards required by NI 43-101 and Form 43-101F1. The estimate of mineral resources contained in this report conforms to the CIM Mineral Resource and Mineral Reserve definitions (May 2014) referred to in NI 43-101.
Based on the Property visits and review of the available literature and data, the Author takes responsibility for the information herein.
This Report is a compilation of proprietary and publicly available information. In support of the technical sections of this Report, the Author has independently reviewed reports, data, and information derived from work compiled by NSG as well as relevant geological publications, as listed in Section 27. These were used to verify background geological information regarding the regional and local geological setting and mineral deposit potential of the Property. The Author has deemed these reports, data, and information to be valid contributions, to the best of his knowledge. In addition to the site visit, Adam Wheeler reviewed available literature and documented results concerning the project and held discussions with technical personnel of Blue Moon.
| Adam Wheeler | 20th May 2025 |
| Technical Report on the Mineral Resources of the Sulitjelma Project | 17 |
2.3 Units and Currency
All measurement units used in this report are metric, and currency is expressed in US Dollars, unless stated otherwise. A conversion rate of 10.45 Norwegian NOK to 1 USD has been used.
3 RELIANCE ON OTHER EXPERTS
For this report, the Author has relied on ownership information provided by Blue Moon. The Author has relied on Blue Moon with respect to the validity of the mineral title for tenure associated with the Sulitjelma Project.
The Author has relied on Blue Moon for guidance on applicable taxes, royalties, and other government levies or interests, applicable to revenue or income from the Project.
4 PROPERTY DESCRIPTION AND LOCATION
4.1 Location
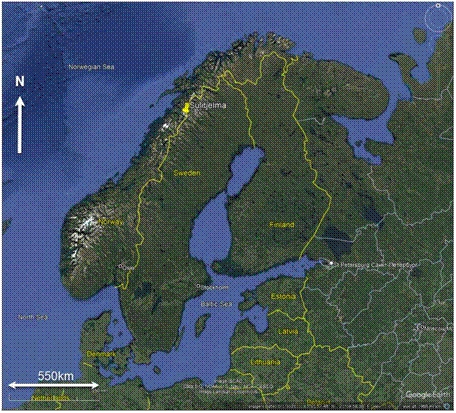
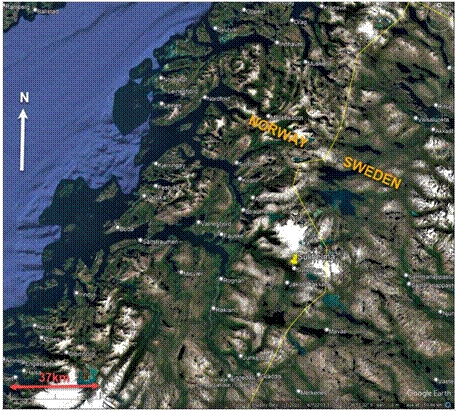
The Sulitjelma Project is located in Northern Norway, at Latitude 67o 8’ 11’’ and Longitude 16o 4’ 30’’. It is approximately 74 km due east of the city of Bodø on the west coast of Norway and it is approximately 14 km west of the border between Norway and Sweden. Sulitjelma Project is approximately 31 km east of the portal town of Fauske, and approximately 31 km to the south-east of the Straumen container port.
The position of Sulitjelma Project is shown in Figure 4-1 and Figure 4-2.
| Adam Wheeler | 20th May 2025 |
| Technical Report on the Mineral Resources of the Sulitjelma Project | 18 |
Figure 4-1. Overall Map of Sulitjelma Location
Figure 4-2. Northern Norway Map of Sulitjelma Location
| Adam Wheeler | 20th May 2025 |
| Technical Report on the Mineral Resources of the Sulitjelma Project | 19 |
4.2 Licenses
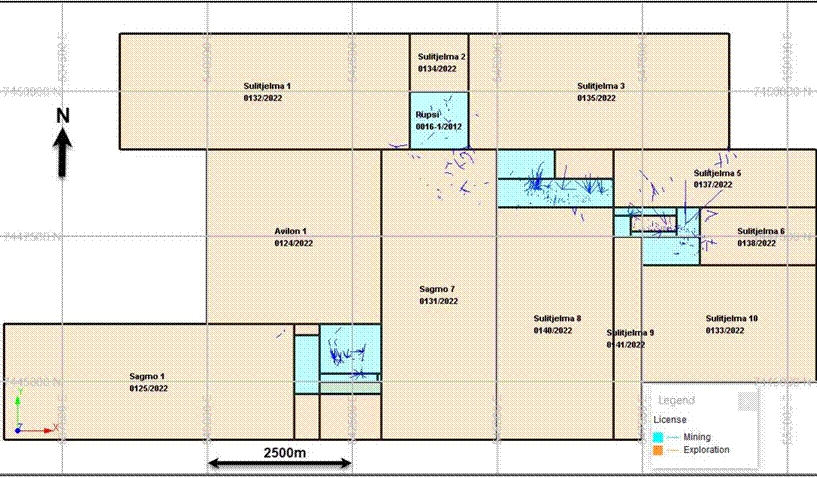
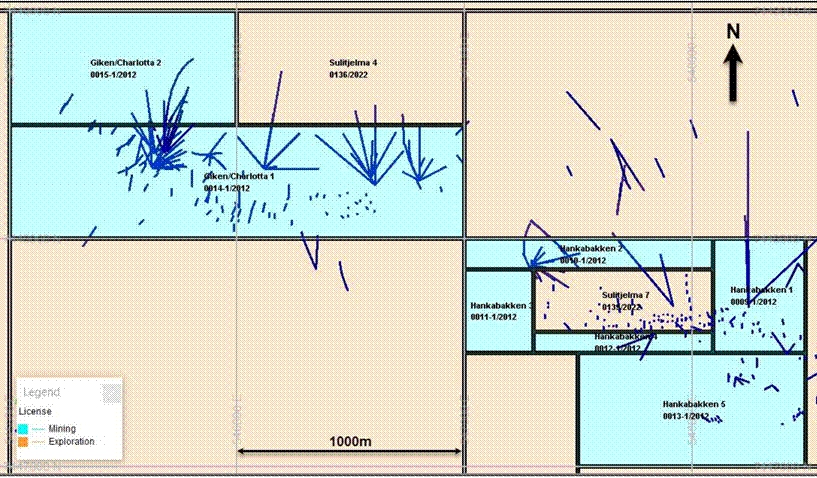
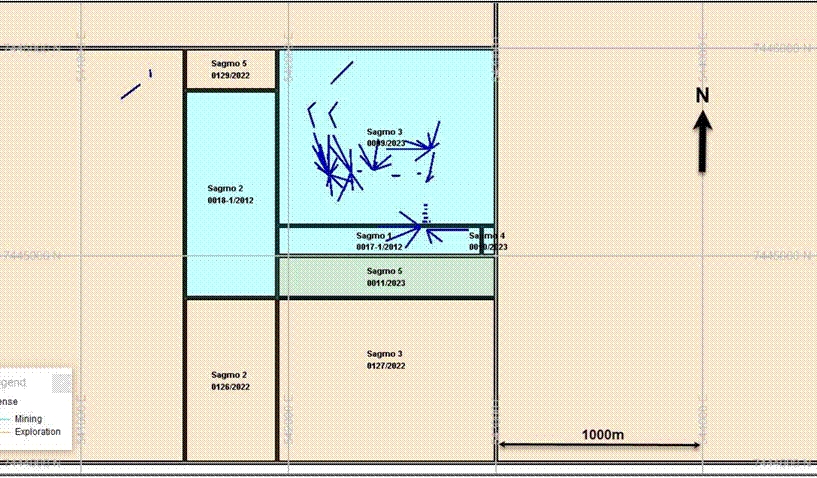
The main license areas held by NSG are shown in Figure 4-2 and they are summarised in Table 4-1. All the deposits in the current study are covered either by the Mining Rights or Exploration Rights licenses referenced herein; noting that all the licenses listed in Table 4-1 relate to minerals that contain copper, zinc, gold or silver. The licenses are all registered within the Fauske Kommune, in the county of Nordland. The Project covers approximately 4,980 hectares in total, of which 624 hectares are covered by NSG’s Mining Rights.
NSG does not currently own any property or land. However, they have an option to buy the old mine buildings and its associated land from the local community.
The company VMS Exploration have Exploration Rights licenses that overlap the NSG’s licenses, but they do not have any Mining Rights licenses in the Sulitjelma area.
Table 4-1. Summary of License Areas
| Name | License Code | Type of rights | Holder | Expiration Date | Area m2 |
| Hankabakken 1 | 0009-1/2012 | Mining rights | Sulitjelma Mineral AS | 2028-12-31 | 203,000 |
| Hankabakken 2 | 0010-1/2012 | Mining rights | Sulitjelma Mineral AS | 2028-12-31 | 146,596 |
| Hankabakken 3 | 0011-1/2012 | Mining rights | Sulitjelma Mineral AS | 2028-12-31 | 111,264 |
| Hankabakken 4 | 0012-1/2012 | Mining rights | Sulitjelma Mineral AS | 2028-12-31 | 71,890 |
| Hankabakken 5 | 0013-1/2012 | Mining rights | Sulitjelma Mineral AS | 2028-12-31 | 500,000 |
| Giken/Charlotta 1 | 0014-1/2012 | Mining rights | Sulitjelma Mineral AS | 2028-12-31 | 1,000,000 |
| Giken/Charlotta 2 | 0015-1/2012 | Mining rights | Sulitjelma Mineral AS | 2028-12-31 | 500,000 |
| Rupsi | 0016-1/2012 | Mining rights | Sulitjelma Mineral AS | 2028-12-31 | 1,000,000 |
| Sagmo 1 | 0017-1/2012 | Mining rights | Sulitjelma Mineral AS | 2028-12-31 | 140,012 |
| Sagmo 2 | 0018-1/2012 | Mining rights | Sulitjelma Mineral AS | 2028-12-31 | 448,000 |
| Diamanten A | 0016-1/2015 | Mining rights | Sulitjelma Mineral AS | 2029-12-31 | 1,000,000 |
| Sagmo 3 | 0009/2023 | Mining rights | Nye Sulitjelma Gruver AS | 2033-12-31 | 900,000 |
| Sagmo 4 | 0010/2023 | Mining rights | Nye Sulitjelma Gruver AS | 2033-12-31 | 10,000 |
| Sagmo 5 | 0011/2023 | Mining rights | Nye Sulitjelma Gruver AS | 2033-12-31 | 210,000 |
| Sagmo 1 | 0125/2022 | Exploration rights | Nye Sulitjelma Gruver AS | 2029-12-31 | 3,000,000 |
| Sagmo 2 | 0126/2022 | Exploration rights | Nye Sulitjelma Gruver AS | 2029-12-31 | 357,056 |
| Sagmo 3 | 0127/2022 | Exploration rights | Nye Sulitjelma Gruver AS | 2029-12-31 | 868,000 |
| Sagmo 5 | 0129/2022 | Exploration rights | Nye Sulitjelma Gruver AS | 2029-12-31 | 91,000 |
| Sagmo 7 | 0131/2022 | Exploration rights | Nye Sulitjelma Gruver AS | 2029-12-31 | 10,000,000 |
| Avilon 1 | 0124/2022 | Exploration rights | Nye Sulitjelma Gruver AS | 2029-12-31 | 6,000,000 |
| Sulitjelma 1 | 0132/2022 | Exploration rights | Nye Sulitjelma Gruver AS | 2029-12-31 | 3,000,000 |
| Sulitjelma 10 | 0133/2022 | Exploration rights | Nye Sulitjelma Gruver AS | 2029-12-31 | 5,000,000 |
| Sulitjelma 2 | 0134/2022 | Exploration rights | Nye Sulitjelma Gruver AS | 2029-12-31 | 1,000,000 |
| Sulitjelma 3 | 0135/2022 | Exploration rights | Nye Sulitjelma Gruver AS | 2029-12-31 | 5,000,000 |
| Sulitjelma 4 | 0136/2022 | Exploration rights | Nye Sulitjelma Gruver AS | 2029-12-31 | 500,000 |
| Sulitjelma 5 | 0137/2022 | Exploration rights | Nye Sulitjelma Gruver AS | 2029-12-31 | 2,000,000 |
| Sulitjelma 6 | 0138/2022 | Exploration rights | Nye Sulitjelma Gruver AS | 2029-12-31 | 1,000,000 |
| Sulitjelma 7 | 0139/2022 | Exploration rights | Nye Sulitjelma Gruver AS | 2029-12-31 | 217,250 |
| Sulitjelma 8 | 0140/2022 | Exploration rights | Nye Sulitjelma Gruver AS | 2029-12-31 | 4,000,000 |
| Sulitjelma 9 | 0141/2022 | Exploration rights | Nye Sulitjelma Gruver AS | 2029-12-31 | 1,750,000 |
| Adam Wheeler | 20th May 2025 |
| Technical Report on the Mineral Resources of the Sulitjelma Project | 20 |
Figure 4-3. Plan of License Areas - Overall
[Source: Norwegian Directorate of Mining]
| Adam Wheeler | 20th May 2025 |
| Technical Report on the Mineral Resources of the Sulitjelma Project | 21 |
Figure 4-4. Plan of License Areas – North
| Adam Wheeler | 20th May 2025 |
| Technical Report on the Mineral Resources of the Sulitjelma Project | 22 |
Figure 4-5. Plan of License Areas – South
| Adam Wheeler | 20th May 2025 |
| Technical Report on the Mineral Resources of the Sulitjelma Project | 23 |
4.3 Fees and Royalties
Under the Norwegian Minerals Act, metals with a specific gravity of 5 g/cm³ or higher, including copper and zinc, are classified as state-owned minerals. These metals, which are of primary economic interest at Sulitjelma Project, require compensation to the state through payment of yearly fees to uphold the extraction and exploration permits. The fees are calculated based on the size of the areas in question and must be paid within 15th January each year.
Further, all extraction of state-owned minerals requires payment of an annual fee of 0.5% of the sales value of the extracted minerals to the landowner. In addition, an increased landowner fee of 0.5% is mandated for projects in Nordland County.
Blue Moon must pay a fee equivalent to 0.75% of the sales value of extracted minerals. The basis for calculating the fee will in general be the extractor's sales revenue (excluding VAT) from the sale of extracted quantities and quantities that potentially have sales value, but which the extractor processes on their own or otherwise utilizes without making a sale. The annual fee will be due for payment by March 31 of the following year.
4.4 Environmental Liabilities
The Sulitjelma project currently has no environmental liabilities, since any impact from historical mining operations rest with the Norwegian Government.
A permit for restart of initial mining activities must be acquired to conduct the exploration work described in Section 26.3. This permit has been applied for and the status of this application is expected during 2025. Apart from this, the Author is not aware of any other significant factors and risks that may affect access, title, or the right or ability to perform work on the property.
| Adam Wheeler | 20th May 2025 |
| Technical Report on the Mineral Resources of the Sulitjelma Project | 24 |
| 5 | ACCESSIBILITY, CLIMATE, LOCAL RESOURCES, INFRASTRUCTURE AND PHYSIOGRAPHY |
5.1 Accessibility
There is an International Airport in Bodø on the west coast, with national and international flights daily. Bodø is 91 km by road to Sulitjelma. The European Highway E6 goes through the Municipal Center of Fauske. From here the regional #630 road goes eastward to Sulitjelma (38 km). This road is built for transport and is of a high standard and asphalted.
Established container port of Straumen can accommodate large ships and has weekly port calls. Straumen is a 54 km drive from Sulitjelma. The port in Fauske can be used for larger ships.
Fauske and Straumen are both ice-free during winter, making sea transport of supplies and export of concentrate directly to and from the site possible year-round.
5.2 Site Description
Sulitjelma is an old mining village, in Fauske Municipality in Nordland County, Norway. It is situated in a lush inland valley at an elevation of 140 metres (460 ft) above sea level. Most of the existing residences as well as the old mine infrastructure is located on the north and eastern banks Langvatnet lake. The lakes Lomivatnet, Kjelvatnet and Muorkkejávrre are located to the east and south of the village.
The 0.53-square-kilometre (130-acre) village of Sulitjelma has a population (2023) of 399.
Sulitjelma is virtually surrounded by mountains and glaciers. Sulitjelma is at the southern terminus of the Nordkalottruta hiking trail. There is a road connection to the town of Fauske, which is located approximately 31 km to the west. Winters in Sulitjelma have reliable snow cover that are on average 2 °C colder than in the town of Fauske. Sulitjelma Church and Sulitjelma Chapel are both located in the village. There are many historical mines in the area.
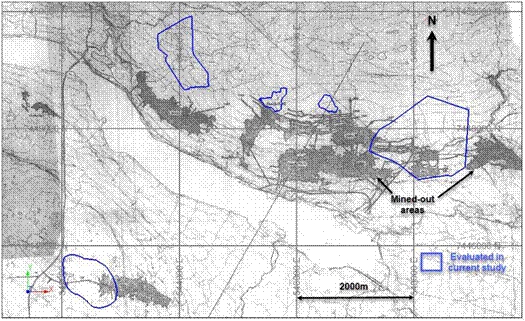
Most of the entrances to the historical mining areas are from horizontal adits heading north off the northern bank of Langvann lake. There are also the historical Sagmo mine workings approximately 2 km south of the lake. Plans of local Sulitjelma area, relative to the historical mine workings and old plant infrastructure, are shown in Figure 5-1 and Figure 5-2. The topography rises at about 10 degrees on the south side of the lake, and at about 27 degrees on the north side.
| Adam Wheeler | 20th May 2025 |
| Technical Report on the Mineral Resources of the Sulitjelma Project | 25 |
Figure 5-1. Plan of Local Sulitjelma Area
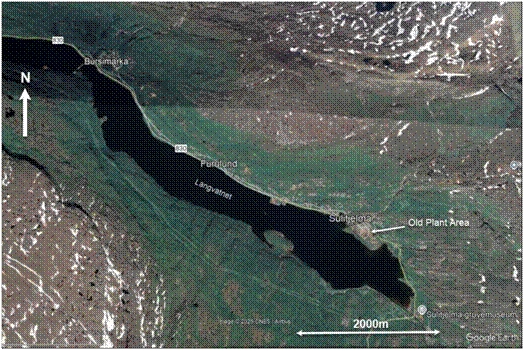
Figure 5-2. Plan of Sulitjelma and Old Mine Workings
| Adam Wheeler | 20th May 2025 |
| Technical Report on the Mineral Resources of the Sulitjelma Project | 26 |
5.3 Climate
Sulitjelma Project is located inside the Arctic Circle and has 24-hours of daylight from early May to the beginning of August with midnight sun between the beginning of June to the second week of July. The area has polar night for part of December because it has sunrise at 11 am and sunset before noon each day.
Average 24-hour temperatures at Sulitjelma Project range from -5o C in February to approximately from 12o C in July. Moderate summer temperatures normally last from May to September. Daytime temperatures are usually significantly warmer than the 24-hr average from March to September, while there is very little diurnal temperature variation from November to early February, as the sun is very low or below the horizon most of the day.
Precipitation is heaviest from September to March, often as snow, typically over 130 mm a day in this period. The average annual precipitation is approximately 1 m.
The Project is operable year-round.
5.4 Local Resources
There is a small local tourist industry in Sulitjelma, with a mining museum and trips along one of the remaining mine tunnels. Sulitjelma is at the southern terminus of the Nordkalottruta hiking trail. There is production of sapphire glass at the industrial area in Sandnes, near to the old processing plant.
The Langvann lake is a potential location for future tailings placement.
The town of Fauske, 31 km to the west, has a population of approximately 10,000 and it has many different types of manufacturing companies.
5.5 Infrastructure
There is paved road access all the way to Sulitjelma. There are still many buildings and infrastructure on site, from the former mining operations, that could be useful for any restart of mining operations. NSG have the exclusive right to buy the former process plant at a very low price. Along with the permit for restart of mining operations (which has been applied for) this will give NSG sufficient surface rights for mining and processing operations, as well as access to water, power and potential waste and tailings disposal areas.
Outotec completed a historical Preliminary Feasibility Study on Sulitjelma in 2013. This included cost estimation of developing a new plant. Outotec visited the site twice during this period, and concluded that the old process buildings remain in relatively good condition, and a new processing plant could be developed using existing conveyor tunnels and premises with only minor adjustments, such as drilling holes and grouting.
For mobile telecommunications there is a 5G network widely available in the Mine area and Fauske.
There is a local hospital in Fauske (31 km east of Sulitjelma) and a regional hospital in Bodø (74 km due east of Sulitjelma).
| Adam Wheeler | 20th May 2025 |
| Technical Report on the Mineral Resources of the Sulitjelma Project | 27 |
The main industries in Fauske include tourism, energy, marble and dolomite quarries. The main industries in Bodø include energy, construction and aviation.
5.6 Power Supply
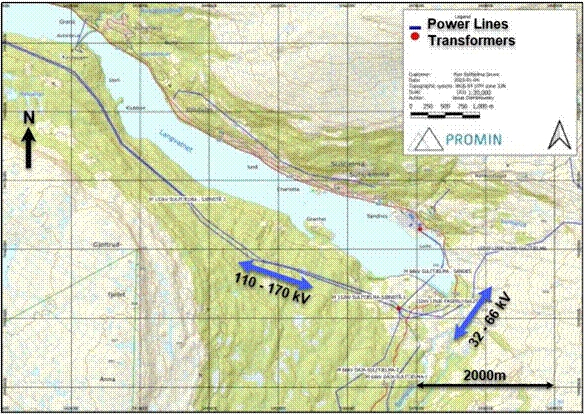
High voltage power lines are available on site, supplied by multiple hydroelectric power stations in the area. A plan of the local hydroelectric power stations is shown in Figure 5-4. A plan of the power lines and transformers is shown in Figure 5-5. The approximately W-E lines are 110-170 kV, and the approximately north-south lines are 32 – 66 kV.
In Sulitjelma, 1,072 GWh is produced annually (average production) from 5 power plants, all owned by Salten Kraftsamband (SKS). Most of the power is surplus power that is exported from Sulitjelma. Local distribution takes place via a transformer station close to the old flotation building at the Sandnes industrial area. From here, the power is distributed internally into Sulitjelma mainly through 5 kV overhead lines..
5.7 Water Supply
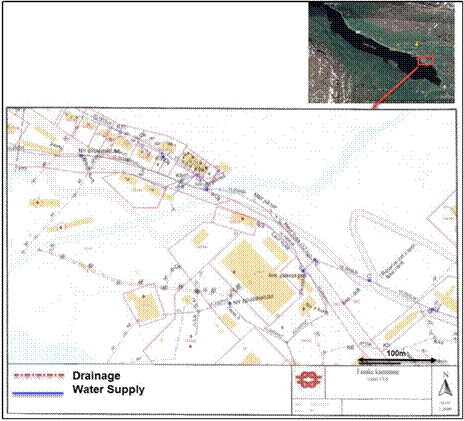
There are existing facilities for process water and potable water at site. The process water comes from the outlet water from hydropower and could be used as a supply for a processing plant. The local water supply at Sandnes, in and around the old processing plant area, is shown in Figure 5-3.
Figure 5-3. Plan of Sandnes Water Supply
| Adam Wheeler | 20th May 2025 |
| Technical Report on the Mineral Resources of the Sulitjelma Project | 28 |
Figure 5-4. Plan of Hydroelectric Power Plants in Sulitjelma Area
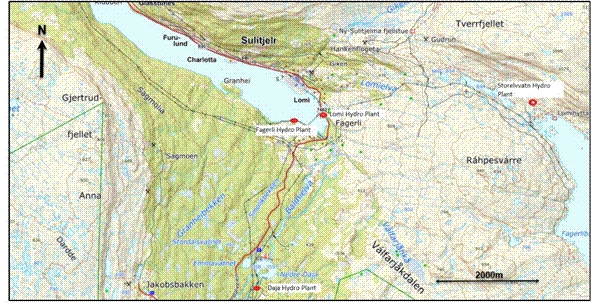
Figure 5-5. Plan of Power Lines and Transformers in Sulitjelma Area
| Adam Wheeler | 20th May 2025 |
| Technical Report on the Mineral Resources of the Sulitjelma Project | 29 |
6 HISTORY
6.1 Mining History
There have been historical mineral resources and mineral reserves that led to historical production at the Sulitjelma Project. Blue Moon is not treating any historical estimates as current mineral reserves or mineral resources.
The Author of this report has not done sufficient work to classify any historical estimate associated with the Sulitjelma Project, as current mineral reserves or mineral resources. If the Author has referred to any historical estimates, the reader is cautioned not to treat them, or any part of them, as current. The historical production summarized below are included simply to provide the reader with a complete history of the Sulitjelma Project. The Author of this report has reviewed the information in this section, as well as that within the cited references, and have determined that it is suitable for disclosure.
All stakeholders are cautioned that none are considered current and therefore should not rely on them due to being superseded by the mineral resource estimate of this report.
Copper has been mined in Norway for several hundred years, noting the first documented copper mine being the Verlohme Sohn Mine in Kongsberg 1490.
The first deposit discovered in Sulitjelma Project area was found by a Lapp, Mons Petter, in 1858. The Swedish consul Nils Persson was granted a mining lease in 1886, and after initial investigations and preliminary mining in1887, he established a mining company in 1891, the Sulitjelma Aktiebolag. The mines in the Sulitjelma Project area became the largest mining enterprise in Norway of the 20th century, with an estimate of 75,000-man years of labour. The largest number of employees was reached in 1913, amounting to 1,750. The company was reorganized in 1933, under the name of A/S Sulitjelma Gruber, and from 1937 the major shareholders were Norwegians. In 1931, a 50-year mining licence was established. In 1965, Elkem bought up to 90% ownership. In 1983, the Elkem decided that they did not want to continue mining due to low copper prices (below NOK 10/kg) and a lack of mining investment. Copper smelting ceased in 1987, which was followed by cessation of mining operations on June 28,1991. Over the production history, the mines of Sulitjelma Project produced copper, zinc and sulphur, mining 26 Mt of ore, with average grades of 1.8% Cu, 0.82% Zn and 20% S.
The copper concentrates and blister copper produced at the site might also yield some future potential benefits with respect to gold and silver. It appears that there has been no follow-up metallurgical work undertaken since this finding to further the understanding of both gold and silver in the VMS deposits that compose the Sulitjelma Project.
| Adam Wheeler | 20th May 2025 |
| Technical Report on the Mineral Resources of the Sulitjelma Project | 30 |
Table 6-1. Sulitjelma Mine Production Summary
| Grades | Content | |||||||||
| Production | ||||||||||
| Mine Unit | Start | Stop | Tonnes | Cu | Zn | S | Cu | Zn | S | Rate |
| Year | Year | Mt | % | % | % | Kt | Kt | Kt | Ktpa | |
| Jakobsbakken | 1896 | 1968 | 4.47 | 1.55 | 2.42 | 31.0 | 69 | 108 | 1,385 | 62 |
| Mons Petter | 1887 | 1912 | 0.04 | 2.78 | - | 28.6 | 1 | - | 11 | 2 |
| Giken 1 | 1892 | 1973 | 3.19 | 2.50 | 0.76 | 23.8 | 80 | 24 | 760 | 39 |
| Mons Petter 2 | 1975 | 1986 | 2.02 | 1.75 | 0.49 | 21.1 | 35 | 10 | 426 | 184 |
| Anna | 1908 | 1923 | 0.03 | 3.86 | - | 20.4 | 1 | - | 6 | 2 |
| Ny-Sulitjelma | 1893 | 1965 | 2.59 | 1.99 | 0.55 | 20.2 | 51 | 14 | 522 | 36 |
| Sagmo | 1906 | 1987 | 1.94 | 1.70 | 0.42 | 19.8 | 33 | 8 | 385 | 24 |
| Charlotta 1 | 1894 | 1971 | 1.15 | 2.31 | 0.60 | 19.0 | 27 | 7 | 219 | 15 |
| Holmsen/Gudrun | 1912 | 1961 | 0.71 | 1.49 | 0.55 | 18.4 | 11 | 4 | 130 | 14 |
| Furuhaugen | 1896 | 1921 | 0.37 | 1.65 | - | 17.5 | 6 | - | 65 | 15 |
| Giken 2 | 1961 | 1991 | 3.29 | 1.81 | 0.45 | 16.2 | 60 | 15 | 533 | 110 |
| Sture | 1904 | 1959 | 0.25 | 1.66 | 0.53 | 16.2 | 4 | 1 | 40 | 5 |
| Charlotta 2 | 1961 | 1990 | 1.83 | 1.79 | 0.49 | 15.9 | 33 | 9 | 291 | 63 |
| Hankabakken 1 | 1901 | 1981 | 1.29 | 1.44 | 0.41 | 15.1 | 19 | 5 | 195 | 16 |
| Helsingborg | 1908 | 1909 | 0.00 | 1.54 | - | 14.4 | 0.02 | - | 0.14 | 1 |
| Palmberg 1 | 1917 | 1943 | 0.04 | 1.10 | 0.50 | 13.4 | 0.47 | 0.22 | 6 | 2 |
| Hankabakken 2 | 1963 | 1988 | 0.89 | 1.22 | 0.24 | 12.3 | 11 | 2 | 109 | 36 |
| Bursi | 1902 | 1981 | 1.96 | 1.49 | 0.31 | 12.1 | 29 | 6 | 237 | 25 |
| Total | 1887 | 1991 | 26.06 | 1.80 | 0.82 | 20.4 | 470 | 214 | 5,320 | 251 |
6.2 Drilling
A summary of historic drilling at Sulitjelma Project is shown in Table 6-2. The inventories of drill core stored at the Lokken facility contains 816 diamond drill holes, totalling 137,699 m. These drill holes were completed over period of 43-years between 1945 and 1988. Specifically regarding the Sulitjelma Project area, 642 holes were completed, totalling 97,202 m, completed over a 36-year period between 1952 and 1988. From these holes, the inventory data records that 41,155 m of this core is stored at Lokken, representing 42% of the drilled total.
The database used for the mineral resource estimate described in this report contains 601 historic drill holes, totalling 78,144 m.
Table 6-2. Sulitjelma Drilling Summary
| Holes in | Drilled | ||
| DB | Length (m) | Years | |
| All | 816 | 137,699 | 1945-1988 |
| Areas Being Evaluated | 642 | 97,202 | 1952-1988 |
| Current Database | 601 | 78,144 | 1952-1988 |
The drill core diameters of the completed drill holes in the Sulitjelma Project area are summarised in Table 6-3. The data related to 10 of the holes, within the currently evaluated areas, do not have a recorded core diameter.
| Adam Wheeler | 20th May 2025 |
| Technical Report on the Mineral Resources of the Sulitjelma Project | 31 |
Table 6-3. Summary of Core Diameters
| Diameter (mm) | Holes | Proportion (%) |
| 22 | 147 | 23% |
| 32 | 251 | 40% |
| 36 (BQ) | 234 | 37% |
| Total | 632 | 100% |
6.3 Exploration
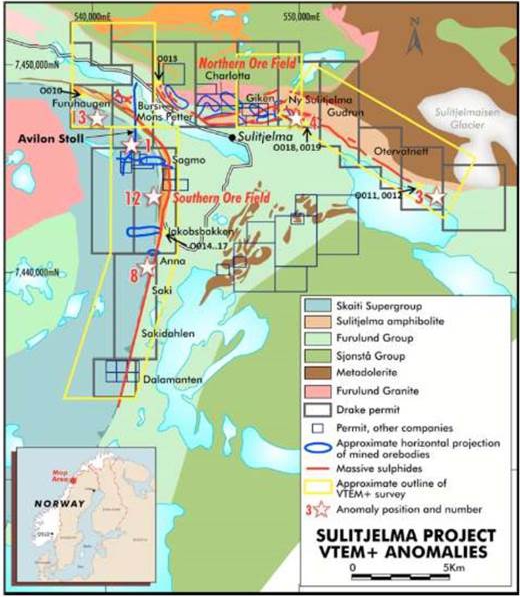
An Australian exploration company, Drake Resources, conducted exploration activities in the Sulitjelma Project area between 2014 and 2015. Initial work involved a 2014 airborne geophysical (“VTEM”) survey, which enabled identification of priority copper/zinc targets. The priority targets were then groomed through ground-based electromagnetic (EM) geophysics survey, as well as taking samples from outcrops as well as from an individual mine dump, as summarised in Table 6-4. These geophysics survey limits are shown in Figure 6-1.
Table 6-4. Summary of Drake Exploration Sample Results
| Sample | Sample Type | Weight | Easting | Northing | Cu | Zn | Pb | Ag |
| Number | Kg | % | % | % | ppm | |||
| SJV0010 | Outcrop grab | 0.84 | 540,871 | 7,448,410 | 0.84 | 0.03 | 0 | 2 |
| SJV0011 | Outcrop grab | 0.67 | 556,221 | 7,443,696 | 0.77 | 0.32 | 0 | 1 |
| SJV0012 | Outcrop grab | 1.18 | 556,201 | 7,443,694 | 0.32 | 0.10 | 0 | 1 |
| SJV0013 | Mine dump grab | 0.76 | 545,121 | 7,448,850 | 0.89 | 1.68 | 0.01 | 7 |
| SJV0014 | Mine dump grab | 1.05 | 543,440 | 7,442,355 | 0.34 | 0.02 | 0.67 | 45 |
| SJV0015 | Mine dump grab | 1.72 | 543,440 | 7,442,355 | 0.17 | 0.06 | 3.77 | 224 |
| SJV0016 | Mine dump grab | 2.11 | 543,440 | 7,442,355 | 0.20 | 0.02 | >10.00 | 645 |
| SJV0017 | Mine dump grab | 1.29 | 543,440 | 7,442,355 | 1.61 | 0.82 | 2.46 | 104 |
| SJV0018 | Mine dump grab | 1.3 | 549,493 | 7,447,319 | 4.40 | 1.19 | 0.05 | 24 |
| SJV0019 | Mine dump grab | 1.52 | 549,493 | 7,447,319 | 1.95 | 1.66 | 0.08 | 21 |
In 2014, exploration work was also carried out in the Diamanten area, which is approximately 10km south of the Sagmo deposit, as also shown in Figure 6-1. 10 samples were taken from 3 drill holes, with one sample assaying 4.7% Cu. The Diamanten area is untouched by mining, and it is within one of NSG’s mining licenses.
| Adam Wheeler | 20th May 2025 |
| Technical Report on the Mineral Resources of the Sulitjelma Project | 32 |
Figure 6-1. Plan of VTEM Survey Extents – Drake Exploration 2014
| Adam Wheeler | 20th May 2025 |
| Technical Report on the Mineral Resources of the Sulitjelma Project | 33 |
6.4 Recent Project Developments
The company Nye Sulitjelma Gruver (“NSG”) was established in 2011. The mining rights for the Nordgruvefeltet and Sagmo areas were secured by NSG in 2012.
A regulation plan was developed for the area in 2016, with a focus on impact assessment, which was approved by the Fauske municipality. In 2020, an application was made for a permit for a restart of initial mining activities in accordance with the Pollution Act and sent to the Norwegian Environment Agency. The status of this application is expected this year. Further project developments are summarised below:
| 2020 | - Start of current mineral resource estimation project work. |
| 2021 | - Start of planning for initial mining area and waste rock deposition. |
| - Acquisition of Sulitjelma Mineral (the previous owners) by NSG. |
| - NSG categorised as “pilot project” in Nordland County. |
| 2022 | - More detailed planning of Rupsi tunnel and exploration drilling. |
| - Request made for potential electric power demand of 10MW capacity. |
| 2023 | - Application to Directorate for Minerals for extension of Rupsi tunnel. NSG have received basic agreement and are expecting formal declaration. |
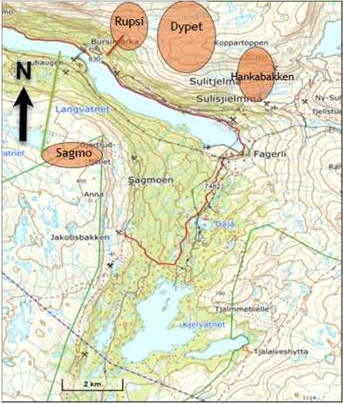
| 2024 | - Detailed Zoning Plan made for Rupsi and Avilon. Avilon is 300 m away for waste deposition. The focus of this zoning plan includes the areas shown in Figure 6-2. |
Figure 6-2. Main Areas in Project Development
| Adam Wheeler | 20th May 2025 |
| Technical Report on the Mineral Resources of the Sulitjelma Project | 34 |
7 GEOLOGICAL SETTING AND MINERALISATION
7.1 Regional Geology
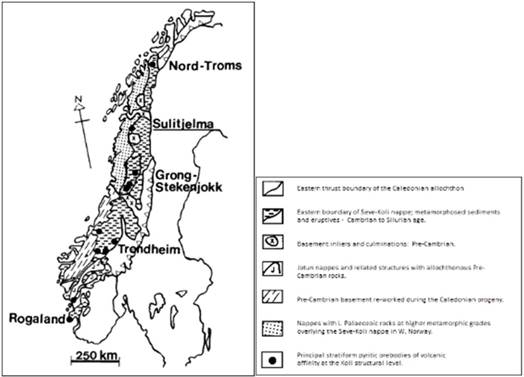
The stratigraphic sequence, which contains many Scandinavian pyritic deposits, lies in the middle and upper Köli nappes of the upper allochthon, part of the Caledonide orogen, a belt of lower Paleozoic rocks extending some 2,000 km along the western margin of the Scandinavian peninsula. The geographic location of Sulitjelma and its position within the Caledonides is shown in Figure 7-1.
The Sulitjelma region is underlain by a granitic gneiss basement of Precambrian age, which is exposed in several tectonic windows. This basement is a continuation of the Precambrian of the adjoining Baltic Shield. The Caledonian rocks above this basement are relatively thin and have been divided into several structural units, separated by early thrusts and affected by later metamorphism and folding.
Figure 7-1. Simplified Map of Scandinavian Caledonides
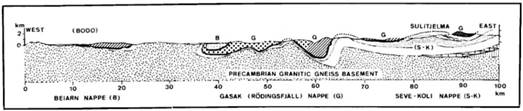
In the Sulitjelma region two nappe units have been distinguished (Figure 7-2 and Figure 7-3), of which the upper one, a varied series of metasediments, is termed the Sulitjelma Schist Sequence. The lower unit consists of amphibolites above calcareous schists and phyllites.
| Adam Wheeler | 20th May 2025 |
| Technical Report on the Mineral Resources of the Sulitjelma Project | 35 |
Figure 7-2. Outline Geological Map Scandinavian Caledonides
[Compiled by Nicholson (1969), 66oN to 68oN]
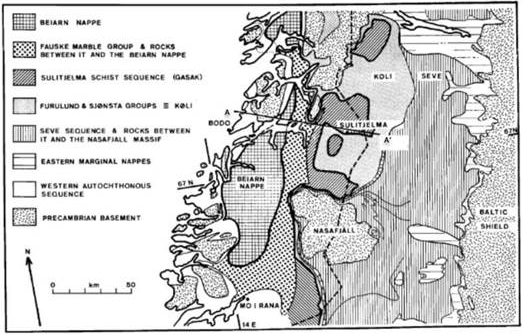
Figure 7-3. Profile Between Bodø and Sulitjelma
[Compiled by Nicholson (1969), Ref A-A’ from Figure 7-2]
| Adam Wheeler | 20th May 2025 |
| Technical Report on the Mineral Resources of the Sulitjelma Project | 36 |
7.2 Local Geology
A plan of the surface geology for the Sulitjelma Project area is shown in Figure 7-5. The Furulund Group and the Sulitjelma amphibolites contain the volcanogenic massive sulphide (“VMS”) mineralisation. The lithology of Furulund Group consists of calcareous phyllites and schists, very well-banded and in parts rich in garnet and hornblende. The group includes basic intrusions, which are now metadolerites with coarse-grained interiors and highly deformed margins.
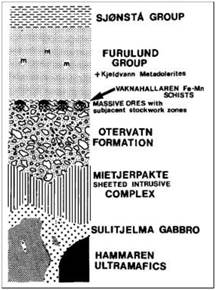
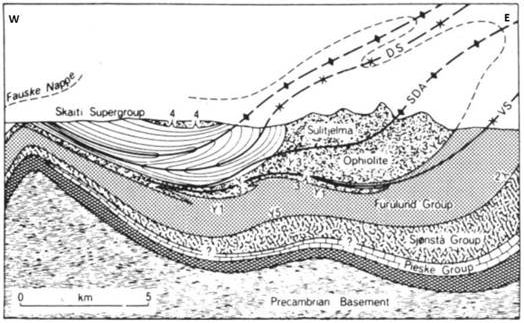
The Sulitjelma Project area deposits are located at the junction of a dominantly basaltic sequence, the Otervatn Volcanic Formation, with the overlying thick sedimentary unit: the Furulund Group. This basaltic segment forms the extrusive portion of the Sulitjelma Ophiolite Complex (Boyle, 1989) shown in Figure 7-4. The Sulitjelma Gabbro Complex and the sheeted Mietjerpakte Intrusive Complex have been interpreted by Boyle (1980) as the intrusive and hypabyssal portions. The stratigraphic and igneous relations of the rocks of the area have been reviewed and a model for the emplacement of the Sulitjelma fold nappe presented by Boyle (1987). Geochemical studies by Boyle (1982, 1989) and Cook (1987) have been interpreted to show that the Sulitjelma Ophiolite Complex represents a fragment of ensialic marginal basin which closed and was obducted during the Scandian orogenic phase and emplaced as a large-scale fold nappe (Figure 7-6).
The stratigraphy of the Sulitjelma Project area has undergone amphibolite-grade metamorphism. Polyphase penetrative deformation of the sequence has resulted in widespread stratigraphic inversion. This has led the actual stratigraphy shown in Figure 7-7, as well as the relative positions of mineralised zones shown in the section in Figure 7-6. The plan locations of the main deposits are shown in Figure 7-5.
Figure 7-4. Stratigraphy of Sulitjelma Ophiolite Complex – Pre-Folding/Faulting
[After] Boyle (1987)]
| Adam Wheeler | 20th May 2025 |
| Technical Report on the Mineral Resources of the Sulitjelma Project | 37 |
Figure 7-5. Simplified Geology Plan of Sulitjelma Area
[After Cook et al 1990]
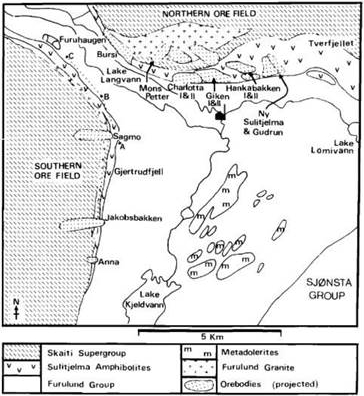
Figure 7-6. Profile of Sulitjelma Fold Nappe
[After Boyle, 1987]
| Adam Wheeler | 20th May 2025 |
| Technical Report on the Mineral Resources of the Sulitjelma Project | 38 |
Figure 7-7. Stratigraphic Column of Sulitjelma in Northern Mineralisation Area
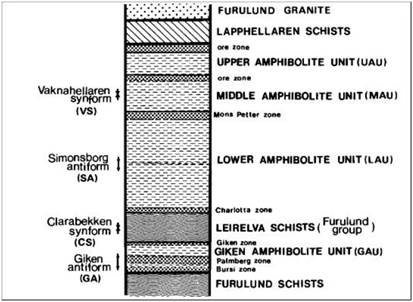
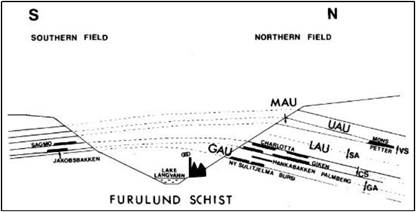
Figure 7-8. S-N Profile Across Langvann Antiform
7.3 Mineralisation
The deposits are interpreted as being originally formed at a single stratigraphic interval on the Ordovician seafloor (Cook et al, 1990), which fits the VMS genetic model. Each deposit has a well-developed subjacent zone of hydrothermal alteration, in which the core of each alteration zone appears to be abnormally enriched in potassium relative to the surrounding strata. The core of these alteration zones is typically enveloped by a chloritic alteration zone characterized by an increasing Fe/(Fe d- Mg) ratio away from the deposit.
Distinct sulphide mineralization facies are recognized as products of primary hydrothermal alteration, regional amphibolite--grade metamorphism, and accompanying penetrative tectonic deformation. Metals in these zones of hydrothermal alteration are interpreted as having resulted from leaching from the enclosing basalts, which display widespread physical and chemical effects of hydrothermal leaching. The widespread brecciation associated with the deposits can partly be explained by tectonism; it may also be evidence of a cyclic catastrophic stage during the evolution of the sea-floor hydrothermal system.
| Adam Wheeler | 20th May 2025 |
| Technical Report on the Mineral Resources of the Sulitjelma Project | 39 |
The Sulitjelma Gabbro Complex shows textural features in accordance with rapid cooling by seawater and it is believed that a subvolcanic intrusion represents the heat source which drove the hydrothermal convection cell.
The highly altered geochemistry of the main lithologies, due to hydrothermal alteration, and the widespread presence of chlorite as the major silicate mineral makes them distinctive and readily recognizable at surface outcrop. The chloritization is either due to widespread retrograde metamorphism to greenschist grade or to abnormal fluid conditions during prograde metamorphism which prevented the crystallization of Ca amphiboles. Small but distinct, although somewhat erratic, dispersal halos of trace elements exist in the strata-bound horizons of chloritic alteration and extend up to 300 m away from the deposits. Zn, Pb, Co, Ag, Cd, As, Bi, and Se form the most readily detectable halos. The size and orientation of the halos are strongly controlled by structural deformation of the sequence.
Major minerals in the VMS deposits are pyrite, chalcopyrite, sphalerite, and pyrrhotite. Galena and arsenopyrite are minor minerals. The minerals typically contain metablastic pyrite in a matrix of chalcopyrite, sphalerite, and pyrrhotite, with the pyrite commonly displaying either cataclastic deformation textures or annealed to 120° triple junctions. The famous large, rounded pyrite crystals, 1 cm or larger, termed “durchbewe-gung” (through-movement) fabrics by early German workers, have been the subject of much interest. They have been interpreted as the results of the deformation which accompanied regional metamorphism and are aligned parallel to the schistosity of the enclosing rock. Gangue minerals include quartz, iron- and titanium-oxides, and locally, anhydrite.
Several of the deposits display variations in mineralogy, notably the Sagmo deposit, possessing more pyrrhotite than pyrite. At the Mons Petter deposit, there is a widespread, distinct facies of the mineralization composed of magnetite, pyrite and sphalerite. Grades of precious metals in all the deposits are generally low.
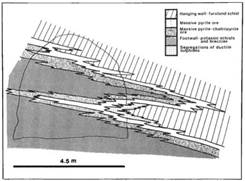
Differential mobilization of the mineralization induced by metamorphism and tectonism is recognized at various scales (Figure 7-9). Fold hinges within the mineralised zones typically display considerable enrichment of the more ductile sulphide phases, particularly chalcopyrite and pyrrhotite. The mineralization is often also thickened in the necks of the folds and thinned on the limbs. The mineralogy of the subjacent potassic zone is usually K-feldspar, biotite and albite, with varying proportions of quartz, albite, quartz, chlorite, hornblende, actinolite and sulphides.
Figure 7-9. Example of Folding in Giken II Mineralisation
[After Cook et al, 1990]
| Adam Wheeler | 20th May 2025 |
| Technical Report on the Mineral Resources of the Sulitjelma Project | 40 |
8 DEPOSIT TYPE
The Sulitjelma Project area contains more than 20 different VMS deposits, which are recognised as stratiform, strata-bound pyritic Cu-Zn sulphide bodies, the products of volcanic-associated hydrothermal sedimentary exhalative formation. There are many shared characteristics of Cyprus-type VMS deposits such as being hosted by pillowed mafic volcanic rocks of ophiolitic affinity, examples of which include those in Cyprus itself, the Semail ophiolite in Oman and the Ergani district in Turkey.
These deposits are interpreted as having been originally formed at a single stratigraphic interval on the Ordovician seafloor. The stratigraphy of the Sulitjelma Project area has undergone amphibolite-grade metamorphism, and polyphase penetrative deformation of the sequence has resulted in widespread stratigraphic inversion, as well as overlapping of different parts of the original strata, giving what are now effectively different beds.
Each individual deposit is elongate or tabular in shape and is confined to a single stratigraphic interval and they are typically 500 to 1,200 m in length, 200 to 400 m in width, and from 1 to 15 m in thickness. In the northern ore field, these deposits are typically dipping from 10 to 45 degrees to the north-east. Each deposit lies on a distinct axis, most deposits in the northern field having long axes trending northwest-southeast. These lithologies, together with the deposits and enclosing envelopes of alteration, have been isoclinally folded by simple shear, such that they now appear stacked up within the stratigraphy, giving the appearance of multiple mineralised zones.
Each deposit has a well-developed subjacent zone of alteration, in which the core of each alteration zone appears to be abnormally enriched in potassium relative to the surrounding strata. The potassically enriched core is enveloped by a more typical chloritic alteration zone characterized by an increasing Fe/(Fe + Mg) ratio away from the deposit. There are distinct facies in the mineralization that are recognized as products of primary hydrothermal zonation, regional amphibolite-grade metamorphism, and accompanying penetrative tectonic deformation. The metals in the deposits are interpreted as having resulted from leaching of the enclosing basalts, which display widespread the physical and chemical effects of hydrothermal leaching.
Typically, the deposits are overlain by amphibolites or schists, with basalts of the Otervatn Volcanic Formation below. However, with the isoclinal folding and stratigraphic inversion, means that variations can occur, often with amphibolites both above and below the deposits.
| Adam Wheeler | 20th May 2025 |
| Technical Report on the Mineral Resources of the Sulitjelma Project | 41 |
9 EXPLORATION
Blue Moon has not carried out any exploration work on the property. For a description of historical exploration work, refer to Section 6 - History.
10 DRILLING
Blue Moon has not carried out any drilling work on the property. For a description of historical exploration work, refer to Section 6 - History.
11 SAMPLE PREPARATION, ANALYSIS AND SECURITY
A thorough review of available information on the Sulitjelma Project yields very little quality control and quality assurance (“QAQC”) data that is available regarding sample preparation, laboratory analytical procedures, including the performance standards, blanks and duplicates. There is also no information available about chain of custody security procedures from the historic drilling activities. However, it is presumed that the prior operators conducted both sampling and analytical procedures in accordance with the industry best practices of the time, based on the information shown below.
In terms of sample collection, it can be seen from the remaining Sulitjelma Project drill core at Lokken that sampling was focused on mineralised intersections, with the initial samples being taken by sawing of the drill core in half and leaving the remnant half core in the core box.
The fact that so much of the Sulitjelma Project drill core is still in reasonable condition at Lokken, demonstrates the sound safeguarding procedures which must have been in place when the original samples were taken.
Core diameters, as summarised in Table 6-3, range from 22 mm to 36 mm (BQ). For the current database, a histogram of sample lengths is shown in Figure 11-1.
| Adam Wheeler | 20th May 2025 |
| Technical Report on the Mineral Resources of the Sulitjelma Project | 42 |
Figure 11-1. Histogram of Drilling Sample Lengths
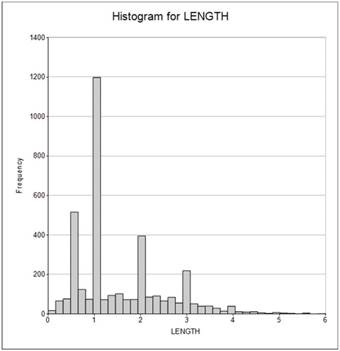
It can be seen from this histogram most of the samples have been taken with a 1 m length, and a lower number at 0.5 m, 2 m and 3 m. There is also a spread of intermediate sample lengths.
There are no records describing the assay methods used. However, from examination of the compiled assay data, the limits of detection can be inferred, as summarised in Table 11-1.
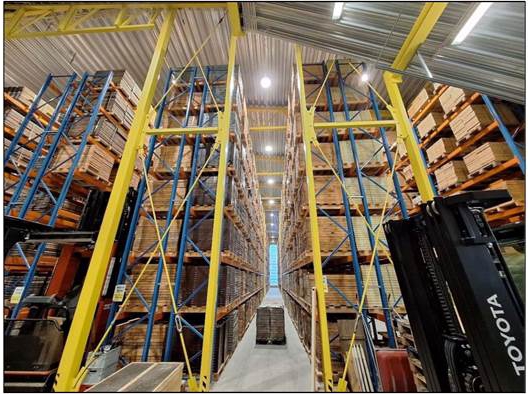
The NGU inventory in Lokken, where all the remaining Sulitjelma Project drill core is currently stored, is a well maintained and secure facility. There does not appear to be any storage of sample rejects or pulps.
Table 11-1. Summary of Limits of Detection
| Element | Value | Unit |
| Cu | 0.01 | % |
| Zn | 0.01 | % |
| Pb | 0.01 | ppm |
| S | 0.08 | % |
| Fe | - | % |
| Au | 0.01 | ppm |
| Ag | 0.1 | ppm |
The absence of QAQC of course entails a risk with the available drill hole data. This is discussed in more detail in section 25.1.3.
| Adam Wheeler | 20th May 2025 |
| Technical Report on the Mineral Resources of the Sulitjelma Project | 43 |
Figure 11-2. Photo of NGU Core Storage Facility – Lokken
| Adam Wheeler | 20th May 2025 |
| Technical Report on the Mineral Resources of the Sulitjelma Project | 44 |
12 DATA VERIFICATION
Data verification steps completed by the Author for the Sulitjelma Project include:
| · | Site visits to Sulitjelma in December 2024, including both surface and underground reviews. |
| · | Check review of example Sulitjelma Project drill core at the NGU core storage in Lokken. Check of surface drill collar elevation data relative to surface topography data. |
| · | Check of drill hole database integrity. |
| · | Additional checking of drill hole data against pre-existing, historical mine plans and cross-sections. |
| · | Check density measurements of samples from drill core |
12.1 Site Visit
The Author’s site visit on 2nd December 2024 covered the following:
| - | Visiting NSG’s head office in Fauske, Norway. |
| - | Historical underground development – walking along Rupsi tunnel and into parts of the mine workings. |
| - | Touring around the Process Plant buildings at Sandnes (east end of Lake) |
| - | Visiting the museum facilities and into the tunnel at the historical Giken mine. |
In the Author’s opinion, the Rupsi tunnel is in very good condition. Copper mineralisation is visible on many walls near the stope excavations, as is the nature of the tight ductile folding. The stope workings are also accessible, the remnant pillars clearly visible. It seems likely that it would be possible, with enough time, to enter much further into the old workings and the check the location of some old drill hole collars. The tunnel into the historical Giken mine also appears to be in very good condition, having a working rail track, so that it can be used as a tourist destination for trips underground with a mine tram car in the summer months.
The existing processing building also appear to be in reasonable condition.
Unfortunately, due to snow cover at the time of the site visit, it was not possible to review the position of any historical surface drill hole collars. See Item 12.3 for additional information regarding the drill collar locations.
| Adam Wheeler | 20th May 2025 |
| Technical Report on the Mineral Resources of the Sulitjelma Project | 45 |
Figure 12-1. Pictures – Underground at Rupsi
[Upper Left: Entrance to Rupsi Tunnel; Upper Right: Old Chute, Lower Left: Along Rupsi Tunnel; Lower Right: Old Stoped Workings]
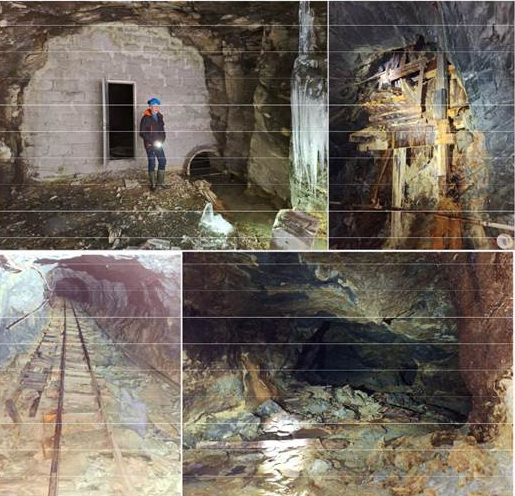
Figure 12-2. Surface Infrastructure - Former Processing Facilities
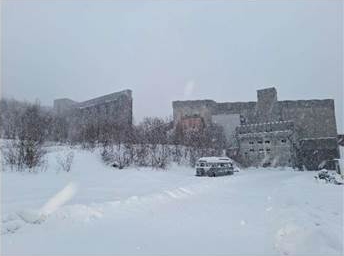
| Adam Wheeler | 20th May 2025 |
| Technical Report on the Mineral Resources of the Sulitjelma Project | 46 |
Figure 12-3. Looking Westwards from Giken Mine
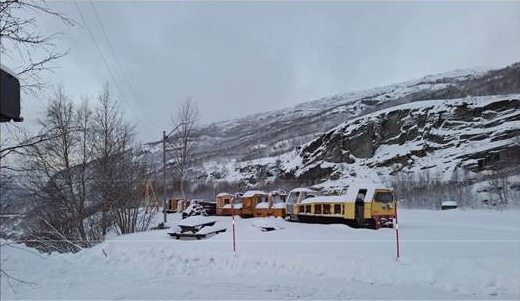
Figure 12-4. Looking Southward towards Former Sagmo Mine Area
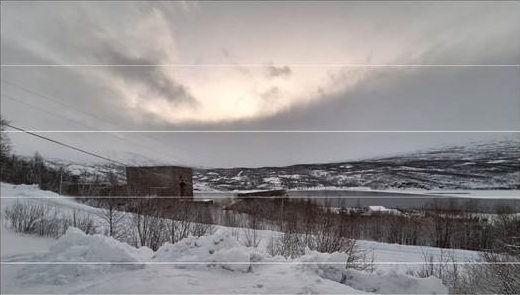
| Adam Wheeler | 20th May 2025 |
| Technical Report on the Mineral Resources of the Sulitjelma Project | 47 |
12.2 Drill hole Core
A review was made of drill hole core stored the NGU core storage facility at Lokken. A total of 9 drill holes were selected randomly for review, all of which are part of the database used in the current resource estimation work. Historical drill hole logs and other drillhole information is stored in the NGU facility at Lokken or at NSG’s offices in Fauske. The logs are in different forms, including typed out tables, pro-forma tables filled in by hand, hand-written notes and geological sections. Most of the data now available in Excel form corresponds with scanned copies of the original drill hole information.
The drill holes selected for review came from the Rupsi, Hankabakken and Sagmo mines. Example photos from this review, with some key features highlighted, as shown in Figure 12-5 to Figure 12-7.
Observations from this review process include the following:
| · | The inventory of Sulitjelma Project drill hole core stored at Lokken appears to be generally accurate to the historical descriptions. All drill holes requested and their related core boxes could generally be found by the staff at Lokken. |
| · | Some of the drill holes, mainly for waste intersections, have been reduced to “compressed” sections, in that 10cm of core has been taken from each metre of the original core, so boxes with a 10m length are representing 100m of actual drill core. This modification is recorded at the core inventory in ‘%core available’ column. |
| · | For some of the previously sampled intersections, there is no core left. The most likely explanation is that the original core was too small and/or friable to allow sawing, or due to additional samples being taken from the same intersections. |
| · | For the sampled intersections with higher-grades, where the core is cut, it is still available for review, and it corresponds well with observations of sulphide mineralisation, generally pyrite and chalcopyrite. |
| · | Rounded pyrite crystals are seen in many intersections, which is a very distinctive texture of the mineralisation at the Sulitjelma Project. |
| · | Some of the sampled intervals are very short, but in many instances, there is lot of apparent mineralisation that has not been sampled. This may be a function of the high cut-offs when the mines were in production previously. |
| · | The digitally logged lithology codes appear to correspond reasonably well with the Author’s observations of the selected drill core being reviewed. |
| · | Most of the core boxes retrieved for the core review were in good condition. However, it was observed that some of the boxes appear to have been left open and as a result, the drill core appears to be in bad condition and extremely dirty. For any detailed relogging exercise, the drill core would need to carefully clean, and it may not be possible in some cases due to the deterioration and heavy staining. |
| Adam Wheeler | 20th May 2025 |
| Technical Report on the Mineral Resources of the Sulitjelma Project | 48 |
Figure 12-5. Hole RUP-168
[From 620 m – To 630m]
Many sulphidic intersections outside of sampled intersections
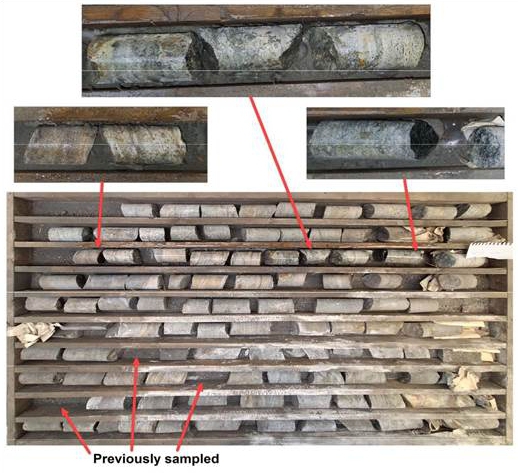
| Adam Wheeler | 20th May 2025 |
| Technical Report on the Mineral Resources of the Sulitjelma Project | 49 |
Figure 12-6. Hole RUP-136
[From 540m to 550m]
Logged as Chlorite-Breccia
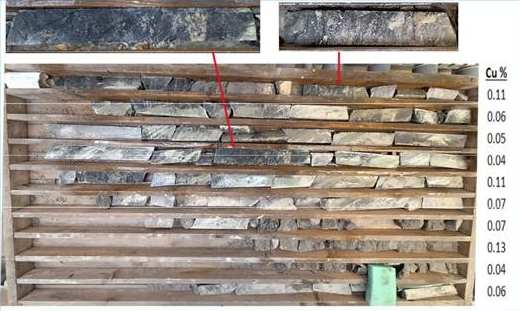
Figure 12-7. Hole RUP-137
[From 570m to 9 580m]
Red Blocked out portion = 3m averaging 1.28% Cu, logged as Massive Sulphide
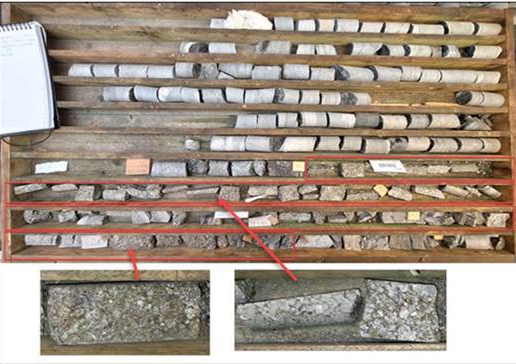
| Adam Wheeler | 20th May 2025 |
| Technical Report on the Mineral Resources of the Sulitjelma Project | 50 |
12.3 Collar Data
There are 48 surface holes in the Rupsi and Sagmo regions that were used in the current mineral resource estimation. The database collar elevations were compared with check elevations obtained from the reference National Height Model data, stemming from laser scanning and image matching (Hoydedata.no from 2016 and 2019). These elevation differences, either positive or negative, are summarised in Figure 12-8. An analysis shows that the median and mean differences are close to zero, indicating an absence of bias. However, the lowest 10% of the population are -7.5 m below and top 10% exceed by 4.5m the median and mean values. These two populations are a causes of concern and should be re-examined. For any future survey, additional checks are required for drill hole collars that can be located.
Figure 12-8. Histogram of Check Collar Elevation Differences – Rupsi and Sagmo
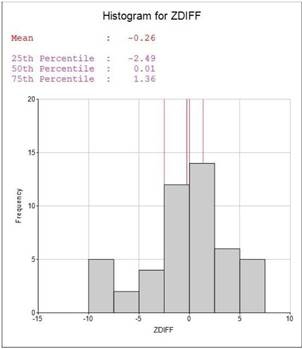
For the Hankabakken II region, the supplied data of the 63 surface, drill hole collars had incorrect elevation data, stemming from use of a wrong topographic model. For the updated mineral resource estimation described in this report, the drill hole collar elevations were set to the elevations derived from the National Height Model data.
| Adam Wheeler | 20th May 2025 |
| Technical Report on the Mineral Resources of the Sulitjelma Project | 51 |
12.4 Database
During the import and desurveying of drill hole data during the data verification, for Rupsi, Dypet, and Hankabakan deposits, the only errors were as follows:
| · | There was no survey data for holes 6 drill holes, out of a total of 518 drill holes. These holes without survey data were subsequently excluded. |
| · | Also, there was no lithology data specifically for 62 Hankabakken holes. In cases where no lithology data was available, grade data only was used for interpretation purposes. |
For the Sagmo deposit, the only errors were as follows:
| · | There was no survey data for two drill holes (81 and 82), out of a total of 89 drill holes; these two holes were therefore excluded. |
| · | For drill hole lithology information, only 1 drill hole was lacking data. |
| · | Also, 3 holes had assays, yet did not have corresponding drill collar information and downhole survey data. These holes were subsequently excluded. |
The Author completed further checks of database integrity through operations including:
| · | Range checks., on coordinate and Cu grade values. |
| · | Drill hole combination reports. . |
| · | Statistical analysis |
| · | Visualisation and plotting. |
The drill hole combination reports list out in detail all the data from each hole for each of the different files involved in combination and desurveying (determination of 3D sample positions) of all drillhole data.
The visualisation and plotting checks include generation of sections from the processed drillhole data, and comparing these with the original hand-drawn profiles.
The assay database contained 3,728 samples, but these only contained Cu and Zn assays for the most part. Approximately 25% of the samples in the database had a reported Ag value in g/t or oz/t.
12.5 Drill hole Data
The Author conducted checks of the underground drill hole data against historical underground level and stope plans, as shown in the examples in Figure 12-9 to Figure 12-11. These historical plans showed a good correspondence with the underground collar positions in the digital database.
Drill hole and topographic data were also checked against historic hand-drawn profiles, as shown in Figure 12-12 and Figure 12-13. This comparison also showed good correspondence.
| Adam Wheeler | 20th May 2025 |
| Technical Report on the Mineral Resources of the Sulitjelma Project | 52 |
Figure 12-9. Plan of Underground Drill holes vs Historical Map - Rupsi
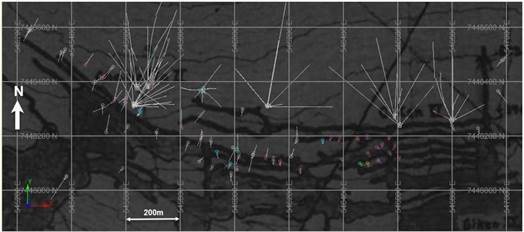
Figure 12-10. Plan of Underground Drill holes vs Historical Map - Sagmo
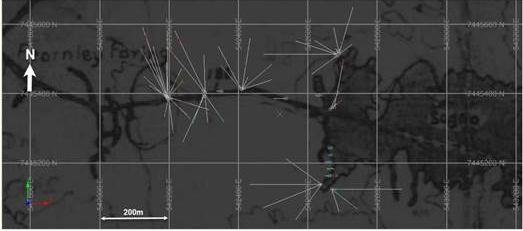
Figure 12-11. Plan of Underground Drill holes vs Historical Map - Hankabakken
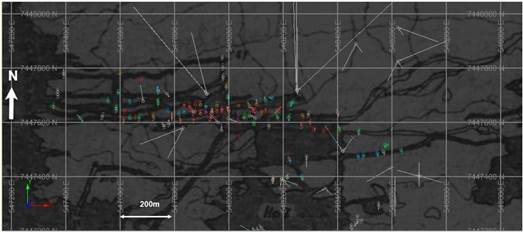
| Adam Wheeler | 20th May 2025 |
| Technical Report on the Mineral Resources of the Sulitjelma Project | 53 |
Figure 12-12. Historic Profile
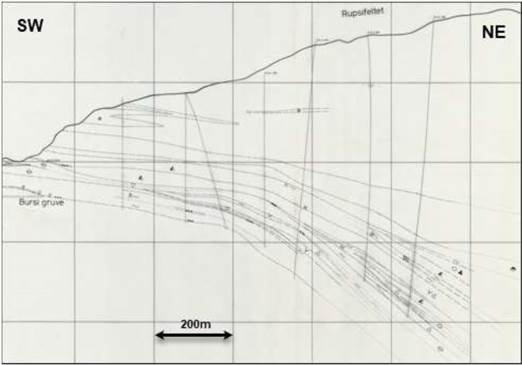
Figure 12-13. Profile 6 with Imported Data
[Section also shows interpreted model in the current estimation]
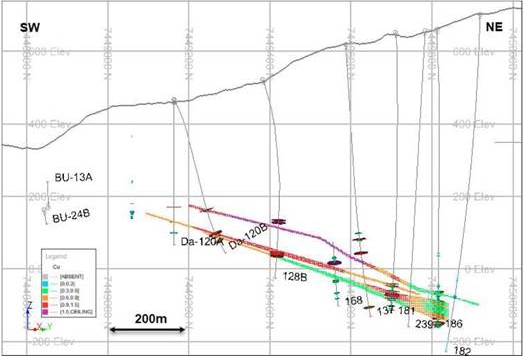
| Adam Wheeler | 20th May 2025 |
| Technical Report on the Mineral Resources of the Sulitjelma Project | 54 |
12.6 Density
The Author noted that there is little information available for historical density measurements for the Sulitjelma Project. It was then decided by the Author to make a small batch of check density measurements on the historical drill core. Samples were selected by the Author, and the measurements were taken by Blue Moon employees in the NGU storage facility at Lokken in February 2025. A summary of these density measurements is presented in Table 12-1.
Table 12-1. Summary of Check Density Measurements
| SampleID BHID | Box (m) | FROM | Cu % | Density | ||
| (m) | t/m3 | |||||
| 1 | RUP_136 | 536-539 | 536.5 | 0.52 | 2.96 | |
| 2 | RUP_137 | 570-580 | 572.5 | - | 2.97 | |
| 3 | RUP_137 | 570-580 | 578.75 | 1.24 | 2.90 | |
| 4 | RUP_128B | 390-400 | 399.45 | - | 2.87 | |
| 5 | RUP_128B | 390-400 | 399.55 | - | 2.79 | |
| 6 | RUP_130 | 430-440 | 439.45 | 0.38 | 2.76 | |
| 7 | RUP_130 | 470-480 | 474.5 | 0.61 | 2.83 | |
| 8 | RUP_130 | 470-480 | 475.4 | 0.29 | 2.77 | |
| 9 | RUP_130 | 470-480 | 476.2 | 0.96 | 2.83 | |
| 10 | HANK_184A | 40-50 | 40.8 | - | 2.98 | |
| 11 | HANK_184F | 100-110 | 100.3 | 1.09 | 3.20 | |
| 12 | HANK_184F | 100-110 | 107.4 | 0.96 | 2.84 | |
| 13 | Sagmo_67G | 40-50 | 43.9 | 2.19 | 3.33 | |
| 14 | Sagmo_67G | 40-50 | 47.3 | 0.49 | 3.83 | |
| 15 | Sagmo_67H | 50-60 | 52.3 | 2.66 | 3.62 | |
| 16 | Sagmo_67H | 50-60 | 57.5 | - | 2.81 | |
| Average | 3.02 | |||||
The density sample measurements were chosen to cover different lithologies as well as to include both mineralised material and waste. Samples were tested from each of the different deposits being evaluated. A graph showing the variation of density versus copper grade, for those samples assayed, is shown in Figure 12-14. This graph indicates that there may be some relationship between density and grade, although significantly more density measurements would be required to confirm this hypothesis.
| Adam Wheeler | 20th May 2025 |
| Technical Report on the Mineral Resources of the Sulitjelma Project | 55 |
Figure 12-14. Point Plot of Cu grade vs Density
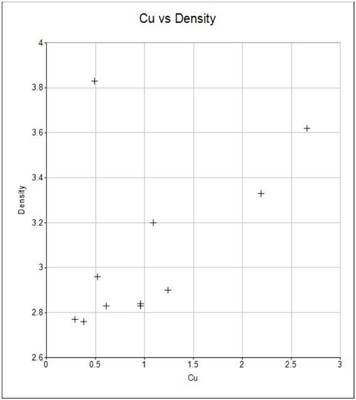
The overall average density of 3.02 t/m3 from the check density measurements supports the assumed global density of 3 t/ m3 that was used in the current mineral resource estimation work in this report.
13 MINERAL PROCESSING AND METALLURGICAL TESTING
There is very little information regarding the historical processing facilities. However, Table 13-1 shows a summary of the mill production from 1984. This shows a plant recovery for Cu of 97.5% from that time.
Table 13-1. Summary of 1984 Mill Production
| Product | Tons | % Cu | % Zn | % S | Tons Cu | Tons Zn | Tons S | Recovery % |
| Mill Feed | 450,000 | 1.69 | 0.45 | 18.0 | 7,605 | 2,025 | 81,000 | |
| Cu concentrate | 25,136 | 29.50 | 1.25 | 34.1 | 7,415 | 314 | 8,571 | 97.5 |
| Zn concentrate | 1,610 | 1.40 | 51.0 | 32.7 | 22.5 | 821 | 526 | 40.5 |
| S concentrate | 118,428 | 0.03 | 0.20 | 51.0 | 35.5 | 237 | 60,398 | 74.6 |
| Tailings | 304,826 | 0.04 | 0.21 | 3.77 | 121.9 | 640 | 11,492 |
More recent flotation testwork was completed by SGS Mineral Services in 2020, and the results sent to Sarb Consulting (“Sarb”). The testwork results were used by Sarb in their own study to assess the environmental geochemical effects of potential tailings disposal in Langvatnet.
A flotation program was completed on a sample from Sulitjelma, in order to develop a flotation flowsheet and produce flotation tailings for long-term sub-water leach testing. Five rougher tests and three cleaner tests were performed and flotation results were obtained. The testwork was completed at SGS Vancouver Metallurgy, and included sample preparation, flotation, and product characterization.
| Adam Wheeler | 20th May 2025 |
| Technical Report on the Mineral Resources of the Sulitjelma Project | 56 |
A photograph of this sample is shown in Figure 13-1. This 36kg of material was collected from wall rock in the old Dypet mine, with average grades of 3.44%Cu and 0.5%Zn.
Figure 13-1. Photograph of As-Received Sample- for SGS Flotation Testing
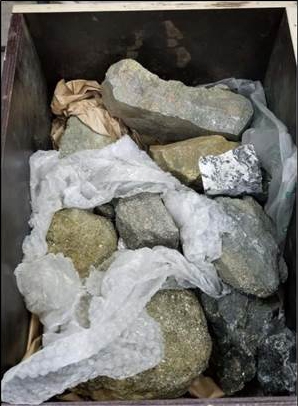
The sample was stage-crushed to -10 mesh, homogenized, split into 2 kg test charges, and preserved in a freezer prior to flotation. A head sample was submitted for an ICP-Scan and whole rock analysis (WRA). The sample was massive sulphide material and assayed 3.44% Cu, 0.5% Zn, 33% Fe, and 35.4% S.
Five rougher flotation tests were performed to optimize the flotation conditions in order to maximize the copper and zinc recovery into separate concentrates. The tests were performed at a primary grind size k80 of approximately 140 µm. Lime was added in both the copper and zinc circuits to increase the pH and depress pyrite. Collectors 3418A, SIPX, and 5100 were tested in the copper flotation while SIPX and 3894 were tested in the zinc flotation. Zinc sulphate was used to depress sphalerite in the copper circuit while copper sulphate was used to re-activate sphalerite in the zinc circuit.
Three cleaner tests were completed by employing the same flotation conditions. The first test was performed to confirm the flotation results while the other two tests were completed to produce tailings for environmental testwork. The overall test flotation flowsheet is presented in Figure 13-2.
| Adam Wheeler | 20th May 2025 |
| Technical Report on the Mineral Resources of the Sulitjelma Project | 57 |
Figure 13-2. Test Flotation Flowsheet
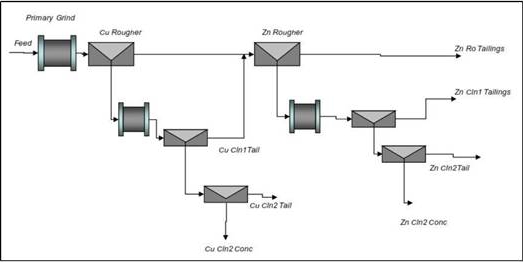
SGS concluded that, based on the supplied sample, the material responded well to a conventional, sequential copper/zinc flotation flowsheet. Under the conditions established in open circuit flotation tests, copper recoveries of 90-95% can be expected for a concentrate grade of approximately 30% Cu can be expected, along with a zinc recovery of 50-55% for a concentrate grade of 45-50% Zn. Zinc “loss” to the copper concentrate was approximately 30%.
| Adam Wheeler | 20th May 2025 |
| Technical Report on the Mineral Resources of the Sulitjelma Project | 58 |
14 MINERAL RESOURCE ESTIMATE
14.1 Data Collation
The mineral resource estimation for this report was based on all available drill hole data. A summary of the current drill hole database is shown below. Plans and 3D views of the data are shown in Figure 14-1 to Figure 14-5.
Table 14-1. Summary of Drill hole Database
| Average | |||||
| Region | Holes | Length | Length/ Hole | Samples | |
| Name | Code | m | m | ||
| Rupsi/Dypet | RD | 260 | 50,277 | 193 | 1,908 |
| Hankabakken II | H2 | 254 | 18,429 | 73 | 1,380 |
| Sagmo | SM | 87 | 9,438 | 108 | 440 |
| Total | 601 | 78,144 | 130 | 3,728 | |
Figure 14-1. 3D View of All Drill holes, Looking North-West
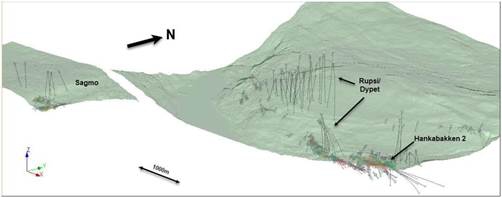
Figure 14-2. Plan Plot of Drill holes
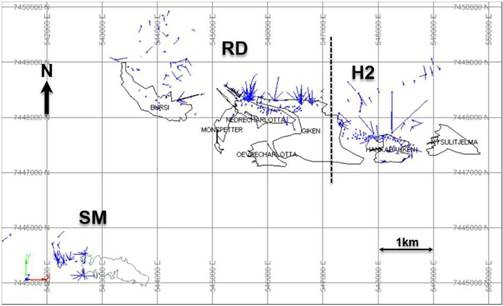
| Adam Wheeler | 20th May 2025 |
| Technical Report on the Mineral Resources of the Sulitjelma Project | 59 |
Figure 14-3. 3D View of RD Drill holes – Looking North-West
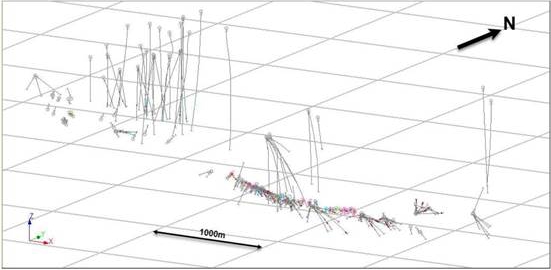
Figure 14-4. 3D View of H2 Drill holes – Looking North-West
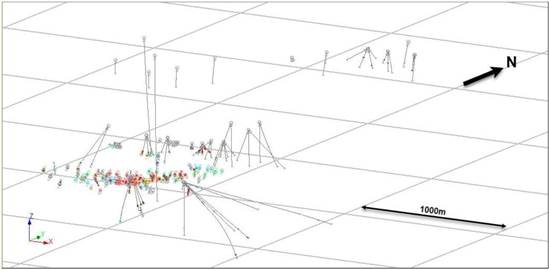
Figure 14-5. 3D View of SM Drill holes – Looking North-West
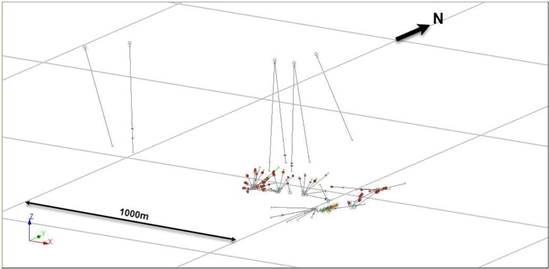
| Adam Wheeler | 20th May 2025 |
| Technical Report on the Mineral Resources of the Sulitjelma Project | 60 |
14.2 Interpretation
The interpretations of most of the VMS mineralization was made using the following procedure:
| 1. | Identification of possible intersections, based on a cut-off of 0.36% Cu over length of 1 m, as well as marked lithological differences. |
| 2. | Interpretation of strings connecting VMS mineralization composite centres, with similar orientations and geometries to those shown on supplied geological profiles. |
| 3. | Assignment of a ZONE, to discriminate the different VMS mineralization. |
| 4. | Generation of DTMs describing VMS mineralization centrelines. |
The Author noted the following difficulties with the interpretation:
| · | Erratic and sporadic layout of holes. |
| · | Few specific geological characteristics to assist with vein identification. | |
| · | Many underground holes have very poor intersection angles. |
Plans and 3D views of the vein centre DTMs are shown in Figure 14-6 to Figure 14-7 as well as Figure 14-10 to Figure 14-13. In the Rupsi-Dypet (“RD”) deposits, there are 8 separate zones have been interpreted, 3 zones in each the Hankabakken II (H2) deposit, and another 3 zones in Sagmo deposit (“SM”). Most of the boundaries of mineralization are extremely sharp, with much lower grades or unsampled core outside of the flagged intersections.
The lithology log data was used to create LeapFrog Geo (version 5.0.3) models of the principal lithologies. Example sections of the RD zone, for the interpreted mineralised zones with respect to local geology, are shown in Figure 14-8 and Figure 14-9.
A summary of all the intersections from the zones is shown in Appendix A.
| Adam Wheeler | 20th May 2025 |
| Technical Report on the Mineral Resources of the Sulitjelma Project | 61 |
Figure 14-6. RD – Plan of Interpreted Veins
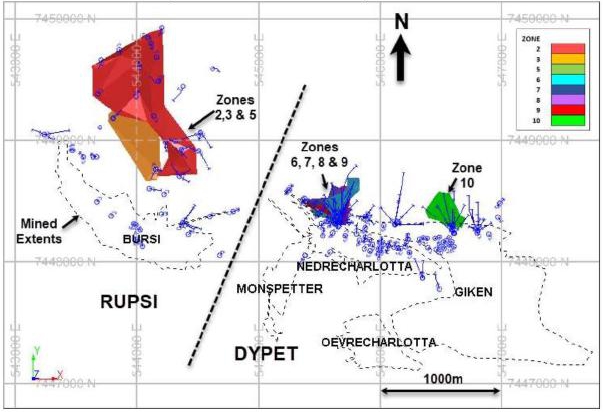
Figure 14-7. 3D View of RD Interpreted Veins, Looking South-West
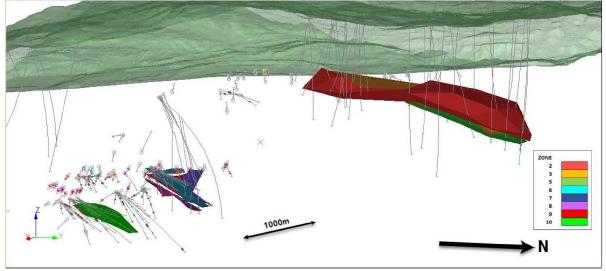
| Adam Wheeler | 20th May 2025 |
| Technical Report on the Mineral Resources of the Sulitjelma Project | 62 |
Figure 14-8. Overall S-N Section Through RD Region
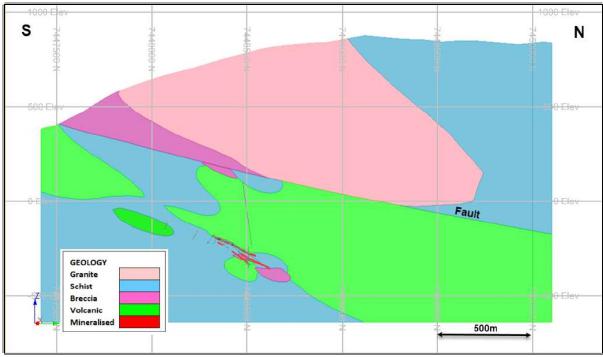
Figure 14-9. S-N Section Through RD Mineralised Zones
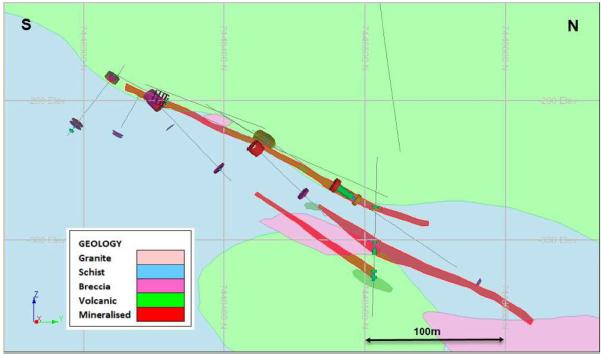
| Adam Wheeler | 20th May 2025 |
| Technical Report on the Mineral Resources of the Sulitjelma Project | 63 |
Figure 14-10. Plan of H2 Interpreted Zones
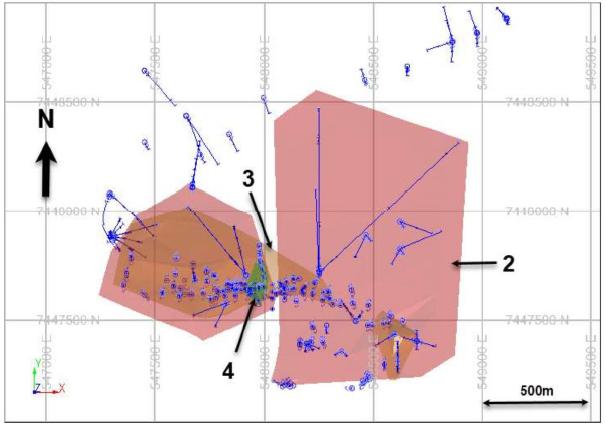
Figure 14-11. 3D View of H2 Interpreted Zones, Looking South-West
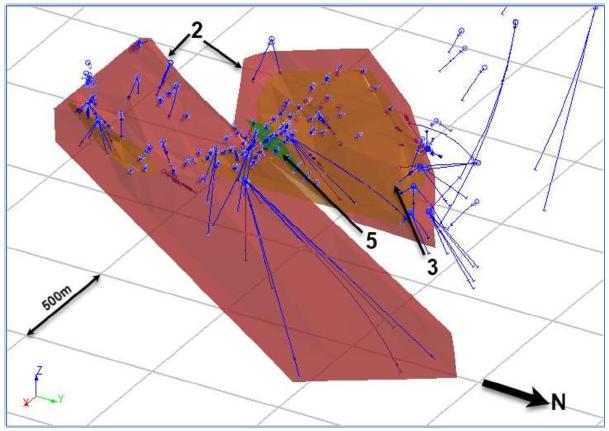
| Adam Wheeler | 20th May 2025 |
| Technical Report on the Mineral Resources of the Sulitjelma Project | 64 |
Figure 14-12. Plan of SM Interpreted Zones
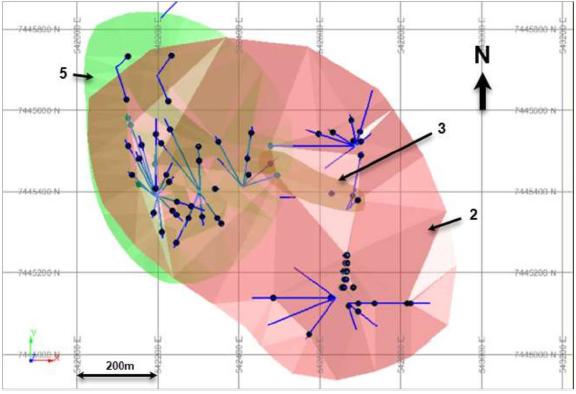
Figure 14-13. WE Long-Section of SM Interpreted Zones
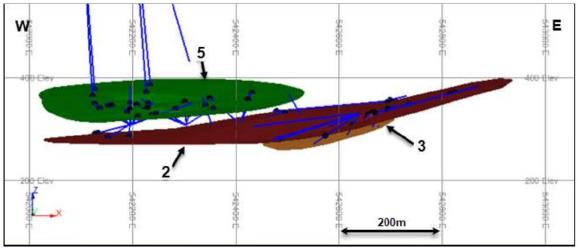
| Adam Wheeler | 20th May 2025 |
| Technical Report on the Mineral Resources of the Sulitjelma Project | 65 |
14.3 Exploratory Data Analysis
A statistical summary of the mineralized samples, captured within the interpretation limits of the wireframes, is shown in Table 14-2. Log-probability plots of these captured samples, for each deposit, are shown in Figure 14-14 to Figure 14-15, for Cu and Zn, respectively. Most of these are showing close to log-normal distributions.
Table 14-2. Statistical Summaries – Interpreted Samples
| FIELD | ZONE | NUMBER | MIN | MAX | MEAN | VARIANCE | STANDDEV | COVARTN% | PCTL10 | PCTL50 | PCTL90 | |
| Cu_pct | 2 | 71 | 0.14 | 16.82 | 1.01 | 1.87 | 1.37 | 135.5 | 0.30 | 0.67 | 3.85 | |
| Cu_pct | 3 | 26 | 0.19 | 4.24 | 0.84 | 0.34 | 0.58 | 69.3 | 0.28 | 0.62 | 1.47 | |
| Cu_pct | 5 | 78 | 0.00 | 3.76 | 0.68 | 0.41 | 0.64 | 93.8 | 0.09 | 0.52 | 1.48 | |
| Cu_pct | 6 | 99 | 0.14 | 11.45 | 2.18 | 4.99 | 2.23 | 102.5 | 0.35 | 1.47 | 4.67 | |
| Cu_pct | 7 | 37 | 0.07 | 17.49 | 1.14 | 2.02 | 1.42 | 125.0 | 0.21 | 0.88 | 4.32 | |
| Cu_pct | 8 | 26 | 0.03 | 15.66 | 1.48 | 4.00 | 2.00 | 135.0 | 0.32 | 0.86 | 5.24 | |
| Cu_pct | 9 | 24 | 0.02 | 5.41 | 1.08 | 1.15 | 1.07 | 98.9 | 0.17 | 0.78 | 3.23 | |
| Cu_pct | 10 | 53 | 0.27 | 14.18 | 2.07 | 3.63 | 1.91 | 92.3 | 0.34 | 1.56 | 5.57 | |
| RD | Cu_pct | All | 414 | 0.00 | 17.49 | 1.56 | 3.36 | 1.83 | 117.2 | 0.27 | 0.86 | 4.18 |
| Zn_pct | 2 | 68 | 0.01 | 1.81 | 0.29 | 0.09 | 0.30 | 103.0 | 0.06 | 0.22 | 0.63 | |
| Zn_pct | 3 | 17 | 0.01 | 2.35 | 0.35 | 0.33 | 0.57 | 166.0 | 0.03 | 0.20 | 1.62 | |
| Zn_pct | 5 | 78 | 0.03 | 2.19 | 0.25 | 0.19 | 0.43 | 173.0 | 0.04 | 0.12 | 0.40 | |
| Zn_pct | 6 | 90 | 0.01 | 2.20 | 0.37 | 0.19 | 0.43 | 115.2 | 0.08 | 0.22 | 1.24 | |
| Zn_pct | 7 | 29 | 0.03 | 1.47 | 0.23 | 0.05 | 0.23 | 100.2 | 0.05 | 0.22 | 0.79 | |
| Zn_pct | 8 | 26 | 0.01 | 2.81 | 0.23 | 0.32 | 0.56 | 244.9 | 0.02 | 0.06 | 0.89 | |
| Zn_pct | 9 | 16 | 0.00 | 5.57 | 0.17 | 0.22 | 0.47 | 272.1 | 0.00 | 0.09 | 1.21 | |
| Zn_pct | 10 | 18 | 0.01 | 2.57 | 0.58 | 0.48 | 0.69 | 120.1 | 0.04 | 0.44 | 1.88 | |
| Zn_pct | All | 342 | 0.00 | 5.57 | 0.32 | 0.20 | 0.45 | 143.6 | 0.04 | 0.18 | 0.95 |
| FIELD | ZONE | NUMBER | MIN | MAX | MEAN | VARIANCE | STANDDEV | COVARTN% | PCTL10 | PCTL50 | PCTL90 | |
| Cu_pct | 2 | 564 | 0 | 7.75 | 0.88 | 0.60 | 0.77 | 87.6 | 0.27 | 0.65 | 1.88 | |
| Cu_pct | 3 | 212 | 0 | 3.77 | 0.82 | 0.38 | 0.62 | 75.7 | 0.19 | 0.55 | 1.45 | |
| Cu_pct | 5 | 83 | 0.2 | 8.60 | 1.03 | 1.34 | 1.16 | 113.0 | 0.27 | 0.66 | 1.74 | |
| H2 | Cu_pct | All | 859 | 0 | 8.60 | 0.88 | 0.61 | 0.78 | 89.2 | 0.25 | 0.62 | 1.80 |
| Zn_pct | 2 | 111 | 0 | 0.68 | 0.08 | 0.01 | 0.11 | 131.0 | 0.01 | 0.04 | 0.22 | |
| Zn_pct | 3 | 63 | 0 | 7.00 | 0.24 | 1.00 | 1.00 | 414.7 | 0.02 | 0.07 | 0.28 | |
| Zn_pct | 5 | 13 | 0 | 0.36 | 0.12 | 0.01 | 0.09 | 81.5 | 0.04 | 0.10 | 0.31 | |
| Zn_pct | All | 187 | 0 | 7.00 | 0.14 | 0.39 | 0.62 | 432.1 | 0.01 | 0.05 | 0.28 |
| FIELD | ZONE | NUMBER | MIN | MAX | MEAN | VARIANCE | STANDDEV | COVARTN% | PCTL10 | PCTL50 | PCTL90 | |
| Cu_pct | 2 | 169 | 0.08 | 13.10 | 0.95 | 1.31 | 1.14 | 119.9 | 0.34 | 0.79 | 1.62 | |
| Cu_pct | 3 | 17 | 0.64 | 3.12 | 1.65 | 0.60 | 0.77 | 46.8 | 0.68 | 1.51 | 2.45 | |
| Cu_pct | 5 | 182 | 0.10 | 3.20 | 1.00 | 0.34 | 0.58 | 58.3 | 0.46 | 0.85 | 1.79 | |
| SM | Cu_pct | All | 368 | 0.08 | 13.10 | 1.01 | 0.80 | 0.89 | 88.9 | 0.39 | 0.81 | 1.78 |
| Zn_pct | 2 | 169 | 0.01 | 0.47 | 0.15 | 0.01 | 0.10 | 66.4 | 0.04 | 0.15 | 0.29 | |
| Zn_pct | 3 | 9 | 0.15 | 0.28 | 0.22 | 0.00 | 0.04 | 18.6 | 0.14 | 0.23 | 0.27 | |
| Zn_pct | 5 | 182 | 0.02 | 0.40 | 0.15 | 0.01 | 0.08 | 50.4 | 0.07 | 0.15 | 0.25 | |
| Zn_pct | All | 360 | 0.01 | 0.47 | 0.15 | 0.01 | 0.09 | 57.2 | 0.05 | 0.15 | 0.27 |
| Adam Wheeler | 20th May 2025 |
| Technical Report on the Mineral Resources of the Sulitjelma Project | 66 |
Figure 14-14. Log-Probability Plots of Cu Samples Within Interpreted Zones
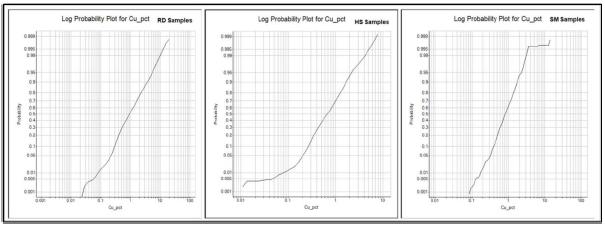
Figure 14-15. Log-Probability Plots of Zn Samples Within Interpreted Zones
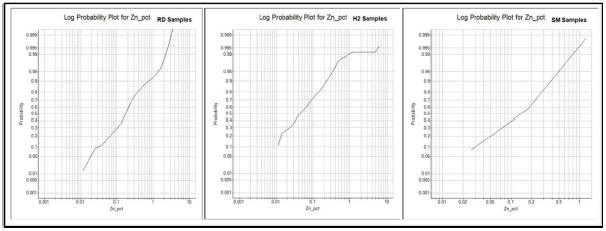
Point plots of Cu vs Zn assays, on logarithmic scales, are shown in Figure 14-16. These show generally a positive correlation, with higher grades of Cu generally being accompanied by higher grades of Zn, particularly for RD and SM.
Figure 14-16. Point Plots of Cu vs Zn Grades
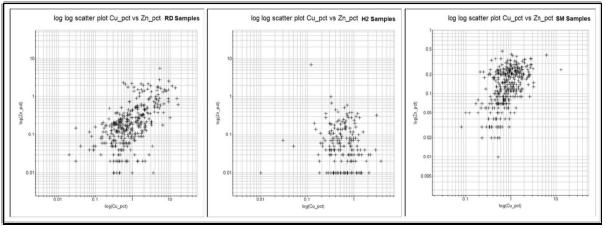
| Adam Wheeler | 20th May 2025 |
| Technical Report on the Mineral Resources of the Sulitjelma Project | 67 |
For each of the drill hole intersections, the true thickness was calculated, based on the average dip and dip direction of each zone. These derived true thickness values are plotted as histograms in Figure 14-17. All these distributions are skewed, with most of the thicknesses being below 5m, also with additional high thickness values. This reflects the sporadic thickening of the zones.
Figure 14-17. Histograms of Vein True Thickness Values
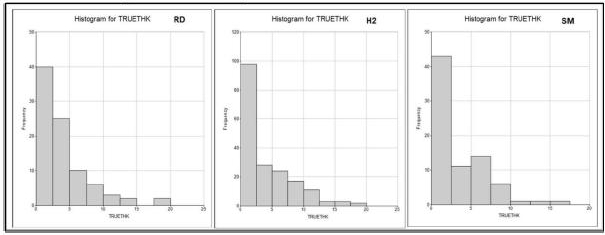
Histograms reflecting the different sample lengths used for each zone are show in Figure 14-18. For SM, fewer samples greater than 3m long were used in SM, with most of the samples being 0.5, 1m or 2m. For RD and H2, most of the samples taken were either 0.5m or 1m. It is evident that in general samples were broken on lithological breaks. Within consistent lithologies, it is not clear how the basic sample length was decided. But it must be remembered that the drill hole database covers a long historic interval of 36 years, which many changes in geological personnel.
Figure 14-18. Sample Length Histograms by Zone
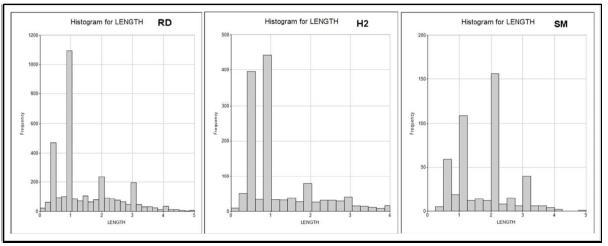
| Adam Wheeler | 20th May 2025 |
| Technical Report on the Mineral Resources of the Sulitjelma Project | 68 |
14.4 Compositing
Samples within the interpreted zones were examined for outlier grades, using log-probability plots and decile analyses. This process enabled reasonable outlier levels to be determined, as summarised in Table 14-3. The results were applied as capping levels to the identified zone samples, prior to creating composites. In the case of RD and H2, 5 m downhole composites were created. The composite lengths were slightly variable to be the same lengths across each intersection. This is because parts of these zones are thicker than 5 m, so cross-mineralization composites would not provide enough detail for grade estimation into the mineral resource. For SM, only cross-mineralization composites were created, as the apparent true thickness is seldom above 10m.
Table 14-3. Top-Cut Levels
| REGION | Cu % | Zn % |
| RD | 10 | 2 |
| H2 | 4 | 0.7 |
| SM | 3.5 | - |
After the composites were created, an apparent true thicknesses for mineralization were determined, based on the drill hole orientation and the general orientation of each zone. The zone orientations are summarised in Table 14-4Table 14-5.
Table 14-4. Zone Orientations
| REGION | ZONE | Dip Direction | Dip |
| 2 | 20 | 16 | |
| 3 | 20 | 17 | |
| 5 | 20 | 18 | |
| RD | 6 | 20 | 24 |
| 7 | 20 | 50 | |
| 8 | 20 | 25 | |
| 9 | 20 | 27 | |
| 10 | 10 | 30 | |
| 2 | 353 | 35 | |
| H2 | 3 | 354 | 36 |
| 5 | 348 | 34 | |
| 2 | 276 | 9 | |
| SM | 3 | 291 | 11 |
| 5 | 234 | 4 |
A summary of the compositing parameters is shown in Table 14-5.
Table 14-5. Compositing Parameters
| Minimum | Minmum | |
| REGION | Gap | Composite Length |
| m | m | |
| RD | 0.1 | 5 |
| H2 | 0.1 | 5 |
| SM | 0.1 | Intersection |
| Adam Wheeler | 20th May 2025 |
| Technical Report on the Mineral Resources of the Sulitjelma Project | 69 |
14.5 Geostatistics
Statistics from the generated composites are shown in Table 14-6 to Table 14-8. Log-probability plots of the composite grades are shown in Figure 14-19 and Figure 14-20. Cu variograms for the RD and H2 composite data are shown in Figure 14-21 and Figure 14-22. The experimental variograms indicate a range of approximately 100m.
Figure 14-19. Log-Probability Plots for Composites - Cu
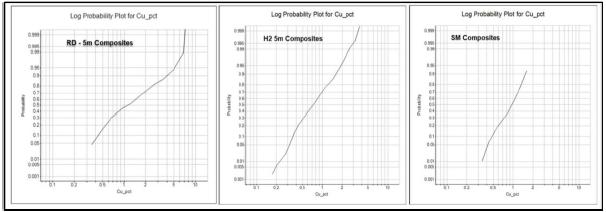
Figure 14-20. Log-Probability Plots for Composites – Zn
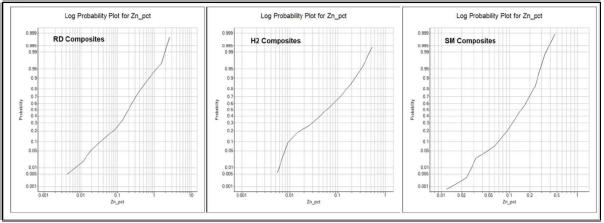
| Adam Wheeler | 20th May 2025 |
| Technical Report on the Mineral Resources of the Sulitjelma Project | 70 |
Table 14-6. Statistical Summary– RD Composites
[TRUETHK = True Thickness in m]
| FIELD | ZONE | NUMBER | MIN | MAX | MEAN | VARIANCE | STANDDEV | COVARTN% | PCTL10 | PCTL50 | PCTL90 |
| Cu_pct | 2 | 17 | 0.31 | 6.82 | 1.10 | 1.60 | 1.26 | 115.33 | 0.39 | 0.74 | 2.77 |
| Cu_pct | 3 | 8 | 0.30 | 1.40 | 0.83 | 0.12 | 0.34 | 41.57 | 0.26 | 0.67 | 1.18 |
| Cu_pct | 5 | 5 | 0.42 | 1.05 | 0.68 | 0.06 | 0.23 | 34.38 | 0.36 | 0.71 | 1.00 |
| Cu_pct | 6 | 23 | 0.41 | 8.00 | 1.84 | 1.07 | 1.03 | 56.12 | 0.47 | 1.95 | 3.50 |
| Cu_pct | 7 | 9 | 0.39 | 3.09 | 1.03 | 0.42 | 0.65 | 63.32 | 0.35 | 1.96 | 2.26 |
| Cu_pct | 8 | 8 | 0.36 | 5.26 | 1.19 | 0.98 | 0.99 | 82.95 | 0.31 | 1.95 | 4.50 |
| Cu_pct | 9 | 11 | 0.37 | 5.10 | 1.02 | 1.08 | 1.04 | 101.89 | 0.38 | 0.73 | 3.19 |
| Cu_pct | 10 | 8 | 0.32 | 5.12 | 2.12 | 1.95 | 1.40 | 65.87 | 0.32 | 1.56 | 4.81 |
| Cu_pct | All | 89 | 0.30 | 8.00 | 1.14 | 1.03 | 1.02 | 89.02 | 0.42 | 1.16 | 3.59 |
| Zn_pct | 2 | 16 | 0.01 | 1.42 | 0.30 | 0.06 | 0.24 | 78.61 | 0.02 | 0.23 | 0.71 |
| Zn_pct | 3 | 6 | 0.01 | 1.54 | 0.29 | 0.18 | 0.43 | 149.72 | - | 0.17 | 0.73 |
| Zn_pct | 5 | 4 | 0.03 | 0.64 | 0.25 | 0.05 | 0.23 | 90.42 | 0.01 | 0.10 | 0.44 |
| Zn_pct | 6 | 20 | 0.01 | 1.51 | 0.27 | 0.04 | 0.21 | 77.24 | 0.02 | 0.28 | 0.75 |
| Zn_pct | 7 | 5 | 0.09 | 0.72 | 0.21 | 0.02 | 0.15 | 74.06 | 0.03 | 0.38 | 0.55 |
| Zn_pct | 8 | 8 | 0.02 | 2.81 | 0.15 | 0.17 | 0.42 | 271.89 | 0.02 | 0.22 | 0.95 |
| Zn_pct | 9 | 7 | 0.00 | 1.03 | 0.18 | 0.11 | 0.33 | 190.33 | 0.00 | 0.06 | 0.96 |
| Zn_pct | 10 | 4 | 0.01 | 1.07 | 0.53 | 0.12 | 0.35 | 65.49 | - | 0.50 | 0.92 |
| Zn_pct | All | 70 | 0.00 | 2.81 | 0.26 | 0.09 | 0.29 | 113.16 | 0.02 | 0.22 | 0.92 |
| TRUETHK | 2 | 17 | 0.96 | 14.58 | 5.85 | 17.52 | 4.19 | 71.51 | 0.97 | 3.92 | 11.13 |
| TRUETHK | 3 | 8 | 0.95 | 9.39 | 5.38 | 9.55 | 3.09 | 57.48 | 0.77 | 5.27 | 8.79 |
| TRUETHK | 5 | 5 | 1.76 | 47.12 | 15.43 | 289.48 | 17.01 | 110.25 | 0.71 | 5.10 | 33.23 |
| TRUETHK | 6 | 23 | 0.15 | 9.67 | 3.10 | 4.19 | 2.05 | 66.06 | 0.40 | 2.95 | 5.21 |
| TRUETHK | 7 | 9 | 0.02 | 7.23 | 2.37 | 7.35 | 2.71 | 114.19 | 0.02 | 1.08 | 6.97 |
| TRUETHK | 8 | 8 | 0.71 | 18.67 | 5.08 | 42.68 | 6.53 | 128.56 | 0.69 | 1.31 | 14.55 |
| TRUETHK | 9 | 11 | 0.33 | 6.04 | 2.33 | 3.22 | 1.79 | 76.90 | 0.36 | 1.48 | 5.20 |
| TRUETHK | 10 | 8 | 0.10 | 3.18 | 0.87 | 1.07 | 1.04 | 119.24 | 0.10 | 0.22 | 1.92 |
| TRUETHK | All | 89 | 0.02 | 47.12 | 4.33 | 36.49 | 6.04 | 139.43 | 0.26 | 2.95 | 9.62 |
Table 14-7. Statistical Summary– H2 Composites
| FIELD | ZONE | NUMBER | MINIMUM | MAXIMUM | MEAN | VARIANCE | STANDDEV | COVARTN% | PCTL10 | PCTL50 | PCTL90 |
| Cu_pct | 2 | 119 | 0.31 | 4.00 | 0.91 | 0.19 | 0.44 | 48.6 | 0.39 | 0.76 | 1.47 |
| Cu_pct | 3 | 54 | 0.31 | 2.70 | 0.87 | 0.25 | 0.50 | 57.5 | 0.39 | 0.80 | 1.60 |
| Cu_pct | 5 | 12 | 0.31 | 1.74 | 0.93 | 0.18 | 0.43 | 45.8 | 0.34 | 0.99 | 1.22 |
| Cu_pct | All | 185 | 0.31 | 4.00 | 0.90 | 0.21 | 0.45 | 50.2 | 0.39 | 0.77 | 1.57 |
| Zn_pct | 2 | 34 | 0.00 | 0.36 | 0.07 | 0.003 | 0.05 | 73.8 | 0.01 | 0.06 | 0.16 |
| Zn_pct | 3 | 15 | 0.01 | 0.41 | 0.13 | 0.010 | 0.10 | 78.5 | 0.02 | 0.12 | 0.31 |
| Zn_pct | 5 | 4 | 0.05 | 0.30 | 0.09 | 0.002 | 0.05 | 53.2 | 0.03 | 0.12 | 0.23 |
| Zn_pct | All | 53 | 0.00 | 0.41 | 0.09 | 0.006 | 0.07 | 82.0 | 0.01 | 0.08 | 0.24 |
| TRUETHK | 2 | 119 | 0.02 | 17.7 | 4.3 | 13.3 | 3.6 | 84.0 | 0.4 | 3.5 | 9.0 |
| TRUETHK | 3 | 55 | 0.46 | 15.5 | 3.1 | 11.4 | 3.4 | 107.3 | 0.5 | 2.0 | 8.4 |
| TRUETHK | 5 | 12 | 0.72 | 20.0 | 7.9 | 40.9 | 6.4 | 81.3 | 0.7 | 7.8 | 15.1 |
| TRUETHK | All | 186 | 0.02 | 20.0 | 4.2 | 15.7 | 4.0 | 94.1 | 0.6 | 2.3 | 9.7 |
Table 14-8. Statistical Summary– SM Composites
| FIELD | ZONE | NUMBER | MIN | MAX | MEAN | VARIANCE | STANDDEV | COVARTN% | PCTL10 | PCTL50 | PCTL90 |
| Cu_pct | 2 | 42 | 0.31 | 1.62 | 0.92 | 0.17 | 0.41 | 44.94 | 0.41 | 0.79 | 1.32 |
| Cu_pct | 3 | 3 | 1.60 | 1.72 | 1.66 | 0.00 | 0.04 | 2.67 | 1.54 | 1.69 | 1.71 |
| Cu_pct | 5 | 32 | 0.34 | 1.81 | 0.99 | 0.08 | 0.29 | 29.13 | 0.48 | 0.93 | 1.31 |
| Cu_pct | All | 77 | 0.31 | 1.81 | 1.00 | 0.15 | 0.38 | 38.30 | 0.46 | 0.90 | 1.44 |
| Zn_pct | 2 | 42 | 0.01 | 0.39 | 0.15 | 0.01 | 0.08 | 55.65 | 0.03 | 0.12 | 0.25 |
| Zn_pct | 3 | 2 | 0.22 | 0.23 | 0.22 | 0.00 | 0.00 | 0.56 | 0.22 | 0.23 | 0.23 |
| Zn_pct | 5 | 32 | 0.03 | 0.28 | 0.15 | 0.00 | 0.05 | 33.57 | 0.09 | 0.15 | 0.23 |
| Zn_pct | All | 76 | 0.01 | 0.39 | 0.16 | 0.00 | 0.07 | 44.34 | 0.04 | 0.15 | 0.24 |
| TRUETHK | 2 | 42 | 0.00 | 15.84 | 2.65 | 10.08 | 3.17 | 119.99 | 0.15 | 1.31 | 6.43 |
| TRUETHK | 3 | 3 | 1.75 | 9.43 | 5.71 | 9.86 | 3.14 | 54.95 | 5.97 | 8.39 | |
| TRUETHK | 5 | 32 | 0.30 | 13.55 | 4.03 | 11.73 | 3.43 | 85.04 | 0.97 | 2.31 | 8.44 |
| TRUETHK | All | 77 | 0.00 | 15.84 | 3.34 | 11.44 | 3.38 | 101.26 | 0.31 | 1.80 | 7.96 |
| Adam Wheeler | 20th May 2025 |
| Technical Report on the Mineral Resources of the Sulitjelma Project | 71 |
Figure 14-21. RD – Cu Experimental Isotropic Variograms
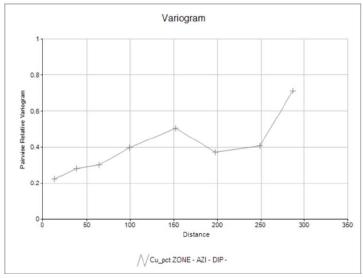
Figure 14-22. H2 - Cu Experimental Isotropic Variograms
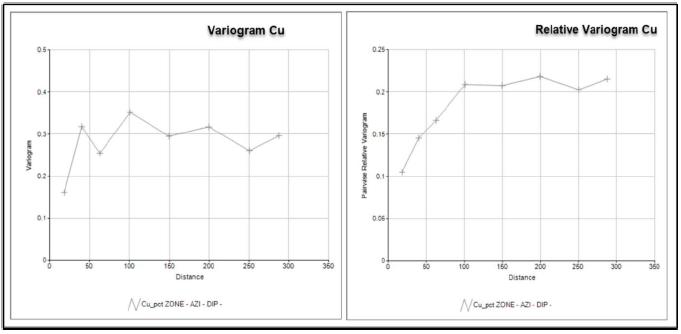
| Adam Wheeler | 20th May 2025 |
| Technical Report on the Mineral Resources of the Sulitjelma Project | 72 |
14.7 Volumetric Modelling
Separate volumetric block models were set up for each of the SD, H2 and RD deposits using the following procedure:
| 1. | DTM Creation. A DTM was generated, based on the centre of each intersection. Some additional control strings were used to limit define the extent of each DTM. |
| 2. | Prototype. A model prototype was set up, using 10m x 10m blocks laterally, and columnar (variable height blocks in the Z direction) for SM and 5m high parent blocks for RD and H2. |
| 3. | Initial Zone Modelling. Based on the DTMs, zone blocks were generated with an artificially set 2m sub-cell height. |
| 4. | Thickness Estimation. Composite apparent true thickness values were estimated into zone sub-blocks, using inverse-distance weighting. The sub-cell heights were then set to the estimated thickness values. |
A summary of the model prototypes is shown in Table 14-9, which are depicted in plan in Figure 14-23. Prior to estimation, blocks were split vertically into 5m high sub-cells.
Table 14-9. Summary of Model Prototypes
| RD | Minumum | Maximum | Size | Number | Extent | |
| X | 543,500 | 547,000 | 5 | 700 | 3,500 | |
| Y | 7,448,100 | 7,450,000 | 5 | 380 | 1,900 | |
| Z | - | 500 | 350 | 850 | 1 | 850 |
| H2 | Minumum | Maximum | Size | Number | Extent | |
| X | 547,120 | 549,100 | 5 | 396 | 1,980 | |
| Y | 7,447,060 | 7,448,600 | 5 | 308 | 1,540 | |
| Z | - | 400 | 600 | 1,000 | 1 | 1,000 |
| SM | Minumum | Maximum | Size | Number | Extent | |
| X | 542,000 | 543,000 | 10 | 100 | 1,000 | |
| Y | 7,444,800 | 7,445,900 | 10 | 110 | 1,100 | |
| Z | 250 | 450 | 200 | 1 | 200 |
| Adam Wheeler | 20th May 2025 |
| Technical Report on the Mineral Resources of the Sulitjelma Project | 73 |
Figure 14-23. Plan of Model Prototypes
[Blue = Drill holes in current database; Green = 10m surface contours]
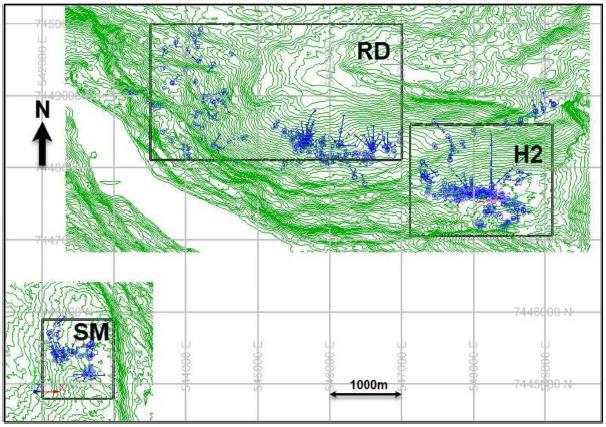
| Adam Wheeler | 20th May 2025 |
| Technical Report on the Mineral Resources of the Sulitjelma Project | 74 |
14.8 Grade Estimation
Cu and Zn grade values were estimated into the zone sub-blocks, using inverse-distance weighting. Alternative values were also estimated using nearest-neighbour estimation, for validation purposes. The estimation parameters applied are summarised in Table 14-10.
Table 14-10. Grade Estimation Parameters
| Distances (m): | ||||||||
| Max. Minimum | ||||||||
| Field | Search | Along- | Down- | Cross- | Minimum | Maximum | Comps Per | No. of |
| Volume | Strike | Dip | Strike | Composites | Composites | Drillhole | Drillholes | |
| 1 | 50 | 50 | 10 | 3 | 15 | 2 | 2 | |
| Cu/Zn | 2 | 100 | 100 | 20 | 3 | 15 | 2 | 2 |
| 3 | 200 | 200 | 40 | 1 | 7 | 2 | 1 | |
Notes
. Main grades estimated using ID^2
. Grades also estimated NN, for validation purposes
. Density value 3t/m3 assumed
. Blocks for estimation in RD and H2 sized 10m x 10m x 5m
. Blocks for estimation in SM sized 10m x 10m x Columnar
A global density of 3t/m3 was assumed, as discussed in Section 12.6. Example cross-sections of the estimated grade models are shown in Figure 14-24 to Figure 14-26. A complete set of grade sections for RD, SM and H2 deposits are shown in Appendices B, C and D respectively.
Figure 14-24. Example Cross-Section – RD
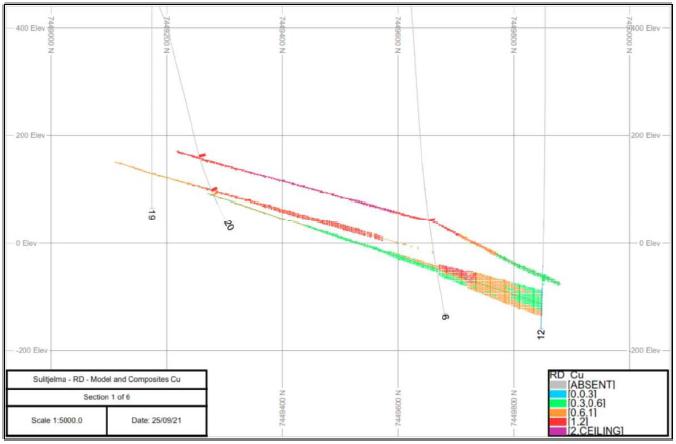
| Adam Wheeler | 20th May 2025 |
| Technical Report on the Mineral Resources of the Sulitjelma Project | 75 |
Figure 14-25. Example Cross-Section – H2
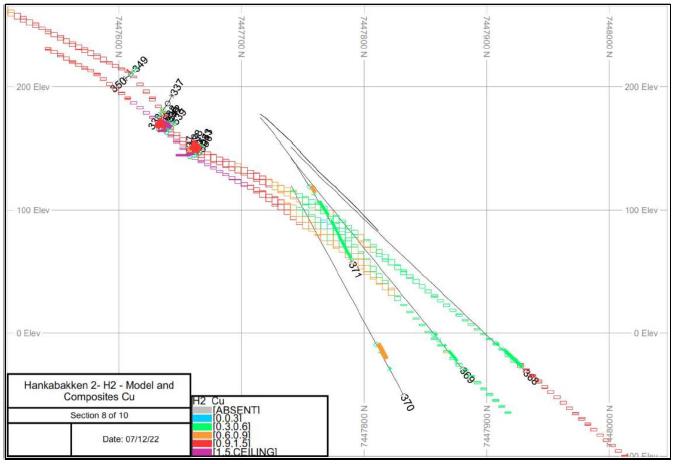
Figure 14-26. Example Cross-Section – SM
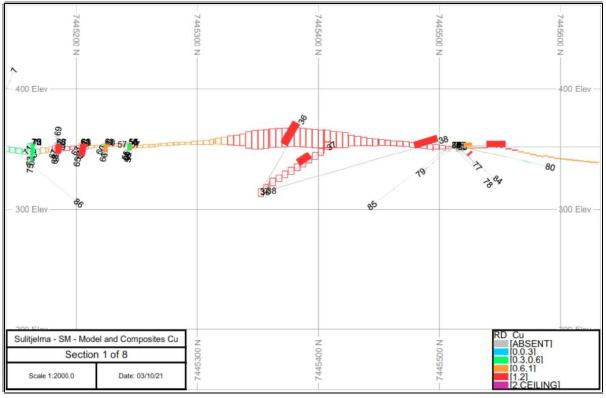
| Adam Wheeler | 20th May 2025 |
| Technical Report on the Mineral Resources of the Sulitjelma Project | 76 |
14.9 Resource Classification
Definitions for resource categories used in this report are consistent with CIM (2014) definitions incorporated by reference into NI 43-101. In the CIM classification, a Mineral Resource is defined as “a concentration or occurrence of solid material of economic interest in or on the Earth’s crust in such form, grade or quality and quantity that there are reasonable prospects for eventual economic extraction. The location, quantity, grade or quality, continuity, and other geological characteristics of a Mineral Resource are known, estimated, or interpreted from specific geological evidence and knowledge, including sampling. Mineral Resources are classified into Measured, Indicated, and Inferred categories. A Mineral Reserve is defined as the “economically mineable part of a Measured and/or Indicated Mineral Resource” demonstrated by studies at pre-feasibility or feasibility level as appropriate. Mineral Reserves are classified into Proven and Probable categories.
All mineral resources estimated in this study have been classified as Inferred category. The rationale for this decision includes the following:
| · | A complete lack of QAQC samples in the available data sets. However, it is believed prior operators conducted their work in accordance with the best practices of the period. This is supported by the continued existence of core and related inventory data at Lokken. |
| · | Extremely limited density data sets available. |
| · | Limited underground geological mapping information. |
| · | Dependence on some drill holes with very poor intersection angles. |
| Adam Wheeler | 20th May 2025 |
| Technical Report on the Mineral Resources of the Sulitjelma Project | 77 |
14.10 Model Validation
For the mineral resource estimation, model validation included the following steps:
14.10.1 Cross-Sections
Cross-sections were prepared for each deposit and for each of their respective zones, then compared with the downhole composite data. These sections are shown in Appendix B, C and D.
14.10.2 Global Comparison of Grades
The overall average sample and composite metal grades were compared with global average grades from each block model, as interpolated by inverse-distance weighting and nearest neighbour. These results are summarised below in Table 14-11, showing reasonably good correspondence.
Table 14-11. Global Comparison of Average Grades
| FIELD | ZONE | Samples Composites | Model ID | Model NN | |
| Cu_pct | 2 | 0.88 | 0.91 | 0.78 | 0.74 |
| Cu_pct | 3 | 0.82 | 0.87 | 0.80 | 0.76 |
| Cu_pct | 5 | 1.03 | 0.93 | 0.97 | 0.94 |
| Zn_pct | 2 | 0.08 | 0.07 | 0.07 | 0.07 |
| Zn_pct | 3 | 0.24 | 0.13 | 0.13 | 0.15 |
| Zn_pct | 5 | 0.12 | 0.09 | 0.12 | 0.13 |
14.10.3 Local Comparison of Grades
Average grades along vertical columnar (50 m thick) block model slices were determined, derived from the inverse-distance and nearest neighbour grades. These were shown, along with the average composites’ grades and total tonnages on the same slices, in comparative swath plots for Cu, as shown in Figure 14-27. These graphs show that the average block model grades compare reasonably well with the corresponding average composite grades.
| Adam Wheeler | 20th May 2025 |
| Technical Report on the Mineral Resources of the Sulitjelma Project | 78 |
Figure 14-27. Swath Plots – Cu
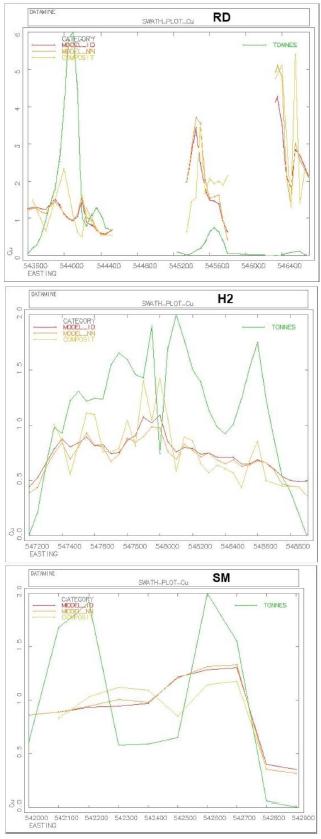
| Adam Wheeler | 20th May 2025 |
| Technical Report on the Mineral Resources of the Sulitjelma Project | 79 |
14.11 Resource Evaluation
For reporting purposes for a mineral resource estimate connected with a potential future underground mining operation, to comply with ‘reasonable prospects of eventual economic extraction’ guidelines, the following steps were completed:
| 1) | Cut-Off. An economic cut-off grade was determined, applicable to underground mining at Sulitjelma deposit, as summarised in Table 14-13. This also shows the parameters used to determine a copper-equivalent (Cu_Eq) grade values, derived from both Cu and Zn. The assumed recovery values come from the 2020 testwork. The Cu_Eq parameters stem from price, recovery and payability values. The cut-off applied for resource evaluation was 0.6% CuEq. |
| 2) | Constraining Volumes. A mineable shape optimisation (“MSO”) was run (Datamine process MSO), to generate reasonably practical constraining wireframe volumes for a mineral resource estimate. The parameters used in this optimisation are summarised in Table 14-12 This applied selectivity means that a small amount of sub-0.6%Cu_Eq material is taken within the estimation process (‘must-take’) and some +0.6%Cu_Eq material is excluded. |
| 3) | Evaluation. The estimation of Inferred mineral resources was broken down by zone and deposit, and they are summarised in Table 14-18, showing grades of Cu and Zn, as well as average apparent true thickness values. Grade-tonnage tables of the different regions, as well as overall, are shown in Table 14-14 to Table 14-17. |
Table 14-12. MSO Parameters
| Factor | Unit | Value |
| Cut-Off | %Cu_Eq | 0.6 |
| Minimum height | m | 2.2 |
| Minimum length along strike | m | 10 |
| Minimum length down-dip | m | 10 |
| Minimum waste pillar thickness | m | 7 |
| Adam Wheeler | 20th May 2025 |
| Technical Report on the Mineral Resources of the Sulitjelma Project | 80 |
Table 14-13. Cut-Off Grade and Cu_Eq Parameters
| Values | ||
| Cu Metal Price | 4.2 | $/lb |
| 9,259 | $/t | |
| Cu Processing | ||
| Processing Recovery | 92.0% | |
| Concentrate Grade | 29.5% | % Cu |
| Assumed Feed Grade | 0.83% | % Cu |
| Cu Smelter Terms | ||
| TC/RC | 65 | $/t conc |
| 220 | $/t Cu product | |
| Freight Charge | 70 | $/t conc |
| 2 37 | $/t Cu product | |
| Payability | 96.5% | |
| Operating Costs | ||
| Mining | 35 | $/t |
| G&A + infra + closure + royalty | 5 | $/t |
| Processing | 10 | $/t |
| Total = mining, G&A, processing | 50 | |
| Breakeven Cu Cut-Off | 0.6% | %Cu |
| Zn Contribution to Cu_Equivalent | ||
| Zn metal price | 1.25 | $/lb |
| 2,756 | $/t | |
| Zn processing recovery | 57% | |
| Zn Concentrate Grade | 51% | %Zn |
| Zn payability | 86% | |
| CuEq Coefficient | 0.16 | %CuEq/%Zn |
| Adam Wheeler | 20th May 2025 |
| Technical Report on the Mineral Resources of the Sulitjelma Project | 81 |
Table 14-14. Grade-Tonnage Table – RD Region, Inferred Resources Only
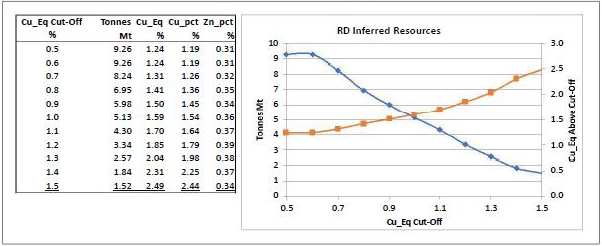
Table 14-15. Grade-Tonnage Table – H2 Region, Inferred Resources Only
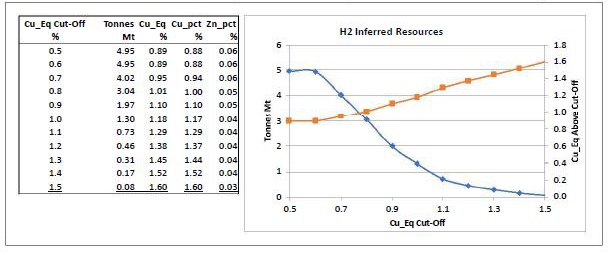
Table 14-16. Grade-Tonnage Table – SM Region, Inferred Resources Only
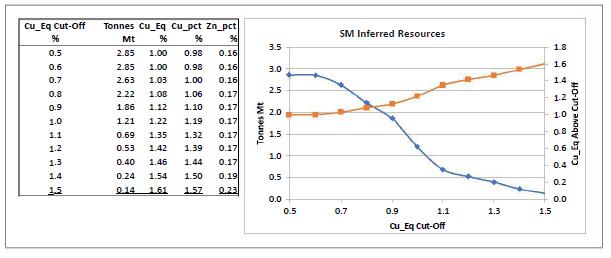
| Adam Wheeler | 20th May 2025 |
| Technical Report on the Mineral Resources of the Sulitjelma Project | 82 |
Table 14-17. Grade-Tonnage Table – RD, H2 and SM Regions, Inferred Resources Only
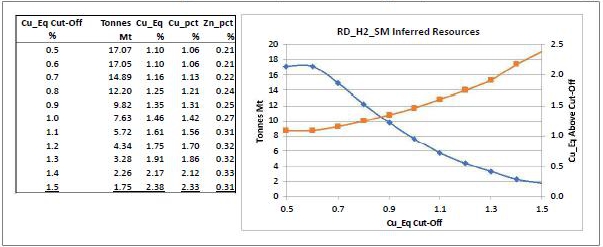
Table 14-18. Constrained Mineral Resource Estimate Statement
Effective Date: 20th February 2025
| Inferred Resources By Zone | Sub-Totals | |||||||||
| Region | Zone | Tonnes | Cu | Zn | Cu_Eq | Thickness | Tonnes | Cu | Zn | Cu_Eq |
| Kt | % | % | % | m | Kt | % | % | % | ||
| 2 | 4,188 | 1.45 | 0.35 | 1.50 | 5.2 | |||||
| Rupsi | 3 | 1,499 | 0.95 | 0.19 | 0.98 | 5.5 | ||||
| 5 | 2,188 | 0.82 | 0.37 | 0.88 | 15.7 | 7,874 | 1.18 | 0.33 | 1.23 | |
| 6 | 410 | 1.40 | 0.24 | 1.43 | 3.6 | |||||
| 7 | 126 | 0.77 | 0.15 | 0.79 | 2.4 | |||||
| Dypet | 8 | 484 | 0.89 | 0.11 | 0.91 | 6.8 | ||||
| 9 | 163 | 2.01 | 0.25 | 2.05 | 2.5 | |||||
| 10 | 201 | 1.39 | 0.36 | 1.45 | 2.9 | 1,384 | 1.23 | 0.20 | 1.27 | |
| 2 | 3,031 | 0.88 | 0.07 | 0.89 | 4.2 | |||||
| Hankabakken II | 3 | 1,471 | 0.86 | 0.05 | 0.86 | 3.1 | ||||
| 5 | 453 | 1.00 | 0.02 | 1.00 | 9.1 | 4,955 | 0.88 | 0.06 | 0.89 | |
| 2 | 455 | 1.15 | 0.19 | 1.18 | 3.6 | |||||
| Sagmo | 3 | 193 | 1.56 | 0.14 | 1.58 | 6.4 | ||||
| 5 | 2,205 | 0.89 | 0.15 | 0.91 | 4.1 | 2,853 | 0.98 | 0.16 | 1.00 | |
| Total | 17,066 | 1.06 | 0.21 | 1.10 | 6.1 | |||||
Notes:
| 1. | CIM definitions were followed for MRE. |
| 2. | All resources reported are categorised Inferred; no Measured or Indicated resources. |
| 3. | Thickness reported above shows the average Apparent True Thickness values. |
| 4. | A minimum mining thickness of 2.2 m was applied in making the MRE constraint wireframes. |
| 5. | The MRE constraint wireframes were generated using a preliminary MSO, based on a cut-off grade of 0.60% Cu_Eq, related to potential underground mining. |
| 6. | Assumed parameters for the cut-off grade and Cu-equivalent (Cu_Eq) calculations included: |
| Prices: | USD 4.20/lb Cu, USD 1.25/lb Zn | |
| Processing recoveries: | 92% Cu, 57% Zn | |
| Payabilities: | 96.5% Cu, 86% Zn |
| 7. | For the cut-off grade calculation, the assumed total operating cost was $50/t of ore. |
| 8. | A global density value of 3 t/m3 was assumed. |
| 9. | Rounding may result in apparent summation differences between tonnes, grades and metal content; not considered material. |
| 10. | Mineral Resources are not Mineral Reserves and do not have demonstrated economic viability. |
| Adam Wheeler | 20th May 2025 |
| Technical Report on the Mineral Resources of the Sulitjelma Project | 83 |
15 MINERAL RESERVE ESTIMATES
Not applicable
16 MINING METHODS
Not applicable
17 RECOVERY METHODS
Not applicable
18 PROJECT INFRASTRUCTURE
Not applicable
19 MARKET STUDIES AND CONTRACTS
Not applicable
20 ENVIRONMENTAL STUDIES, PERMITTING AND SOCIAL IMPACT
Not applicable
21 CAPITAL AND OPERATING COSTS
Not applicable
22 ECONOMIC ANALYSIS
Not applicable
| Adam Wheeler | 20th May 2025 |
| Technical Report on the Mineral Resources of the Sulitjelma Project | 84 |
23 ADJACENT PROPERTIES
There are two other Exploration companies with exploration licenses in or close to Sulitjelma:
Sulis Green Future has exploration licenses immediately to the north of NSG’s licenses (Figure 23-1).
VMS Exploration have exploration licenses to the north as well as overlying NSG’s licenses. They do not have any Mining licenses in the Sulitjelma area (Figure 23-2).
This information is publicly disclosed and the source of this information is from the Norwegian Mapping Authorities web site (Kartverket).
The Author has not visited these other properties and is therefore unable to verify information pertaining to the presence of mineralization on the adjacent properties. These properties are not necessarily indicative of the mineralization associated with the Sulitjelma project that is the subject of this report. The information provided in this section is simply intended to provide examples of other properties that exist in the region. The Author is not aware of any historical estimates of mineral resources or mineral reserves relating to these adjacent properties.
Figure 23-1. Plan of Sulis Green Future License Areas
[Sulis Green Future licenses in Blue; Sulitjelma licenses in Black]
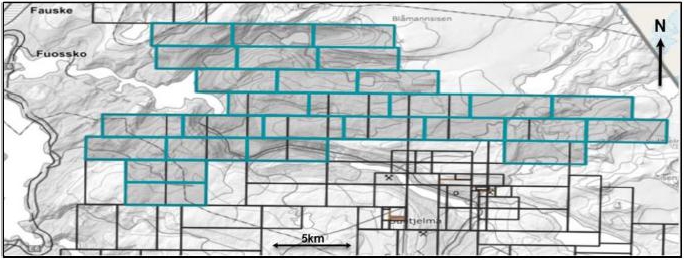
| Adam Wheeler | 20th May 2025 |
| Technical Report on the Mineral Resources of the Sulitjelma Project | 85 |
Figure 23-2. Plan of VMS Exploration License Areas
[VMS Exploration licenses in Blue; Sulitjelma licenses in Black]
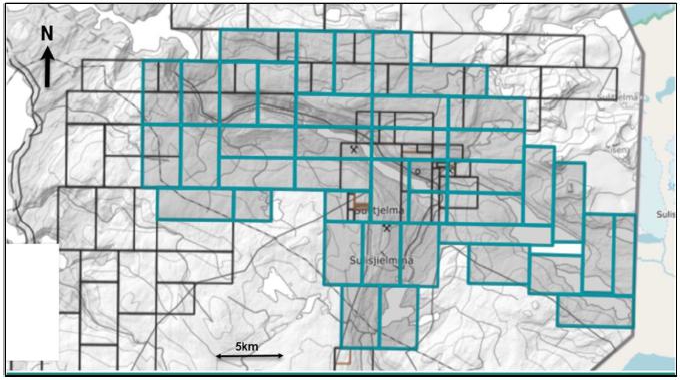
| Adam Wheeler | 20th May 2025 |
| Technical Report on the Mineral Resources of the Sulitjelma Project | 86 |
24 OTHER RELEVANT INFORMATION
Not applicable.
25 INTERPRETATION AND CONCLUSIONS
25.1 Risks and Uncertainties
There are several risks and uncertainties associated with the Sulitjelma project that should be considered; however, there are also several generic risks that are associated with nearly all exploration and mining project, including but not limited to the following:
| · | Sensitivity of the mineral resource to metal pricing |
| · | Supply chain cost escalation for contractors and service providers |
| · | Possible exploration permitting difficulties, related costs, and resulting delays |
The project specific risks and uncertainties that the Author has identified are discussed in this section of the report.
25.1.1 Drill holes
There are some errors associated with elevation of surface drill hole collars. These errors can be mitigated with check measurements of surface drill hole collars using a differential GPS. It would also be recommended to have a LiDAR survey flown over the Sulitjelma Project area for cross checking with the differential GPS survey. Similarly, if and where possible, check surveys should also be made of available underground drill hole collars.
25.1.2 Density Measurements.
There is a considerable lack of available density data for samples collected from drill core associated with any of the deposits. This lack of density data creates a corresponding risk with respect to the tonnage estimation. The risk can be mitigated in the future by collecting more density measurements of available drill core, as well as proactively taking density measurements from drill core during any new diamond drilling.
25.1.3 Historic QA/QC Procedures.
There is almost no information available on historical QAQC. To help mitigate the risks associated with use of the historical drill hole data, a twin drilling program would be required. A full QAQC program would need to be followed for the sampling associated with such updated drilling. The twin holes need to duplicate a small proportion of the original drill holes for each deposit or at least end up with new mineralised intersections that are similar to the original, historical intersections. Statistical results between the twinned drill holes would need to demonstrate a good correspondence between the current and historical assay data.
Without such a verification exercise, it is unlikely that the historical drilling data would be acceptable to use for the categorisation of Indicated resources.
| Adam Wheeler | 20th May 2025 |
| Technical Report on the Mineral Resources of the Sulitjelma Project | 87 |
25.1.4 Mined-Out Areas
The extent of historic mined-out areas has been taken from old plans but should be validated. There is a risk that inaccuracies of this data of the historical mined-out areas could affect the estimation of currently available resources. This risk could be mitigated by updated volumetric surveys of mined out areas. Although access might be difficult in some areas, modern survey equipment, including the use of drones, could help with this analysis.
25.2 Results and Interpretations
There are several opportunities to improve the current results, that should be investigated further as part of the ongoing development of the Sulitjelma project.
Most of the regions evaluated in this study have some parts which are relatively densely sampled, in areas in or close to the old underground workings. Going down-dip, the drill hole spacings are generally much wider, with more reliance on much longer underground drill holes, often with very poor intersection angles, or on relatively few surface drill holes.
Further drilling campaigns could therefore have a significant effect on the development of the project, in terms of:
| · | The use of twin holes to help verify all or part of the historical drilling data. |
| · | Increased Inferred resource quantities with more closely spaced drilling down-dip and along-strike, as well as extension of the mineralised resources. |
| · | Estimation of some Indicated resources with even more closely spaced drilling. To achieve Indicated resource categorisation using any of the historical drill hole data, the results from twin drilling would have to help verify the use of all or part of the historical drill hole database. |
Additional drilling should be designed to enable a significant proportion of the deposit to be reclassified into a higher category of confidence, such as Indicated category, as well as provide a more accurate interpretation of geology and mineralised zones. Stakeholders should be cautioned that additional drilling is not a guarantee for upgrading the confidence of an existing resource category.
| Adam Wheeler | 20th May 2025 |
| Technical Report on the Mineral Resources of the Sulitjelma Project | 88 |
25.3 Conclusions
The updated mineral resource estimate with an effective date of February 20th, 2025, has these conclusions from the Author and are as follows:
| · | The geological setting and character of the massive and semi-massive sulphide mineralisation, hosted within a chlorite-biotite breccia, as well as the Cu and Zn production history, are of sufficient merit to justify additional exploration expenditures. |
| · | Most historic drill holes in the current database related to the mineral resources at Sulitjelma are located in 3 different regions, totalling 601 core drill holes a total meterage of 78,144 metres. The regions being evaluated are on the periphery of older mined-out areas. |
| · | Historic drilling has identified strata-bound zones that are generally extensions of previously mined areas above, are well mineralized and remain open to depth. |
| · | The Author has reviewed the available sample data, and although the there is a lack of QAQC information available, the Author is of the opinion that the database for the mineral resource is of sufficient quality to estimate mineral resources for an Inferred category. |
| · | Mineral resources were estimated using a 0.6% copper-equivalent cut-off value for potential underground extraction. This cut-off level would also need to be studied further in the future. |
| · | The mineral resource estimate for the Sulitjelma deposit is presented in Table 25.1 below. There is general support for the project, at the current stage of mineral resource development, from the affected communities in the area, as those communities will benefit from local employment. There is a good dialogue with people from the local reindeer district. |
Table 25.1. Mineral Resource Estimate Summary for the Sulitjelma deposit
Effective Date: 20th February 2025
| Inferred Resources | ||||
| Region | Tonnes | Cu | Zn | Cu_Eq |
| Kt | % | % | % | |
| Rupsi/ Dypet | 9,258 | 1.19 | 0.31 | 1.24 |
| Hankabakken II | 4,955 | 0.88 | 0.06 | 0.89 |
| Sagmo | 2,853 | 0.98 | 0.16 | 1.00 |
| Total | 17,066 | 1.06 | 0.21 | 1.10 |
Notes:
| 1. | CIM definitions were followed for MRE. |
| 2. | All resources reported are categorised Inferred; there are no Measured or Indicated resources. |
| 3. | A minimum mining thickness of 2.2 m was applied in making the MRE constraint wireframes. |
| 4. | The MRE constraint wireframes were generated using a preliminary MSO, based on a cut-off grade of 0.6% Cu_Eq, related to potential underground mining. |
| 5. | Assumed parameters for the cut-off grade and Cu-equivalent (Cu_Eq) calculations included: |
| Prices: | USD 4.20/lb Cu, USD 1.25/lb Zn | |
| Processing recoveries: | 92% Cu, 57% Zn | |
| Payabilities: | 96.5% Cu, 86% Zn |
| 6. | For the cut-off grade calculation, the assumed total operating cost was $50/t of ore. |
| 7. | A global density value of 3 t/m3 was assumed. |
| 8. | Rounding may result in apparent summation differences between tonnes, grades and metal content; not considered material. |
| 9. | Mineral Resources are not Mineral Reserves and do not have demonstrated economic viability. |
| Adam Wheeler | 20th May 2025 |
| Technical Report on the Mineral Resources of the Sulitjelma Project | 89 |
26 RECOMMENDATIONS
26.1 Sample Preparation, Analyses, and Security
| · | QAQC Program. Develop rigorous quality control and quality assurance (“QAQC”) policy for standards, blanks and duplicate samples for all on-going drilling and sampling work that meets or exceeds all industry best practice standards. |
| · | CRMs. The QAQC program will also need to include the selection of certified reference material (“CRM”) that are sourced from a similar deposit type and possess metal values close to the typical grades of the Sulitjelma Project for copper and zinc. It is noted that when both gold and silver are better characterized, it might be needed to adjust the CRMs to accommodate the precious metal content. |
| · | Laboratories. As well as using an ISO certified primary laboratory, the QAQC program will also require an umpire or secondary independent laboratory, which should also be ISO certified. A percentage of the new samples should be emitted using select analysis methodologies that are like the primary laboratory. This comparison will provide assurances that any variation of metal grades seen in the analytical certificates are valid and respected. |
| · | Core Shack. A secure premises will be required for drill core logging that can also provide storage for the drill core and all returned pulps and reject materials from the analytical facilities. |
| · | Density Measurement. Equipment needs to be put into place and procedures established for density measurement from the drill core of any new work program, as well as collect check density measurements from historical core at Lokken. |
| · | Point Load Testing (“PLT”). To enhance any geomechanical measurements, a PLT needs to be acquired and used in the core shack on drill core from any new work program. These measurements compliment the collection of RQD and RMR during the core logging process, and can be used by engineers in the future for helping refine the ground support requirements. |
26.2 Data Verification
| · | Relogging of Drill Core. A relogging program should be completed of Sulitjelma Project historical drill core stored at Lokken. This work would be more extensive than any previous relogging exercise; noting that relogging will be difficult, as much of the core is extremely dirty. If possible, some check sampling should also be completed while relogging is ongoing, although in most cases there is little, or no drill core left in the core boxes from the originally sampled intersections. As well, additional sampling of previously unsampled drill core should be done, noting that at current cut-off levels for the mineral resource estimate, there are potentially extended or new mineralised intersections that could warrant follow-up. |
| · | Drilling Database. The current database needs to be enhanced so that YEAR identification data is recorded for each drill hole. This is very important, as in on-going verification and estimation work, it may be necessary to filter the historic data with relation to the date of age of the data available. |
| · | Twin Drilling. A twin drilling program should be completed during the next work program, to help verify all or part of the historical drilling data for each deposit. NSG have already planned the extension of an existing underground adit, the Rupsi tunnel, for the purpose of providing drilling access. A suggested starting proportion of twinning could be 5%, with respect to historic drill holes for each deposit. When the assay results are returned from the laboratory and analysed, it can be determined if and where further twin drilling would be required. |
| Adam Wheeler | 20th May 2025 |
| Technical Report on the Mineral Resources of the Sulitjelma Project | 90 |
| · | Drill Hole Collars. During summer, historic surface drill hole collars should be found and resurveyed, where possible. Depending on the extent of underground access, the location and resurveying of underground drill hole collars should also be attempted. |
| · | Mined-Out Extents. Again, depending on underground access, surveys should be made of mined-out areas adjacent to the evaluated resources. Modern equipment, including the use of drones, could help with this check survey process. |
| · | Metallurgical Program. A full metallurgical audit should be undertaken regarding the production recoveries and any reports on file. Once there is new material available from drilling that is representative of the deposits, a new metallurgical program should be planned to encompass flotation test work, variability analysis, and lock cycle testing to ensure process design in the plant is setup for maximizing metal recovery. |
26.3 Exploration Program and Budget
For further development of the project, the Author recommends the exploration program already outlined by NSG. This work covers extension of the existing Rupsi tunnel by 1,000 m, and then using of this new tunnel to complete approximately 10,000 m of diamond drilling from underground. The intent of the drilling is to potentially upgrade confidence for the resources in the Rupsi deposit from Inferred category to Indicated category and allow some geomechanical modelling.
A summary breakdown of this work program is presented below, along with associated estimated costs expected to total approximately 4.6 M USD (Table 26-1).
Table 26-1. Proposed Budget
| Work Planned | Cost |
| M USD | |
| Extension of Rupsi Tunnel (1 km) | 3.4 |
| Diamond drilling (~10,000 m) | 1.2 |
| Total | 4.6 |
| Adam Wheeler | 20th May 2025 |
| Technical Report on the Mineral Resources of the Sulitjelma Project | 91 |
27 REFERENCES
Cook, Halls and Kaspersen, 1990. The Geology of the Sulitjelma Ore Field, Northern Norway-- Some New Interpretations. Economic Geology, Vol 85, pp 1720-1737.
Drake Resources, 2015. Quarterly Activities Report, September 2015.
Geis, H, 1978. Structural Control of Stratiform Sulfide Deposits, with A New Example from Sulitjelma. Economic Geology, Vol 73, pp. 1161-1177.
Nordrum, F.S., 1999. Minerals from the Sulitjelma Copper Mines, North Norway.
Outotec, 2013. Preliminary Feasibility Study, Nye Sulitjelma AS.
Promin, 2021. Lokken Fieldwork Report – Relogging of Old Drill Cores.
Sarb Consulting, 2020. Environmental Geochemical Assessment of Tailings Disposal in Langvatnet, Nye Sulitjelma Mines.
SGS Canada, 2020. An Investigation into The Flotation of Sample from Sulitjelma Mine. Report prepared for Sarb Consulting.
Wilson, M.R.. 1973. The Geological Setting of the Sulitjelma Ore Bodies, Central Norwegian Caledonides. Economic Geology, Vol 68, pp. 307-316.
| Adam Wheeler | 20th May 2025 |
| Technical Report on the Mineral Resources of the Sulitjelma Project | February 2025 |
Appendix A
Summary of Drill Hole Intersections
February 2025
| Appendix A – Summary of Intersections | Technical Report on the Mineral Resources of the Sulitjelma Project | |||
| February 2025 |
Intersections – Rupsi/Dypet
[TRUETHK = True Thickness in metres]
| BHID | FROM | TO | LENGTH | TRUETHK | Cu % | Zn % | ZONE | BHID | FROM | TO | LENGTH | TRUETHK | Cu % | Zn % | ZONE | |||||||||||||||||||||||||||||
| 1 | 399.2 | 402.2 | 3.0 | 2.9 | 4.42 | 0.25 | 2 | 140 | 635.0 | 656.0 | 21.0 | 18.7 | 0.93 | 0.04 | 8 | |||||||||||||||||||||||||||||
| 1 | 485.2 | 495.0 | 9.8 | 9.4 | 1.40 | 0.20 | 3 | 141 | 516.0 | 519.2 | 3.2 | 3.0 | 0.64 | 0.05 | 6 | |||||||||||||||||||||||||||||
| 3 | 413.0 | 414.0 | 1.0 | 1.0 | 0.70 | 0.17 | 2 | 141 | 540.8 | 551.2 | 10.4 | 6.9 | 0.39 | 0.09 | 7 | |||||||||||||||||||||||||||||
| 3 | 439.0 | 445.9 | 6.9 | 6.7 | 0.77 | 0.01 | 3 | 141 | 562.0 | 568.0 | 6.0 | 5.4 | 0.37 | 0.00 | 9 | |||||||||||||||||||||||||||||
| 3 | 452.0 | 456.0 | 4.0 | 3.8 | 0.94 | 0.07 | 5 | 155 | 16.1 | 24.4 | 8.4 | 4.8 | 3.06 | 0.42 | 6 | |||||||||||||||||||||||||||||
| 4 | 547.5 | 559.0 | 11.6 | 11.4 | 1.23 | 0.23 | 2 | 156 | 28.3 | 36.4 | 8.1 | 2.8 | 2.10 | 0.48 | 6 | |||||||||||||||||||||||||||||
| 5 | 536.0 | 539.0 | 3.0 | 3.0 | 0.94 | 0.02 | 2 | 158 | 94.6 | 111.1 | 16.6 | 2.1 | 3.45 | 0.65 | 6 | |||||||||||||||||||||||||||||
| 6 | 576.4 | 579.9 | 3.4 | 3.1 | 1.18 | 0.51 | 2 | 159 | 38.0 | 48.3 | 10.3 | 0.2 | 8.00 | 1.51 | 6 | |||||||||||||||||||||||||||||
| 8 | 625.0 | 628.6 | 3.6 | 3.2 | 6.82 | 0.65 | 2 | 162 | 71.3 | 80.4 | 9.2 | 2.3 | 1.16 | 0.13 | 9 | |||||||||||||||||||||||||||||
| 8 | 676.0 | 681.8 | 5.8 | 5.1 | 0.42 | 0.03 | 5 | 167 | 34.2 | 40.4 | 6.2 | 1.5 | 2.39 | 0.75 | 6 | |||||||||||||||||||||||||||||
| 9 | 380.5 | 381.5 | 1.0 | 1.0 | 2.06 | 1.42 | 2 | 168 | 32.4 | 42.0 | 9.6 | 3.0 | 4.23 | 0.44 | 6 | |||||||||||||||||||||||||||||
| 10 | 692.7 | 704.0 | 11.3 | 11.0 | 0.71 | 0.64 | 2 | 168 | 149.4 | 151.5 | 2.1 | 0.8 | 5.26 | 2.81 | 8 | |||||||||||||||||||||||||||||
| 10 | 712.0 | 716.0 | 4.0 | 3.9 | 0.68 | 1.54 | 3 | 169 | 87.0 | 123.7 | 36.7 | 9.7 | 1.81 | 0.14 | 6 | |||||||||||||||||||||||||||||
| 10 | 721.0 | 741.0 | 20.0 | 19.3 | 1.05 | 0.64 | 5 | 169 | 221.3 | 230.0 | 8.8 | 3.3 | 2.82 | 0.49 | 8 | |||||||||||||||||||||||||||||
| 11 | 785.0 | 786.0 | 1.0 | 1.0 | 0.31 | 0.01 | 2 | 170 | 29.0 | 39.5 | 10.5 | 3.7 | 2.55 | 0.29 | 6 | |||||||||||||||||||||||||||||
| 12 | 725.0 | 735.0 | 10.0 | 9.5 | 0.42 | 0.08 | 2 | 176 | 62.6 | 65.4 | 2.8 | 1.4 | 2.04 | 0.49 | 8 | |||||||||||||||||||||||||||||
| 12 | 740.0 | 741.0 | 1.0 | 0.9 | 0.30 | 0.07 | 3 | 187 | 34.0 | 38.0 | 4.0 | 2.2 | 1.38 | 0.28 | 6 | |||||||||||||||||||||||||||||
| 12 | 752.0 | 802.0 | 50.0 | 47.1 | 0.54 | 0.13 | 5 | 187 | 92.1 | 93.7 | 1.7 | 0.9 | 4.31 | 0.38 | 8 | |||||||||||||||||||||||||||||
| 19 | 337.3 | 339.3 | 2.0 | 1.9 | 0.66 | 3 | 188 | 116.0 | 118.8 | 2.8 | 0.7 | 0.67 | 0.06 | 6 | ||||||||||||||||||||||||||||||
| 20 | 319.1 | 323.8 | 4.7 | 3.9 | 1.17 | 2 | 188 | 128.4 | 135.0 | 6.7 | 1.4 | 0.73 | 0.06 | 9 | ||||||||||||||||||||||||||||||
| 20 | 387.9 | 392.2 | 4.3 | 3.2 | 1.13 | 3 | 189 | 60.0 | 76.2 | 16.2 | 5.3 | 0.93 | 0.18 | 6 | ||||||||||||||||||||||||||||||
| 20 | 397.6 | 400.0 | 2.4 | 1.8 | 0.71 | 5 | 189 | 131.6 | 133.9 | 2.3 | 0.6 | 1.49 | 0.92 | 9 | ||||||||||||||||||||||||||||||
| 41 | 24.9 | 31.0 | 6.1 | 6.0 | 0.47 | 9 | 189 | 153.5 | 157.0 | 3.5 | 1.0 | 0.66 | 0.02 | 9 | ||||||||||||||||||||||||||||||
| 42 | 24.1 | 26.6 | 2.5 | 2.4 | 2.17 | 6 | 189 | 189.0 | 193.0 | 4.0 | 1.2 | 0.36 | 0.06 | 8 | ||||||||||||||||||||||||||||||
| 61 | 0.0 | 13.9 | 13.9 | 5.0 | 2.80 | 6 | 189 | 202.0 | 204.3 | 2.3 | 0.7 | 1.86 | 0.02 | 8 | ||||||||||||||||||||||||||||||
| 61 | 75.3 | 76.4 | 1.1 | 0.3 | 5.10 | 9 | 190 | 53.7 | 61.4 | 7.7 | 2.8 | 1.93 | 0.33 | 6 | ||||||||||||||||||||||||||||||
| 63 | 0.0 | 3.8 | 3.8 | 0.1 | 1.99 | 7 | 190 | 105.2 | 107.0 | 1.8 | 0.1 | 3.09 | 0.38 | 7 | ||||||||||||||||||||||||||||||
| 63 | 65.0 | 66.4 | 1.4 | 0.0 | 1.96 | 7 | 191 | 65.0 | 86.3 | 21.3 | 3.5 | 1.95 | 0.46 | 6 | ||||||||||||||||||||||||||||||
| 64 | 15.4 | 16.5 | 1.1 | 1.1 | 0.80 | 7 | 191 | 172.5 | 174.2 | 1.6 | 0.3 | 3.52 | 1.41 | 6 | ||||||||||||||||||||||||||||||
| 66 | 19.3 | 22.8 | 3.5 | 3.2 | 1.17 | 6 | 192 | 117.6 | 146.4 | 28.8 | 5.7 | 0.55 | 0.21 | 6 | ||||||||||||||||||||||||||||||
| 66 | 45.3 | 48.3 | 3.1 | 2.8 | 0.49 | 9 | 192 | 244.9 | 252.3 | 7.5 | 1.6 | 1.31 | 0.39 | 7 | ||||||||||||||||||||||||||||||
| 68 | 15.7 | 19.3 | 3.6 | 3.4 | 2.17 | 7 | 192 | 289.7 | 323.0 | 33.3 | 7.2 | 0.90 | 0.21 | 7 | ||||||||||||||||||||||||||||||
| 68 | 28.0 | 29.4 | 1.4 | 1.3 | 0.72 | 9 | 193 | 130.0 | 139.6 | 9.6 | 1.7 | 0.60 | 0.23 | 6 | ||||||||||||||||||||||||||||||
| 89 | 86.2 | 159.0 | 72.9 | 0.2 | 2.10 | 10 | 214 | 329.7 | 333.0 | 3.3 | 0.2 | 0.77 | 0.68 | 10 | ||||||||||||||||||||||||||||||
| 91 | 261.5 | 264.7 | 3.2 | 0.1 | 5.12 | 10 | 214 | 342.0 | 344.0 | 2.0 | 0.1 | 0.32 | 0.01 | 10 | ||||||||||||||||||||||||||||||
| 92 | 147.6 | 178.5 | 30.9 | 1.6 | 1.71 | 10 | 215 | 114.4 | 131.0 | 16.6 | 3.2 | 1.40 | 0.31 | 10 | ||||||||||||||||||||||||||||||
| 93 | 124.7 | 132.0 | 7.3 | 0.3 | 0.34 | 10 | 218 | 166.3 | 181.0 | 14.7 | 1.3 | 4.74 | 1.07 | 10 | ||||||||||||||||||||||||||||||
| 135 | 559.0 | 563.0 | 4.0 | 3.6 | 1.97 | 0.03 | 6 | 250 | 384.5 | 396.2 | 11.7 | 10.7 | 0.61 | 0.19 | 2 | |||||||||||||||||||||||||||||
| 135 | 569.1 | 572.5 | 3.4 | 3.0 | 3.38 | 0.05 | 9 | 251 | 347.4 | 351.6 | 4.2 | 3.6 | 1.99 | 0.80 | 2 | |||||||||||||||||||||||||||||
| 137 | 637.0 | 638.0 | 1.0 | 0.9 | 0.44 | 0.01 | 6 | 253 | 248.7 | 254.4 | 5.7 | 5.3 | 0.49 | 0.23 | 2 | |||||||||||||||||||||||||||||
| 138 | 607.0 | 611.0 | 4.0 | 3.6 | 0.41 | 0.02 | 6 | 254 | 265.8 | 274.5 | 8.7 | 8.6 | 0.64 | 0.20 | 3 | |||||||||||||||||||||||||||||
| 138 | 621.0 | 622.6 | 1.7 | 1.5 | 1.38 | 1.03 | 9 | 255 | 268.6 | 277.2 | 8.6 | 8.4 | 0.48 | 0.14 | 3 | |||||||||||||||||||||||||||||
| 138 | 646.0 | 661.0 | 15.0 | 13.5 | 0.63 | 0.03 | 8 | 257 | 440.3 | 455.2 | 15.0 | 14.6 | 0.74 | 0.26 | 2 | |||||||||||||||||||||||||||||
| 140 | 614.5 | 616.0 | 1.5 | 0.9 | 2.09 | 0.72 | 7 | 260 | 430.1 | 435.0 | 4.9 | 4.7 | 0.57 | 0.19 | 2 | |||||||||||||||||||||||||||||
| 264 | 479.2 | 489.3 | 10.1 | 9.6 | 0.49 | 0.13 | 2 |
| Adam Wheeler | 2 |
| Appendix A – Summary of Intersections | Technical Report on the Mineral Resources of the Sulitjelma Project | |||
| February 2025 |
Intersections – Hankabakken II (1of 2)
| BHID | FROM | TO | LENGTH | TRUETHK | Cu % | Zn % | ZONE | BHID | FROM | TO | LENGTH | TRUETHK | Cu % | Zn % | ZONE | |||||||||||||||||||||||||||||
| 123 | 137.6 | 163.7 | 26.0 | 8.6 | 1.30 | 0.02 | 3 | 341 | 0.0 | 7.0 | 7.0 | 6.9 | 0.75 | - | 2 | |||||||||||||||||||||||||||||
| 125 | 140.3 | 152.8 | 12.6 | 3.0 | 1.11 | 0.02 | 3 | 342 | 0.0 | 3.1 | 3.1 | 3.0 | 1.48 | - | 3 | |||||||||||||||||||||||||||||
| 130 | 139.0 | 142.0 | 3.0 | 0.5 | 0.64 | 0.01 | 3 | 344 | 2.0 | 5.0 | 3.0 | 2.9 | 0.77 | - | 3 | |||||||||||||||||||||||||||||
| 130 | 156.9 | 160.0 | 3.1 | 0.5 | 0.55 | 0.03 | 3 | 345 | 0.0 | 2.0 | 2.0 | 2.0 | 1.10 | - | 2 | |||||||||||||||||||||||||||||
| 130 | 202.5 | 209.0 | 6.5 | 0.9 | 1.47 | - | 2 | 347 | 0.0 | 1.8 | 1.8 | 1.8 | 1.22 | - | 5 | |||||||||||||||||||||||||||||
| 213 | 236.7 | 270.0 | 33.3 | 15.5 | 0.38 | 0.09 | 3 | 348 | 3.5 | 6.5 | 3.0 | 2.9 | 1.05 | - | 2 | |||||||||||||||||||||||||||||
| 213 | 278.0 | 284.0 | 6.0 | 2.9 | 0.81 | 0.15 | 3 | 349 | 0.0 | 1.0 | 1.0 | 1.0 | 1.20 | - | 2 | |||||||||||||||||||||||||||||
| 272 | 134.0 | 138.1 | 4.1 | 3.9 | 0.71 | 0.05 | 2 | 351 | 10.6 | 12.0 | 1.4 | 1.4 | 0.93 | - | 2 | |||||||||||||||||||||||||||||
| 273 | 89.3 | 101.6 | 12.3 | 11.9 | 0.88 | 0.01 | 2 | 355 | 0.0 | 1.8 | 1.8 | 1.8 | 1.14 | - | 2 | |||||||||||||||||||||||||||||
| 274 | 97.0 | 108.0 | 11.0 | 10.2 | 0.81 | 0.01 | 2 | 356 | 5.6 | 7.9 | 2.3 | 2.3 | 0.57 | - | 3 | |||||||||||||||||||||||||||||
| 275 | 113.7 | 119.7 | 5.9 | 5.0 | 0.54 | 0.05 | 2 | 358 | 3.4 | 7.7 | 4.3 | 4.2 | 0.83 | - | 2 | |||||||||||||||||||||||||||||
| 276 | 77.3 | 86.9 | 9.6 | 8.9 | 0.72 | 0.01 | 2 | 361 | 0.0 | 14.7 | 14.7 | 3.8 | 1.02 | - | 2 | |||||||||||||||||||||||||||||
| 277 | 88.4 | 90.6 | 2.3 | 1.9 | 0.66 | 0.01 | 2 | 364 | 0.0 | 5.5 | 5.5 | 4.7 | 1.61 | - | 2 | |||||||||||||||||||||||||||||
| 294 | 67.1 | 80.9 | 13.8 | 13.6 | 0.47 | 0.12 | 2 | 365 | 7.0 | 31.0 | 24.0 | 11.9 | 0.77 | - | 2 | |||||||||||||||||||||||||||||
| 295 | 105.0 | 106.7 | 1.7 | 1.1 | 0.48 | 0.00 | 2 | 366 | 0.0 | 5.0 | 5.0 | 4.0 | 0.89 | - | 3 | |||||||||||||||||||||||||||||
| 295 | 110.9 | 113.0 | 2.1 | 1.3 | 0.47 | 0.24 | 3 | 366 | 10.0 | 21.7 | 11.7 | 9.4 | 1.13 | - | 2 | |||||||||||||||||||||||||||||
| 296 | 120.0 | 138.0 | 18.0 | 11.5 | 0.60 | 0.08 | 3 | 368 | 285.2 | 288.0 | 2.8 | 0.4 | 0.44 | - | 2 | |||||||||||||||||||||||||||||
| 297 | 100.0 | 102.4 | 2.4 | 1.7 | 0.45 | 0.08 | 2 | 368 | 294.6 | 314.4 | 19.8 | 2.6 | 0.95 | - | 2 | |||||||||||||||||||||||||||||
| 298 | 29.2 | 34.8 | 5.7 | 3.7 | 0.94 | 0.01 | 2 | 369 | 244.0 | 245.9 | 1.9 | 0.5 | 0.49 | - | 3 | |||||||||||||||||||||||||||||
| 299 | 23.3 | 28.4 | 5.2 | 4.6 | 0.98 | 0.01 | 2 | 369 | 256.0 | 258.0 | 2.0 | 0.5 | 0.54 | - | 3 | |||||||||||||||||||||||||||||
| 300 | 19.4 | 31.1 | 11.7 | 11.7 | 1.21 | 0.07 | 2 | 369 | 263.0 | 273.0 | 10.0 | 2.5 | 0.50 | - | 3 | |||||||||||||||||||||||||||||
| 301 | 47.0 | 65.8 | 18.8 | 15.4 | 0.87 | 0.13 | 2 | 371 | 110.0 | 125.0 | 15.0 | 5.3 | 0.52 | - | 2 | |||||||||||||||||||||||||||||
| 303 | 33.6 | 47.9 | 14.3 | 11.9 | 0.66 | 0.10 | 5 | 371 | 129.5 | 167.0 | 37.5 | 14.6 | 0.48 | - | 3 | |||||||||||||||||||||||||||||
| 304 | 56.2 | 59.3 | 3.1 | 0.9 | 1.01 | 0.30 | 5 | 373 | 552.0 | 554.0 | 2.0 | 0.9 | 0.40 | - | 2 | |||||||||||||||||||||||||||||
| 305 | 102.7 | 109.0 | 6.3 | 0.7 | 1.03 | 0.14 | 5 | 377 | 5.0 | 6.0 | 1.0 | 1.0 | 0.31 | - | 5 | |||||||||||||||||||||||||||||
| 306 | 50.2 | 60.5 | 10.3 | 10.1 | 1.13 | 0.06 | 2 | 378 | 0.0 | 9.0 | 9.0 | 8.9 | 0.45 | - | 5 | |||||||||||||||||||||||||||||
| 306 | 65.0 | 70.0 | 5.0 | 4.9 | 0.43 | 0.41 | 3 | 379 | 1.7 | 9.0 | 7.3 | 7.3 | 0.36 | - | 2 | |||||||||||||||||||||||||||||
| 308 | 40.3 | 47.0 | 6.7 | 6.7 | 1.22 | 0.05 | 5 | 380 | 0.0 | 13.0 | 13.0 | 12.9 | 0.57 | - | 5 | |||||||||||||||||||||||||||||
| 308 | 55.7 | 58.3 | 2.6 | 2.6 | 1.01 | 0.24 | 2 | 381 | 2.0 | 3.0 | 1.0 | 1.0 | 0.48 | - | 2 | |||||||||||||||||||||||||||||
| 310 | 90.3 | 92.4 | 2.1 | 1.7 | 0.82 | 0.06 | 2 | 382 | 9.8 | 11.7 | 1.9 | 1.8 | 0.31 | - | 2 | |||||||||||||||||||||||||||||
| 310 | 98.3 | 102.5 | 4.2 | 3.4 | 0.53 | 0.21 | 3 | 383 | 0.0 | 2.3 | 2.3 | 2.2 | 0.72 | - | 3 | |||||||||||||||||||||||||||||
| 312 | 103.4 | 115.5 | 12.1 | 8.4 | 0.50 | 0.10 | 2 | 386 | 5.0 | 10.6 | 5.6 | 5.3 | 1.00 | - | 2 | |||||||||||||||||||||||||||||
| 322 | 262.0 | 264.0 | 2.0 | 1.5 | 0.35 | 0.04 | 2 | 388 | 0.0 | 7.9 | 7.9 | 7.7 | 0.82 | - | 2 | |||||||||||||||||||||||||||||
| 322 | 275.0 | 281.3 | 6.3 | 4.7 | 0.68 | 0.12 | 3 | 389 | 0.0 | 6.8 | 6.8 | 6.7 | 0.98 | - | 2 | |||||||||||||||||||||||||||||
| 323 | 237.0 | 245.0 | 8.0 | 7.6 | 0.63 | 0.17 | 2 | 390 | 0.0 | 2.5 | 2.5 | 2.4 | 2.16 | - | 3 | |||||||||||||||||||||||||||||
| 324 | 4.0 | 7.0 | 3.0 | 2.1 | 0.53 | - | 2 | 391 | 12.5 | 19.6 | 7.2 | 5.1 | 1.75 | - | 2 | |||||||||||||||||||||||||||||
| 325 | 0.0 | 12.0 | 12.0 | 11.4 | 0.44 | - | 2 | 391 | 24.5 | 27.6 | 3.1 | 2.2 | 0.35 | - | 3 | |||||||||||||||||||||||||||||
| 326 | 0.0 | 13.0 | 13.0 | 12.1 | 0.70 | - | 2 | 392 | 55.5 | 62.5 | 7.0 | 1.8 | 1.14 | - | 2 | |||||||||||||||||||||||||||||
| 327 | 0.0 | 19.0 | 19.0 | 17.7 | 1.10 | - | 2 | 392 | 69.6 | 75.0 | 5.4 | 1.3 | 0.40 | - | 3 | |||||||||||||||||||||||||||||
| 328 | 0.0 | 21.0 | 21.0 | 20.0 | 0.96 | - | 5 | 392 | 81.0 | 83.0 | 2.0 | 0.5 | 0.72 | - | 3 | |||||||||||||||||||||||||||||
| 329 | 0.0 | 16.5 | 16.5 | 15.7 | 1.74 | - | 5 | 392 | 88.3 | 90.7 | 2.4 | 0.6 | 0.86 | - | 3 | |||||||||||||||||||||||||||||
| 331 | 43.4 | 56.0 | 12.6 | 12.2 | 0.64 | - | 5 | 393 | 24.5 | 36.5 | 12.0 | 5.1 | 1.15 | - | 2 | |||||||||||||||||||||||||||||
| 334 | 5.0 | 15.0 | 10.0 | 8.5 | 1.69 | - | 2 | 393 | 40.7 | 44.0 | 3.3 | 1.3 | 0.67 | - | 3 | |||||||||||||||||||||||||||||
| 336 | 0.0 | 2.0 | 2.0 | 1.8 | 1.16 | - | 5 | 394 | 0.4 | 2.2 | 1.8 | 1.8 | 0.56 | - | 2 | |||||||||||||||||||||||||||||
| 338 | 6.8 | 8.0 | 1.2 | 1.2 | 0.65 | - | 2 | 398 | 33.4 | 46.3 | 12.9 | 3.6 | 0.87 | - | 2 | |||||||||||||||||||||||||||||
| 339 | 0.0 | 4.5 | 4.5 | 4.5 | 1.08 | - | 2 | 398 | 53.6 | 55.0 | 1.4 | 0.4 | 0.40 | - | 2 | |||||||||||||||||||||||||||||
| 340 | 1.5 | 3.0 | 1.5 | 1.5 | 0.69 | - | 3 | 398 | 65.7 | 67.8 | 2.1 | 0.6 | 0.50 | - | 2 |
| Adam Wheeler | 3 |
| Appendix A – Summary of Intersections | Technical Report on the Mineral Resources of the Sulitjelma Project | |||
| February 2025 |
Intersections – Hankabakken II (2of 2)
| BHID | FROM | TO | LENGTH | TRUETHK | Cu % | Zn % | ZONE | BHID | FROM | TO | LENGTH | TRUETHK | Cu % | Zn % | ZONE | |||||||||||||||||||||||||||||
| 399 | 16.3 | 20.0 | 3.7 | 2.3 | 0.76 | - | 2 | 457 | 877.7 | 881.0 | 3.3 | 0.1 | 1.46 | 0.26 | 2 | |||||||||||||||||||||||||||||
| 400 | 0.0 | 8.4 | 8.4 | 8.3 | 0.32 | - | 2 | 458 | 443.9 | 450.4 | 6.5 | 0.1 | 0.38 | 0.36 | 2 | |||||||||||||||||||||||||||||
| 401 | 3.0 | 11.2 | 8.3 | 8.1 | 1.13 | - | 3 | 459 | 14.4 | 17.0 | 2.7 | 2.6 | 0.48 | - | 2 | |||||||||||||||||||||||||||||
| 402 | 4.0 | 8.9 | 4.9 | 4.8 | 2.12 | - | 2 | 461 | 15.1 | 21.5 | 6.4 | 6.3 | 0.41 | - | 2 | |||||||||||||||||||||||||||||
| 404 | 0.0 | 6.0 | 6.0 | 6.0 | 0.39 | - | 2 | 462 | 17.6 | 19.8 | 2.2 | 2.1 | 0.36 | - | 2 | |||||||||||||||||||||||||||||
| 405 | 0.0 | 9.3 | 9.3 | 9.3 | 1.01 | - | 3 | 465 | 26.7 | 31.6 | 4.9 | 2.2 | 0.40 | - | 2 | |||||||||||||||||||||||||||||
| 406 | 6.0 | 8.0 | 2.0 | 2.0 | 0.32 | - | 2 | 475 | 0.0 | 4.8 | 4.8 | 4.6 | 0.67 | - | 2 | |||||||||||||||||||||||||||||
| 408 | 0.0 | 3.0 | 3.0 | 2.9 | 0.55 | - | 2 | 476 | 0.0 | 2.2 | 2.2 | 2.2 | 0.92 | - | 2 | |||||||||||||||||||||||||||||
| 409 | 8.8 | 10.0 | 1.2 | 1.2 | 0.54 | - | 2 | 507 | 0.0 | 2.5 | 2.5 | 2.0 | 0.80 | - | 3 | |||||||||||||||||||||||||||||
| 410 | 5.8 | 7.8 | 2.1 | 2.0 | 0.31 | - | 3 | 509 | 0.0 | 2.8 | 2.8 | 2.3 | 0.80 | - | 3 | |||||||||||||||||||||||||||||
| 411 | 13.6 | 15.4 | 1.8 | 1.8 | 1.22 | - | 2 | 510 | 0.0 | 6.0 | 6.0 | 6.0 | 1.54 | - | 2 | |||||||||||||||||||||||||||||
| 412 | 2.7 | 4.6 | 1.9 | 1.9 | 0.82 | - | 3 | 511 | 0.0 | 2.0 | 2.0 | 1.6 | 1.30 | - | 2 | |||||||||||||||||||||||||||||
| 413 | 0.0 | 2.0 | 2.0 | 2.0 | 0.66 | - | 2 | 512 | 0.0 | 5.0 | 5.0 | 4.1 | 1.60 | - | 2 | |||||||||||||||||||||||||||||
| 416 | 5.4 | 12.4 | 7.1 | 7.0 | 0.40 | - | 2 | 513 | 0.0 | 6.5 | 6.5 | 5.3 | 2.00 | - | 2 | |||||||||||||||||||||||||||||
| 417 | 37.2 | 40.7 | 3.5 | 0.9 | 0.41 | - | 2 | 514 | 0.0 | 2.5 | 2.5 | 2.0 | 0.80 | - | 2 | |||||||||||||||||||||||||||||
| 417 | 56.9 | 58.3 | 1.4 | 0.4 | 0.39 | - | 2 | 515 | 0.0 | 1.5 | 1.5 | 1.2 | 0.90 | - | 3 | |||||||||||||||||||||||||||||
| 418 | 260.3 | 263.4 | 3.1 | 0.2 | 0.83 | - | 2 | 516 | 0.0 | 2.0 | 2.0 | 1.6 | 0.90 | - | 3 | |||||||||||||||||||||||||||||
| 420 | 0.7 | 3.2 | 2.5 | 2.4 | 0.39 | - | 2 | 517 | 0.0 | 8.0 | 8.0 | 8.0 | 1.25 | - | 2 | |||||||||||||||||||||||||||||
| 423 | 1.0 | 3.4 | 2.3 | 2.3 | 0.35 | - | 2 | 518 | 0.0 | 2.4 | 2.4 | 1.9 | 2.70 | - | 3 | |||||||||||||||||||||||||||||
| 423 | 10.9 | 12.0 | 1.0 | 1.0 | - | - | 3 | 519 | 0.0 | 8.0 | 8.0 | 8.0 | 0.64 | - | 2 | |||||||||||||||||||||||||||||
| 424 | 8.0 | 9.3 | 1.4 | 1.3 | 0.62 | - | 2 | 520 | 0.0 | 2.7 | 2.7 | 2.2 | 1.50 | - | 3 | |||||||||||||||||||||||||||||
| 425 | 0.0 | 2.4 | 2.4 | 2.4 | 1.76 | - | 2 | 521 | 0.0 | 2.9 | 2.9 | 2.3 | 1.60 | - | 3 | |||||||||||||||||||||||||||||
| 427 | 0.0 | 6.4 | 6.4 | 6.2 | 0.81 | 0.05 | 2 | 522 | 0.0 | 1.1 | 1.1 | 0.9 | 4.00 | - | 2 | |||||||||||||||||||||||||||||
| 428 | 0.0 | 6.5 | 6.5 | 6.4 | 0.51 | - | 2 | 523 | 0.0 | 1.5 | 1.5 | 1.2 | 0.80 | - | 3 | |||||||||||||||||||||||||||||
| 430 | 0.0 | 1.5 | 1.5 | 1.5 | 0.40 | - | 2 | 524 | 0.0 | 8.0 | 8.0 | 7.9 | 1.01 | - | 2 | |||||||||||||||||||||||||||||
| 432 | 0.0 | 9.9 | 9.9 | 9.3 | 0.69 | - | 2 | 526 | 0.0 | 2.8 | 2.8 | 2.3 | 2.50 | - | 3 | |||||||||||||||||||||||||||||
| 433 | 0.0 | 1.1 | 1.1 | 0.1 | 1.12 | - | 2 | 527 | 0.0 | 8.0 | 8.0 | 8.0 | 1.94 | - | 2 | |||||||||||||||||||||||||||||
| 435 | 0.0 | 6.8 | 6.8 | 6.6 | 1.05 | - | 2 | 528 | 0.0 | 2.6 | 2.6 | 2.1 | 1.40 | - | 3 | |||||||||||||||||||||||||||||
| 436 | 0.0 | 5.5 | 5.5 | 5.5 | 0.77 | - | 2 | 529 | 0.0 | 1.9 | 1.9 | 1.5 | 0.60 | - | 3 | |||||||||||||||||||||||||||||
| 437 | 3.1 | 4.8 | 1.7 | 1.7 | 0.57 | - | 3 | 530 | 0.0 | 7.5 | 7.5 | 7.5 | 1.99 | - | 2 | |||||||||||||||||||||||||||||
| 438 | 0.0 | 5.0 | 5.0 | 4.9 | 0.58 | 0.11 | 2 | 531 | 1.5 | 6.0 | 4.5 | 4.5 | 0.88 | - | 2 | |||||||||||||||||||||||||||||
| 440 | 1.0 | 3.3 | 2.3 | 2.1 | 0.74 | 0.06 | 2 | 532 | 0.0 | 8.0 | 8.0 | 8.0 | 1.11 | - | 2 | |||||||||||||||||||||||||||||
| 440 | 11.0 | 12.2 | 1.2 | 1.1 | 0.90 | 0.38 | 3 | 533 | 0.0 | 6.5 | 6.5 | 6.4 | 1.17 | - | 2 | |||||||||||||||||||||||||||||
| 441 | 0.0 | 1.6 | 1.6 | 1.6 | 0.42 | - | 2 | 534 | 0.0 | 1.9 | 1.9 | 1.5 | 1.60 | - | 3 | |||||||||||||||||||||||||||||
| 442 | 1.0 | 12.3 | 11.3 | 10.9 | 1.02 | 0.11 | 3 | 535 | 0.0 | 6.0 | 6.0 | 5.9 | 0.97 | - | 2 | |||||||||||||||||||||||||||||
| 444 | 0.0 | 5.5 | 5.5 | 5.5 | 0.48 | 0.08 | 2 | 537 | 0.0 | 1.7 | 1.7 | 1.4 | 2.50 | - | 3 | |||||||||||||||||||||||||||||
| 445 | 0.0 | 1.0 | 1.0 | 1.0 | 0.48 | 0.06 | 2 | 538 | 0.0 | 5.5 | 5.5 | 5.4 | 0.64 | - | 2 | |||||||||||||||||||||||||||||
| 446 | 0.0 | 1.0 | 1.0 | 1.0 | 0.50 | 0.06 | 2 | 539 | 0.0 | 3.5 | 3.5 | 3.5 | 1.70 | - | 2 | |||||||||||||||||||||||||||||
| 446 | 11.0 | 13.2 | 2.2 | 2.2 | 0.36 | 0.13 | 3 | 540 | 0.0 | 2.0 | 2.0 | 1.6 | 1.50 | - | 3 | |||||||||||||||||||||||||||||
| 447 | 819.6 | 822.1 | 2.5 | 0.1 | 0.36 | 0.11 | 2 | 541 | 0.0 | 7.5 | 7.5 | 7.5 | 1.23 | - | 2 | |||||||||||||||||||||||||||||
| 447 | 836.7 | 844.7 | 8.0 | 0.2 | 0.49 | 0.15 | 2 | 543 | 2.0 | 3.0 | 1.0 | 1.0 | 1.40 | - | 2 | |||||||||||||||||||||||||||||
| 448 | 74.8 | 93.0 | 18.2 | 0.1 | 0.39 | 0.01 | 2 | 544 | 0.0 | 2.0 | 2.0 | 1.6 | 1.80 | - | 3 | |||||||||||||||||||||||||||||
| 448 | 115.0 | 119.0 | 4.0 | 0.0 | 0.53 | 0.01 | 2 | 545 | 1.0 | 3.0 | 2.0 | 2.0 | 0.50 | - | 3 | |||||||||||||||||||||||||||||
| 448 | 364.2 | 366.3 | 2.1 | 0.0 | 0.36 | 0.01 | 2 | 546 | 0.0 | 1.5 | 1.5 | 1.5 | 1.00 | - | 3 | |||||||||||||||||||||||||||||
| 450 | 0.0 | 1.3 | 1.3 | 1.3 | 0.84 | 0.12 | 2 | 550 | 0.0 | 1.5 | 1.5 | 1.5 | 1.10 | - | 3 | |||||||||||||||||||||||||||||
| 454 | 0.0 | 1.5 | 1.5 | 1.5 | 0.38 | 0.04 | 2 | |||||||||||||||||||||||||||||||||||||
| 454 | 6.2 | 10.2 | 4.0 | 3.9 | 0.36 | 0.23 | 3 |
| Adam Wheeler | 4 |
| Appendix A – Summary of Intersections | Technical Report on the Mineral Resources of the Sulitjelma Project | |||
| February 2025 |
Intersections – Sagmo
| BHID | FROM | TO | LENGTH | TRUETHK | Cu % | Zn % | ZONE | BHID | FROM | TO | LENGTH | TRUETHK | Cu % | Zn % | ZONE | |||||||||||||||||||||||||||||
| 1 | 23.6 | 27.5 | 3.9 | 3.0 | 0.54 | 0.07 | 2 | 43 | 81.2 | 86.2 | 5.0 | 1.7 | 1.19 | 0.24 | 5 | |||||||||||||||||||||||||||||
| 3 | 159.3 | 164.3 | 5.0 | 0.8 | 0.48 | 0.02 | 2 | 44 | 132.4 | 158.8 | 26.4 | 5.2 | 1.01 | 0.28 | 5 | |||||||||||||||||||||||||||||
| 5 | 116.3 | 117.8 | 1.5 | 0.3 | 0.53 | 0.01 | 2 | 45 | 184.7 | 195.1 | 10.4 | 0.9 | 1.08 | 0.26 | 2 | |||||||||||||||||||||||||||||
| 6 | 18.3 | 38.0 | 19.7 | 4.4 | 0.41 | 0.03 | 2 | 45 | 204.7 | 211.0 | 6.3 | 0.6 | 1.04 | 0.39 | 2 | |||||||||||||||||||||||||||||
| 7 | 65.5 | 72.0 | 6.5 | 0.7 | 0.42 | 0.03 | 2 | 46 | 49.5 | 78.0 | 28.5 | 9.0 | 1.33 | 0.15 | 5 | |||||||||||||||||||||||||||||
| 7 | 150.0 | 152.0 | 2.0 | 0.2 | 0.51 | 0.05 | 2 | 47 | 52.7 | 55.0 | 2.3 | 1.8 | 1.49 | 0.20 | 5 | |||||||||||||||||||||||||||||
| 7 | 157.0 | 164.8 | 7.8 | 0.8 | 0.32 | 0.03 | 2 | 48 | 140.5 | 145.0 | 4.5 | 1.3 | 0.70 | 0.20 | 5 | |||||||||||||||||||||||||||||
| 8 | 6.0 | 8.5 | 2.5 | 0.4 | 0.48 | 0.03 | 2 | 49 | 75.4 | 86.5 | 11.1 | 5.0 | 0.96 | 0.23 | 5 | |||||||||||||||||||||||||||||
| 9 | 24.8 | 43.0 | 18.2 | 2.6 | 0.59 | 0.04 | 2 | 51 | 128.2 | 131.4 | 3.2 | 0.9 | 0.77 | 0.19 | 5 | |||||||||||||||||||||||||||||
| 10 | 62.2 | 80.0 | 17.8 | 6.8 | 0.66 | 0.11 | 5 | 52 | 88.8 | 94.1 | 5.3 | 1.7 | 1.72 | 0.23 | 3 | |||||||||||||||||||||||||||||
| 11 | 63.2 | 66.0 | 2.8 | 1.2 | 0.66 | 0.15 | 5 | 53 | 90.1 | 92.6 | 2.5 | 0.2 | 0.87 | 0.20 | 2 | |||||||||||||||||||||||||||||
| 12 | 81.0 | 84.0 | 3.0 | 1.1 | 0.34 | 0.03 | 5 | 54 | 0.0 | 2.8 | 2.8 | 2.8 | 0.85 | 0.25 | 2 | |||||||||||||||||||||||||||||
| 12 | 99.0 | 102.0 | 3.0 | 1.1 | 0.47 | 0.16 | 5 | 56 | 1.0 | 5.3 | 4.3 | 3.2 | 0.95 | 0.29 | 2 | |||||||||||||||||||||||||||||
| 13 | 136.8 | 143.0 | 6.2 | 1.8 | 0.77 | 0.15 | 5 | 57 | 0.0 | 2.0 | 2.0 | 0.3 | 0.48 | 0.21 | 2 | |||||||||||||||||||||||||||||
| 17 | 391.0 | 403.7 | 12.7 | 12.4 | 0.99 | 0.22 | 5 | 58 | 0.0 | 7.8 | 7.8 | 3.5 | 0.53 | 0.23 | 2 | |||||||||||||||||||||||||||||
| 18 | 390.0 | 391.2 | 1.2 | 1.1 | 0.53 | 0.17 | 5 | 59 | 0.0 | 1.6 | 1.6 | 1.6 | 0.94 | 0.23 | 2 | |||||||||||||||||||||||||||||
| 19 | 32.2 | 38.6 | 6.4 | 5.0 | 0.47 | 0.09 | 5 | 60 | 4.0 | 5.5 | 1.5 | 0.0 | 0.31 | 0.18 | 2 | |||||||||||||||||||||||||||||
| 20 | 70.0 | 74.9 | 4.9 | 1.8 | 0.95 | 0.12 | 2 | 61 | 0.0 | 8.7 | 8.7 | 4.6 | 0.67 | 0.20 | 2 | |||||||||||||||||||||||||||||
| 21 | 137.4 | 149.0 | 11.7 | 1.9 | 0.72 | 0.12 | 5 | 62 | 0.0 | 1.9 | 1.9 | 1.8 | 1.56 | 0.30 | 2 | |||||||||||||||||||||||||||||
| 22 | 42.1 | 71.8 | 29.8 | 13.6 | 0.83 | 0.12 | 5 | 63 | 1.0 | 3.0 | 2.0 | 0.0 | 0.70 | 0.12 | 2 | |||||||||||||||||||||||||||||
| 23 | 55.3 | 57.9 | 2.6 | 0.9 | 0.90 | 0.12 | 2 | 64 | 0.0 | 4.3 | 4.3 | 2.4 | 0.99 | 0.23 | 2 | |||||||||||||||||||||||||||||
| 24 | 100.8 | 103.6 | 2.9 | 0.7 | 1.21 | 0.12 | 5 | 65 | 0.0 | 18.0 | 18.0 | 6.5 | 1.30 | 0.20 | 2 | |||||||||||||||||||||||||||||
| 25 | 126.3 | 135.1 | 8.9 | 1.6 | 0.89 | 0.09 | 5 | 66 | 0.0 | 5.6 | 5.6 | 5.5 | 0.90 | 0.10 | 2 | |||||||||||||||||||||||||||||
| 26 | 42.6 | 57.6 | 15.0 | 8.6 | 0.88 | 0.10 | 5 | 67 | 0.0 | 10.0 | 10.0 | 1.6 | 1.11 | 0.12 | 2 | |||||||||||||||||||||||||||||
| 27 | 46.2 | 66.9 | 20.7 | 7.8 | 1.08 | 0.17 | 5 | 68 | 0.0 | 10.0 | 10.0 | 6.3 | 1.15 | 0.13 | 2 | |||||||||||||||||||||||||||||
| 28 | 80.0 | 104.0 | 24.0 | 6.6 | 1.09 | 0.12 | 5 | 70 | 0.0 | 8.4 | 8.4 | 8.3 | 0.59 | 0.06 | 2 | |||||||||||||||||||||||||||||
| 29 | 41.2 | 63.5 | 22.3 | 6.7 | 1.00 | 0.16 | 5 | 71 | 2.0 | 4.0 | 2.0 | 0.0 | 0.43 | 0.06 | 2 | |||||||||||||||||||||||||||||
| 29 | 91.6 | 92.6 | 1.0 | 0.3 | 1.23 | 0.09 | 5 | 72 | 0.0 | 6.0 | 6.0 | 3.5 | 0.36 | 0.07 | 2 | |||||||||||||||||||||||||||||
| 30 | 59.3 | 80.0 | 20.7 | 6.2 | 1.42 | 0.11 | 5 | 74 | 0.0 | 7.0 | 7.0 | 6.9 | 0.67 | 0.08 | 2 | |||||||||||||||||||||||||||||
| 32 | 35.0 | 39.1 | 4.1 | 3.9 | 1.81 | 0.15 | 5 | 75 | 4.0 | 16.0 | 12.0 | 9.3 | 0.47 | 0.08 | 2 | |||||||||||||||||||||||||||||
| 34 | 0.0 | 10.4 | 10.4 | 9.4 | 1.69 | - | 3 | 76 | 7.5 | 17.2 | 9.7 | 0.8 | 0.73 | 0.15 | 2 | |||||||||||||||||||||||||||||
| 36 | 47.3 | 70.0 | 22.7 | 15.8 | 1.60 | 0.24 | 2 | 77 | 10.7 | 12.3 | 1.6 | 0.9 | 1.33 | 0.24 | 2 | |||||||||||||||||||||||||||||
| 37 | 39.0 | 51.1 | 12.1 | 6.0 | 1.60 | 0.22 | 3 | 78 | 93.5 | 96.1 | 2.6 | 0.1 | 1.62 | 0.09 | 2 | |||||||||||||||||||||||||||||
| 38 | 126.9 | 146.7 | 19.8 | 5.1 | 1.34 | 0.24 | 2 | 79 | 203.1 | 211.3 | 8.2 | 0.6 | 1.02 | 0.15 | 2 | |||||||||||||||||||||||||||||
| 39 | 79.7 | 83.3 | 3.6 | 1.6 | 1.07 | 0.23 | 5 | 80 | 57.3 | 63.9 | 6.6 | 1.0 | 0.50 | 0.06 | 2 | |||||||||||||||||||||||||||||
| 40 | 111.0 | 115.1 | 4.1 | 1.1 | 0.96 | 0.23 | 5 | 83 | 22.7 | 38.4 | 15.7 | 0.5 | 1.22 | 0.19 | 2 | |||||||||||||||||||||||||||||
| 41 | 138.9 | 165.7 | 26.8 | 5.2 | 1.25 | 0.14 | 5 | 84 | 63.7 | 66.1 | 2.4 | 0.4 | 0.96 | 0.12 | 2 | |||||||||||||||||||||||||||||
| 42 | 162.4 | 174.4 | 12.0 | 1.9 | 0.90 | 0.26 | 5 | 91 | 397.0 | 399.8 | 2.8 | 2.7 | 0.56 | 0.11 | 5 | |||||||||||||||||||||||||||||
| 92 | 386.0 | 388.8 | 2.8 | 2.8 | 0.74 | 0.14 | 5 |
| Adam Wheeler | 5 |
| Technical Report on the Mineral Resources of the Sulitjelma Project | ||
| February 2025 |
Appendix B
Resource Cross-Sections –
Rupsi/Dypet
February 2025
| Appendix B – Resource Cross-Sections – Rupsi/Dypet | Technical Report on the Mineral Resources of the Sulitjelma Project | |||
| February 2025 |
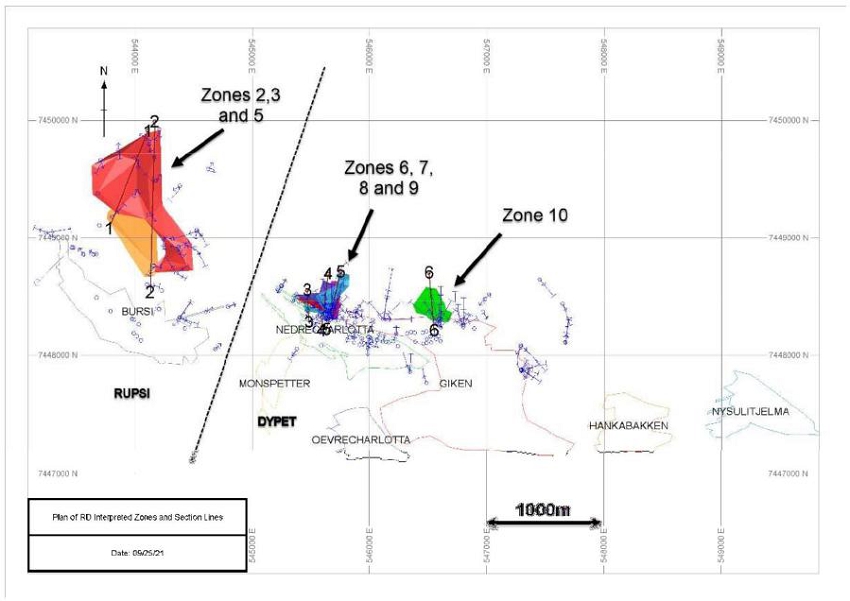
| Adam Wheeler | 2 |
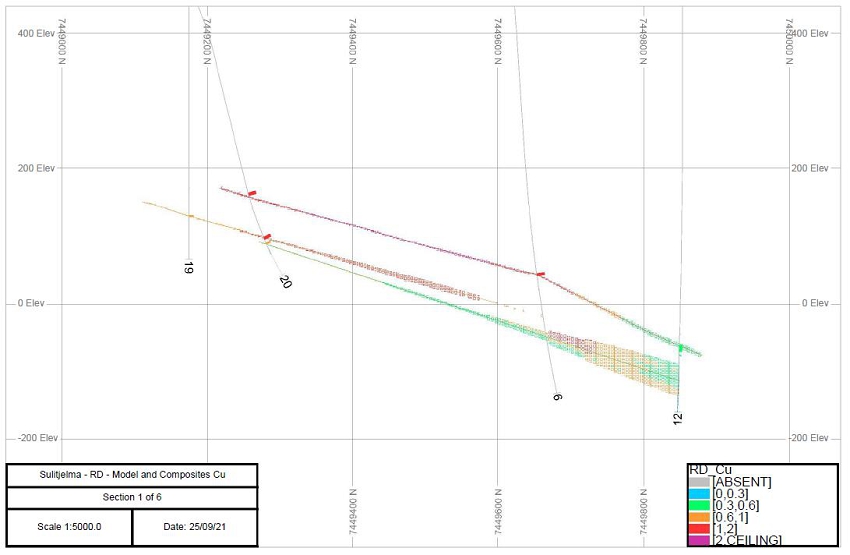
| Adam Wheeler | 3 |
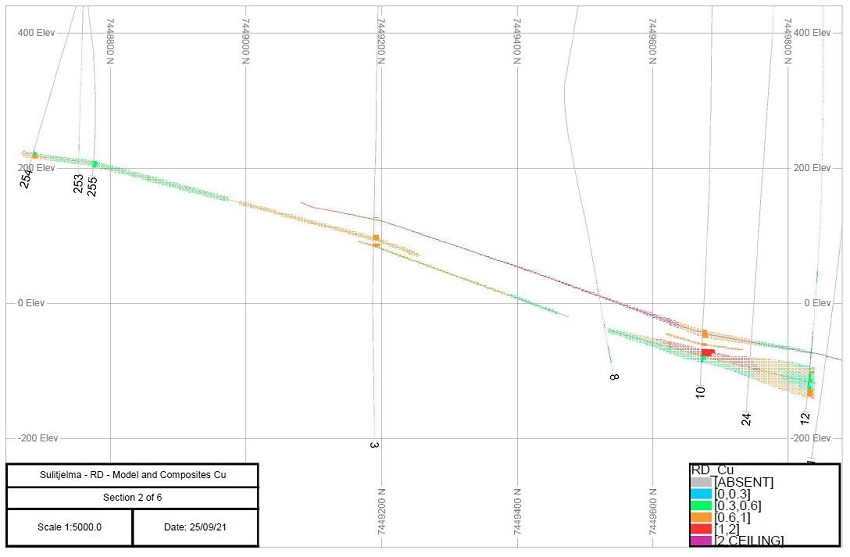
| Adam Wheeler | 4 |
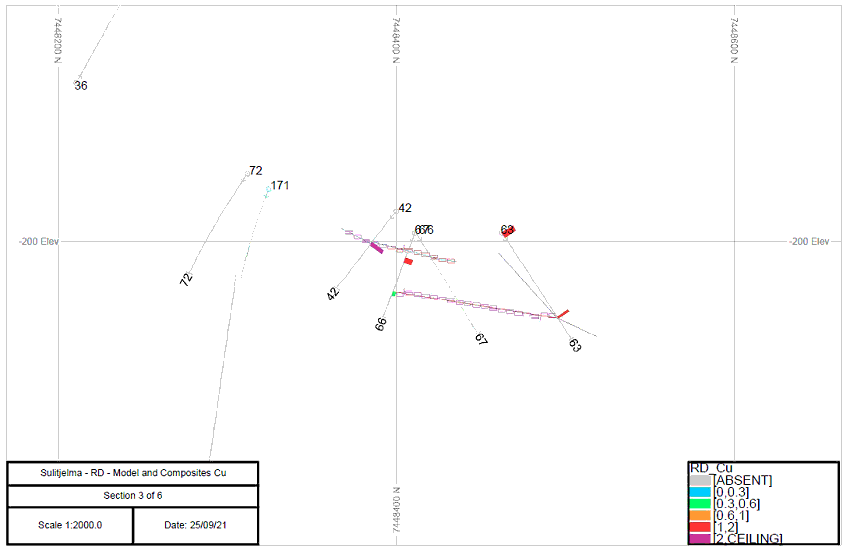
| Adam Wheeler | 5 |
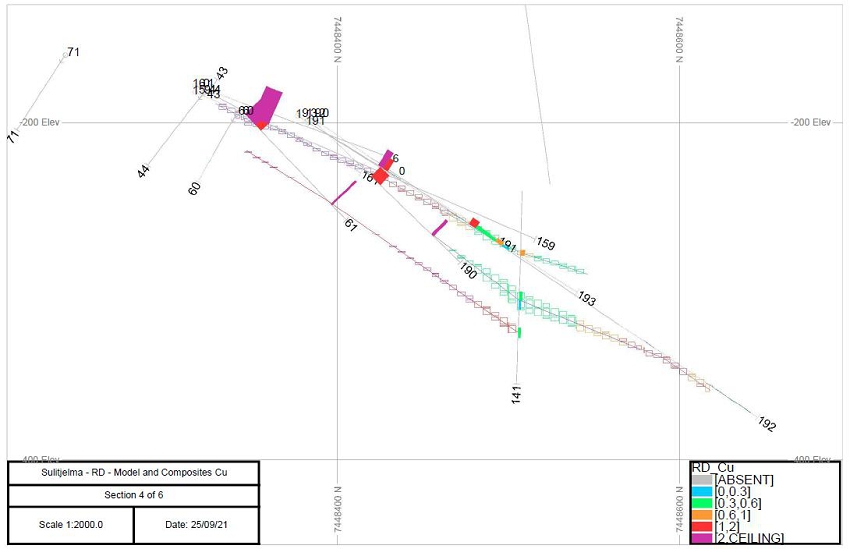
| Adam Wheeler | 6 |
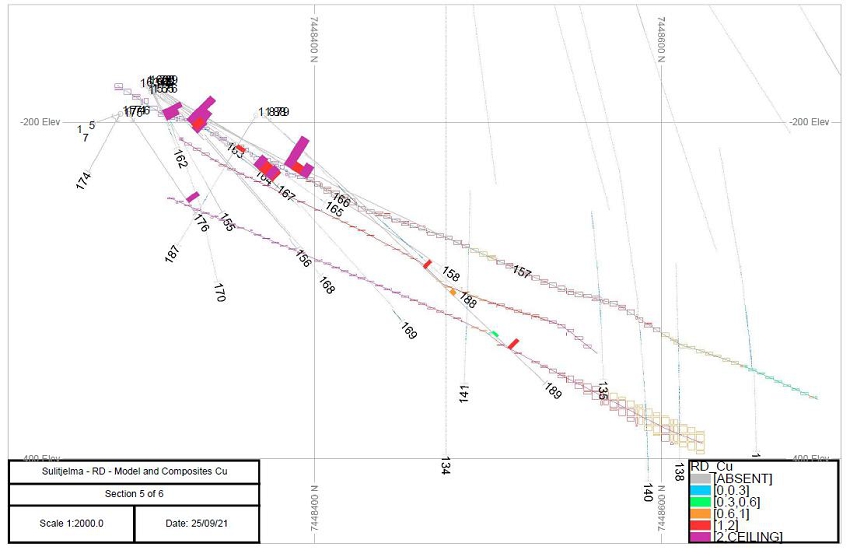
| Adam Wheeler | 7 |
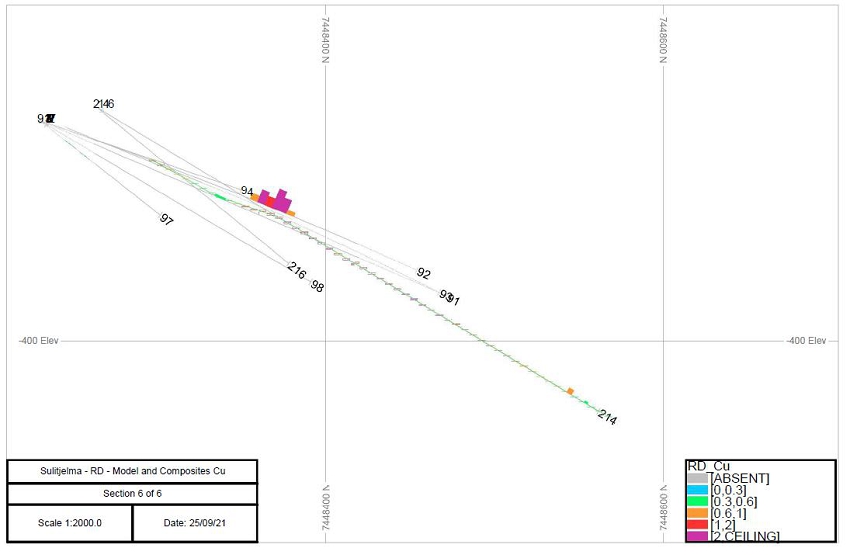
| Adam Wheeler | 8 |
Technical Report on the Mineral Resources of the Sulitjelma Project
February 2025
Appendix C
Resource Cross-Sections – Hankabakken II
February 2025
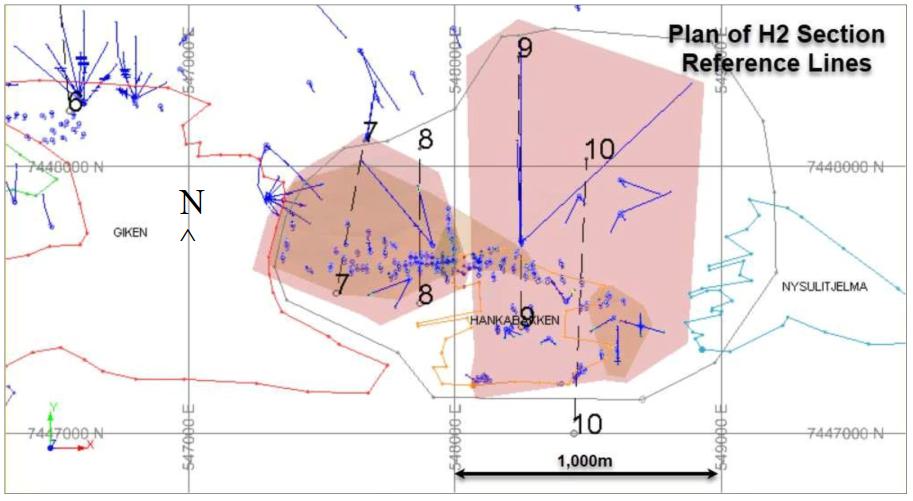
| Sulitjelma - Resources Estimation |
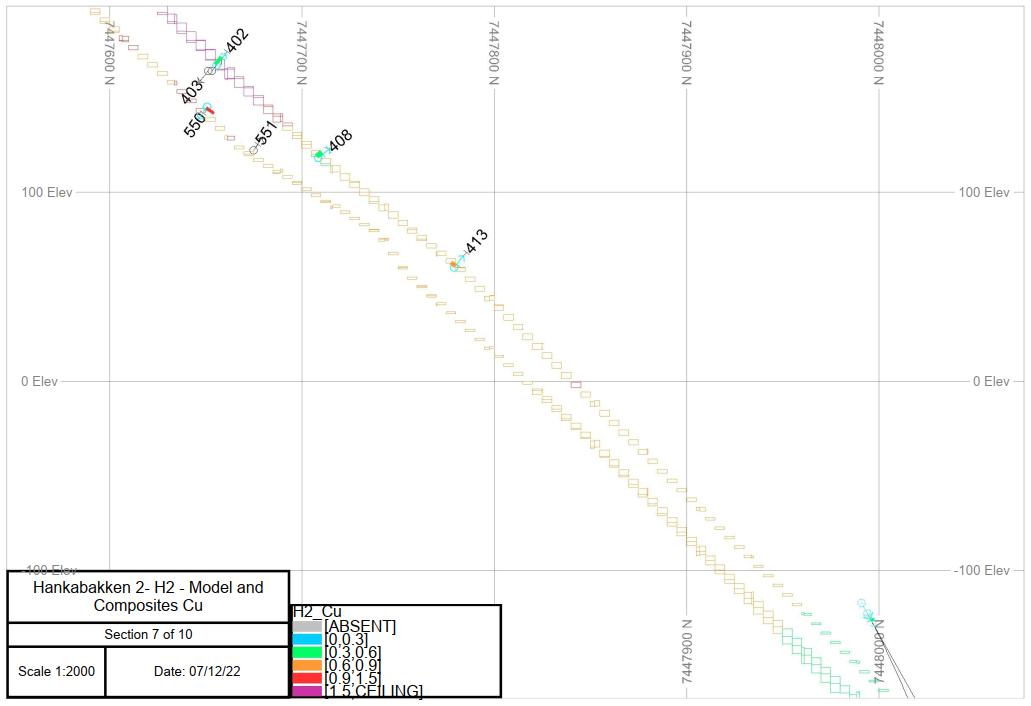
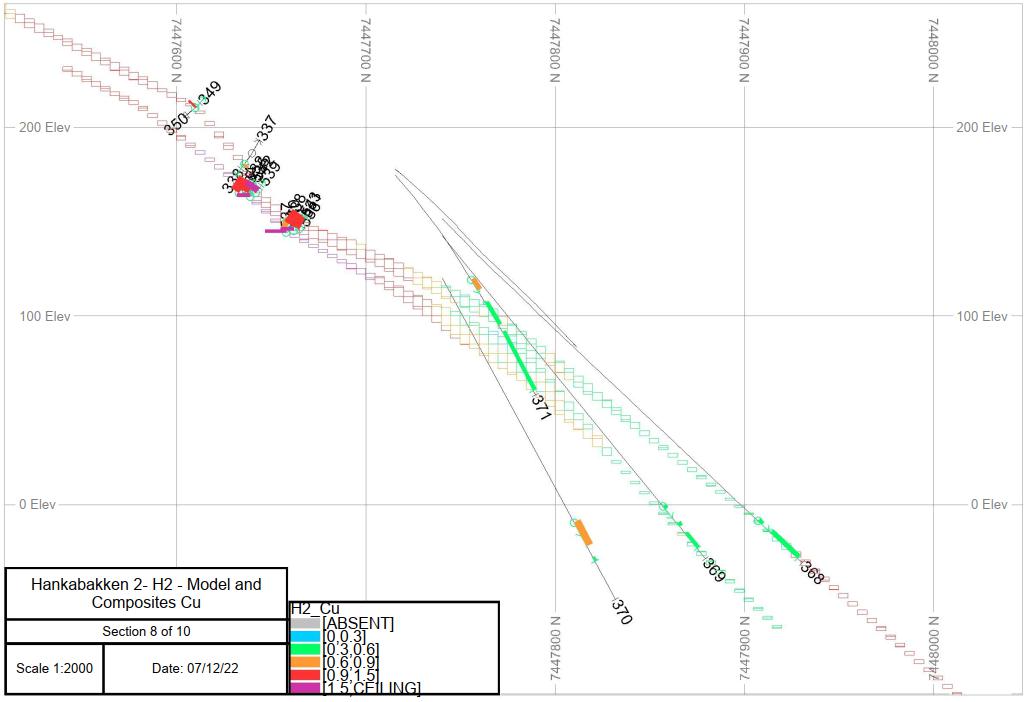
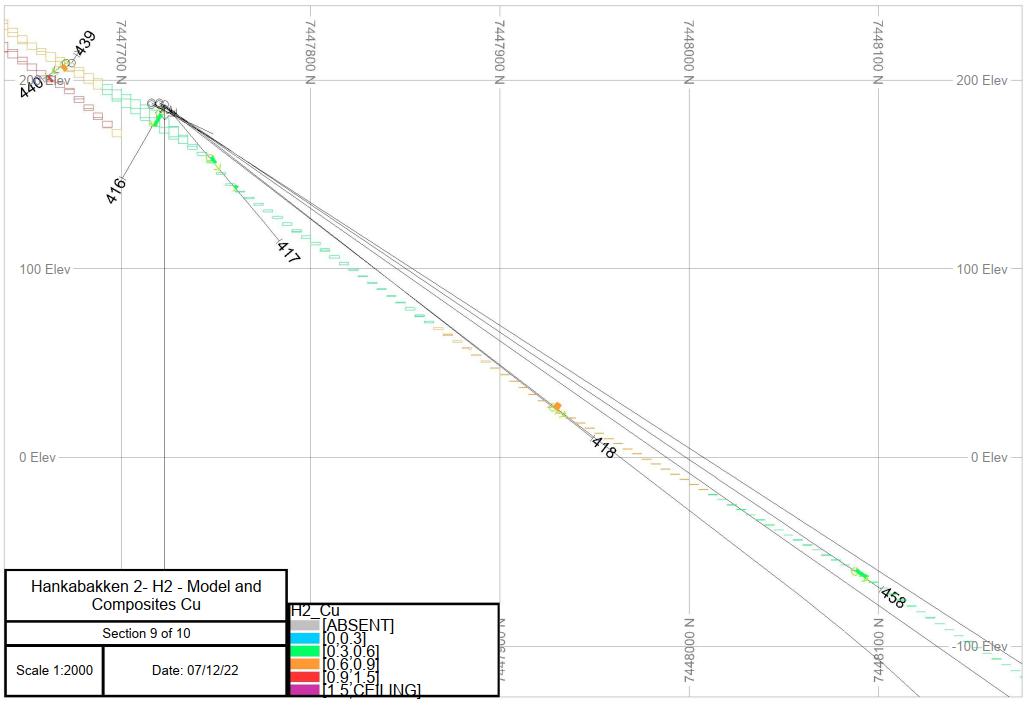
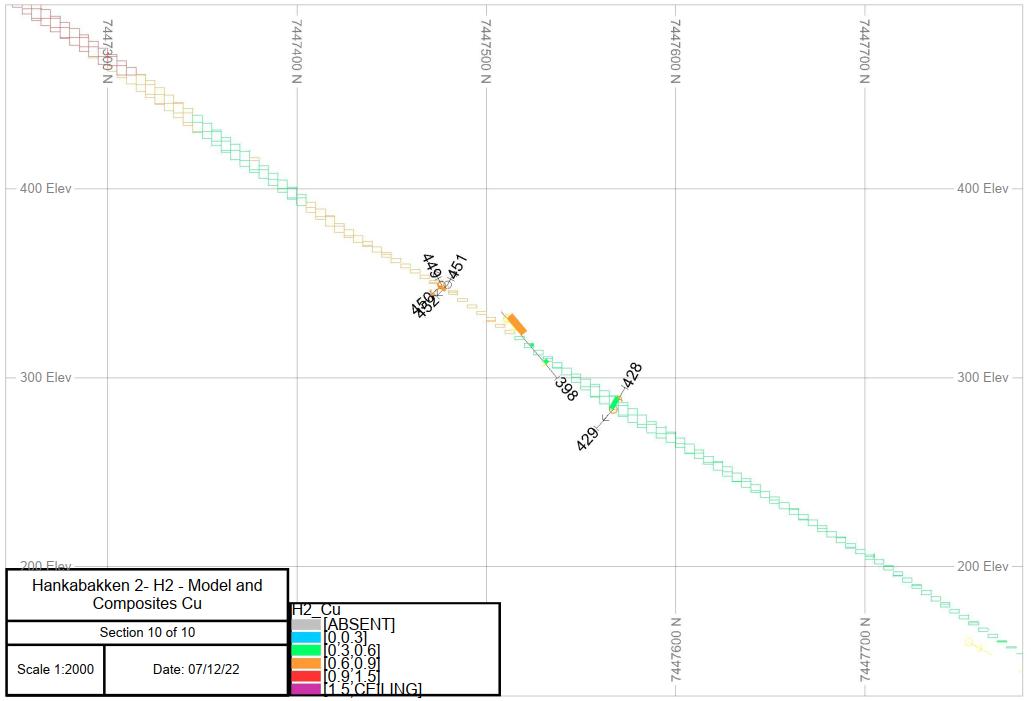
Technical Report on the Mineral Resources of the Sulitjelma Project
February 2025
Appendix D
Resource Cross-Sections – Sagmo
February 2025
Appendix D – Resource Cross-Sections – Sagmo Technical Report on the Mineral Resources of the Sulitjelma Project
February 2025
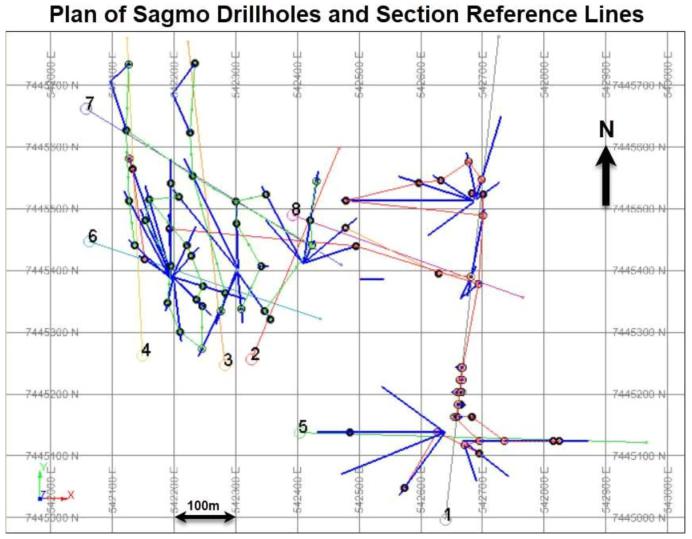
| Adam Wheeler | 2 |
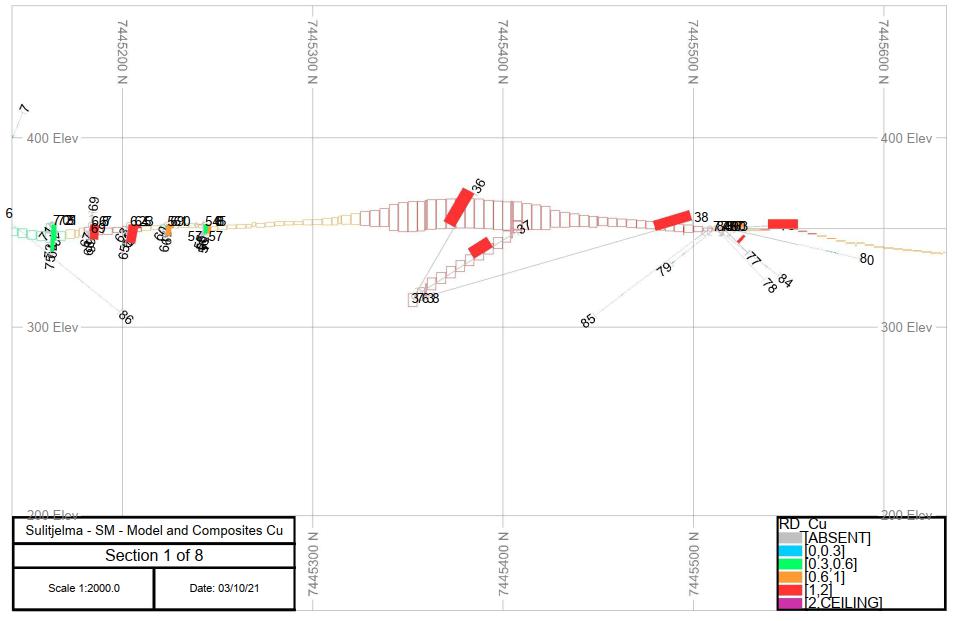
| Adam Wheeler | 3 |
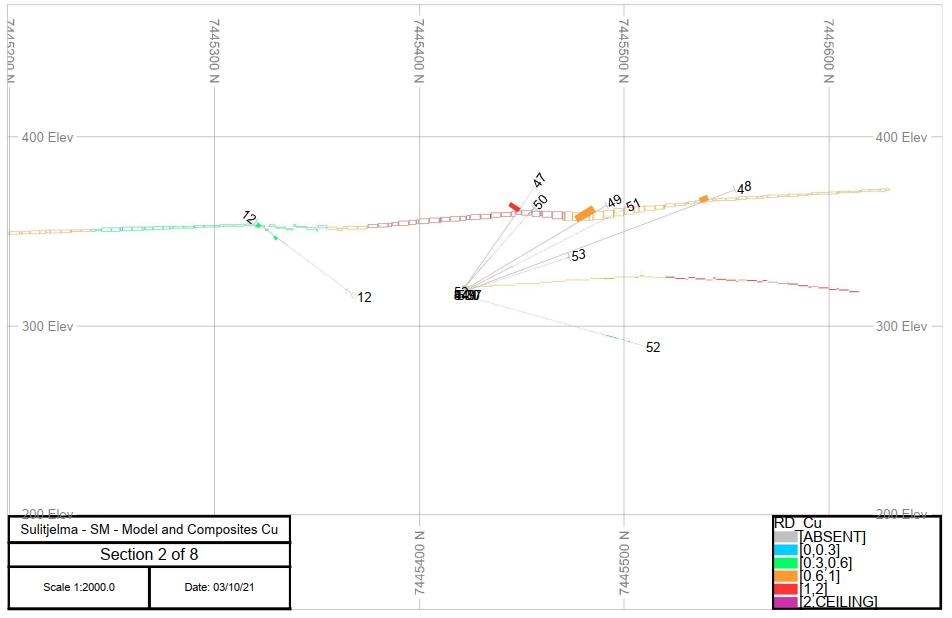
| Adam Wheeler | 4 |
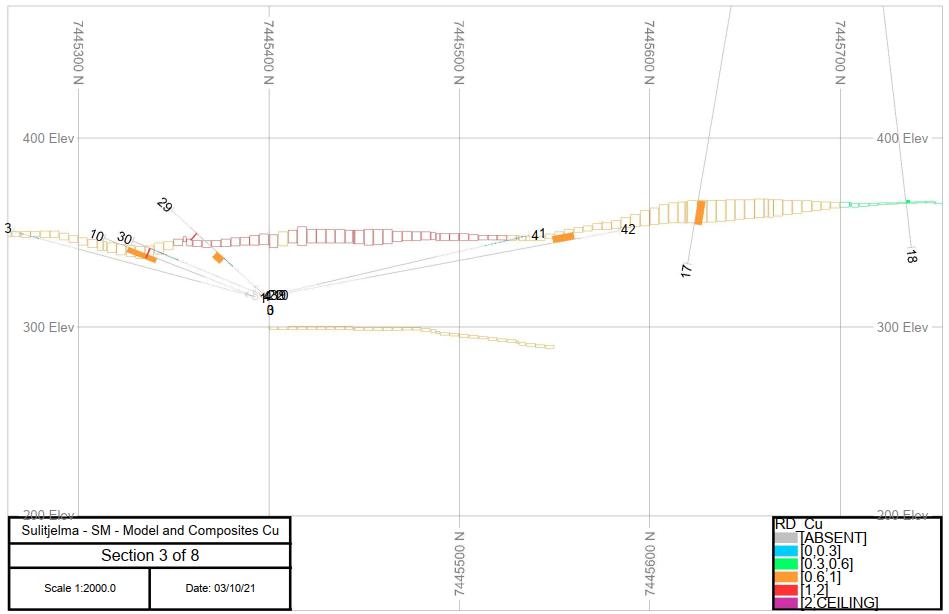
| Adam Wheeler | 5 |
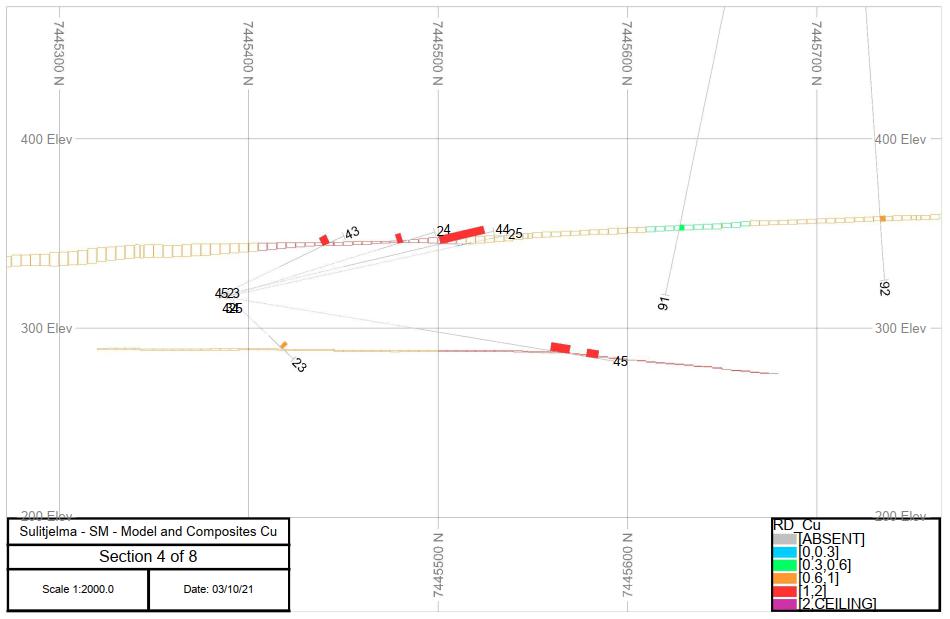
| Adam Wheeler | 6 |
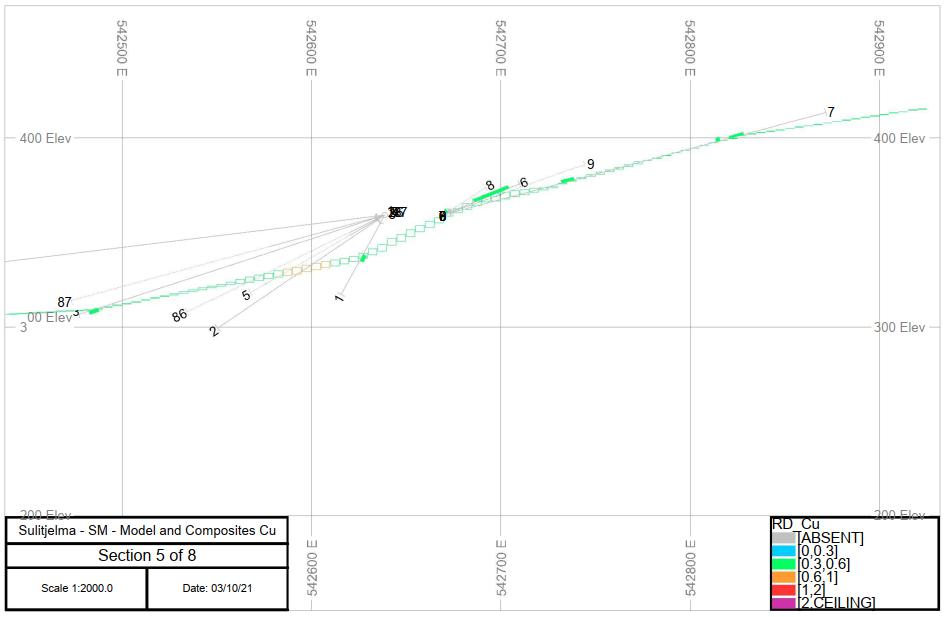
| Adam Wheeler | 7 |
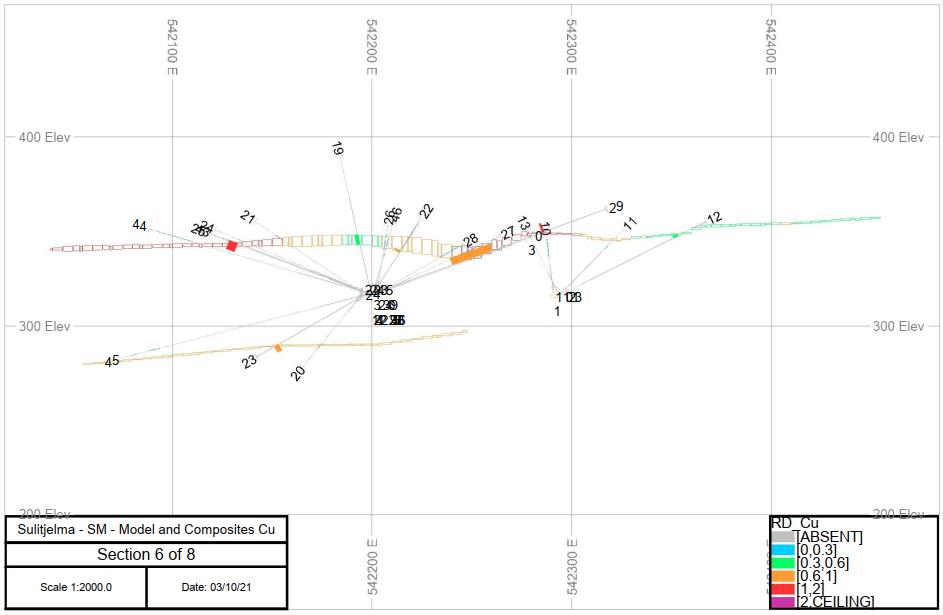
| Adam Wheeler | 8 |
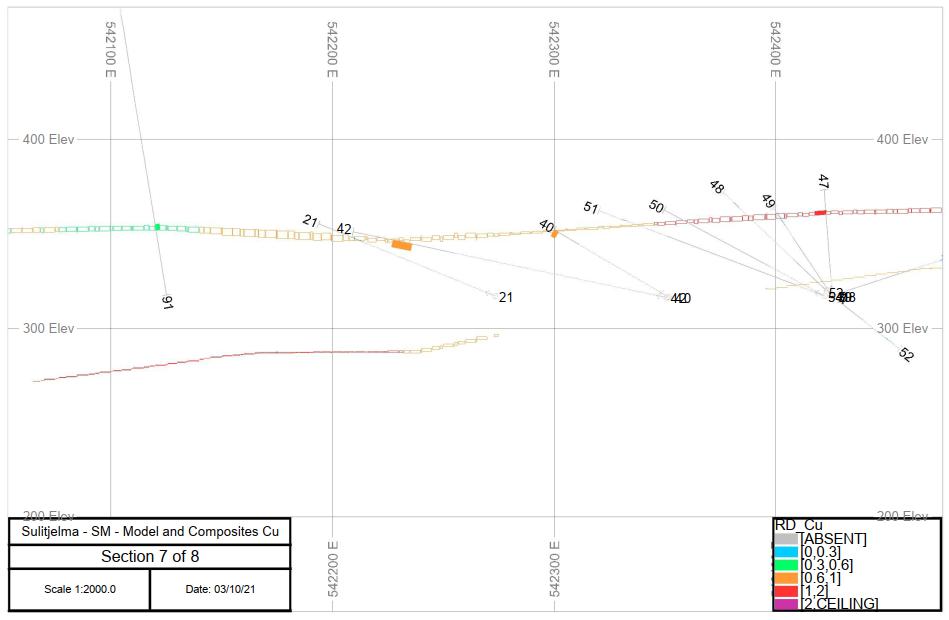
| Adam Wheeler | 9 |
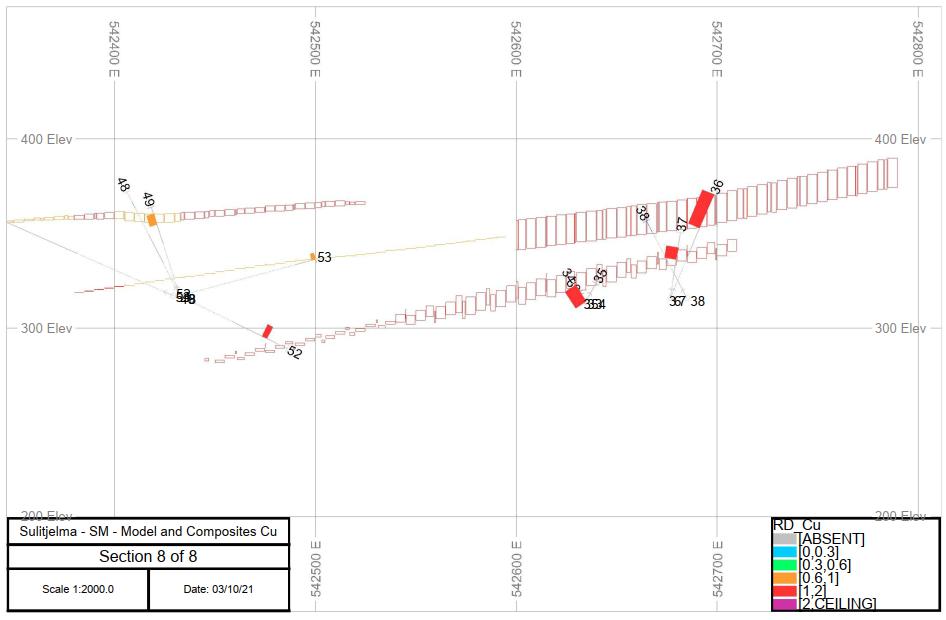
| Adam Wheeler | 10 |