Exhibit 99.87
| Effective Date of Mineral Resource Estimate: | December 24, 2024 | |
| Effective Date of Preliminary Economic Assessment: | March 03, 2025 | |
| Report Date: | April 14, 2025 | |
Prepared by: Scott Wilson, C.P.G. SME-RM Peter Szkilnyk, P.Eng. Alan J. San Martin, P.Eng. Richard Gowans, P.Eng. Abel Obeso, P.Eng. Christopher Jacobs, C.Eng., MIMMM
Prepared for: Blue Moon Metals Inc. 550 – 220 Bay Street, Toronto ON, M5J 2W4 Canada |
 |
601
– 90 Eglinton Ave East, Toronto, Ontario, Canada M4P 2Y3
+1 416 362 5135 | www.micon-international.com
Table of Contents
| 1.0 | SUMMARY | 1 | |||
| 1.1 | INTRODUCTION | 1 | |||
| 1.2 | PROPERTY DESCRIPTION | 1 | |||
| 1.3 | HISTORY | 2 | |||
| 1.4 | GEOLOGY | 3 | |||
| 1.5 | EXPLORATION AND DRILLING | 3 | |||
| 1.6 | METALLURGY | 5 | |||
| 1.7 | MINERAL RESOURCE ESTIMATE | 6 | |||
| 1.8 | MINERAL RESERVE ESTIMATE | 7 | |||
| 1.9 | MINING | 7 | |||
| 1.10 | PROCESSING | 9 | |||
| 1.11 | INFRASTRUCTURE | 10 | |||
| 1.12 | ENVIRONMENTAL STUDIES, PERMITTING AND SOCIAL OR COMMUNITY IMPACT | 12 | |||
| 1.13 | PROJECT ECONOMICS | 13 | |||
| 1.14 | INTERPRETATIONS AND CONCLUSIONS | 16 | |||
| 1.14.1 | Geological Setting, Exploration, and Resources | 16 | |||
| 1.14.2 | Mining Methods and Infrastructure | 16 | |||
| 1.14.3 | Metallurgy and Processing | 17 | |||
| 1.14.4 | Environmental, Permitting, and Social Impact | 17 | |||
| 1.14.5 | Capital and Operating Costs | 17 | |||
| 1.14.6 | Economic Analysis | 17 | |||
| 1.15 | RECOMMENDATIONS | 17 | |||
| 1.15.1 | Phase 1: Planning, Hiring and Permitting | 18 | |||
| 1.15.2 | Phase 2: Exploration Decline Development and Further Studies | 18 | |||
| 1.15.3 | Work Program | 20 | |||
| 2.0 | INTRODUCTION | 21 | |||
| 2.1 | UNITS OF MEASUREMENT AND ABBREVIATIONS | 22 | |||
| 3.0 | RELIANCE ON OTHER EXPERTS | 24 | |||
| 4.0 | PROPERTY DESCRIPTION AND LOCATION | 25 | |||
| 4.1 | GENERAL DESCRIPTION AND LOCATION | 25 | |||
| 4.2 | MINERAL TENURE | 26 | |||
| 5.0 | ACCESSIBILITY, CLIMATE, LOCAL RESOURCES, INFRASTRUCTURE AND PHYSIOGRAPHY | 31 | |||
| 5.1 | ACCESS | 31 | |||
| 5.2 | TOPOGRAPHY, ELEVATION AND VEGETATION | 31 | |||
| 5.3 | CLIMATE | 32 | |||
| 5.4 | INFRASTRUCTURE | 32 | |||
| 6.0 | HISTORY | 34 | |||
| 6.1 | BACKGROUND | 34 | |||
| 6.2 | BLUE MOON PROPERTY | 34 | |||
| 6.2.1 | 1890-1945 | 34 | |||
| Blue Moon Mine | i | March 2025 |
| 6.2.2 | 1945 1975 | 35 | |||
| 6.2.3 | 1976 - 1990 | 35 | |||
| 6.2.4 | 1991 - 2001 | 36 | |||
| 6.2.5 | 2002 - Present | 36 | |||
| 7.0 | GEOLOGICAL SETTING AND MINERALIZATION | 39 | |||
| 7.1 | REGIONAL GEOLOGY | 39 | |||
| 7.2 | LOCAL GEOLOGY | 41 | |||
| 7.3 | PROPERTY GEOLOGY | 42 | |||
| 7.4 | MINERALIZATION | 44 | |||
| 8.0 | DEPOSIT TYPES | 46 | |||
| 9.0 | EXPLORATION | 47 | |||
| 9.1 | GEOLOGICAL MAPPING | 47 | |||
| 9.2 | GEOCHEMICAL SURVEYS | 47 | |||
| 9.3 | GEOPHYSICS | 48 | |||
| 9.3.1 | EM Studies by Walker (2021) | 48 | |||
| 9.3.2 | Gravity (2023) | 48 | |||
| 10.0 | DRILLING | 51 | |||
| 11.0 | SAMPLE PREPARATION, ANALYSES AND SECURITY | 56 | |||
| 12.0 | DATA VERIFICATION | 58 | |||
| 13.0 | MINERAL PROCESSING AND METALLURGICAL TESTING | 60 | |||
| 13.1 | INTRODUCTION | 60 | |||
| 13.2 | METALLURGICAL TESTWORK | 60 | |||
| 13.2.1 | Metallurgical Samples | 60 | |||
| 13.2.3 | Flotation Testwork | 63 | |||
| 13.2.4 | Gravity Separation Tests | 65 | |||
| 13.3 | CONCLUSIONS AND RECOMMENDATIONS | 65 | |||
| 14.0 | MINERAL RESOURCE ESTIMATES | 67 | |||
| 14.1 | SUMMARY | 67 | |||
| 14.2 | DATABASE | 72 | |||
| 14.2.1 | Capping | 73 | |||
| 14.3 | COMPOSITING | 77 | |||
| 14.4 | DENSITY | 77 | |||
| 14.5 | BLOCK MODEL | 78 | |||
| 14.6 | GRADE ESTIMATION | 78 | |||
| 14.6.1 | Grade Estimation Verification | 82 | |||
| 14.7 | RESOURCE CLASSIFICATION | 84 | |||
| 14.8 | MINERAL RESOURCE ESTIMATE | 88 | |||
| 14.9 | CUTOFF GRADE SENSITIVITY ANALYSIS | 88 | |||
| 15.0 | MINERAL RESERVE ESTIMATES | 92 | |||
| Blue Moon Mine | ii | March 2025 |
| 16.0 | MINING METHODS | 93 | |||
| 16.1 | INTRODUCTION | 93 | |||
| 16.2 | DEPOSIT GEOMETRY AND GEOTECHNICAL CONSIDERATIONS | 93 | |||
| 16.3 | MSO AND MINING METHOD ANALYSIS | 93 | |||
| 16.4 | MINE ACCESS | 96 | |||
| 16.5 | VENTILATION | 98 | |||
| 16.6 | PRODUCTION SCHEDULE | 99 | |||
| 16.7 | EQUIPMENT FLEET | 102 | |||
| 16.8 | MINE PERSONNEL | 102 | |||
| 16.9 | MINE SERVICES | 104 | |||
| 16.9.1 | Dewatering System | 104 | |||
| 16.9.2 | Electrical Distribution | 104 | |||
| 16.9.3 | Mine Communications and Safety | 105 | |||
| 16.9.4 | Refuge Chambers | 105 | |||
| 16.9.5 | Compressed Air System | 105 | |||
| 17.0 | RECOVERY METHODS | 106 | |||
| 17.1 | PROCESS DESIGN CRITERIA | 110 | |||
| 17.1.1 | Design Basis | 110 | |||
| 17.1.2 | Process Design Criteria | 111 | |||
| 17.2 | PROCESS DESCRIPTION | 114 | |||
| 17.2.1 | Crushing Plant | 114 | |||
| 17.2.2 | Crushed Ore Handling | 114 | |||
| 17.2.3 | Grinding Circuit | 115 | |||
| 17.2.4 | Copper Flotation | 115 | |||
| 17.2.5 | Zinc Flotation | 116 | |||
| 17.2.6 | Pyrite Flotation (Optional) | 117 | |||
| 17.2.7 | Concentrate Dewatering and Handling | 117 | |||
| 17.2.8 | Tailings Dewatering and Handling | 118 | |||
| 17.2.9 | Paste Plant | 118 | |||
| 17.2.10 | Reagents Handling and Storage | 119 | |||
| 17.2.11 | Plant Services | 119 | |||
| 18.0 | PROJECT INFRASTRUCTURE | 120 | |||
| 18.1 | ROADS | 120 | |||
| 18.1.1 | Access Road | 120 | |||
| 18.1.2 | Haul Roads | 121 | |||
| 18.1.3 | Service Roads | 121 | |||
| 18.2 | UTILITIES | 121 | |||
| 18.2.1 | Power Supply | 121 | |||
| 18.2.2 | Water Systems | 122 | |||
| 18.3 | FUEL FACILITIES | 122 | |||
| 18.4 | BUILDINGS | 122 | |||
| 18.5 | TAILINGS MANAGEMENT FACILITY | 123 | |||
| 18.6 | SEWAGE TREATMENT | 125 | |||
| 18.7 | FIRE PROTECTION | 125 | |||
| 18.8 | VENTILATION | 125 | |||
| Blue Moon Mine | iii | March 2025 |
| 18.9 | WASTE ROCK STORAGE | 125 | |||
| 18.10 | EXPLOSIVES STORAGE | 125 | |||
| 18.11 | MINE DEWATERING AND SEDIMENTATION PONDS | 126 | |||
| 18.12 | WATER USAGE | 126 | |||
| 18.13 | WATER STORAGE | 127 | |||
| 18.14 | WASTE MANAGEMENT | 128 | |||
| 19.0 | MARKET STUDIES AND CONTRACTS | 129 | |||
| 19.1 | CONTRACTS | 129 | |||
| 19.2 | MARKET STUDIES | 129 | |||
| 19.2.1 | Zinc | 129 | |||
| 19.2.2 | Copper | 129 | |||
| 19.2.3 | Lead | 130 | |||
| 19.2.4 | Gold | 131 | |||
| 19.2.5 | Silver | 131 | |||
| 19.2.6 | Aggregate | 132 | |||
| 19.2.7 | Pyrite | 132 | |||
| 19.2.8 | Barite | 132 | |||
| 19.2.9 | Gypsum | 132 | |||
| 19.2.10 | Gallium, Germanium and Indium | 132 | |||
| 20.0 | ENVIRONMENTAL STUDIES, PERMITTING AND SOCIAL OR COMMUNITY IMPACT | 133 | |||
| 20.1 | REGULATORY FRAMEWORK AND PROJECT PERMITTING | 133 | |||
| 20.1.1 | Summary of Key Mining and Environmental Legislation | 133 | |||
| 20.1.2 | Environmental Permitting Process | 134 | |||
| 20.1.3 | Project Permitting Status | 135 | |||
| 20.1.4 | Good International Industry Practice | 139 | |||
| 20.2 | STATUS OF ENVIRONMENTAL AND SOCIAL STUDIES | 139 | |||
| 20.3 | ENVIRONMENTAL AND SOCIAL CONTEXT | 140 | |||
| 20.3.1 | Overview | 140 | |||
| 20.3.2 | Water Resources | 141 | |||
| 20.3.3 | Biodiversity | 141 | |||
| 20.3.4 | Cultural Heritage | 143 | |||
| 20.3.5 | Socio-economic Setting | 143 | |||
| 20.4 | ENVIRONMENTAL AND SOCIAL RISKS AND IMPACTS | 143 | |||
| 20.5 | PROJECT CLOSURE PLANNING | 145 | |||
| 20.6 | RECOMMENDATIONS | 145 | |||
| 21.0 | CAPITAL AND OPERATING COSTS | 147 | |||
| 21.1 | CAPITAL COSTS | 147 | |||
| 21.1.1 | Summary and Basis of Estimate | 147 | |||
| 21.1.2 | Mining Capital | 147 | |||
| 21.1.3 | Processing Capital | 148 | |||
| 21.1.4 | Infrastructural Capital | 148 | |||
| 21.1.5 | Indirect Capital and Contingency | 149 | |||
| 21.1.6 | Closure, Rehabilitation and Salvage | 150 | |||
| 21.2 | OPERATING COSTS | 150 | |||
| Blue Moon Mine | iv | March 2025 |
| 21.2.1 | Mining Operating Costs | 150 | |||
| 21.2.2 | Processing Operating Costs | 151 | |||
| 21.2.3 | Environmental and Social, and General and Administration Operating Costs | 153 | |||
| 21.2.4 | Indirect Off-Site Costs | 154 | |||
| 22.0 | ECONOMIC ANALYSIS | 155 | |||
| 22.1 | CAUTIONARY STATEMENT | 155 | |||
| 22.2 | BASIS OF EVALUATION | 156 | |||
| 22.3 | MACRO-ECONOMIC ASSUMPTIONS | 156 | |||
| 22.3.1 | Exchange Rate and Inflation | 156 | |||
| 22.3.2 | Weighted Average Cost of Capital | 156 | |||
| 22.3.3 | Royalty and Taxation Regime | 156 | |||
| 22.3.4 | Expected Metal Prices | 156 | |||
| 22.4 | TECHNICAL ASSUMPTIONS | 157 | |||
| 22.4.1 | Mine Construction and Development | 157 | |||
| 22.4.2 | Production and Sales | 157 | |||
| 22.4.3 | Cash Operating Costs | 160 | |||
| 22.4.4 | Capital Expenditure | 161 | |||
| 22.4.5 | Working Capital | 162 | |||
| 22.5 | BASE CASE ECONOMICS | 162 | |||
| 22.5.1 | Key Statistics | 162 | |||
| 22.5.2 | Base Case Cash Flow | 162 | |||
| 22.6 | SENSITIVITY ANALYSIS | 165 | |||
| 22.6.1 | Base Case Sensitivity | 165 | |||
| 22.6.2 | Discount Rate Sensitivity | 166 | |||
| 22.6.3 | Detailed Metal Price Sensitivity | 166 | |||
| 23.0 | ADJACENT PROPERTIES | 167 | |||
| 24.0 | OTHER RELEVANT DATA AND INFORMATION | 168 | |||
| 25.0 | INTERPRETATION AND CONCLUSIONS | 169 | |||
| 25.1 | OVERVIEW | 169 | |||
| 25.2 | GEOLOGICAL SETTING, EXPLORATION, AND RESOURCES | 169 | |||
| 25.3 | MINING METHODS AND INFRASTRUCTURE | 169 | |||
| 25.4 | METALLURGY AND PROCESSING | 169 | |||
| 25.5 | ENVIRONMENTAL, PERMITTING, AND SOCIAL IMPACT | 170 | |||
| 25.6 | CAPITAL AND OPERATING COSTS | 170 | |||
| 25.7 | ECONOMIC ANALYSIS | 170 | |||
| 26.0 | RECOMMENDATIONS | 171 | |||
| 26.1 | PHASE 1: PLANNING, HIRING AND PERMITTING | 171 | |||
| 26.2 | PHASE 2: EXPLORATION DECLINE DEVELOPMENT AND FURTHER STUDIES | 171 | |||
| 26.2.1 | Exploration Decline Development | 171 | |||
| 26.2.2 | Geology and Exploration | 171 | |||
| 26.2.3 | Hydrogeological Fieldwork | 172 | |||
| 26.2.4 | Metallurgical Testwork | 172 | |||
| Blue Moon Mine | v | March 2025 |
| 26.2.5 | Environmental and Social | 172 | |||
| 26.2.6 | Feasibility Study | 173 | |||
| 26.3 | WORK PROGRAM | 173 | |||
| 27.0 | REFERENCES | 174 | |||
| 28.0 | DATE AND SIGNATURE PAGE | 176 | |||
| 29.0 | CERTIFICATES | 177 | |||
| Blue Moon Mine | vi | March 2025 |
| List of Tables | ||
| Table 1.1 | Significant Intercepts from the BMM Drill Program | 4 |
| Table 1.2 | Blue Moon Mineral Resource Estimate, Effective as of December 24, 2024 | 7 |
| Table 1.3 | LOM Capital Cost Estimate | 14 |
| Table 1.4 | LOM Operating Cost Estimate | 14 |
| Table 1.5 | Base Case: Key Statistics | 15 |
| Table 1.6 | Detailed Metal Price Sensitivity | 16 |
| Table 1.7 | Blue Moon Recommended Work Programs | 20 |
| Table 2.1 | Units and Abbreviations | 22 |
| Table 4.1 | Blue Moon Claims | 28 |
| Table 7.1 | Blue Moon Summary Statistics from Drill Core | 45 |
| Table 10.1 | Summary of Drilling on the Blue Moon Property, Prior to the Formation of BMM | 52 |
| Table 10.2 | Drilling by BMM Since 2018 at Blue Moon Project | 52 |
| Table 10.3 | Significant Intercepts from the BMM Drill Program | 53 |
| Table 10.4 | Assay Highlights New South Zone (Drill Hole BM21-83) | 55 |
| Table 11.1 | Summary Statistics, Check Assays | 56 |
| Table 11.2 | Paired t-test, Check Assays | 57 |
| Table 12.1 | Independent QP’s Data Verification, November 5, 2024 | 58 |
| Table 13.1 | Selected Head Analyses of the Metallurgical Composite Samples | 61 |
| Table 13.2 | Semi-Quantitative Spectrographic Analyses of the Metallurgical Composite Samples | 61 |
| Table 13.3 | Summary of the Sample 1 Locked Cycle Flotation Test Results | 63 |
| Table 13.4 | Locked Cycle Test Combined Final Concentrate Analyses | 64 |
| Table 13.5 | Analyses of Test 25 Pyrite Concentrate and Tailings Samples | 64 |
| Table 14.1 | Blue Moon Indicated Mineral Resource Estimate | 68 |
| Table 14.2 | Blue Moon Inferred Mineral Resource Estimate | 68 |
| Blue Moon Mine | vii | March 2025 |
| Table 14.3 | Drilling Database Assay Statistics | 72 |
| Table 14.4 | Drill Database Capping Values | 73 |
| Table 14.5 | Capped Drill Database Assay Statistics | 74 |
| Table 14.6 | Composite Database Statistics | 77 |
| Table 14.7 | Tonnage Factor Determinations from Specific Gravity Values Based on Total Sulphide Content | 78 |
| Table 14.8 | Block Model Location and Dimensions | 78 |
| Table 14.9 | Block Model - Block Dimensions | 78 |
| Table 14.10 | Summary of Search Parameters | 79 |
| Table 14.11 | Zinc Equivalent Percent (ZnEq %) Parameters Used for ZnEq % Calculation | 79 |
| Table 14.12 | Blue Moon Mineral Resource Estimate, Effective as of December 24, 2024 | 88 |
| Table 14.13 | ZnEq % Cutoff Sensitivity Analysis - Indicated Mineral Resource Classification by Mineralized Zone | 89 |
| Table 14.14 | ZnEq % Cutoff Sensitivity Analysis - Inferred Mineral Resource Classification by Mineralized Zone | 90 |
| Table 16.1 | NSR Parameters Used to Code Block Model for MSO Analysis | 94 |
| Table 16.2 | Stope Sizes, Dilution (ELOS) and Recovery Factors Analysed | 95 |
| Table 16.3 | Development Design Criteria | 97 |
| Table 16.4 | Preliminary Ventilation Flow Requirements | 98 |
| Table 16.5 | Resource Rates Applied in the Mine Schedule | 100 |
| Table 16.6 | Annual Mine Schedule Summary | 101 |
| Table 16.7 | Annual Mine Schedule Summary | 102 |
| Table 16.8 | Peak Salaried Workforce Estimate | 103 |
| Table 16.9 | Peak Hourly-Wage Workforce Estimate | 104 |
| Table 17.1 | Process Design Basis | 110 |
| Table 17.2 | Process Design Criteria | 111 |
| Blue Moon Mine | viii | March 2025 |
| Table 18.1 | Annual Water Balance | 126 |
| Table 20.1 | Summary of Mineral Rights associated with the Blue Moon Project | 137 |
| Table 20.2 | Summary of Historic Environmental and Social Baseline Studies | 140 |
| Table 21.1 | LOM Capital Cost Estimate | 147 |
| Table 21.2 | LOM Capital Cost Estimate- Mining | 148 |
| Table 21.3 | LOM Capital Cost Estimate - Processing | 148 |
| Table 21.4 | LOM Capital Cost Estimate - Infrastructure | 149 |
| Table 21.5 | LOM Capital Cost Estimate - Indirect Costs | 149 |
| Table 21.6 | LOM Operating Cost Estimate | 150 |
| Table 21.7 | Summary of Estimated Mine Operating Costs | 151 |
| Table 21.8 | Summary of Estimated Process Operating Costs | 151 |
| Table 21.9 | Estimated Annual E&S and G&A Operating Costs | 154 |
| Table 22.1 | Assumed TC/RC terms -Copper Concentrate | 158 |
| Table 22.2 | Assumed TC/RC terms -Zinc Concentrate | 158 |
| Table 22.3 | LOM Average Operating Costs | 160 |
| Table 22.4 | LOM Capital Costs | 161 |
| Table 22.5 | Base Case: Key Statistics | 162 |
| Table 22.6 | LOM Cash Flow Summary | 163 |
| Table 22.7 | LOM Annual Cash Flow | 164 |
| Table 22.8 | Detailed Metal Price Sensitivity | 166 |
| Table 26.1 | Blue Moon Preliminary Feasibility Study Work Program | 173 |
| Blue Moon Mine | ix | March 2025 |
| List of Figures | ||
| Figure 1.1 | Blue Moon Location Map | 2 |
| Figure 1.2 | Mine Design Model View Looking West | 9 |
| Figure 1.3 | Blue Moon General Arrangement | 10 |
| Figure 1.4 | TMF General Arrangement | 11 |
| Figure 1.5 | NSR Value by Metal | 13 |
| Figure 1.6 | Annual Cash Flow Projection | 15 |
| Figure 4.1 | Blue Moon Location Map | 25 |
| Figure 4.2 | Current Land Status at the Blue Moon Project | 27 |
| Figure 5.1 | Drone View from Above Blue Moon Shaft to the South Along Ridge | 31 |
| Figure 5.2 | Existing Infrastructure | 33 |
| Figure 6.1 | American Eagle Mine Entrance | 37 |
| Figure 6.2 | Blue Moon Mine; Historic Mine Shaft of Hecla | 37 |
| Figure 6.3 | Blue Moon VMS on Dump of Shaft 2 | 38 |
| Figure 7.1 | Foothills Copper-Zinc Belt, Western Sierra Nevada Mts., California | 40 |
| Figure 7.2 | Property Geology (Meade, 2002) | 43 |
| Figure 9.1 | Massive Sulphide Zones (Red) and Gravity Station Grid | 49 |
| Figure 9.2 | NNW Trending Gravity Low Superimposed Massive Sulphide Zones (Carpenter, 2023) | 50 |
| Figure 10.1 | Location of All Drill Holes on the Blue Moon Prospect through 2023 (Shum, Kevin 2023) | 51 |
| Figure 10.2 | Long Section Showing Latest Drilling Through to 2021 | 54 |
| Figure 10.3 | Photographs of Zinc Mineralization in Drillhole BM21-83 | 55 |
| Figure 14.1 | Plan View of Mineralized Domains and Drilling | 69 |
| Figure 14.2 | Long-Section View - 7500E Looking West - Mineralized Domains | 70 |
| Figure 14.3 | Long Section View - 7500E Looking East - Mineralized Domains | 71 |
| Blue Moon Mine | x | March 2025 |
| Figure 14.4 | Cross-Section through Drill Hole CH57 Showing Mineralized Domain Solids Coded to Assay Intervals | 75 |
| Figure 14.5 | Cross-Section View 8100N Looking North - Mineralized Domain Solids | 76 |
| Figure 14.6 | Zinc Equivalent Grade Estimation of Main Zone - Long Section 8000E Looking West | 80 |
| Figure 14.7 | Zinc Equivalent Grade Estimation of Eastern Lenses - Long Section 8000E Looking West | 81 |
| Figure 14.8 | Zinc Equivalent Grade Estimation of Western Lenses - Long Section 7000E Looking East | 82 |
| Figure 14.9 | Main Zone Block Estimated Grades vs Capped Composite Grades - Zn % | 83 |
| Figure 14.10 | East Lenses Block Estimated Grades vs Capped Composite Grades - Zn % | 83 |
| Figure 14.11 | Main Zone Block Estimated Grades vs Composite Grades - Ag OPT | 84 |
| Figure 14.12 | Long-Section View - Main Zone - Average Distance to Sample and Indicated Mineral Resource Domain Boundary (Red) - 8000E Looking West | 85 |
| Figure 14.13 | Long-Section View – East Lenses-Average Distance to Sample and Indicated Mineral Resource Domain Boundary (Red) - 8000E Looking West | 85 |
| Figure 14.14 | Long-Section View – West Lenses-Average Distance to Sample and Indicated Mineral Resource Domain Boundary (Red) - 7000E Looking East | 86 |
| Figure 14.15 | Main Zone Block Resource Classification (Red as Indicated Mineral Resource) | 86 |
| Figure 14.16 | East Lenses Block Resource Classification (Red as Indicated Mineral Resource) | 87 |
| Figure 14.17 | West Lenses Block Resource Classification (Red as Indicated Mineral Resource) | 87 |
| Figure 14.18 | Grade-Tonnage Chart for the Indicated Mineral Resource Estimate – All Domains | 91 |
| Figure 16.1 | MSO Results Over a Range of Shape Sizes and NSR Cut-Off Values | 95 |
| Figure 16.2 | Longitudinal Retreat Concept | 96 |
| Figure 16.3 | Mine Design Model View Looking West | 97 |
| Figure 16.4 | Ventilation Network Schematic | 99 |
| Figure 17.1 | Blue Moon Process Flow Diagram – 1 of 3 | 107 |
| Figure 17.2 | Blue Moon Process Flow Diagram – 2 of 3 | 108 |
| Figure 17.3 | Blue Moon Process Flow Diagram – 3 of 3 | 109 |
| Figure 18.1 | Blue Moon General Arrangement | 120 |
| Blue Moon Mine | xi | March 2025 |
| Figure 18.2 | TMF General Arrangement | 123 |
| Figure 18.3 | TMF Layout | 124 |
| Figure 19.1 | Zinc Market Price 2015-2025 | 129 |
| Figure 19.2 | Copper Market Price 2015-2025 | 130 |
| Figure 19.3 | Lead Market Price 2015-2025 | 130 |
| Figure 19.4 | Gold Market Price 2015-2025 | 131 |
| Figure 19.5 | Silver Market Price 2015-2025 | 131 |
| Figure 20.1 | Mining Claim Boundaries | 136 |
| Figure 20.2 | Environmental and Social Context of Project Site | 141 |
| Figure 20.3 | Environmental Conditions at the Project Site (November 2024) | 142 |
| Figure 21.1 | Breakdown of Average LOM Process Operating Costs | 152 |
| Figure 22.1 | LOM Mill Feed Production Schedule | 157 |
| Figure 22.2 | Annual NSR Contribution by Metal | 159 |
| Figure 22.3 | NSR value by Concentrate Type | 159 |
| Figure 22.4 | NSR value by Metal | 160 |
| Figure 22.5 | Annual Operating Costs | 161 |
| Figure 22.6 | Annual Cash Flow Projection | 163 |
| Figure 22.7 | Base Case NPV Sensitivity Analysis | 165 |
| Figure 22.8 | Base Case IRR Sensitivity Analysis | 165 |
| Figure 22.9 | Base Case Sensitivity to Discount Rate | 166 |
| Blue Moon Mine | xii | March 2025 |
 |
Blue Moon Metals Inc. |
1.0 SUMMARY
| 1.1 | INTRODUCTION |
Blue Moon Metals Inc. (BMM), holds the mineral rights to the unpatented mining claims and patented (private) lands associated with the Blue Moon volcanogenic massive sulphide (VMS) deposit (Blue Moon Property, or the Property) in central California through its wholly owned subsidiary, Keystone Mines Inc. The deposit is known to contain zinc, copper, lead, gold and silver within sulphide minerals that may potentially be processed into saleable concentrates.
The most recent Technical Report describing a mineral resource estimate (MRE) for the Property was published in October, 2023. That report was authored by Dr. Thomas A. Henricksen, CPG and Scott Wilson, CPG, the latter of Resource Development Associates Inc. (RDA). There has been no further exploration carried out on the Property since the effective date of that report.
In October, 2024, BMM retained RDA and Micon International Limited (Micon) to update the MRE and prepare a Preliminary Economic Assessment (PEA) of the Property, respectively. That work has now been completed, and the results are presented in this Technical Report, in the context of which development of the Property is referred to as ‘the Project’.
| 1.2 | PROPERTY DESCRIPTION |
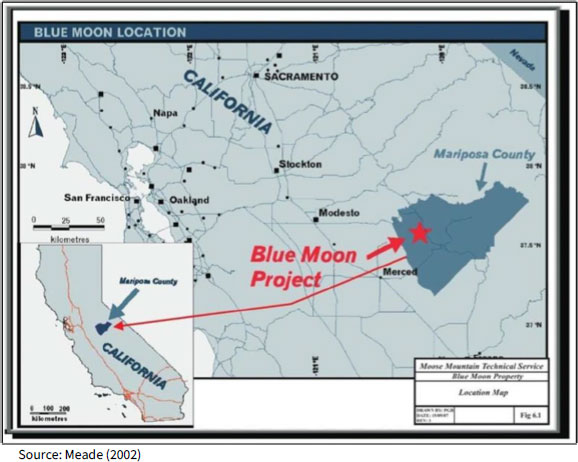
The Blue Moon Property is located in Mariposa County, California, approximately 120 miles southeast of San Francisco. The town of Mariposa, located sixteen miles east of the Project, has a population of around 2,000 and a tourist-based economy. The town of Merced, with a population of around 80,000 inhabitants, is twenty-two miles to the southwest of Blue Moon and has a diverse economy related to large scale agriculture. The local community of Hornitos with a population of about 75, is situated about 4 .5 miles south of the Property. Figure 1.1 (over) shows the location of the Property.
The Property consists of three distinct land tenure components that cover 494.25 acres. These include:
| 1. | Two patented (private) parcels of land, ‘American Eagle’, and ‘Blue Bell & Bonanza’, owned 100% by Keystone Mines Inc. (both the surface and mineral estate). |
| 2. | Eight federal unpatented mining (lode) claims, Red Cloud 1-8, held 100% by Keystone Mines Inc. on land administered by the Bureau of Land Management (BLM). |
| 3 . | A 100% interest, owned by Keystone Mines Inc., in the mineral rights underlying lands owned by the James Gann Jr. Trust of 1991, in conjunction with a surface rights lease agreement for 40 acres, pursuant to an option purchase agreement completed in 2001. |
Access to the Property is via California County Route J16 also known as Hornitos Rd. and Bear Valley Rd., a paved secondary highway between the communities of Hornitos and Bear Valley. From a point two miles north of Hornitos, at the intersection of J16 and Exchequer Rd., the Project is accessible via a 3 .4-mile route traversing a combination of public and private gravel roads.
Four distinct lenses of massive sulphide mineralization have been identified on the Property: the West, Main, East and American Eagle zones. The American Eagle Zone appears to occur in the same stratigraphic position as the West Zone.
| Blue Moon Mine | 1 | March 2025 |
| |
Blue Moon Metals Inc. |
Figure 1.1
Blue Moon Location Map
| 1.3 | HISTORY |
Although copper was discovered in Mariposa County during mid-1800’s gold rush, initial exploration on the Property did not begin until the 1890’s. Between 1899 and 1912, the American Eagle zone was worked, and again in 1942 when a small block of ground was stoped. By 1943, production from the American Eagle was suspended and it has remained inactive since then. No reliable figures for the total production at the American Eagle are available.
In 1940, Red Cloud Mines, Inc. (Red Cloud), began developing shallow workings which intersected zinc, probably in the Main Zone near Blue Moon Shaft #1, adjacent to the American Eagle zone. In 1943, Red Cloud was acquired by Hecla Mining Co., and production at a rate of 200 tons per day yielded ore with an average content of 14% zinc along with minor copper, lead, silver and gold. In 1945, the “hanging wall fault breccia” caved twice, once in the summer and again in November. Following the second cave-in, all work at the Blue Moon mine was suspended. At that time, production amounted to about 56,000 tons of ore containing approximately 12.3% zinc, 0.37% copper, 0.48% lead, 3.76 opt silver, and 0 .062 opt Au.
Additional exploration, drilling and engineering studies were carried out between 1976 and 1991 by a series of operators including Amselco, Colony Pacific Explorations Ltd, Westmin Resources Limited, and Lac Minerals. In 1989, Westmin obtained a permit and approval form Mariposa County to build a vertical shaft for underground development and resource expansion, but the project was not developed. In 2007, ownership of the Property passed to Savant Explorations Inc., later renamed Blue Moon Zinc Corp. and, in 2021, Blue Moon Metals Inc.
| Blue Moon Mine | 2 | March 2025 |
| |
Blue Moon Metals Inc. |
| 1.4 | GEOLOGY |
The Gopher Ridge Formation in the area of the Blue Moon deposit consists of a basal sequence of basalt and andesite overlain by a rhyolite. The rhyolite strata are up to 300 m thick and host the Blue Moon deposit(s). The sulphide-sulphate mineralized lenses are hosted in the lower part of the felsic sequence. The felsic volcanic rocks are succeeded to the east by volcaniclastic rocks and ultimately by deep-water argillaceous, sedimentary rocks (Meade, 1996).
Strata at Blue Moon strike approximately 20° west of north, dip near vertically, face to the east and are tightly folded. Minor fold features suggest a steep, north plunge of the regional structure. All lithologies have undergone low grade metamorphism characteristic of the lower greenschist facies.
The rhyolite strata have been subdivided on the basis of phenocryst mineralogy into three distinct units: aphyric rhyolite, feldspar porphyry rhyolite and quartz-feldspar porphyry rhyolite. The thinning of the aphyric rhyolite proximal to the domes defines favorable environments for deposition of massive sulphide mineralization. Further up the stratigraphic sequence, massive feldspar porphyry rhyolite appears to define sill or dyke features that locally truncate sulphide mineralization.
Lateral to the sulphide mineralization are chemical sedimentary rocks containing hematite, magnetite, barite, silica and manganese minerals, which help define mineralized horizons. Sulphide-barite mineralization on the edges of massive sulphide mineralization grades laterally into hematite-jasper iron formation, which, in turn, grades into manganese-bearing siliceous tuffaceous rock.
The Blue Moon deposit is a Kuroko-type volcanogenic massive sulphide (VMS) deposit. The deposit is shown to have some similarities with the Lynx and Myra deposits at Myra Falls, Vancouver Island. Stacked sulphide-sulphate lenses occur in two or more horizons within a 50 ft to 180 ft stratigraphic interval.
Massive sulphide mineralization consists of pyrite, sphalerite, chalcopyrite, galena, and minor tetrahedrite and bornite. Massive and semi-massive sulphides may be accompanied by purple anhydrite, gypsum or barite. Textures include massive, banded and clastic mineralization.
Metal zoning in base or precious metal is poorly understood although there is a strong tendency for narrower mineralized zones to be relatively richer in gold and silver and to have barite gangue.
| 1.5 | EXPLORATION AND DRILLING |
Exploration of the Blue Moon Property, mostly historical in nature, was carried out by earlier owners and includes geological mapping, soil geochemical surveys and geophysical surveys, including an induced polarization survey, down-hole EM surveys and, in 2023, a gravity survey.
Drilling on the Blue Moon Property since 1942 totals 136,416 ft of drilling in 124 drill holes. Most of the holes were drilled in the Blue Moon deposit area. Only core holes drilled since 1979 were used in the resource calculation. Drilling by BMM in 2018, 2019 and 2021 totals 13,686 ft in ten drill holes. Significant intercepts from the BMM drilling are shown in Table 1.1.
Core was collected at the drilling rig by a company geologist, cleaned, logged for rock type, structures and mineralization prior to a geologist marking out specific intervals for sampling based on sulphide content. The core was sampled lengthwise with one half placed into a plastic sample bag with a sample tag. The other half was returned to the core box with a duplicate sample tag number for a permanent record. Standards and blank samples were not inserted into the stream of core samples prior to BMM as this was not practiced by the majority of mining companies at that time. Core with visual mineralization was stored in locked shipping containers which remain on site, with saved mineralized sections of core available for inspection.
| Blue Moon Mine | 3 | March 2025 |
| |
Blue Moon Metals Inc. |
Table 1.1
Significant Intercepts from the BMM Drill Program
| Hole | From (ft) | To (ft) | Length (ft) | Zinc (%) | Gold (g/t) | Silver (g/t) | Lead (%) | Copper (%) | ZnEq (%) | ||||||||||||||||||||||||||||
| BMZ75 | 1,022.0 | 1,038.0 | 16.0 | 1.2 | 0.08 | 0.7 | 0 | 0.04 | 1.4 | ||||||||||||||||||||||||||||
| Inc | 1,027.0 | 1,029.0 | 2.0 | 2.9 | 0.05 | 1.5 | 0 | 0.08 | 3.2 | ||||||||||||||||||||||||||||
| BMZ78 | 1,425.0 | 1,545.7 | 120.7 | 9.45 | 1.10 | 42.93 | 0.15 | 0.58 | 12.61 | ||||||||||||||||||||||||||||
| Inc | 1,436.0 | 1,441.0 | 5.0 | 1.90 | 4.98 | 32.60 | 0.47 | 0.11 | 8.08 | ||||||||||||||||||||||||||||
| Inc | 1,459.0 | 1,464.0 | 5.0 | 2.60 | 5.01 | 18.50 | 0.01 | 0.33 | 8.77 | ||||||||||||||||||||||||||||
| Inc | 1,468.5 | 1,453.3 | 15.2 | 5.98 | 2.30 | 15.44 | 0.03 | 0.38 | 9.40 | ||||||||||||||||||||||||||||
| Inc | 1,508.0 | 1,538.0 | 30.0 | 30.30 | 1.67 | 71.07 | 0.05 | 1.70 | 36.80 | ||||||||||||||||||||||||||||
| Inc | 1,508.0 | 1,511.0 | 3.0 | 46.50 | 3.14 | 130.00 | 0.13 | 2.20 | 56.51 | ||||||||||||||||||||||||||||
| BMZ79 | 412.8 | 420.3 | 7.5 | 25.6 | 0.68 | 17.39 | 0.02 | 0.87 | 28.46 | ||||||||||||||||||||||||||||
| Inc | 414.7 | 417.7 | 3.0 | 49.6 | 0.91 | 30.32 | 0.05 | 1.39 | 54.11 | ||||||||||||||||||||||||||||
| BMZ79 | 450.4 | 461.3 | 10.9 | 3.1 | 0.16 | 4.49 | 0.27 | 0.47 | 4.62 | ||||||||||||||||||||||||||||
| Inc | 457.2 | 459.2 | 2.0 | 4.2 | 0.08 | 3.30 | 0.33 | 0.24 | 5.24 | ||||||||||||||||||||||||||||
| BM21-83 | 504.0 | 514.0 | 10.0 | 3.8 | 0.07 | 5.10 | 0.17 | 0.12 | 4.40 | ||||||||||||||||||||||||||||
| Inc | 509.0 | 514.0 | 5.0 | 5.0 | 0.07 | 5.10 | 0.22 | 0.08 | 5.50 | ||||||||||||||||||||||||||||
| BM21-83 | 1,829.0 | 1839.0 | 10.0 | 1.1 | 3.62 | 11.3 | 0.30 | 0.04 | 5.30 | ||||||||||||||||||||||||||||
| Inc | 1,839.0 | 1839.0 | 5.0 | 1.2 | 6.96 | 15.2 | 0.30 | 0.03 | 8.80 | ||||||||||||||||||||||||||||
| BM21-83 | 2,408.0 | 2,458.0 | 50.0 | 2.4 | 0.31 | 4.5 | 0.06 | 0.12 | 3.13 | ||||||||||||||||||||||||||||
| Inc | 2,413.0 | 2,423.0 | 10.0 | 3.4 | 0.17 | 5.8 | 0.05 | 0.09 | 3.90 | ||||||||||||||||||||||||||||
| Inc | 2,443.0 | 2,453.0 | 10.0 | 4.3 | 0.31 | 4.5 | 0.01 | 0.34 | 5.46 | ||||||||||||||||||||||||||||
Samples were sent to certified, independent laboratories. Gold assaying used a 30 g sample size for a fire assay with an atomic absorption spectrometry finish (FA-AAS). Silver and lead assays were generated with atomic absorption spectrometry (AAS). All other elements were assayed by inductively coupled plasma atomic emission spectroscopy (ICP-AES), including barium which required an additional, final gravimetric procedure. Known standards and blank samples were inserted into the sample stream by the laboratory for quality control.
Statistical analysis of 55 check assays by a previous author showed no significant difference between laboratories.
A site visit was undertaken on November 5 to 6, 2024 by Scott Wilson C.P.G. SME-RM, Christopher Jacobs CEng MIMMM and Alan J. San Martin, P.Eng., each of whom is a Qualified Person (QP) in terms of Canadian National Instrument (NI) 43-101. As QP for the resource estimate, Mr. Wilson had access to the complete database of the Property including all original assay certificates, the original drill logs, the results of surveys of the original drill hole locations by Freeman and Seaman Land Surveyors, and down-hole, directional survey results for all holes used in the resource calculations. As well as the original surveyors report on drill hole locations, the QP was provided with a report of a 2018 survey commissioned by BMM and completed by Jones Snyder and Associates, a registered land surveyor in the state of California. The 2018 survey included resurveying of 29 holes used in the current resource calculation as well as monuments established by the surveys of 1984 and 1991.
| Blue Moon Mine | 4 | March 2025 |
| |
Blue Moon Metals Inc. |
All mineralized intersections used in the resource calculation are preserved in a secured storage facility on the Blue Moon Property. As part of the verification process, the QP completed cross checks of the assay sample numbers recorded in the original assay certificates with drill logs and the sample tags in the core boxes for 30 of the mineralized intercepts. No discrepancies or errors were noted between the sample numbers on the tags in the core boxes and those recorded in the assay certificates. The QP did not note any visual discrepancies between what was observed in the core with what was recorded in the drill logs. No assay with high zinc, copper or lead were noted to be at odds with what was observed in the drill core for the comparable interval.
| 1.6 | METALLURGY |
A program of metallurgical testwork was undertaken using two mineralized samples (identified as Sample 1 and Sample 2) by Lakefield Research (now SGS Mineral Services), Ontario, Canada, in 1988, under the direction of Wright Engineers Limited on behalf of Westmin Resources Limited. This preliminary testwork program comprised chemical and mineralogical analyses, hardness testing, batch and locked cycle flotation, flotation concentrate analyses, gravity separation and preliminary settling tests on samples of zinc concentrate and zinc rougher tailings.
Sample 1 was reported by Lakefield Research to comprise relatively coarse high-sulphide mineralization with active pyrite and sphalerite. Sample 2 was reported to contain less sulphides and be more complex and finer grained than Sample 1.
The results of preliminary mineralogical characterization study by Lakefield Research showed that the samples were similar with respect to sulphide mineral species but there were differences in the amounts of each sulphide and mineral associations. In general, Sample 1 contained more sulphides and was relatively coarse grained (> 100 microns) while Sample 2 contained more non-opaque minerals and sulphide particles were smaller in size.
The work indices derived from standard Bond grinding testing of around 9 kWh/t are considered relatively low compared with most copper and zinc ores (between 11 and 14 kWh/t), although the elevated content of barite and gypsum could explain the perceived discrepancy.
Lakefield Research completed 26 separate bench scale batch flotation tests and one locked cycle test primarily to investigate the sequential flotation of copper and zinc from the two samples.
The results of the cycle test using Sample 1 show a 93% copper recovery into a concentrate containing 26.5% Cu, 8.42 g/t Au, 484 g/t Ag, 2.35% Pb and 7.0% Zn. Lead recovery to the copper concentrate was also 93% while the recoveries of gold and silver were around 68%. A zinc recovery of 95.2% Zn was achieved into a high quality zinc concentrate containing 62.3% Zn.
Although preliminary mineralogical studies suggested that Sample 2 was more complex and fine-grained than Sample 1, the results from batch rougher and cleaner flotation tests were similar to Sample 1. A simple batch pyrite recovery test was completed using Sample 2 following sequential flotation of Cu/Pb and Zn. Approximately 20% of the original mass was recovered to a pyrite rougher concentrate.
| Blue Moon Mine | 5 | March 2025 |
| |
Blue Moon Metals Inc. |
The conclusions from the 1988 testwork program are as follows:
| • | Good recoveries of copper and zinc into high grade concentrates were achieved using conventional sequential flotation technology. Typically, most of the gold and silver in the samples tended to report to the copper/lead concentrate. Net recoveries of gold and silver to both the zinc and copper concentrates were 86.2% and 94.3% respectively. |
| • | The copper/lead concentrate produced contained minor amounts of deleterious elements which may incur penalties when sold to smelters. Conversely, this product also contained gold and silver in payable quantities. |
| • | The zinc concentrate produced was of high grade with relatively low iron and contained no significant amount of penalty elements. |
| • | Flotation of pyrite from zinc tailings was successful and additional work to improve the product quality is recommended. |
| • | Separation of copper and lead into separate products was challenging but further work to improve selectivity is warranted. |
| • | The work indices calculated from standard Bond ball mill tests were relatively low and need to be confirmed using fresh samples that represent the main ore types at Blue Moon. |
| • | The samples contained interesting amounts of barite and gypsum. More work is required to quantify the distribution of these minerals within the deposit, the quality of these minerals, and the potential to recover these minerals as valuable by-products. |
| • | The samples appeared to contain a certain amount of free or nuggetty gold which should be investigated further. Deportment studies on the gold and silver are recommended. |
| • | Elements of particular interest that should be investigated in the next phase of metallurgical testwork include germanium and gallium. The economic potential of these elements as well as indium should be considered during the next geo-metallurgical testwork program. |
| • | Based on the limited amount of testing undertaken so far, there are no processing factors or other deleterious elements that could have a significant effect on the potential economic extraction of the deposit. |
| 1.7 | MINERAL RESOURCE ESTIMATE |
The Mineral Resource Estimate (“MRE”) for this report has been determined by using inverse distance cubed (ID3) techniques for the Main, Western and Eastern Zones of the Blue Moon Massive Sulphide Deposit. Assay data was derived from the current drilling database, including drill holes completed after 2018. Mineralized domain solids were created from the coding of drill data in a three-dimensional (3D) geological modeling program. Drilling intercept assay values were capped for each mineralized domain using statistical analysis and subsequently composited forming the sample set used for the MRE grade estimates. The MRE has been determined according to the CIM Estimation of Mineral Resources and Mineral Reserves Best Practice Guidelines. Mineral Resources have been reported in accordance with the disclosure requirements under NI 43-101.
The MRE is subdivided into three zones: Main Zone (vm1), East Zone (ve) and West Zone (vw). Using compiled and modeled 3D drill data there are distinct, separate, continuous lenses of mineralization, generally striking north. The Main Zone represents the largest occurrence of mineralization. Mineralization has been identified over a strike length of 2,500 ft as well as a plunge of nearly 2,500 ft of depth. The West and East Zones display less continuity as compared to the Main Zone. These were modeled independently and subsequently appended together to form a combined east and west zone triangulation domains. In addition to the dominant mineralized lenses numerous prominent mineralized intervals exist along many drill holes throughout the deposit. Individual mineralized domain solids were developed for these intervals which were subsequently labeled east lenses (vle) and west lenses (vlw) based upon their respective relationships to the Main Zone. The “vle” and “vlw” lenses were compiled and added to the overall “ve” and “vw” domain triangulations.
| Blue Moon Mine | 6 | March 2025 |
| |
Blue Moon Metals Inc. |
Reasonable prospects of eventual economic extraction assume underground mining of the deposit, surface mill processing and production of zinc concentrates and copper concentrates. Mineral Resources are reported at a Zinc Equivalent Percent (ZnEq %) cutoff grade of 2.9% (Table 1.2).
Table 1.2
Blue Moon Mineral Resource Estimate, Effective as of December 24, 2024
at a Cutoff Grade of 2.9% ZnEq
| Tons > | Grade Above Cutoff | Contained Metal | |||||||||||||||||||||||||||||||||||||||||||||||||
| ZONE | Cutoff | Zn % | Cu % | Pb % | Ag Oz/Ton | Au Oz/Ton | ZnEq % | Zn Mlbs | Cu Mlbs | Pb Mlbs | Ag MOz | Au Moz | |||||||||||||||||||||||||||||||||||||||
| Indicated | Main | 3,073,000 | 5.90 | 0.78 | 0.16 | 1.14 | 0.04 | 12.66 | 362.76 | 47.94 | 10.08 | 3.51 | 0.11 | ||||||||||||||||||||||||||||||||||||||
| East | 498,000 | 6.64 | 0.47 | 0.63 | 3.72 | 0.09 | 18.99 | 66.15 | 4.67 | 6.29 | 1.85 | 0.04 | |||||||||||||||||||||||||||||||||||||||
| West | 78,000 | 4.41 | 0.62 | 0.33 | 0.93 | 0.03 | 9.50 | 6.91 | 0.97 | 0.52 | 0.07 | 0.00 | |||||||||||||||||||||||||||||||||||||||
| All Zones | 3,650,000 | 5.97 | 0.73 | 0.23 | 1.49 | 0.043 | 13.46 | 435.83 | 53.59 | 16.90 | 5.43 | 0.159 | |||||||||||||||||||||||||||||||||||||||
| Inferred | Main | 3,261,000 | 5.68 | 0.52 | 0.23 | 1.15 | 0.04 | 11.41 | 370.27 | 33.65 | 14.74 | 3.76 | 0.11 | ||||||||||||||||||||||||||||||||||||||
| East | 994,000 | 5.04 | 0.59 | 0.56 | 2.43 | 0.07 | 15.49 | 100.11 | 11.80 | 11.20 | 2.42 | 0.07 | |||||||||||||||||||||||||||||||||||||||
| West | 173,000 | 1.98 | 0.73 | 0.22 | 0.40 | 0.02 | 6.28 | 6.84 | 2.52 | 0.74 | 0.07 | 0.00 | |||||||||||||||||||||||||||||||||||||||
| All Zones | 4,428,000 | 5.39 | 0.54 | 0.30 | 1.41 | 0.043 | 12.12 | 477.22 | 47.97 | 26.68 | 6.25 | 0.190 | |||||||||||||||||||||||||||||||||||||||
Notes:
| (1) | Scott Wilson, CPG, President of RDA is responsible for this mineral resource estimate and is an independent Qualified Person as such term is defined by NI 43-101. |
| (2) | Reasonable prospects of eventual economic extraction were assessed by enclosing the mineralized material in the block model estimate in 3D wireframe shapes that were constructed based upon geological interpretations as well as adherence to a minimum mining unit with geometry appropriate for underground mining. |
| (3) | The cutoff grade of 2.9% ZnEq considered parameters of: |
| a. | Metal selling prices: Au-US$2,200/oz, Ag-US$27/oz, Cu-US$4.25/lb., Pb-US$0.90/lb., Zn-US$1.25/lb. |
| b. | Recoveries of Au 86.2%, Ag 94.3%, Cu 93.1%, Pb 0%, Zn 95.3%. |
| c. | Costs including mining, processing, general and administrative (G&A). |
| (4) | Zinc Equivalent Grade (“ZnEq”) is estimated by the formula: |
ZnEq = Zn% + ((Cu% * 78.20)+(Pb% * 0)+(Ag opt * 25.46)+(Au opt * 1896.40))/23.83.
| (5) | Mineral resources are not mineral reserves and do not have demonstrated economic viability. |
| (6) | Figures may not add up due to rounding. |
| (7) | Tonnages shown in Table 1.2 are short tons. |
| (8) | The QP knows of no other legal, political, environmental, or other risks that could materially affect the potential development of the mineral resources for the Project. |
| 1.8 | Mineral Reserve Estimate |
No current mineral reserve estimate has been established on the Property.
| 1.9 | MINING |
This PEA is preliminary in nature. It includes Inferred Mineral Resources that are considered too speculative geologically to have the economic considerations applied to them that would enable them to be categorized as mineral reserves, and there is no certainty that the PEA will be realized. Mineral Resources that are not Mineral Reserves do not have demonstrated economic viability.
| Blue Moon Mine | 7 | March 2025 |
| |
Blue Moon Metals Inc. |
This PEA utilizes the Mineral Resource described in Section 14 and only those portions of the Mineral Resource that fall within the constraints defined by underground parameters of the PEA are used to inform the Project economics.
The mining method selection was largely guided by the results of the Mineable Shape Optimizer (MSO) analysis, which evaluated various stoping methods and sizes based on economic and operational parameters. The MSO process assessed multiple configurations, including longhole stoping and cut-and-fill methods. As a result of this analysis, a stope height of 80 ft, using a $75/ton NSR cutoff, was selected as the basis for the mine design as this maximises resource recovery, limits excessive sustaining capital requirements (level development), and provides the highest relative operating margin compared to the other cases considered.
The mine will be accessed through a ramp system designed with a nominal grade of 13%, reaching a maximum of 15% in some sections. The initial portal and decline will provide access for exploration drilling and be utilized once the mine moves into production as the main haulage route. The layout separates the deposit into North and South mining zones to minimize level development and provide additional mine sequencing flexibility. The decline is positioned to first access the North Zone, prioritizing thicker, higher-grade levels in the mine.
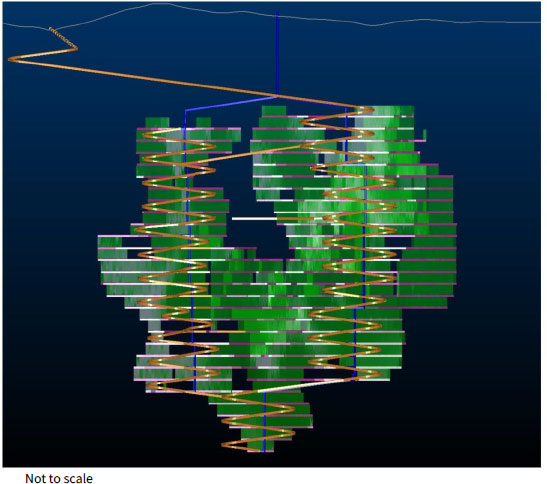
Mining levels will be spaced at 80-ft vertical intervals, with mining fronts consisting of 5 or 6 levels grouped together. Each level will include essential infrastructure such as truck load-out areas, electrical substations, and dewatering sumps. The primary decline will serve as the main haulage route, with additional accesses developed as mining advances. Allowances were added (5% for ramp, 20% for level development) to account for remucks and infrastructure cutouts (Figure 1.2).
The production schedule was created in Datamine’s Enhanced Production Scheduler (EPS) software, using benchmark development rates observed on recent projects. The initial decline advances to the main fresh air intake raise, before continuing to the north and beginning the north spiral ramp to the first mining front.
Separate level development crews are assigned to handle level and ventilation accesses, as well as ore sill drives. Stopes are scheduled by linking dependencies between designed stope shapes, in a Primary-Primary retreat sequence to the level access. Additional dependencies were added to the schedule to ensure ventilation breakthroughs are complete in advance of production on a level. The dedicated ramp resource crew advances to the next mining front. Overall production is targeted at 2,000 tons per day. Mining fronts were prioritized by grade and size to aid in early revenue generation.
The underground mining fleet will include a combination of development and production equipment. The development fleet will consist of jumbo drills, bolters, load-haul-dump (LHD) machines, and scissor decks for support infrastructure installation. The production fleet will include 42 tonne haul trucks, longhole drills, and 6-yard LHDs for material movement.
Workforce estimates were created based on the mine schedule, assuming 2-12 h shifts, with a 4-shift rotation. Mine technical and administrative staff and certain fixed plant maintenance personnel were assumed to work 5-d weeks, day shift only. Peak salaried and hourly-waged personnel requirements are 61 and 160 people, respectively.
Provision has been made in the design for mine services including dewatering, electrical distribution, communications and safety, refuge chambers, and compressed air.
| Blue Moon Mine | 8 | March 2025 |
| |
Blue Moon Metals Inc. |
Figure 1.2
Mine Design Model View Looking West
| 1.10 | PROCESSING |
The processing facility has been designed to treat 657,000 tonnes per year. Mineralization will be received from the underground mine at the process site which comprises the following areas:
| • | Crushing Plant. |
| • | Crushed Ore Handling and Storage. |
| • | SAG and Ball Mill Grinding Circuit. |
| • | Flotation Circuits: |
| ○ | Copper Flotation. |
| ○ | Zinc Flotation. |
| ○ | Pyrite Flotation. |
| • | Concentrate Handling by means of thickening, filtration and loading for copper, zinc and pyrite concentrates. |
| • | Tailings Handling by means of thickening, filtration and preparing for paste and dry stack storage. |
| • | Paste Backfill Plant. |
| • | Reagents Handling and Storage. |
| • | Plant Services. |
| Blue Moon Mine | 9 | March 2025 |
| |
Blue Moon Metals Inc. |
The mineral processing operation shall begin when the haul trucks from the underground mine deliver the ore to the primary crusher station. The ore will be crushed and conveyed to a stockpile where it will be reclaimed and transported to the main mill building. The crushed ore will be sufficiently reduced in size in the grinding circuit to liberate the desired minerals. Downstream, the flotation circuits shall selectively recover the target minerals for each type of concentrate. Dedicated thickeners shall densify each slurry stream and recover the overflow water for re-use in the process, while the thickened slurry will be further dewatered through dedicated filter presses. Concentrates and tailings shall all be handled as filter cakes.
Copper and zinc concentrates shall be collected from the storage stockpile located below the filter presses and loaded onto a hopper and conveyor system which will be used to load the concentrate within a lined rectangular shipping container. Pyrite and tailings filter cake shall be conveyed by means of conveyors to a paste backfill mixer. The mixer shall blend the filtered tailings with additional water and a binder into a paste which will then be pumped to the to the underground mine by means of a piping network
| 1.11 | INFRASTRUCTURE |
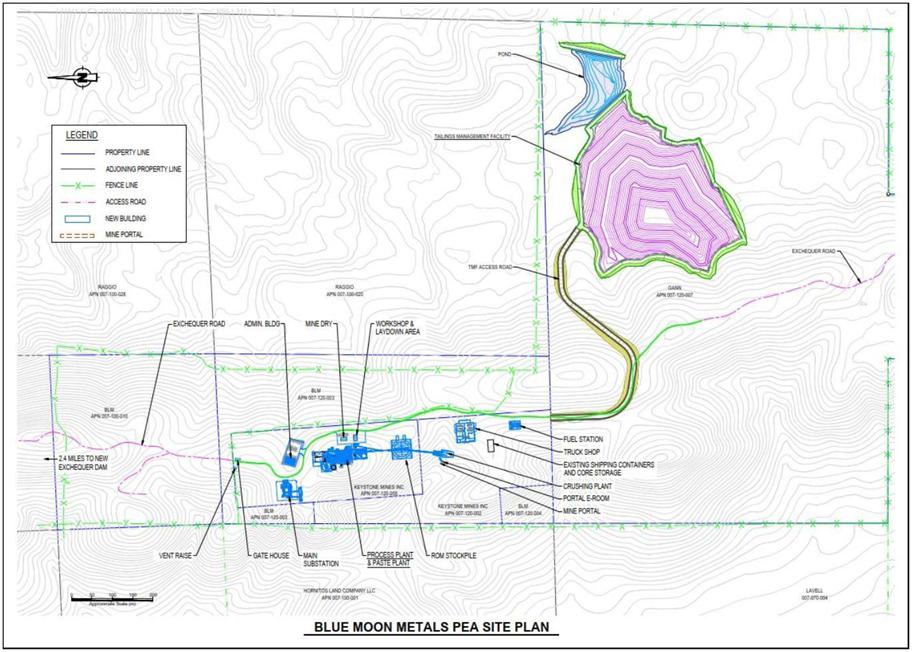
The infrastructure of this Project is designed to support the operation of a processing plant and production from the underground operation. The mine and processing plant will operate on a nominal 24 h/day, 7 days/week schedule to achieve an average throughput of 1,800 tonne/day. The proposed general arrangement for the mine site is presented in Figure 1.3.
Figure 1.3
Blue Moon General Arrangement
| Blue Moon Mine | 10 | March 2025 |
| |
Blue Moon Metals Inc. |
Infrastructural elements considered in the PEA include access roads, on-site haulage and service roads, power supply from the neighbouring hydro-electric dam, process- , fresh-, and potable water supplies, fuel storage facilities and on-site workshops, mine dry (change-house) and gatehouse and offices for administration, technical services, etc.
The average daily requirement for make-up water will be 75,529 gallons. To the extent possible, this will likely be obtained from wells sunk in the area of the mine. However, additional hydrogeological studies will be required to confirm the adequacy of borehole supply capacity.
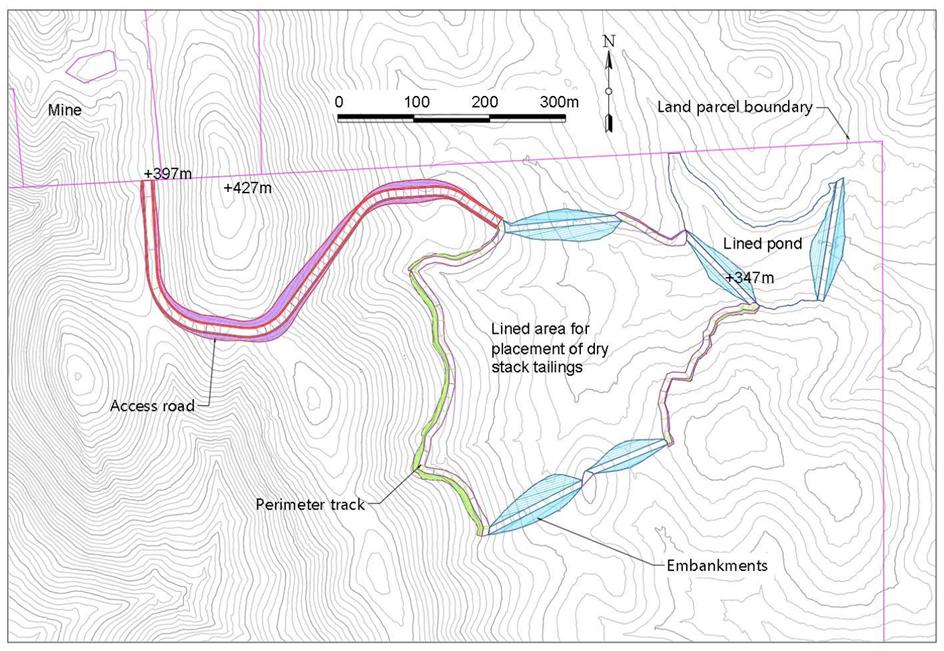
Tailings from the flotation plant will be thickened using a conventional underflow system and then be further dewatered using a filter press to produce a “dry” cake comprising approximately 90% solids by weight. The daily production of tailings will be approximately 1,800 tonnes, dry mass. In due course, a proportion of the filter cake tailings will be combined with a suitable binder and water to form a paste for backfilling completed underground workings. A Tailings Management Facility comprising a dry stack, water pond and access routes, will be located on 40 acres of the Gann land. Within this area, the dry stack area will occupy 31 acres, with the remaining land accommodating the pond and access road. The stack and pond will be located in a shallow valley on the eastern side of the Bullion Hill ridge, as indicated in Figure 1.4.
Figure 1.4
TMF General Arrangement
| Blue Moon Mine | 11 | March 2025 |
| |
Blue Moon Metals Inc. |
| 1.12 | ENVIRONMENTAL STUDIES, PERMITTING AND SOCIAL OR COMMUNITY IMPACT |
Development activities on the Property are subject to various federal, state, and local laws and regulations. The environmental effects of proposed development activities will be evaluated by the US Bureau of Land Management and the Mariposa County Planning Department in accordance with the National Environmental Policy Act (NEPA) and the California Environmental Quality Act (CEQA). Various federal and state environmental laws and regulations will also apply to proposed development activities on the Property. In addition to compliance with all applicable Federal, State and County legal requirements, Blue Moon intends to develop the Project in general alignment with good international industry practice (GIIP).
The legal framework surrounding mining activities in California is comprehensive and environmental standards are high. The associated environmental permitting process, which is yet to commence, can therefore be extensive and time-consuming.
BMM holds the mineral rights to the Blue Moon VMS deposit through its wholly owned subsidiary, Keystone Mines Inc. The mineral and property rights cover a total land area of 494.25 acres and comprise three distinct land tenure components.
Technical studies were undertaken in the 1980s and 1990s under previous management of the Property. These studies provide an indication of baseline conditions in the Project area at the time and can be used to inform the approach to future studies. The previous baseline studies did not identify any significant barriers to Project development. However, it is important to note that they were undertaken on a different project design (e.g., a vertical shaft instead of a ramp decline) and will require updating.
The Project is situated within the lower western foothills of the Sierra Nevada mountain range within the watershed of the Merced River. Previous studies indicated that the types of wildlife likely to be present were considered typical of the region and not at significant risk from mining activities. None of the sites of archaeological interest found during previous studies correspond with the footprint of the current Project design.
The nearest settlement to the Project is the small town of Hornitos, located approximately 4.5 miles south. The Project site was historically mined as part of the Californian Gold Rush. There are active mining operations in the region, and good transport connections.
A full review of the potential environmental and social impacts will be undertaken as the Project advances. Based on the current Project design, location, and an understanding of metal mining operations in similar environments, the main potential risks associated with operations of this nature include natural hazards, disturbance from air quality, noise, vibration and artificial lighting, impacts on water flow and water quality, impacts on biodiversity mainly through loss of habitat, and risks to groundwater from tailings. However, socio-economic impacts are considered to be positive. Potential environmental and social risks and impacts are considered typical of similar exploration and mining operations in North America, and any potential impacts can be managed appropriately.
Responsible closure planning will be integrated into all phases of the Blue Moon Project and undertaken in compliance with Federal and California State legislative requirements and GIIP. A detailed closure plan and cost estimate has not yet been developed but an indicative amount of US$15 million has been budgeted.
| Blue Moon Mine | 12 | March 2025 |
| |
Blue Moon Metals Inc. |
| 1.13 | PROJECT ECONOMICS |
This PEA is preliminary in nature. It includes Inferred Mineral Resources that are considered too speculative geologically to have the economic considerations applied to them that would enable them to be categorized as mineral reserves, and there is no certainty that the PEA will be realized. Mineral Resources that are not Mineral Reserves do not have demonstrated economic viability.
Micon’s QP prepared the economic analysis of the Project on the basis of a discounted cash flow model, from which Net Present Value (NPV), Internal Rate of Return (IRR) and payback period can be determined. Assessments of NPV are generally accepted within the mining industry as representing the economic value of a project after allowing for the cost of capital invested.
All results are expressed in United States dollars ($ or US$) except where stated otherwise. Conservatively, an exchange rate of CAD 1.35/US$ has been applied where required for conversion of cost inputs whereas, at the effective date of this report, the spot rate was approximately CAD 1.45/US$.
Cost estimates and other inputs to the cash flow model for the Project have been prepared using constant, first quarter 2025 money terms, i.e., without provision for escalation or inflation.
Project revenues will be generated from the sale of zinc and copper concentrates, with credits for gold and silver content. The Project has been evaluated using constant metal prices of US$4.20/lb copper, US$1.25/lb zinc, US$2,200/oz Au and US$27/oz Ag. No credit or penalty has been applied for lead or any other by-product content in concentrates. These price assumptions are supported by the 10-year price history of each metal presented in Section 19. The sensitivity of the Project to changes in price assumptions has been tested 10% above and below base case values and using both spot (February 2025 market average prices) and consensus price forecasts.
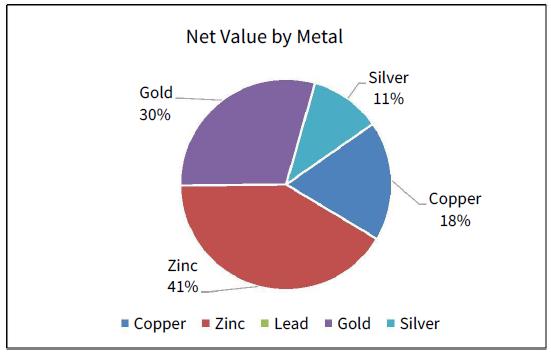
Figure 1.5 shows the relative contribution of each metal to NSR value of the saleable concentrates.
Figure 1.5
NSR Value by Metal
| Blue Moon Mine | 13 | March 2025 |
| |
Blue Moon Metals Inc. |
The capital expenditure (CAPEX) estimate for this Preliminary Economic Assessment (PEA) has been developed using a combination of budgetary quotes from vendors, historical pricing from comparable projects, and parametric calculations based on similar equipment and infrastructure. Cost elements have been refined and itemized to enhance confidence in the estimate. However, the overall accuracy remains within the expected range for a PEA-level study. The approach ensures a robust and well-supported cost estimate while maintaining alignment with the early-stage nature of the assessment.
Table 1.3 summarises the initial, sustaining and total LOM capital costs for the Project, in addition to which a provision of US$15 million has been made for mine closure and rehabilitation costs.
Table
1.3
LOM Capital Cost Estimate
| Area | Initial US$ M | Sustaining US$ M | LOM Total US$ M | ||||||
| Mining | 18.4 | 10.0 | 28.4 | ||||||
| Processing | 55.0 | 42.8 | 97.7 | ||||||
| Infrastructure | 26.7 | 11.7 | 38.4 | ||||||
| Sub-Total Direct Costs | 100.1 | 64.5 | 164.5 | ||||||
| Indirect | 15.9 | 0.0 | 15.9 | ||||||
| Contingency | 28.5 | 0.0 | 28.5 | ||||||
| Total Capital Costs | 144.5 | 64.5 | 209.0 |
The operating costs have been estimated from first principals and in each area of the operating cost estimate, labour costs are based on the proposed headcount, estimated salary and burden for each position.
Table 1.4 provides a summary of the estimated life-of-mine (LOM) PEA operating costs.
Table 1.4
LOM Operating Cost Estimate
| Area | LOM Average (US$/t) | LOM Cost US$’000 | ||||
| Mining | 75.02 | 503,709 | ||||
| Processing | 36.11 | 242,453 | ||||
| E/S and G&A | 5.10 | 34,239 | ||||
| Total Direct Costs | 116.24 | 780,401 | ||||
| Selling Costs | 22.30 | 149,740 | ||||
| Royalties | 0.35 | 2,350 | ||||
| Total Operating Costs | 138.89 | 931,991 |
Table 1.5 presents some key statistics for the Blue Moon Mine base case economic assessment.
| Blue Moon Mine | 14 | March 2025 |
| |
Blue Moon Metals Inc. |
Table 1.5
Base Case: Key Statistics
| Item | Units | Value | ||||
| Nominal Processing Capacity | tonnes per day | 1,800 | ||||
| LOM Total Processed | ‘000 tonnes | 6,714 | ||||
| Zinc Equivalent Grade Processed | % ZnEq | 12.55 | ||||
| Net Smelter Return | US$/tonne treated | 246.00 | ||||
| Copper | 000’lbs | 7,237 | ||||
| Zinc | 000’lbs | 62,260 | ||||
| Average Annual Payable | Gold | oz | 22,566 | |||
| Production (LOM) | Silver | oz | 681,784 | |||
| ZnEq | 000’lbs | 151,046 | ||||
The average C1 cash cost over the LOM is estimated at US$0.60/lb zinc equivalent. Including sustaining and mine closure expenses, the average All-in Sustaining Cost (AISC) over the LOM is estimated at US$0.66/lb zinc equivalent and, including initial capital, the average All-in Cost (AIC) over the LOM is estimated at US$0.77/lb zinc equivalent.
A chart summarising the LOM annual cash flow projection for the base case is given in Figure 1.6.
Figure 1.6
Annual Cash Flow Projection
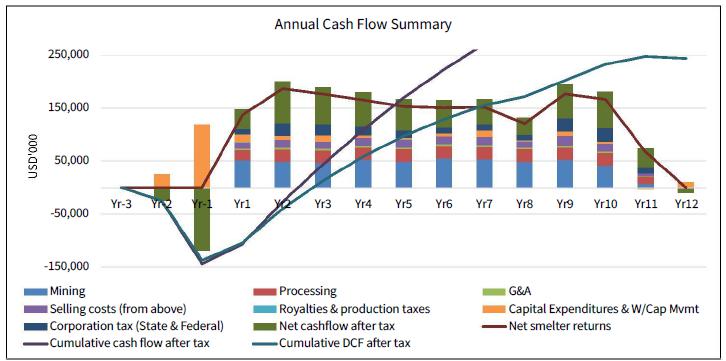
The base case cash flow equates to a pre-tax IRR of 48% and a net present value at an 8% annual discount rate (NPV8) of US$354 million before tax. After-tax base-case cash flows provide an IRR of 38% and evaluate to NPV8 of US$244 million. After-tax undiscounted payback is achieved in approximately 2 .8 years.
| Blue Moon Mine | 15 | March 2025 |
| |
Blue Moon Metals Inc. |
Micon has tested the sensitivity of the base case NPV8 and IRR to changes in prices (which may also be used as a proxy for ore grades and recoveries), as well as operating costs and capital expenditures. The Project is most sensitive to changes in product prices with a 30% reduction resulting in a near-zero NPV8. A 30% increase in operating and capital costs reduce NPV8 to US$144 million and US$155 million, respectively, showing the Project to be relatively insensitive to either factor alone.
Table 1.6 compares the key economic results for metal prices 10% lower and higher than the base case, as well as at long-term consensus prices forecast in 2024 and average spot prices observed in February, 2025.
Table
1.6
Detailed Metal Price Sensitivity
| Parameters | PEA Base Case | -10% Pricing | +10% Pricing | Long-Term Consensus Forecast | Spot Prices Average. 2025-02 | ||||||||||||||||
| Copper US$/lb | 4.20 | 3.78 | 4.62 | 4.75 | 4.23 | ||||||||||||||||
| Zinc US$/lb | 1.25 | 1.13 | 1.38 | 1.26 | 1.27 | ||||||||||||||||
| Metal Prices Assumed | Gold US$/oz | 2,200 | 1,980 | 2,420 | 2,181 | 2,895 | |||||||||||||||
| Silver US$/oz | 27.00 | 24.30 | 29.70 | 26.16 | 32.18 | ||||||||||||||||
| After-Tax NPV (US$ M, 8% Discount Rate) | $ | 244 | $ | 163 | $ | 324 | $ | 260 | $ | 340 | |||||||||||
| After-Tax IRR (%) | 38 | % | 29 | % | 46 | % | 39 | % | 48 | % | |||||||||||
| First 6 Years of After-Tax Cashflow (US$ M) | $ | 367 | $ | 293 | $ | 442 | $ | 382 | $ | 458 | |||||||||||
| Payback Period (Years) | 2.4 | 2.9 | 2.0 | 2.3 | 1.9 | ||||||||||||||||
| C1 Cost (US$/lb ZnEq) | $ | 0.60 | $ | 0.60 | $ | 0.61 | $ | 0.60 | $ | 0.55 | |||||||||||
| LOM Average Head Grade (ZnEq %) | 12.55 | 12.66 | 12.47 | 12.72 | 13.83 | ||||||||||||||||
| 1.14 | INTERPRETATIONS AND CONCLUSIONS |
| 1.14.1 | Geological Setting, Exploration, and Resources |
The Blue Moon Project exhibits a typical volcanogenic massive sulphide (VMS) system with mineralization enriched in zinc, copper, lead, gold, and silver. Current drilling defines mineralization extending over 900 m in strike length and to depths of approximately 300 m. Recent exploration programs successfully expanded and confirmed mineralized zones, highlighting considerable potential for resource growth through continued exploration drilling. Updated resource estimates indicate substantial Indicated Resources of 3.7 million tons grading 13.46% zinc equivalent and Inferred Resources of 4.4 million tons grading approximately 12.12% zinc equivalent.
| 1.14.2 | Mining Methods and Infrastructure |
The recommended underground longhole retreat mining method is appropriate for the Blue Moon deposit, offering safe and efficient extraction at planned production levels. Infrastructure plans, including processing facilities, road enhancements, and tailings management, require detailed engineering but are considered achievable and within industry standards.
| Blue Moon Mine | 16 | March 2025 |
| |
Blue Moon Metals Inc. |
| 1.14.3 | Metallurgy and Processing |
Metallurgical tests confirm effective and robust recovery rates using conventional flotation and gravity separation methods, achieving approximately 95% recovery for zinc, 93.1% for copper, and significant recoveries for lead, silver, and gold. The testing validated that concentrates produced meet or exceed industry-standard specifications for marketability, providing strong support for the economic and technical feasibility of the proposed processing techniques. Further optimization during feasibility studies is recommended to refine and optimize processing parameters.
| 1.14.4 | Environmental, Permitting, and Social Impact |
The Project is expected to have a positive social impact. An initial review of environmental risks indicates that any potential environmental impacts can be managed through appropriate engineering controls, implementation of an environmental and social management system, and adequate resources for technical staff and monitoring equipment/analysis. Specific permitting requirements will need to be confirmed with Mariposa County as the Project advances.
| 1.14.5 | Capital and Operating Costs |
Preliminary capital cost estimates for the Blue Moon Project are approximately US$209 million (LOM), inclusive of mine development, processing plant construction, and necessary infrastructure improvements. In addition, a provision of US$15 million is made for mine closure and rehabilitation.
Total operating costs are estimated at approximately US$138.89 per tonne milled. More detailed engineering studies are recommended to further refine these estimates, optimize project economics, and reduce uncertainties associated with early-stage assessments.
| 1.14.6 | Economic Analysis |
This PEA is preliminary in nature. It includes Inferred Mineral Resources that are considered too speculative geologically to have the economic considerations applied to them that would enable them to be categorized as mineral reserves, and there is no certainty that the PEA will be realized. Mineral Resources that are not Mineral Reserves do not have demonstrated economic viability.
The base case cash flow projection displays positive economic returns, supporting the potential viability of the plant-feed material included in the LOM production forecast.
| 1.15 | RECOMMENDATIONS |
The following recommended work program adopts a two-phased approach to the further development of the project. BMM intends to construct an exploration decline to access a broader portion of the mineral deposit. Drilling of the deposit from underground offers technical and cost benefits over surface drilling; therefore, development an exploration decline is recommended. BMM must obtain permits prior to construction of the decline. Phase 1 of the work program includes the steps necessary to obtain the required permitting for construction. Phase 1 culminates with the decision to advance to Phase 2; the construction of the exploration decline. Sections 26.1 and 26.2 describe the work program phases in detail.
| Blue Moon Mine | 17 | March 2025 |
| |
Blue Moon Metals Inc. |
| 1.15.1 | Phase 1: Planning, Hiring and Permitting |
Following the completion of the PEA, BMM plans to initiate permitting for the development of an exploration decline which, by providing underground access, will allow more efficient exploration core drilling as well as facilitating the geotechnical, hydrogeological, and metallurgical studies which are to be carried out in Phase 2.
Concurrently, Blue Moon intends to expand its team by recruiting additional California-based staff to manage the project’s continued development.
It is recommended that BMM complete the ongoing collation and digitization of paper records from previous work on the Property as a guide to future exploration and development work.
To the extent possible, core from earlier drill programs not already stored securely should also be preserved and examined to provide geological and geotechnical data relevant to the Project.
| 1.15.2 | Phase 2: Exploration Decline Development and Further Studies |
| 1.15.2.1 | Exploration Decline Development |
Upon finalizing the permitting process for the exploration decline, BMM intends to tender and award a construction contract for its development. The decline’s construction is anticipated to take around one year and will support underground exploration and geotechnical drilling, reducing both surface disturbance and drilling costs. Additionally, the decline will be designed for dual functionality, serving as the primary access and haulage way once the mine is in operation. It is projected to extend to a depth of approximately 1,000 feet below the surface.
| 1.15.2.2 | Geology and Exploration |
The Blue Moon mineralization remains open along strike to the south and at depth. A program of exploration drilling is suggested in order to improve confidence in the resource estimate, aimed at bringing at least part of the Inferred Resource into the Indicated category. That drilling would permit geotechnical logging of the core and generate fresh samples on which to conduct metallurgical testwork. As proposed, therefore, Phase 2 includes an exploration drilling program comprising 13 holes totaling 10,650 m, to be conducted from the decline described above. Beyond mineral resource expansion, the program aims to improve understanding of underground geotechnical conditions to refine assumptions regarding stope spans, backfill strength and mining dilution, providing critical data for future mine planning efforts.
| 1.15.2.3 | Hydrogeological Fieldwork |
Pump-testing of existing boreholes should be used to confirm their adequacy as a source of make-up water for the proposed process plant. Additional hydrogeological field work will be conducted to better define mine dewatering requirements during mine operation.
| Blue Moon Mine | 18 | March 2025 |
| |
Blue Moon Metals Inc. |
| 1.15.2.4 | Metallurgical Testwork |
Metallurgical testwork on representative composite samples of fresh core should be undertaken to (a) confirm the process design criteria currently based on results of earlier testwork; (b) establish whether barite, gypsum, and/or pyrite can be recovered economically; (c) investigate the occurrence of gallium, germanium and indium in the concentrates. Drill core from the exploration drilling program will be used for this purpose, and the testwork should include:
| • | Pre concentration amenability tests to investigate upgrading of the mineralization and the potential to extract barite and /or gypsum before grinding. |
| • | Detailed mineralogical characterization studies. |
| • | Deportment studies for gold, silver and potential critical metals, such as gallium, germanium and indium. |
| • | Hardness and comminution tests. |
| • | Additional gravity testwork. |
| • | Further flotation optimization batch tests followed by locked cycle tests. |
| • | Tailings characterization studies. |
Based on the additional testwork described above, the process flowsheet and equipment sizing may be refined, and the location of the plant and ancillary services may be optimized to minimize capital and operating costs and improve the quality of concentrates produced.
| 1.15.2.5 | Environmental and Social |
Recommendations considered important for ongoing development of the Project include the following:
| 1. | Update all baseline studies and undertake additional surveys and testwork to ensure comprehensive understanding of environmental and social conditions. Particular attention should be paid to geochemical properties, seasonal differences in water bodies and biodiversity (migratory birds and mammals), potential nesting sites for birds of prey, and socio-economic conditions. |
| 2. | Demarcate any known cultural heritage sites and design infrastructure and access routes to avoid them, in collaboration with regulatory authorities. |
| 3. | Communicate with regulatory authorities and other relevant stakeholders to better determine the presence/absence of threatened/protected species and potential migration routes for mammals and birds. |
| 4. | Consider installing basic monitoring infrastructure, such as a weather station and groundwater monitoring boreholes to support ongoing baseline data collection. |
| 5. | Ensure all stakeholder interactions, including informal meetings, are documented and filed to assist the community relations and communications teams in future should the Project proceed to an operational mine. |
| 6. | Integrate sensitive/protected areas into the GIS used by the exploration team, to minimize the risk for damage, for example cultural heritage sites and known wildlife habitats. |
| 7. | Ensure all future exploration drill holes are properly closed up, to minimize land disturbance and avoid future problems with water connectivity. Establish a formal procedure for this and ensure the closure of all drill sites is properly documented. |
| Blue Moon Mine | 19 | March 2025 |
| |
Blue Moon Metals Inc. |
| 8. | Regularly review the project design, to adapt to emerging environmental and social risks and incorporate the latest available technologies for energy efficiency and environmental protection. |
| 1.15.2.6 | Feasibility Study |
The results of the Phase 2 field work programs will inform a Feasibility Study (“FS”) undertaken to refine the Project’s economic and technical parameters, reduce project risks, and enhance resource confidence, while supporting permitting efforts. Upon completion of a FS, a formal construction decision will be made by the BMM board of directors.
| 1.15.3 | Work Program |
A provisional budget estimate for the proposed work program is outlined in Table 1.7.
Table 1.7
Blue Moon Recommended Work Programs
| Activity | Amount (US$’000) | ||
| Phase 1 | |||
| Permitting of Exploration Decline | 500 | ||
| Digitization of drill logs and other paper records | 25 | ||
| Relogging and preservation of historical core | 45 | ||
| Hiring of California-based project development team | 230 | ||
| Exploration decline design, tender & award | 200 | ||
| Phase 1 work program subtotal | 1,000 | ||
| Phase 2 | |||
| Exploration portal construction and decline development (underground) | 21,635 | ||
| Exploration drilling, logging, surveys and assaying | 3,730 | ||
| Hydrogeological field work | 120 | ||
| Metallurgical testwork program on fresh core | 600 | ||
| Environmental testwork and monitoring, social studies | 500 | ||
| FS and updated Technical Report | 2,500 | ||
| Phase 2 work program subtotal | 29,085 | ||
| Total | 30,085 |
| Blue Moon Mine | 20 | March 2025 |
| |
Blue Moon Metals Inc. |
2.0 INTRODUCTION
Blue Moon Metals Inc. (BMM), holds the mineral rights to the Blue Moon volcanogenic massive sulphide (VMS) deposit (Blue Moon, or the Property) in central California through its wholly owned subsidiary, Keystone Mines Inc. The deposit is known to contain zinc, copper, lead, gold and silver within sulphide minerals that might be processed into saleable concentrates. The deposit is also known to contain gallium, germanium, and barite, which are recommended to be investigated further in a future study as to their potential economic viability.
After acquiring the Blue Moon Property, BMM consolidated the exploration information from previous owners and participants including Hecla Mining Co., Colony Pacific, Westmin, and Lac Minerals and, in November, 2018, published a mineral resource estimate (MRE) prepared by Gary Giroux P.Eng. and Lawrence O’Connor, RM-SME.
BMM itself carried out three separate drilling programs between 2018 and 2021 and, in October, 2023, published a Technical Report disclosing an updated mineral resource estimate (MRE) for the Blue Moon Property. That report was authored by Dr. Thomas A. Henricksen, CPG and Scott Wilson, CPG, the latter of Resource Development Associates Inc. (RDA). There has been no further exploration carried out on the Property since then.
In October, 2024, BMM retained RDA and Micon International Limited (Micon) to update the MRE and prepare a Preliminary Economic Assessment (PEA) of the Blue Moon Property, respectively. That work has now been completed, and the results are presented in this Technical Report.
The qualified persons responsible for the preparation of this report are:
| • | Geology & Mineral Resource | Scott Wilson, C.P.G, RDA |
| • | Mining | Peter Szkilnyk, P.Eng. |
| • | Geotechnical, stope selection | Alan J. San Martin, P.Eng. |
| • | Metallurgy | Richard Gowans, P.Eng. |
| • | Process Plant, Infrastructure | Abel Obeso Muniz, P.Eng. |
| • | Economic Evaluation | Christopher Jacobs, CEng, MIMMM |
A site visit was undertaken on November 5 to 6, 2024 by Scott Wilson C.P.G. SME-RM, Christopher Jacobs CEng MIMMM and Alan J. San Martin, P.Eng., a senior mining engineer with Micon, working in conjunction with Peter Szkilnyk, P.Eng. During the site visit, sufficient opportunity was available to examine drill core from previous programs as well as conduct a general overview of the Property including selected drill sites and the condition of existing project infrastructure.
Based on his experience, qualifications and review of the site and resulting data, Scott Wilson is of the opinion that the programs have been conducted in a professional manner and the quality and quantity of exploration data and information produced from the efforts meet or exceed acceptable industry standards of that time. Much of the data has undergone thorough scrutiny by BMM staff as well as certain data verification procedures by MMTS (see Data Verification, Section 12). Sources of information are listed in the references, Item 27. The geologic discussions herein lean heavily on the information discussed in the Technical Report of 2018 authored by Giroux and O’Connor.
Neither RDA nor Micon has, nor has either previously had, any material interest in BMM or related entities or interests. The relationship with BMM is solely a professional association between the client and the independent consultants. This report is prepared in return for fees based upon agreed commercial rates and the payment of these fees is in no way contingent on the results of this report.
| Blue Moon Mine | 21 | March 2025 |
| |
Blue Moon Metals Inc. |
This report includes technical information which requires subsequent calculations or estimates to derive sub-totals, totals and weighted averages. Such calculations or estimations inherently involve a degree of rounding and consequently introduce a margin of error. Where these occur, Micon does not consider them to be material.
This report is intended to be used by BMM subject to the terms and conditions of its agreement with Micon. That agreement permits BMM to file this report with the CSA and applicable stock exchanges as an NI 43-101 Technical Report pursuant to provincial securities legislation. Except for the purposes legislated under provincial securities laws, any other use of this report, by any third party, is at that party’s sole risk.
The conclusions and recommendations in this report reflect the authors’ best judgment in light of the information available to them at the time of writing. The QPs, RDA, and Micon reserve the right, but will not be obliged, to revise this report and conclusions if additional information becomes known to them subsequent to the date of this report. Use of this report acknowledges acceptance of the foregoing conditions.
| 2.1 | UNITS OF MEASUREMENT AND ABBREVIATIONS |
All currency amounts are stated in United States dollars, unless otherwise stated. Quantities are stated either in metric units, the standard Canadian and international practice, including metric tonnes (t), kilograms (kg) and grams (g) for mass, kilometres (km) or metres (m) for distance, hectares (ha) for area, and grams per metric tonne (g/t) for gold and silver grades (g/t Au, g/t Ag) or in imperial measures including feet, inches, pounds and short tons (T, each of 2,000 pounds). Precious and base metal grades may be expressed in parts per million (ppm) or parts per billion (ppb) and their quantities may also be reported in troy ounces (ounces, oz), ounces per short ton (opt) for precious metals and in pounds (lbs) for base metals, a common practice in parts of the mining industry.
Table 2.1 provides a list of units and abbreviations that are used in this report.
Table 2.1
Units and Abbreviations
| Abbreviation | Name | Abbreviation | Name |
| $, US$, CAD | Dollar(s) US, Canadian | L | Litre(s) |
| % | Percent(age) | Lb, lbs | Pound(s) avoirdupois |
| < | Less than | m | Metre(s) |
| > | Greater than | M | Million(s) |
| ° | Degree(s) | Moz | Million ounces |
| °C | Degrees Celsius | Ma | Million years |
| 3D | Three-dimensional | Masl | Metres above sea level |
| Ag | Silver | mg | Milligram(s) |
| As | Arsenic | Micon | Micon International Limited |
| Au | Gold | mm | Millimetre(s) |
| AUP | Administrative Use Permit | MSO | Mineable Shape Optimizer |
| Bi | Bismuth | Mt | Million tonnes |
| BLM | US Bureau of Land Management | Mt/y | Million metric tonnes per year |
| BMM | Blue Moon Metals Inc. | km | Kilometre(s) |
| Blue Moon Mine | 22 | March 2025 |
| |
Blue Moon Metals Inc. |
| Abbreviation | Name | Abbreviation | Name |
| CCA | Cedar Creek Associates Inc. | MMTS | Moose Mountain Technical Services |
| CCR | California Code of Regulations | MND | Mitigated Negative Declaration |
| CEQA | California Environmental Quality Act | n.a. | Not available/not applicable |
| cfm | Cubic feet per minute | NAD | North American Datum |
| CIL | Carbon in leach | NEPA | National Environmental Policy Act |
| CIM | Canadian Institute of Mining, Metallurgy and Petroleum | NI 43-101 | Canadian National Instrument 43-101 |
| cm | Centimetre(s) | NOI | Notice of Intent |
| Conc. | Concentrate | NPV, NPV8 | Net present value, at 8% discount |
| CRIP | Complex resistivity | NSR | Net smelter return |
| CSA | Canadian Securities Administrators | ||
| Cu | Copper | opt | Ounces per short ton |
| d | Day (24 hours) | oz | Ounces (troy) |
| DEM | Digital elevation model | oz/y | Ounces per year |
| EA | Environmental Assessment | Pb | Lead |
| EIR | Environmental Impact Report | ppb | Parts per billion |
| EIS | Environmental Impact Statement | ppm | Parts per million |
| ELOS | Equivalent Linear Overbreak/Slough (Mining Dilution) | PRI | Principles for Responsible Investment |
| EP | Equator Principles | QA/QC | Quality Assurance/Quality Control |
| ESG | Environment, Social and Governance | ||
| F | Fluorine | RDA | Resource Development Associates Inc. |
| FLPMA | Federal Law Policy and Management Act | s | Second |
| ft, ft3 | Foot, feet (linear, cubic) | Sb | Antimony |
| g | Gram(s) | SEC | Securities and Exchange Commission |
| g/t | Grams per metric tonne | SEDAR | System for Electronic Document Analysis and Retrieval (https://sedarplus.ca) |
| gal | Gallons (US) | SG | Specific gravity |
| GIIP | Good International Industry Practice | SGMA | Sustainable Groundwater Management Act (California) |
| GIS | Geographic Information System | SI | Systeme International d’Unites |
| GISTM | Global Industry Standard for Tailings Management | SMARA | Surface Mining and Reclamation Act (California) |
| h | Hour | t | Tonne (metric) |
| ha | Hectare(s) | T | Short ton (2,000 lbs) |
| ICMC | International Cyanide Management Code | TC/RC | Treatment charge / Refining Charge applied by a buyer of concentrates |
| ICMM | International Council on Mining and Metals | TMF | Tailings Management Facility |
| ID3 | Inverse Distance Cubed | UNEP | United Nations Environment Program |
| IFC PS | International Finance Corporation Environmental and Social Performance Standards | USGS | United States Geological Survey |
| in | Inch(es) | UTM | Universal Transverse Mercator |
| IP | Induced polarization | WB EHS | World Bank Environmental, Health and Safety Guidelines |
| IRR | Internal rate of return | y | Year |
| IW | Intersected Width | Zn | Zinc |
| kg | Kilogram(s) | ZnEq | Zinc Equivalent - polymetallic rock value expressed in terms of zinc content |
| Blue Moon Mine | 23 | March 2025 |
| |
Blue Moon Metals Inc. |
3.0 RELIANCE ON OTHER EXPERTS
The Qualified Persons (QPs) responsible for preparation of this report are not experts in legal matters and offer no opinion as to the validity or status of the mineral titles claimed. The authors are required by NI 43-101 to include a description of the Property title, terms of legal agreements and related information in Section 4 of this report. In this respect, the QPs have relied on the title opinion of Dorsey & Whitney, LLP, dated December 18, 2024.
Section 20 of this report was prepared under the supervision of QP Christopher Jacobs, CEng MIMMM. Mr. Jacobs has relied upon the expertise of (i) Becky Humphrey, C.Env., MIMMM for the discussion of existing environmental conditions, potential liabilities and remediation, and (ii) Mr. Jordan Main of Compass Land Group and Mr. Martin P. Stratte of Hunton Andrews Kurth LLP for information relating to existing permits, future permitting requirements, and methods of obtaining those permits, as described in Sections 4 and 20 of this report and summarized in Sections 1 and 26. Accordingly, the environmental and permitting matters discussed herein are provided for information purposes only as required in terms of NI 43-101 and neither the QP nor Micon offers any opinion in this regard.
No other experts were relied upon in the preparation of this technical report.
All data used in this report were originally provided by BMM. RDA’s and Micon’s QPs have reviewed and analyzed data provided by BMM, its consultants and previous operators of the Property, and have drawn their own conclusions therefrom, augmented by direct field examination. The QPs have not carried out any independent exploration work, drilled any holes or carried out any sampling and assaying on the Property, other than a check sample obtained by, and analysed for, RDA.
While exercising all reasonable diligence in checking, confirming, and testing it, the QPs have relied upon BMM presentation of the Project data from previous operators and from BMM’s knowledge and experience of the Blue Moon Mine Project in formulating its opinion.
The descriptions of geology, mineralization, exploration, and previous mineral resource estimates are taken from reports prepared by various companies and/or their contracted consultants. The conclusions of this report rely on data available in published and unpublished reports by various companies that have previously conducted exploration and engineering studies on the Property, and information supplied by BMM, and the QPs have no reason to doubt its validity.
Most photographs presented in this report were taken by the QPs during their site visit. Some figures and tables are taken or derived from earlier reports about the Property and, where appropriate, the source is acknowledged below those items.
| Blue Moon Mine | 24 | March 2025 |
| |
Blue Moon Metals Inc. |
4.0 PROPERTY DESCRIPTION AND LOCATION
| 4.1 | GENERAL DESCRIPTION AND LOCATION |
The Blue Moon Project is located in eastern, central California along the eastern foothills of the Sierra Nevada Mountains. It is located at latitude 37°33’55 "N and longitude 120°15’22"W, approximately 120 miles south-southeast of San Francisco. The Project is in Mariposa County, California and is situated within Township 4 South, Range 16 East (T4S, R16E), sections 19 and 30, as referenced to the Mount Diablo meridian and baseline of Public Land Survey System (PLSS). The historic and collapsed Blue Moon mine workings are denoted on the Merced Falls 7.5 minute USGS topographic map by two shaft symbols plotted in the SE corner of section 19.
The town of Mariposa, located sixteen miles east of the Project, is the county seat, has a population of around 2,000 and a tourist-based economy relying heavily on visitors to Yosemite National Park. The town of Merced, with a population of around 80,000 inhabitants, is twenty-two miles to the southwest of Blue Moon and has a diverse economy related to large scale agriculture and is home to University of California Merced. The local community of Hornitos with a population of about 75 and minimal services is situated about 4.5 miles south of the Project.
Figure 4.1
Blue Moon Location Map
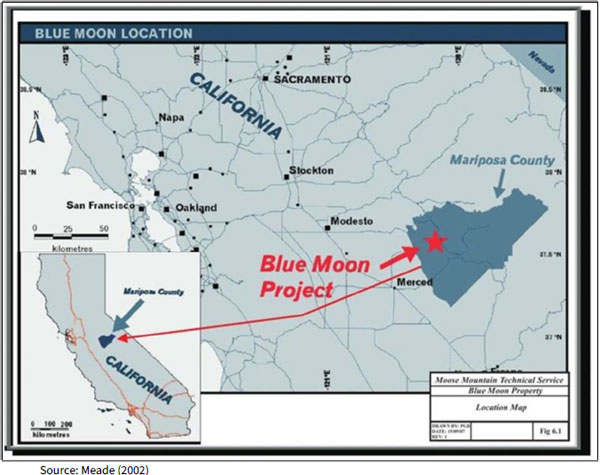
| Blue Moon Mine | 25 | March 2025 |
| |
Blue Moon Metals Inc. |
| 4.2 | Mineral Tenure |
The Blue Moon Property consists of three distinct land tenure components that cover 494.25 acres. These include:
| 1. | Two patented mineral claims (American Eagle, and Blue Bell & Bonanza) owned 100% by Keystone Mines Inc.; BMM owns the surface and subsurface rights here. |
| 2. | Eight federal lode claims (Red Cloud 1-8) held 100% by Keystone Mines Inc., BMM’s wholly owned US subsidiary which has the mineral rights pursuant to BLM claims. |
| 3. | 100% interest in the mineral rights from two Spanish Land Grants of the James Gann Jr. Trust of 1991, owned by Keystone Mines Inc. in conjunction with a surface rights lease agreement for 40 acres, pursuant to an option purchase agreement completed in 2001. |
Figure 4.2 shows the relative positions of the patented claims (blue), unpatented claims (red) and the private Gann land (green).
Table 4.1 (over) lists the current Blue Moon mineral claims and surface rights on private land.
Unpatented mining claim maintenance fees are current and paid through August 31, 2025.
The Property was previously owned by Westmin Mines, Inc., an Idaho corporation and subsidiary of Westmin Resources, Inc. On September 12, 2002, Westmin Resources was acquired by Expatriate Resources Ltd., now Yukon Zinc Corporation. The acquisition was subject to a purchase agreement with Boliden Westmin (Canada) Limited, whereby Expatriate acquired 100% interest in Westmin Resources, Inc. in return for the issuance of 3 million common shares and the granting of a 0.5% net smelter return royalty capped at US$500,000 to Boliden Westmin.
The subsidiary Westmin Mines, Inc. changed names to Keystone Mines, Inc, on October 25, 2002. In 2004, Expatriate transferred Keystone to Pacifica Resources Ltd., now EDM Resources Inc., through a Plan of Arrangement. Subsequently, in 2007, Pacifica through a Plan of Arrangement, transferred Keystone to Savant Explorations Ltd. Savant Explorations Ltd. changed names to Blue Moon Zinc Corp. on June 5, 2017 and changed its name to Blue Moon Metals Inc. on April 13, 2021. Currently the Blue Moon Property is controlled by Blue Moon Metals Inc. through its 100% ownership of the US subsidiary Keystone Mines, Inc., an Idaho Corporation.
In 2017, Northern Empire Resources Corp. (NM) through an agreement with Imperial Metals Corporation, acquired a 10% net profits interest (NPI) in the Blue Moon Project through the takeover of Imperial’s Sterling Mines subsidiary. The NPI is only to be paid after deducting all operating expenses, all pre-production expenditures dating back to May 14, 1996, and all post-production expenditures. A finance charge of Prime plus one-half of one percent is also to be deducted before any NPI is paid. The NPI was repurchased and extinguished by Keystones Mines Inc. in January 2018 through the issuance of 300,000 Blue Moon Metals Inc. common shares and the payment of US$20,000 cash to NM.
A Mineral Deed dated effective September 1, 2001, and recorded March 4, 2008, as Document No. 2080941, reserved to the James W. Gann, Jr. Trust of 1991, a 3% Net Smelter Returns (as defined in the deed) that in the aggregate was not to exceed US$200,000 on the lands included in the Gann Land.
In September 2020, Blue Moon Metals Inc. repurchased two separate 1% Net Smelter Returns (NSR) on the Blue Moon Project by paying each 1% NSR holder US$12,000 or US$24,000 in total.
| Blue Moon Mine | 26 | March 2025 |
| |
Blue Moon Metals Inc. |
Figure 4.2
Current Land Status at the Blue Moon Project
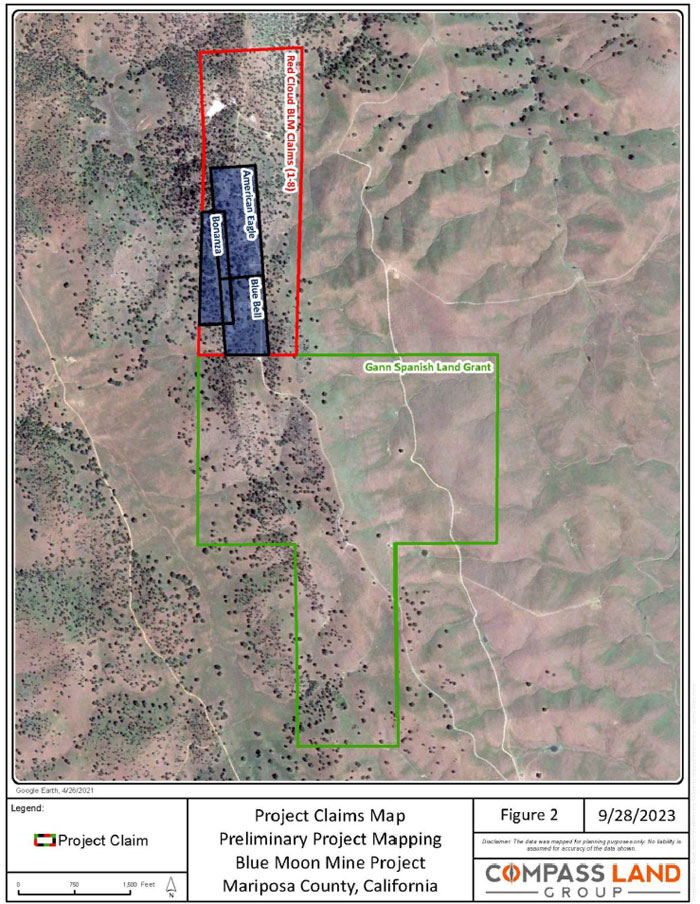
| Blue Moon Mine | 27 | March 2025 |
| |
Blue Moon Metals Inc. |
Table
4.1
Blue Moon Claims
| # | Claim Type | Status | Claim Reference # |
Claim Name |
Claim Size (Acres) |
Parcel Number (APN) |
Claim Owner |
Notes |
| Patented Claims | ||||||||
| 1 | Patented Mineral Claim | Active | MS 5719 | American Eagle | 20.67 | 007-120-005-0 | Keystone Mines Inc. | Patent No. 973403 dated January 28, 1926, covering Mineral Survey No. 5719, for the American Eagle lode mining claim, covering portions of Section 30, Township 4 South, Range16 East, MDM. |
| 2 | Patented Mineral Claim |
Active | M5718 | Blue Bell and Bonanza | 22.4 | 007-120-002-0 | Keystone Mines Inc. | Patent No. 959494, dated May 18, 1925, covering Mineral Survey No. 5718, for the Blue Bell and Bonanza lode mining claims, covering portions of Section 30, Township 4 South, Range 16 East, MDM. |
| BLM Land | ||||||||
| 3 | Unpatented Mining Claim (Federal Lode Claim) | Active | CA101349794 | Red Cloud #1 | 20.32 | 007-100-010-0 | Keystone Mines Inc. | Land administered by Bureau of Land Management (Federal Land) |
| 4 | Unpatented Mining Claim (Federal Lode Claim) | Active | CA101303528 | Red Cloud #2 | 20.66 | 007-100-010-0 | Keystone Mines Inc. | Land administered by Bureau of Land Management (Federal Land) |
| 5 | Unpatented Mining Claim (Federal Lode Claim) | Active | CA101300462 | Red Cloud #3 | 6.89 | 007-100-010-0 | Keystone Mines Inc. | Land administered by Bureau of Land Management (Federal Land) |
| 6 | Unpatented Mining Claim (Federal Lode Claim) | Active | CA101301850 | Red Cloud #4 | 20.66 | 007-120-003-0 | Keystone Mines Inc. | Land administered by Bureau of Land Management (Federal Land) |
| Blue Moon Mine | 28 | March 2025 |
| |
Blue Moon Metals Inc. |
| # | Claim Type | Status | Claim Reference # |
Claim Name |
Claim Size (Acres) |
Parcel Number (APN) |
Claim Owner |
Notes |
| 7 | Unpatented Mining Claim (Federal Lode Claim) | Active | CA101452189 | Red Cloud #5 | 20.66 | 007-120-003-0 | Keystone Mines Inc. | Land administered by Bureau of Land Management (Federal Land) |
| 8 | Unpatented Mining Claim (Federal Lode Claim) | Active | CA101379487 | Red Cloud #6 | 20.66 | 007-120-003-0 | Keystone Mines Inc. | Land administered by Bureau of Land Management (Federal Land) |
| 9 | Unpatented Mining Claim (Federal Lode Claim) | Active | CA101347731 | Red Cloud #7 | 3.16 | 007-120-004-0 | Keystone Mines Inc. | Land administered by Bureau of Land Management (Federal Land) |
| 10 | Unpatented Mining Claim (Federal Lode Claim) | Active | CA101378594 | Red Cloud #8 | 6.89 | 007-100-010-0 | Keystone Mines Inc. | Land administered by Bureau of Land Management (Federal Land) |
| Private Land | ||||||||
| 11 | GANN Lands | Active | Letter dated 1 September 2001 | Spanish Land Grant (J.GANN) | 331.28 | 007-120-007-0 | Keystone Mines Inc. | Includes 40 acre surface rights, flexible location within total 320 acre area |
| Blue Moon Mine | 29 | March 2025 |
| |
Blue Moon Metals Inc. |
The Project is located within the boundaries of the County of Mariposa in the state of California. Mariposa County is the lead agent for all county, state and federal permitting jurisdictions. Exploration permits are issued by Mariposa County through an Administrative Use Permit (“AUP”). The Company’s existing AUP expired on June 26, 2023 and the Company will need to apply for a new AUP before commencing any future drilling activities. The Company must file a Notice of Intent to Operate (NOI) with the Bureau of Land Management. The Company has a current NOI in place through to August 27, 2026.
To the extent known, there are no other royalties, back-in rights, payments or other encumbrances to which the Property is subject. The author knows of no known environmental liabilities for which the Property is subject. The author knows of no other significant factors and risks that may affect access, title or the right or ability to perform work on the Property.
| Blue Moon Mine | 30 | March 2025 |
| |
Blue Moon Metals Inc. |
5.0 ACCESSIBILITY, CLIMATE, LOCAL RESOURCES, INFRASTRUCTURE AND PHYSIOGRAPHY
| 5.1 | Access |
The Blue Moon Property is located 22 miles northeast of Merced, California, and approximately 120 miles east-southeast of San Francisco, California.
Access to the Blue Moon Project is via California County Route J16 also known as Hornitos Rd. and Bear Valley Rd. The road is a paved secondary highway between the communities of Hornitos (population < 75) and Bear Valley (population <60). Two miles north of Hornitos, at the intersection of J16 and Exchequer Rd., the Project access is provided by 3.4 miles of gravel roads consisting of county right-of-way across open, private ranch lands and BLM Federally managed ground.
| 5.2 | Topography, Elevation and Vegetation |
The Blue Moon Project is located in the lower foothills of the western Sierra Nevada mountains. The mineralized Property generally coincides with and lies along a broad, prominent northwest trending ridgeline known as Bullion Hill. Elevations on the Project site are between 1,420 ft and 1,180 ft above mean sea level. Lands falling away to the east and west are open, rolling hills covered with tall grasses and sparsely scattered oak trees with some pines. Drainage to the east and south is into Hornitos Creek and the San Joaquin River; to the east and north into Lake McClure behind the Exchequer dam on the Merced River; to the west into Lake McSwain below Exchequer dam on the Merced River.
Figure 5.1
Drone View from Above Blue Moon Shaft to the South Along Ridge
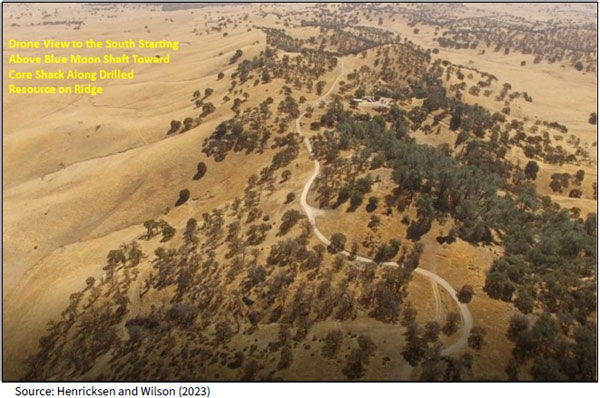
| Blue Moon Mine | 31 | March 2025 |
| |
Blue Moon Metals Inc. |
| 5.3 | CLIMATE |
The average yearly temperature for Hornitos, 4.5 miles south of the Blue Moon Property, is 61°F with an average temperature of 82°F (maximum 100°F) in July and an average of 48°F (minimum 34°F) in December and January. The average yearly precipitation for the area is approximately 19 inches with a high of 13.5 inches between December and the end of March, and a low of 0.5 inches in July and August. Precipitation generally comes as gentle falls rains between October and January and as occasional heavy downpours sometimes causing local flash flooding and small landslides or slumps. Rare occasional trace of snow can occur in winter. Summers are hot and dry.
| 5.4 | INFRASTRUCTURE |
A small storage facility is in place on the site consisting of six steel, lockable, Conex-type shipping containers used for core storage and temporary office space, and 400 linear feet of outdoor, steel core racks under corrugated, steel roofing.
Necessary additional rental equipment to adequately supply and support drilling campaigns has proven to be readily available nearby. Any future potential development beyond exploratory drilling will require additional infrastructure as there are currently no services available at the Project site.
Overhead transmission lines from the Exchequer hydro dam pass close to the Property (Figure 5.2) and it is anticipated that a connection to this grid will provide power for the Project.
Existing wells could provide water for exploration drilling and should be tested to establish their adequacy to support the potential mining and processing operations, subject to which additional wells may be required.
The site has adequate space within which to locate the surface infrastructure for mining, processing and waste (tailings) storage as described elsewhere in this report (see Figure 18.1). Personnel are anticipated to be drawn from neighbouring communities including the towns of Mariposa and Merced.
| Blue Moon Mine | 32 | March 2025 |
| |
Blue Moon Metals Inc. |
Figure 5.2
Existing Infrastructure
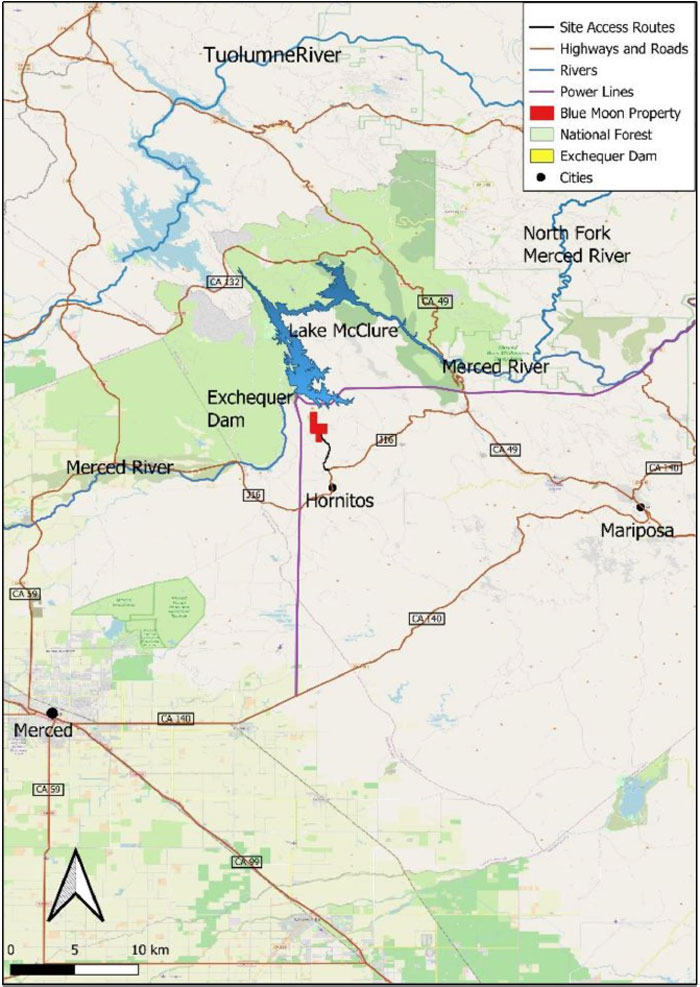
| Blue Moon Mine | 33 | March 2025 |
| |
Blue Moon Metals Inc. |
6.0 HISTORY
| 6.1 | BACKGROUND |
Extending along the foothills of the west slope of the Sierra Nevada from Butte County on the north to Fresno County on the south is a discontinuous belt of copper and zinc mineralization. This belt also has been the source of substantial amounts of gold. Gold-bearing gossans in the oxidized zones overlying the copper-zinc deposits were mined during the gold rush. Later, during the copper “booms” of the Civil War and World Wars I and II, considerable amounts of gold were recovered as a by-product. During the 1930s a few gossan deposits in this belt were again mined for gold.
The primary copper and zinc deposits consist of lenticular sulphide bodies in zones of alteration in greenstones and various types of schists. Mineralization contains abundant pyrite with associated chalcopyrite, sphalerite and some gold and silver. Most of the mineralization contains only a small fraction of an ounce of gold per ton, but some deposits have yielded as much as one ounce of gold per ton. Also present are galena, bornite, tetrahedrite, covellite, and chalcocite.
The most important mines in the foothill belt have been the Big Bend mine, Butte County; Spencerville and Boss mines, Nevada County; Dairy Farm and Valley View mines, Placer County; Copper Hill and Newton mines, Amador County; Penn, Quail Hill, Napoleon, Collier, Keystone-Union, and North Keystone mines, Calaveras County; Blue Moon, Pocahontas, Green Mountain and La Victoria mines, Mariposa County; Buchanan, Jessie Belle, and Daulton mines, Madera County; and Fresno Copper and Copper King mines, Fresno County.
Considerable by-product gold has been recovered from copper mines in the Moonlight District of northeastern Plumas County, the principal sources having been the Walker, Engels, and Superior mines. However, few production figures are available, so the total gold output of these mines is unknown. In 1931, the Walker mine was the source of 432,000 tons of copper ore that had an average gold content of 0.05 ounces per ton. At the Walker mine, the mineral bodies consist of wide chalcopyrite-bearing quartz veins in schist and hornfels near granitic rocks. At the Engels and Superior mines, the deposits are bands of chalcopyrite and bornite in sheared granitic rocks.
The Blue Moon deposit is the largest known volcanogenic massive sulphide deposit of its type within the Foothills Massive Sulphide Belt.
A few miles to the south of the Blue Moon Property in Mariposa County is the nearby town of Hornitos. a formerly rollicking Mexican village that sprang up in the 1850s from the newly rich gold diggings at Quartzburg. Situated on Burns Creek, “Hornitos” means “little ovens” in Spanish and was named for the above ground rock and adobe graves of Mexican settlers found in the area. These gravestones were built like little square bake ovens. The population is less than 75 residents today.
| 6.2 | BLUE MOON PROPERTY |
| 6.2.1 | 1890 - 1945 |
Although copper was discovered in Mariposa County during mid-1800s gold rush, initial exploration on the Property did not begin until the 1890’s. Approximately 50 prospect pits, trenches, and shafts were developed by gold prospectors at that time, mainly on quartz outcrops and pyritic/gossanous outcrops. In 1899, the American Eagle adit was driven 300 ft into an alteration zone and an “appreciable quantity” of gold was produced from one of six known mineralized zones. This zone is now covered but was reported to be about 4 ft wide and consisted of oxidized sphalerite, pyrite, tetrahedrite, galena, chalcopyrite, silver, and gold, with grades of roughly 3% to 8% zinc, 2% to 11% copper, 1% lead, 1 opt to 3 opt silver, and 0.01 opt to 0.22 opt Au. This mine was worked until 1912, and then was idle until 1942 when, during WWII, a small block of ground was stoped. By 1943, production from the American Eagle was suspended and it has remained inactive since then. No reliable figures for the total production at the American Eagle are available.
| Blue Moon Mine | 34 | March 2025 |
| |
Blue Moon Metals Inc. |
In the early 1930’s prospecting in the Blue Moon area, just north of the American Eagle was begun. In 1935 a small amount of Au-Ag-Cu oxide ore was mined, probably representing the surface expression of the Blue Moon Main Zone. In 1940, Red Cloud Mines, Inc. (Red Cloud), began developing shallow workings which intersected zinc, probably in the Main Zone in the area Blue Moon Shaft #1. The Federal Bureau of Mines had initiated a diamond-drilling program at the American Eagle mine based on an examination by one of its engineers in June 1943; drilling was done from January to March 1944. The results of this drilling by the government are unknown.
Exploratory drilling at that time verified continuity of the mineralization at depth. In 1943, Red Cloud was acquired by Hecla Mining Co. Production at a rate of 200 tons per day yielded ore with an average content of 14% zinc and minor copper, lead, silver and gold. Cutoff grade was defined as 7% zinc over a minimum stope width of four feet. Ore was milled and concentrated by flotation at the Jenny Lind gold mine and mill site located four miles to the southeast. Zinc concentrates were sold to Metals Reserve Co. at Merced Falls and later at Merced; copper concentrates were trucked to the ASARCO smelter at Selby, California.
In 1945, the “hanging wall fault breccia” caved twice, once in the summer and again in November. Following the second cave-in, all work at the Blue Moon mine was suspended. At that time the mine had been developed to a depth of 490 ft and along strike for 320 ft, with a total of 2,370 ft of workings. Total reported production amounted to 55,655 tons containing about 12.3% zinc, 0.37% copper, 0.48% lead, 3 .76 opt silver, and 0.062 opt Au.
At the time of its closing, the consolidated Blue Moon mine was ranked as the eleventh largest producing mine, and by far the largest productive base metal mine, in Mariposa County.
| 6.2.2 | 1945 – 1975 |
Exploration and mining activities on the Property were paused during this period.
| 6.2.3 | 1976 - 1990 |
In 1976, Amselco acquired the Property from prospectors Tom Evans and Norm Stevens, and conducted soil geochemical and electromagnetic surveys and 4,161 feet of percussion drilling between 1976 and 1979. Between 1981 and 1984, Colony Pacific Explorations Ltd. (an Imperial Metals Corporation subsidiary) conducted geological mapping, soil geochemical sampling, induced polarization and downhole EM geophysical surveys, and 33,385 ft of diamond drilling. This drilling was focused on testing the down dip extension of the mine area. Mr. Evans supervised this work and defined the steep plunge of the lenses to the south, still recognized today.
American Mine Services optioned the Property from Colony Pacific in 1983 and calculated a geological and mineable reserve, as per 1983 criteria, as well as undertaking preliminary metallurgical studies, mine engineering and design studies and site facilities planning but subsequently defaulted on their option agreement in 1983. Westmin Resources Limited concluded an option on the Property and conducted several exploration programs in the period 1984-1987 and completed 56,853 ft of diamond drilling expanding the resource base of the deposit and discovering the American Eagle lens and East lenses. The exploration work included recalculation of the mineral resource, and commencing engineering studies and conducting metallurgical, hydrological, and environmental baseline studies. In October 1987, Westmin terminated its option and converted its interest into an equity position in Colony Pacific. The latter continued with permitting of an underground exploration permit and made application for a permit for an underground development and exploration program. More than US$5 million in exploration was completed in the period (Thompson, 1995).
| Blue Moon Mine | 35 | March 2025 |
| |
Blue Moon Metals Inc. |
| 6.2.4 | 1991 - 2001 |
In 1991 Lac Minerals (eventually Barrick) optioned the Property from Colony Pacific and carried out 19,654 ft of drilling in 15 holes. Lac Minerals also completed soil and rock geochemical surveys, and HLEM and magnetic surveys. Westmin re-acquired the Property in May 1996 at a cost of US$1.45 million.
Following the repurchase in May of 1996, Westmin resumed evaluation of the development of the Blue Moon Property, however as budgetary priorities were being focused on the company’s discovery at the Wolverine deposit in the Yukon, exploration and development efforts were diverted away from Blue Moon. In February 1998, Westmin granted Augusta Metals Corporation an option on the Blue Moon Property. Augusta completed 2,470 ft of drilling in five holes on the Lone Oak barite-gold prospect southeast of the main VMS zone. Subsequently Augusta failed to fulfill its work commitments, and the option was forfeited during 2000/2001.
| 6.2.5 | 2002 - Present |
In 2002, Expatriate Resources Ltd. (Harlan Meade) purchased Westmin from Boliden. In 2004, the Blue Moon Property was spun out into Selwyn Resources Ltd. Subsequently, in 2007, Savant Explorations Ltd. was spun out from Selwyn Resources and issued a NI 43-101 resource estimate based on previous well-documented work programs in 2008 (Morris, R.J. and Giroux, G. 2008).
In 2017, Savant was renamed Blue Moon Zinc Corp., and an updated mineral resource estimate was issued. Between 2018 and 2021, a multi-year drilling program was carried out under a JV with Platina Resources, and a 10% NPI and two 1% NSR royalties were bought back.
In April, 2021, the company was renamed Blue Moon Metals Inc. (BMM).
In 2023, a geophysical (gravity) survey was conducted on the Property (Carpenter, T., 2023) and a revised resource estimate was published, including the 2018-2021 drilling data (Hendricksen, A.H. and Wilson, S., 2023).
Figure 6.1, Figure 6.2, and Figure 6.3 show some historical mine workings and previously mined mineralized rock at the Blue Moon Project.
| Blue Moon Mine | 36 | March 2025 |
| |
Blue Moon Metals Inc. |
Figure 6.1
American Eagle Mine Entrance
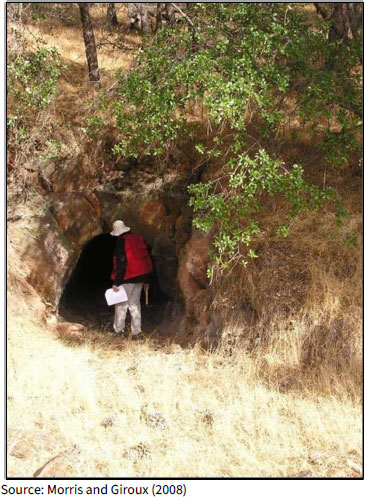
Figure 6.2
Blue Moon Mine; Historic Mine Shaft of Hecla
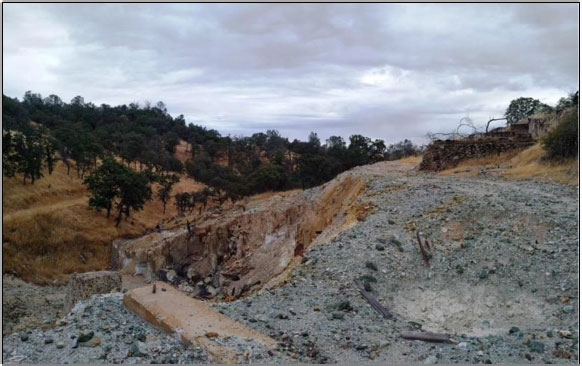
| Blue Moon Mine | 37 | March 2025 |
| |
Blue Moon Metals Inc. |
Figure 6.3
Blue Moon VMS on Dump of Shaft 2
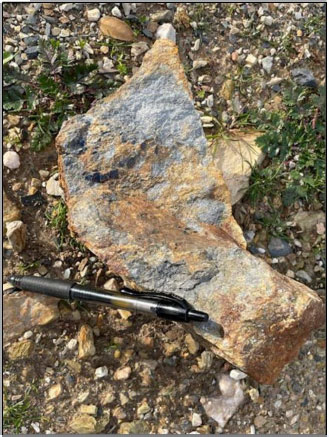
| Blue Moon Mine | 38 | March 2025 |
| |
Blue Moon Metals Inc. |
7.0 GEOLOGICAL SETTING AND MINERALIZATION
The Blue Moon deposit is hosted by the Upper Jurassic Gopher Ridge Formation of the Western Block of the Sierra Foothills Metamorphic Belt. This belt extends for 186 miles along the western foothills of the Sierra Nevada Mountains and is approximately 9.5 miles wide. Along the length of the belt, clusters of Zn-Cu rich, polymetallic, massive sulphide deposits occur at approximately 25-mile intervals. Many mines were developed between 1860 and the mid 1900s along the belt. One of the largest was the Penn mine in Calaveras County north of Mariposa County, which produced 883,402 tons of Cu-Zn-Pb (Au-Ag) ore (Martin, 1988).
| 7.1 | REGIONAL GEOLOGY |
Rocks in the Sierra foothills consist of north trending tectonostratigraphic belts of metamorphosed sedimentary, volcanic, and intrusive rocks ranging in age from late Paleozoic to Mesozoic. These belts represent rock sequences, largely of island-arc affinity, that were accreted to the continent. They extend about 235 miles along the western side of the Sierra and are flanked to the east by the Sierra Nevada Batholith and to the west by sedimentary rocks of the Cretaceous and Jurassic Great Valley sequence.
The structural belts are internally bounded by the Melones and Bear Mountains fault zones, and are characterized by extensive faulting, shearing, and folding (Earhart, 1988). Historically, three belts have been identified in the southern Sierran foothills based on lithologic differences and the nature of gold mineralization - the West Gold Belt, the Mother Lode Belt, and the East Gold Belt. The Mother Lode Belt is responsible for most of the gold produced. However, substantial gold has been produced from the East Belt, as well as gold, copper, and other base metals from rocks of the West Belt.
The West Belt consists of an eastern component composed of an ophiolitic melange and a Jurassic age western component composed of the Copper Hill Volcanics, the Salt Springs slate, and Gopher Ridge Volcanics. The Bear Mountains fault zone separates the melange from the Copper Hill Volcanics. The West Belt contains widely scattered gold deposits occurring in quartz veins and stringers in schist, slate, granitic rocks, altered mafic rocks, and as gray ore in greenstone. The West Belt also hosts the Foothill Copper-Zinc Belt (Figure 7.1) and the massive sulphide deposits of the Penn Mine and other VMS deposits.
The Mother Lode Belt traverses western Calaveras County and consists of the upper Jurassic Logtown Ridge and Mariposa formations. The Logtown Ridge Formation consists of about 6,500 ft of volcanic and volcanic-sedimentary rocks of island arc affinity. The overlying Mariposa Formation contains a distal turbidite, hemipelagic sequence of black slate, schist, amphibolite and chlorite schist, fine-grained tuffaceous rocks, and subvolcanic intrusive rocks. The thickness of the Mariposa Formation is estimated to be about 2,600 ft thick at the Consumnes River (Earhart, 1988).
Mother Lode mineralization is characterized by steeply dipping gold-bearing mesothermal quartz veins and bodies of mineralized country rock adjacent to veins. Mother Lode mineral production is generally low to moderate grade (1/3 ounce of gold or less per ton), but mineral occurrences may be considered large in volume. Mother Lode veins are characteristically enclosed in Mariposa Formation slate with associated greenstone. The Mother Lode belt vein system ranges from a few hundred feet to a mile or more in width. Mother Lode type veins fill voids created within faults and fracture zones and consist of quartz, gold and associated sulphides, ankerite, calcite, chlorite, limonite, talc, and sericite. The Melones Fault zone separates the Mother Lode Belt from the East Belt.
| Blue Moon Mine | 39 | March 2025 |
| |
Blue Moon Metals Inc. |
The Eastern Belt is dominantly argillite, phyllite plus phyllonite, chert, and metavolcanic rocks of Paleozoic-Mesozoic age. The phyllite and phyllonite are dark to silvery gray. The chert is mostly thin bedded with phyllite partings.
Figure 7.1
Foothills Copper-Zinc Belt, Western Sierra Nevada Mts., California
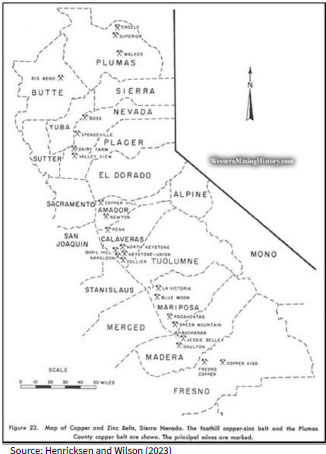
The Paleozoic-Mesozoic metasedimentary and metavolcanic rocks of the Eastern Belt have been assigned to the Calaveras Complex by most investigators (Earhart, 1988). Older Paleozoic metamorphic rocks have been assigned to the Shoo Fly Complex. The metamorphic complexes have been intruded in places by Mesozoic plutonic rocks.
Lode deposits of the East Belt consist of many individual gold-bearing quartz veins enclosed in metamorphic rocks of possible Jurassic age, metamorphic rocks of the Calaveras Complex, metamorphic rocks of the Shoo Fly complex, or in granitic rocks. Most of the veins trend northward and dip steeply. An east-west set of intersecting faults may be a controlling factor in controlling deposition of metals. Mineral deposits of the East Belt are smaller and narrower than those of the Mother Lode, but commonly are more chemically complex, and richer in grade. Gold is usually associated with appreciable amounts of pyrite, chalcopyrite, pyrrhotite, galena, sphalerite, and arsenopyrite.
| Blue Moon Mine | 40 | March 2025 |
| |
Blue Moon Metals Inc. |
| 7.2 | LOCAL GEOLOGY |
The Foothill Copper-Zinc Belt (Figure 7.1) forms part of a complex litho-tectonic belt of Jurassic age island arc metavolcanic, metasedimentary, and meta-plutonic rocks. It lies west of, and roughly parallel to the Mother Lode gold belt. The metallic deposits, which form lenticular bodies in the metavolcanic rocks, are primarily composed of massive pyrite and various amounts of chalcopyrite, sphalerite, gold and silver. Some deposits, however, contain small amounts of pyrrhotite, galena, tetrahedrite, or bornite.
Until the early 1970s, the massive sulphide deposits at the Penn Mine were thought to be epigenetic replacement deposits formed along shear zones (Heyl, et al, 1948; Clark and Lydon, 1962). The reinterpretation of massive sulphide deposits in Japan as being of volcanogenic origin rather than replacement deposits resulted in a re-evaluation of many massive sulphide deposits in the western US. As a result, more recent studies of specific deposits, including those of the Penn Mine, have proposed a syngenetic origin of these deposits (Peterson, 1985).
Kemp (1982) defined the island-arc setting in which the Foothill Copper-Zinc Belt deposits are situated. Schmidt (1978) defined the textural and structural attributes, stratigraphic framework, and the sulphide mineralogy at the Penn Mine and concluded these deposits are more indicative of Kuroko-type syngenetic volcanogenic sulphides. Bedrock at the Penn Mine consists primarily of greenschist-facies metavolcanic rocks of the Gopher Ridge Volcanics that strike N30°W and dip steeply to the east (generally greater than 70°).
Despite the regional metamorphism and eastward tilting there is little evidence of major folding or faulting in the area (Peterson, 1985). The metavolcanic rocks have a weak to intense foliation paralleling the strike. Peterson (1985) subdivided the Gopher Ridge Volcanics at the Penn Mine into one intrusive and five volcanic sub-units based on prominent lithologic features: 1) felsic quartz porphyry intrusive unit, 2) siliceous tuff unit, 3) basalt unit, 4) mafic to intermediate tuff unit, 5) heterogeneous tuff unit, and 6) vent complex unit.
Most of the copper-zinc deposits are intimately associated with sills and lenses of the felsic quartz porphyry unit which occur within the lower three volcanic units. Also associated with the deposits are large areas of sericitic and silicic alteration that produced a quartz sericite schist, and chloritic, hematitic, and pyritic alteration halos around the mineralization. Mineralization occurs in two distinct zones; a western ore zone lying to the east of quartz porphyry schist and along which Shaft Nos. 1, 2, 6 were sunk, and an eastern ore zone just west of chloritic quartz porphyry, which was mined in shafts Nos. 3 and 4. Twelve separate zones were differentiated during underground mining. Heyl et al (1948) provides numerous cross sections through many of these areas within the mine.
Schmidt (1978) identified several zoned mineralization types including massive sulphides, stringer veins and disseminated mineralization. The principal domains consist of massive mixtures of sphalerite, pyrite, bornite, and chalcopyrite with minor gangue comprised of barite, quartz, calcite and/or mica schist, and rare to minor galena and tetrahedrite/tennantite. Quartz, selenite, and some native copper are also present (Clark and Lydon, 1962).
Many of the massive zones are banded with alternating layers of chalcopyrite, pyrite, or sphalerite, whereas others are a fine-grained heterogeneous mixture of up to 60% sphalerite, 50% pyrite, and varying proportions (up to 30%) of copper and accessory minerals. Many of the banded mineral bodies show kinks, swirls, and folds indicative of post-deposition deformation (Schmidt, 1978). The mineralization shapes are lenticular in form, and the long axes plunge down dip or steeply to the north or south. Mineralization shows pronounced elongation with length-to-width ratios ranging from 2:1 to 5 :1 and averaging 3:1 (Schmidt, 1978). They varied considerably in size, some having been mined along the pitch length of as much as 1,000 ft (Heyl et al, 1948). Thickness of mineralization varies from 4 ft to 30 ft. Stringers are pyrite, chalcopyrite, sphalerite, bornite, calcite, barite, and quartz. Gangue of fine-medium-grained aggregates of quartz, calcite, and barite occur interstitial to the stringers.
| Blue Moon Mine | 41 | March 2025 |
| |
Blue Moon Metals Inc. |
Disseminated mineralization consists of disseminated pyrite, chalcopyrite, and sphalerite, and are associated with extensive wall-rock alteration (Schmidt, 1978). Fine-grained pyrite comprises between 1 % to 10% of the rock. Mineralization displays a strong asymmetric zonation both in mineralogy and mode of mineral occurrence, which was not consistent with a replacement origin.
A typical mineral body in the Western zone consists of: 1) a hanging wall layer of massive to banded mineralization rich in sphalerite, barite, chalcopyrite, pyrite, and galena, and tetrahedrite-tennantite, with sphalerite-barite rich mineralization being more abundant towards the hanging wall, and copper minerals more abundant towards the footwall; 2) a zone of stringer mineralization with copper minerals (bornite and chalcopyrite), pyrite, quartz, and minor tetrahedrite; and 3) quartz-pyrite veinlets and disseminated pyrite mineralization with quartz porphyry or rhyolitic tuffs.
In the Eastern zone, the above sequence is reversed, occurring from footwall to hanging wall. The zoning was attributed to a syngenetic process where gravity would contribute to the asymmetry of both the mineral types and alteration effects (Schmidt, 1978). Mineralized zones are conformable with the volcanic section. Mineralization lies along bedding and schistosity planes rather than along fault planes or fractures zones as would be expected by a hydrothermal origin. These zones also exhibit stratigraphic selectivity, occurring only within or to one side of a felsic quartz porphyry.
Mineralization commonly occurs at the contact of a felsic porphyry with more mafic rocks. The felsic quartz porphyry intrusive units and parts of the volcanic units are altered to sericite and silicified in the stratigraphic horizons of the deposits (Peterson, 1985). Similar associations of felsic rocks and alteration are characteristic of Kuroko-type deposits massive sulphide deposits (Franklin et al, 1981). The fluids affecting the felsic quartz porphyry intrusive and responsible for the mineralization are thought to have had a common origin, with alteration occurring contemporaneously with deposition of the metallic mineralization. First the volcanic units were deposited in an island arc environment. Contemporaneous with or shortly after their deposition, felsic quartz porphyry bodies intruded the volcanic rocks along bedding planes to form a number of sills, the massive sulphide bodies were deposited, and the adjacent country rock was altered.
| 7.3 | PROPERTY GEOLOGY |
The Gopher Ridge Formation in the area of the Blue Moon deposit consists of a basal sequence of basalt and andesite overlain by a rhyolite, Figure 7.2. The rhyolite strata are up to 300m thick and host the Blue Moon deposit(s). The sulphide-sulphate mineralized lenses are hosted in the lower part of the felsic sequence. The felsic volcanic rocks are succeeded to the east by volcaniclastic rocks and ultimately by deep-water argillaceous, sedimentary rocks (Meade, 1996).
Strata at Blue Moon strike approximately 20° west of north, dip near vertically, face to the east and are tightly folded. Minor fold features suggest a steep, north plunge of the regional structure. All lithologies have undergone low grade metamorphism and the prefix “meta” is not applied to lithologic names for the sake brevity in writing. Lithologies observed at Blue Moon exhibit metamorphic characteristics of the lower greenschist facies. The rhyolite strata have been subdivided on the basis of phenocryst mineralogy into three distinct units: aphyric rhyolite, feldspar porphyry rhyolite and quartz-feldspar porphyry rhyolite. The distinction of these different types of rhyolite allows the modeling of the depositional environment of the volcanic rocks at the time of the sulphide mineralization and the identification of stratigraphic horizons within the felsic rocks. More massive phases of aphyric rhyolite define rhyolite dome features that are flanked by clastic, fragmental facies. The thinning of the aphyric rhyolite proximal to the domes defines favorable environments for deposition of massive sulphide mineralization. Further up the stratigraphic sequence, massive feldspar porphyry rhyolite appears to define sill or dyke features that locally truncate sulphide mineralization.
| Blue Moon Mine | 42 | March 2025 |
| |
Blue Moon Metals Inc. |
Sericitic alteration and bleaching of the rhyolite strata cause wide ranges in the appearance of the various rhyolite rocks, and careful distinction of alteration changes versus changes in lithology is important to defining the volcanic stratigraphy.
Lateral to the sulphide mineralization, chemical sedimentary rocks containing hematite, magnetite, barite, silica and manganese minerals, helped define mineralized horizons. Sulphide-barite mineralization on the edges of massive sulphide mineralization grades laterally into hematite-jasper iron formation, which, in turn, grades into manganese-bearing siliceous tuffaceous rock.
Figure 7.2
Property Geology (Meade, 2002)
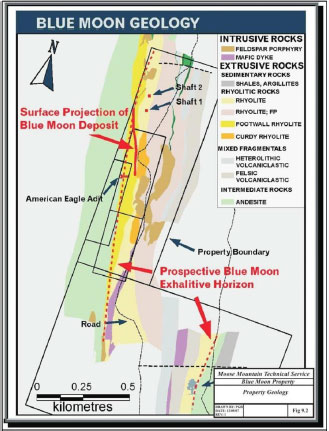
| Blue Moon Mine | 43 | March 2025 |
| |
Blue Moon Metals Inc. |
| 7.4 | MINERALIZATION |
Probably the best local surface geology maps displaying mineralization at the Blue Moon deposits were those during Harlan Meade’s leadership time with both Western Mines and Expatriate Resources (Figure 7.2). Several geologists, including Paul Wodjak and Garfield McVeigh are mentioned in the references. Several subsequent geologists have mapped offset faults in the Main Zone and more work is necessary to clarify these differences.
The Blue Moon deposit is a Kuroko-type volcanogenic massive sulphide deposit. The deposit is shown to have some similarities with the Lynx and Myra deposits at Myra Falls, Vancouver Island. Stacked sulphide-sulphate lenses occur in two or more horizons within a 50 ft to 180 ft stratigraphic interval. Four distinct lenses of massive sulphide mineralization have been identified; the West, Main, East and American Eagle zones. The American Eagle Zone appears to occur in the same stratigraphic position as the West Zone.
The West Zone occupies the lowest stratigraphic position and occurs near the base of the aphyric rhyolite sequence. The Main Zone lies stratigraphically above the West Zone and occurs with the first appearance of quartz and feldspar porphyry rhyolite. The East Zone lies stratigraphically above the Main Zone, although several authors have included it as part of the Main Zone. It is hosted entirely within feldspar porphyry rhyolite.
Massive sulphide mineralization consists of pyrite, sphalerite, chalcopyrite, galena, and minor tetrahedrite and bornite. Massive and semi-massive sulphides may be accompanied by purple anhydrite, gypsum or barite. Textures include massive, banded and clastic mineralization.
Metal zoning in base or precious metal is poorly understood although there is a strong tendency for narrower mineralized zones to be relatively richer in gold and silver and to have barite gangue.
The potential mineral horizons are enveloped by sericite-silica-pyrite alteration that extends laterally in the rhyolite stratigraphy at least 3,000 ft, as far as known mineralization is recognized, and more than 490 ft into the footwall andesite. A stockwork sulphide feeder zone is not clearly identified within the footwall alteration zone. This discordant sericite altered zone is linked to a lower strata-bound sericite altered zone in the footwall andesite which extends at least 0.7 miles to the south from the deposit and may be an important exploration tool to identify other mineralized centres.
The lower mineralized horizon (West and American Eagle zones) generally contains more pyrite, chalcopyrite, sphalerite, anhydrite and gypsum than the upper mineralized horizon (Main and East zones) which is comparatively enriched in galena, tetrahedrite and barite. The South Zone has not been studied. Gold and silver grades can be significant in the lower horizon lenses but are on average three times greater in the upper horizon lenses.
A database of some 1,540 samples is available for the deposit. All the samples are from drill core. Table 7.1 lists some of the general statistics.
| Blue Moon Mine | 44 | March 2025 |
| |
Blue Moon Metals Inc. |
Table 7.1
Blue Moon Summary Statistics from Drill Core
| Parameter | Minimum | Maximum | Mean | Stand. Dev. | C.V. | |||||||||||||||
| Sample length (ft) | 0.4 | 21.3 | 3.78 | 1.78 | 0.47 | |||||||||||||||
| Copper (%) | 0.0 | 10.7 | 0.35 | 0.85 | 2.44 | |||||||||||||||
| Zinc (%) | 0.0 | 46.0 | 2.37 | 5.09 | 2.15 | |||||||||||||||
| Lead (%) | 0.0 | 6.4 | 0.14 | 0.47 | 3.48 | |||||||||||||||
| Silver (oz/ton) | 0.0 | 40.3 | 0.69 | 2.44 | 3.55 | |||||||||||||||
| Gold (oz/ton) | 0.0 | 1.04 | 0.019 | 0.06 | 3.19 | |||||||||||||||
| Blue Moon Mine | 45 | March 2025 |
| |
Blue Moon Metals Inc. |
8.0 DEPOSIT TYPES
The Blue Moon deposit is a Kuroko-type, polymetallic, volcanogenic, massive sulphide deposit, or VMS deposit. The sulphide-sulphate deposit is hosted in rhyolite. Anomalous metalliferous mineralization includes pyrite, sphalerite, chalcopyrite, galena, and minor tetrahedrite and bornite. The associated sulphate minerals are barite, gypsum and purple anhydrite. To date, four lenses of mineralization have been identified within at least two, possibly three, horizons. The lenses are enveloped by sericite-silica-pyrite alteration. Gold and silver grades are significant in the lower horizon lenses but are, on average, three times greater in the upper horizon lenses.
The volcanogenic massive sulphide deposit type and model for Blue Moon is considered appropriate, and the proposed exploration program is planned accordingly.
| Blue Moon Mine | 46 | March 2025 |
| |
Blue Moon Metals Inc. |
9.0 EXPLORATION
Exploration of the Blue Moon Property, mostly historical in nature, was in part carried out by earlier owners and includes geological mapping, soil geochemical surveys and geophysical surveys, including an induced polarization survey and down-hole EM surveys.
BMM has carried out surface exploration at the prospect. Three drill campaigns were carried out in 2018, 2019, and 2021 (see Section 10.0), and a gravity survey in 2023, as reported in Section 9.3.2, below.
| 9.1 | GEOLOGICAL MAPPING |
Westmin Resources and Expatriate Resources geologists carried out several campaigns of excellent geological mapping in the late 1980s and at Lone Oak in 1991. Mapping was at a scale of 1:500. A summary of the maps is shown in Figure 7.2.
Westmin’s mapping found volcanic rocks of the Gopher Ridge Formation comprised basalt overlain by andesite and rhyolite. The rhyolite succession is 900 ft to 1,000 ft thick in the vicinity of the West and Main zone mineral deposits and is divided into four units based on quartz and feldspar phenocryst content and texture. The most important unit is the footwall rhyolite because it is key to localizing ore. It is a distinctive aphyric (cherty) rhyolite, commonly banded and highly variable in color. The top of the footwall rhyolite defines the West zone mineralized horizon. New zones of aphyric rhyolite to the south of Blue Moon, whether or not they are exactly correlative with the footwall rhyolite, are considered by previous authors to have better mineralization potential than other types of rhyolite.
The West zone horizon marks a sharp change in the rhyolite stratigraphic sequence at Blue Moon. Rhyolite above the West zone comprises clastic, sparsely feldspar porphyritic rhyolite (“curdy”) rhyolite and quartz-feldspar porphyritic phases. The Main zone at Blue Moon lies above the West zone and occurs in sparsely porphyritic and curdy rhyolite 40 ft to 180 ft stratigraphically above the West zone. These phases of rhyolite are a less specific guide to ore. The footwall and curdy rhyolite appear to be domal features and either unit could host mineralization south of the American Eagle adit.
Rhyolite is prominent east and south of the Blue Moon deposits but should not be regarded as a negative feature to finding more mineralization. In fact, it might be considered favorable because most of the copper-zinc zones at the Penn deposit are closely associated with intrusive quartz porphyry rhyolite.
| 9.2 | GEOCHEMICAL SURVEYS |
Two soil geochemical surveys were completed, one by Colony Pacific in the early 1980s was limited to main deposit area and a later survey by Lac Minerals in 1991 that covered the entire Property. In both surveys soil was collected from the “B” soil horizon. The analytical reports are no longer available; however, as the surveys were conducted by reputable mining companies, the author has no reason to doubt their authenticity.
Little detail remains on the Colony Pacific survey other than the grid spacing of 400 ft by 50 ft and that only zinc, copper, silver and barium were analyzed by the atomic absorption method. Colony Pacific found a moderately strong copper-zinc soil anomaly overlies the andesite footwall alteration zone and the sub-crop of the mineralized zones. It is 500 ft to 1,000 ft wide and extends to the southern limit of the survey at that time.
| Blue Moon Mine | 47 | March 2025 |
| |
Blue Moon Metals Inc. |
Hydromorphic dispersion downslope has enhanced the extent of copper and zinc anomalies. Silver was not useful and barium was ineffective due to incorrect analytic procedure. Apparently, no other elements such as lead were determined.
In the 1980’s. Lac Minerals’ (now Barrick) 1991 soil survey is more detailed (50 ft intervals on lines 200 ft apart), covered the entire Property, employed better methodology (ICP and fire assay AA finish) and analyzed for gold, silver, copper, lead, zinc, manganese, arsenic, antimony, barium and mercury. The survey shows that zinc and copper are commonly subject to hydromorphic dispersion in this local California climate. The results for lead, one of the least mobile of the metals analyzed is shown in Figure 9 .1. The anomalous results highlight the rhyolite-andesite contact as being favorable to mineralization, and indicate the metalliferous nature of the contact.
| 9.3 | GEOPHYSICS |
| 9.3.1 | EM Studies by Walker (2021) |
Walker (2021) carried out a study on the effectiveness of EM surveys, both surface and down hole surveys, in finding new massive sulphides at the Blue Moon Property. He examined the old data and came up with the following conclusions:
| • | Based on the borehole logging and previous exploration reports, the sphalerite zones at the New Moon Project are not very conductive. |
| • | Based on the EM carried out by Lac and Boliden the maximum depth of detection of the Main Zone was detected ~250 m below surface. |
| • | Based on the Boliden downhole EM data the Main Zone was detected in boreholes 60 m to 80 m away. However, if Hole 70 anomaly is related to BM83 that distance is larger. |
| • | These depths and distances will depend upon how massive the zone is and also on the coupling of the surface loop and the conductor. |
| • | For these deep targets I feel that borehole EM is your best bet. I would suggest surveying the holes as soon after drilling as possible to ensure the holes remain open and to help target your next holes. |
| 9.3.2 | Gravity (2023) |
Tom Carpenter (2023) carried out a gravity survey in September of 2023. A total of 131 gravity stations were read above the drill locations of massive sulphides on the Blue Moon Project, over the course of four days. Stations were read on a 100 m grid with some 25 m infill stations. The work was carried out on a 4x4 ATV and on foot.
The massive sulphide zones with residual gravity stations in Figure 9.1. Figure 9.2 shows the NNW trending gravity low superimposed on the massive sulphide zones. These zones appear to nestle along the eastern edge of the gravity low. The gravity low probably is probably formational and is coincidental with phyllically altered rhyolite with the more mafic rocks being gravity highs. At Blue Moon the contact between the altered rhyolite and andesite is very favorable location for forming the VMS mineralization, even the actual massive sulphide zones are too thin and/or too deep to be recognized by widely spaced gravity stations. The drilling has shown that the VMS is often at the eastern contact of the rhyolite/andesite at Blue Moon as shown as the eastern contact of the gravity low.
| Blue Moon Mine | 48 | March 2025 |
| |
Blue Moon Metals Inc. |
Figure 9.1
Massive Sulphide Zones (Red) and Gravity Station Grid
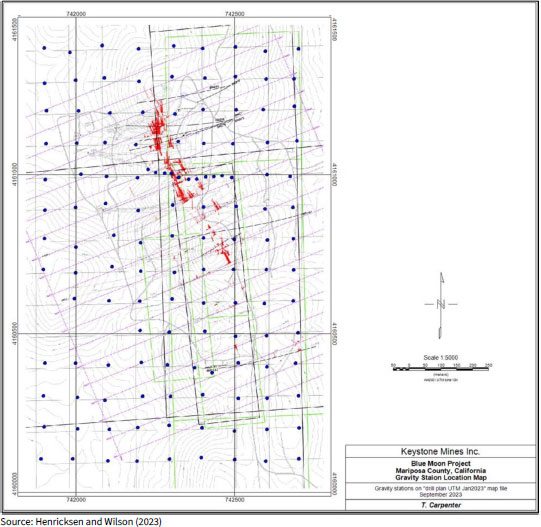
| Blue Moon Mine | 49 | March 2025 |
| |
Blue Moon Metals Inc. |
Figure 9.2
NNW Trending Gravity Low Superimposed Massive Sulphide Zones (Carpenter, 2023)
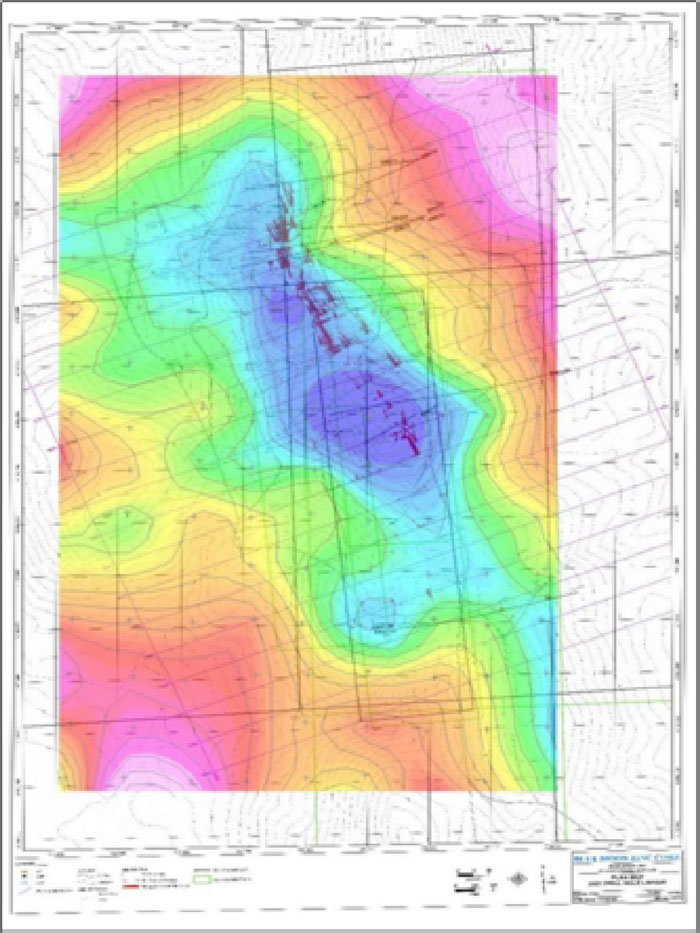
| Blue Moon Mine | 50 | March 2025 |
| |
Blue Moon Metals Inc. |
10.0 DRILLING
Most of the drilling on the Property was completed by previous owners, starting in 1942, and by BMM in 2018, 2019, and 2021.
Drilling has occurred on the Blue Moon Property since 1942 with a total of 136,416 ft of drilling in 124 drill holes. Most of the holes were drilled in the Blue Moon deposit area. A few holes were drilled in the Amselco Hill and Lone Oak areas, targeting the favorable stratigraphic horizon. Figure 10.1 shows the location of all drill holes on the Blue Moon prospect through 2023 (Shum, Kevin 2023).
Figure 10.1
Location of All Drill Holes on the Blue Moon Prospect through 2023 (Shum, Kevin 2023)
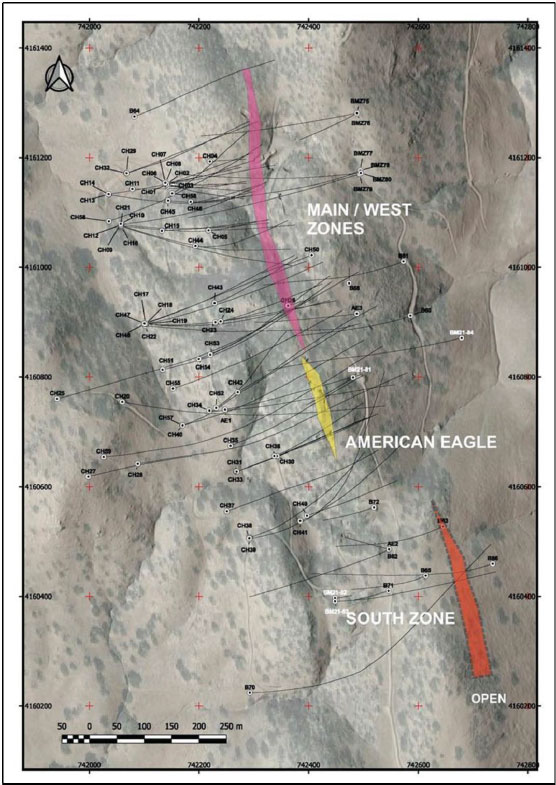
| Blue Moon Mine | 51 | March 2025 |
| |
Blue Moon Metals Inc. |
Most of the holes drilled on the Blue Moon Property have been diamond drill holes of BQ and NQ core, except for nine percussion holes drilled in 1979 by Amselco. As well, with the exception of the Amselco holes, all the holes have down-hole surveys. Only core holes drilled since 1979 were used in the resource calculation.
Table 10.1 and Table 10.2 list the footage drilled by others and by BMM, respectively.
Table 10.3 (over) details significant Intercepts from the BMM Drill Program.
Table 10.1
Summary of Drilling on the Blue Moon Property, Prior to the Formation of BMM
| Year | Operator | No.
of Holes | Hole Numbers | Drilled
Length (ft) | ||||||||
| 1942 | Red Cloud Mines Inc. | 10 | RC2 – RC8, 101-103 | 4,516.5 | ||||||||
| 1944 | US Bureau of Mines | 7 | 1-7 | 2,800.0 | ||||||||
| 1979 | Amselco | 9 | 79-1 – 79-9 | 4,161.0 | ||||||||
| 1981 | Colony Pacific | 2 | B1, B2 | 1,584.0 | ||||||||
| 1982 | Colony Pacific | 12 | AE1-AE3, B3-82 – B11-82 | 11,054.1 | ||||||||
| 1983 | Colony Pacific | 6 | B12-83 – B17-83 | 9,856.6 | ||||||||
| 1984 | Westmin | 5 | B18 – B22 | 10,891.7 | ||||||||
| 1985 | Westmin | 10 | CH13-14,17-18,23-28 | 10,307.5 | ||||||||
| 1986 | Westmin | 15 | AE 86 CH 1,B 86 CH 29 – B 86 CH 42 | 22,129.8 | ||||||||
| 1987 | Westmin | 7 | B 87 CH 43–B 86 CH49 | 6,872.0 | ||||||||
| 1988 | Westmin | 10 | B 88 CH 50–B 88 CH59 | 16,447.0 | ||||||||
| 1991 | Lac Minerals | 15 | B 91 CH 60–B 91 CH74 | 19,639.0 | ||||||||
| 1999 | Augusta | 5 | LO 99 CH 01 – LO 99CH 05 | 2,471.0 | ||||||||
| Totals | 113 | - | 122,730.2 | |||||||||
Table 10.2
Drilling by BMM Since 2018 at Blue Moon Project
| Hole | Drilled
Length (ft) |
||
| BMZ75 (2018) | 1,180 | ||
| BMZ76 (2018) | 950 | ||
| BMZ77 (2018) | 180 | ||
| BMZ78 (2018) | 1,789 | ||
| BMZ79 (2019) | 1,837 | ||
| BMZ80 (2019) | 1,877 | ||
| BMZ81 (2021) | 719 | ||
| BMZ82 (2021) | 577 | ||
| BMZ83 (2021) | 2,809 | ||
| BMZ84 (2021) | 1,768 | ||
| Total | 13,686 |
| Blue Moon Mine | 52 | March 2025 |
| |
Blue Moon Metals Inc. |
Table
10.3
Significant Intercepts from the BMM Drill Program
| Hole | From (ft) | To (ft) | Length (ft) | Zinc (%) | Gold (g/t) | Silver (g/t) | Lead (%) | Copper (%) | ZnEq (%) | ||||||||||||||||||||||||||||
| BMZ75 | 1,022.0 | 1,038.0 | 16.0 | 1.2 | 0.08 | 0.7 | 0 | 0.04 | 1.4 | ||||||||||||||||||||||||||||
| Inc | 1,027.0 | 1,029.0 | 2.0 | 2.9 | 0.05 | 1.5 | 0 | 0.08 | 3.2 | ||||||||||||||||||||||||||||
| BMZ78 | 1,425.0 | 1,545.7 | 120.7 | 9.45 | 1.10 | 42.93 | 0.15 | 0.58 | 12.61 | ||||||||||||||||||||||||||||
| Inc | 1,436.0 | 1,441.0 | 5.0 | 1.90 | 4.98 | 32.60 | 0.47 | 0.11 | 8.08 | ||||||||||||||||||||||||||||
| Inc | 1,459.0 | 1,464.0 | 5.0 | 2.60 | 5.01 | 18.50 | 0.01 | 0.33 | 8.77 | ||||||||||||||||||||||||||||
| Inc | 1,468.5 | 1,453.3 | 15.2 | 5.98 | 2.30 | 15.44 | 0.03 | 0.38 | 9.40 | ||||||||||||||||||||||||||||
| Inc | 1,508.0 | 1,538.0 | 30.0 | 30.30 | 1.67 | 71.07 | 0.05 | 1.70 | 36.80 | ||||||||||||||||||||||||||||
| Inc | 1,508.0 | 1,511.0 | 3.0 | 46.50 | 3.14 | 130.00 | 0.13 | 2.20 | 56.51 | ||||||||||||||||||||||||||||
| BMZ79 | 412.8 | 420.3 | 7.5 | 25.6 | 0.68 | 17.39 | 0.02 | 0.87 | 28.46 | ||||||||||||||||||||||||||||
| Inc | 414.7 | 417.7 | 3.0 | 49.6 | 0.91 | 30.32 | 0.05 | 1.39 | 54.11 | ||||||||||||||||||||||||||||
| BMZ79 | 450.4 | 461.3 | 10.9 | 3.1 | 0.16 | 4.49 | 0.27 | 0.47 | 4.62 | ||||||||||||||||||||||||||||
| Inc | 457.2 | 459.2 | 2.0 | 4.2 | 0.08 | 3.30 | 0.33 | 0.24 | 5.24 | ||||||||||||||||||||||||||||
| BM21-83 | 504.0 | 514.0 | 10.0 | 3.8 | 0.07 | 5.10 | 0.17 | 0.12 | 4.40 | ||||||||||||||||||||||||||||
| Inc | 509.0 | 514.0 | 5.0 | 5.0 | 0.07 | 5.10 | 0.22 | 0.08 | 5.50 | ||||||||||||||||||||||||||||
| BM21-83 | 1,829.0 | 1839.0 | 10.0 | 1.1 | 3.62 | 11.3 | 0.30 | 0.04 | 5.30 | ||||||||||||||||||||||||||||
| Inc | 1,839.0 | 1839.0 | 5.0 | 1.2 | 6.96 | 15.2 | 0.30 | 0.03 | 8.80 | ||||||||||||||||||||||||||||
| BM21-83 | 2,408.0 | 2,458.0 | 50.0 | 2.4 | 0.31 | 4.5 | 0.06 | 0.12 | 3.13 | ||||||||||||||||||||||||||||
| Inc | 2,413.0 | 2,423.0 | 10.0 | 3.4 | 0.17 | 5.8 | 0.05 | 0.09 | 3.90 | ||||||||||||||||||||||||||||
| Inc | 2,443.0 | 2,453.0 | 10.0 | 4.3 | 0.31 | 4.5 | 0.01 | 0.34 | 5.46 | ||||||||||||||||||||||||||||
Figure 10.2 presents a longitudinal section showing the drill hole intercepts to date.
Drill hole BMZ-78 cut 30 ft (9.35 m) of massive sulphide mineralization grading 30.3% zinc, 1.7% copper, 1 .67 g/t gold and 71 g/t silver for a zinc equivalent grade of 36.8% within a broader interval of 120.7 ft (36.5 m) that returned 9.45% zinc, 0.58% copper, 1.1 g/t gold and 42.9 g/t silver for a zinc equivalent grade of 12.61%.
BMZ-78 was drilled into a previously untested area (200 ft x 500 ft) within the West and Main Zones at a vertical depth of approximately 1,200 ft (374 m).
BMM’s 2018 drill program demonstrated that the massive sulphide lenses are now traceable for approximately 3,000 ft (900 m) along plunge and remain open to surface and depth.
Hole BMZ79 intersected significant zones of high-grade sphalerite including the following intervals.
Note that stated dimensions are intersected width (IW); true width is approximately 55% of IW.
| • | 7.47 m (24.5 ft) at 25.55% zinc, 0.87% copper, 0.68 g/t gold and 17 g/t silver for a zinc equivalence (“ZnEq”) of 28.46% from 412.81 m, including: |
| ○ | 3.05 m (10.0 ft) at 49.60% zinc, 1.39% copper, 0.91 g/t gold and 30 g/t silver for a ZnEq of 54.11% from 414.65 m. |
| Blue Moon Mine | 53 | March 2025 |
| |
Blue Moon Metals Inc. |
Figure 10.2
Long Section Showing Latest Drilling Through to 2021
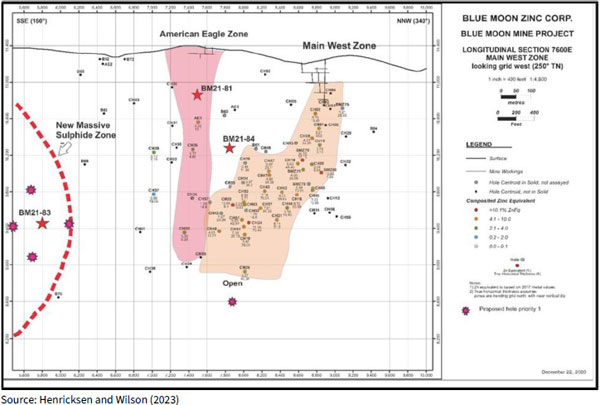
A second zone of zinc mineralization in the same hole from 450 m, included:
| • | 10.96 m (36.0 ft) at 3.11% zinc, 0.47% copper and 0.27 % lead for a ZnEq of 4.62% from 450.37 m, including: |
| ○ | 2.08 m (6.8 ft) at 4.2% zinc for a ZnEq of 5.24% from 457.16 m. |
The high-grade zone of BMZ79 includes the highest zinc interval ever intercepted in the Project to date, 1.71 m (5.6 ft) at 51.9% zinc, 1.49% copper, 0.05% lead, 0.85 g/t gold and 31.9 g/t silver from 414.65 m.
The high-grade mineralized intercept in Hole BMZ79 is 50 m (164 ft) above and 8 m (26 ft) south of the high-grade mineralization intercepted by the 2018 diamond hole BMZ78. The intercept extends the size of the high-grade zone of mineralization within the Main mineralized horizon. The Main mineralized horizon also intersected some interesting anomalies of gold and silver (Table 10.3).
The stage 1 drilling program totaled 1,132 m (3,714 ft) and tested the northern border of the mineral resource as well as extend the zone of high-grade mineralization near hole BMZ78 which was drilled by BMM in 2018.
A new drill discovery was made in 2021 testing a geophysical conductor target, located west of the three previously discovered Blue Moon mineralized zones and south of the American Eagle workings, as shown in Table 10.4. This new Zone was discovered deep and lateral to the previously known mineral system. Sphalerite encountered in this new discovery has a different hue from the other zones which may indicate a separate emplacement pulse, with slightly different timing, which could add to the currently known zones.
| Blue Moon Mine | 54 | March 2025 |
| |
Blue Moon Metals Inc. |
Table
10.4
Assay Highlights New South Zone (Drill Hole BM21-83)
| Drill Hole | From (ft) | To (ft) | Thickness (ft) | Zinc (Zn%) | Copper (Cu%) | Lead (Pb %) | Silver (Ag opt) | Gold (Au opt) | ZnEq %(*) | |||||||||||||||||
| BM21-83 | 2408 | 2458 | 50 | 2.4 | 0.12 | 0.06 | 0.13 (4.5 g/t Ag) | 0.009 (0.31 g/t Au) | 3.13 | |||||||||||||||||
| including | 2413 | 2423 | 10 | 3.4 | 0.09 | .05 | 0.17 (5.8 g/t Ag) | 0.005 (0.17 g/t Au) | 3.90 | |||||||||||||||||
| and | 2443 | 2453 | 10 | 4.3 | 0.34 | 0.01 | 0.13 (4.5 g/t Ag) | 0.009 (0.31 g/t Au) | 5.46 | |||||||||||||||||
The above thicknesses are core lengths and are not true thicknesses. The estimated true thicknesses are approximately 50% of the core length. These results are also reported in Table 10.3.
Stringers and blebs of sulphides were encountered starting at a core depth of 2,363 ft that continued until the banded and massive interval from 2,400 ft to 2,452 ft (52 ft interval at a vertical depth from surface of approximately 800 ft). Mineralization then tapered off into another stringer zone down to 2 ,461 ft core depth. The mineral-rich zone comprised nearly 100 ft core length (not true thickness). Higher up in the hole, several smaller zones were encountered. Mineralization is hosted in rhyolite and rhyolite tuffs of the Gopher Ridge Formation. The stringer and main zone of sulphides are composed of sphalerite, chalcopyrite, galena tetrahedrite and pyrite. In the photos below, core from part of the mineralized zone drill interval is displayed.
Figure 10.3
Photographs of Zinc Mineralization in Drillhole BM21-83
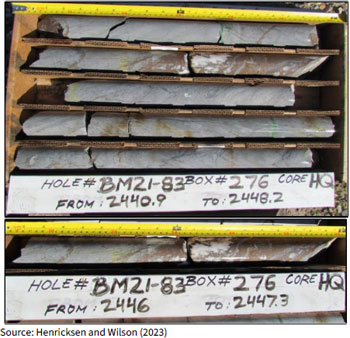
| Blue Moon Mine | 55 | March 2025 |
| |
Blue Moon Metals Inc. |
11.0 SAMPLE PREPARATION, ANALYSES AND SECURITY
Core from the drill holes through 2021 was collected at the drilling rig by a company geologist and brought to the core logging facility on the Blue Moon Property. The core was cleaned, logged for rock type, structures and mineralization prior to a geologist marking out specific intervals for sampling based on sulphide content. Sampling of the core was done either by a hydraulic splitter if visually lower grade OR sawn if deemed to be potentially higher grade. The core was sampled lengthwise with one half placed into a plastic sample bag with a sample tag. The other half was returned to the core box with a duplicate sample tag number for a permanent record. Standards and blank samples were not inserted into the stream of core samples prior to BMM as this was not practiced by the majority of mining companies at that time. Core with visual mineralization was stored in locked shipping containers which remain on site, with saved mineralized sections of core available for inspection.
Samples for analysis were sent by truck to independent laboratories. Some of the earlier samples were sent to a Mineral Assay Office Inc., Nevada; however, the majority of the core samples were analyzed by Chemex Labs (now ALS Laboratories) in Vancouver, Canada. Both laboratories were certified assayers within their respective jurisdictions and independent of the owners of the Property. All assay data used in the resource calculation was generated via standard, industry accepted assaying techniques. Gold assaying used a 30g sample size for a fire assay with an atomic absorption spectrometry finish (FA-AAS). Silver and lead assays were generated with atomic absorption spectrometry (AAS). All other elements were assayed by inductively coupled plasma atomic emission spectroscopy (ICP-AES), including barium which required an additional, final gravimetric procedure. Known standards and blank samples were inserted into the sample stream by the laboratory for quality control.
One set of check assays carried out by Giroux (2018) included 55 samples that were assayed by both Chemex Labs in Vancouver (Chemex) and Mineral Assay Office Inc. in Nevada (Mineral). At that time, Chemex and Mineral were independent facilities with no relation to the issuer. Chemex was an ISO 9001:2015 certified laboratory. Chemex and Mineral are no longer in business as of the effective date of this report. Table 11.1 summarizes the results of those check assays.
Table
11.1
Summary Statistics, Check Assays
| Parameter | Copper (Cu %) | Zinc (Zn %) | Silver (opt Ag) | Gold (opt Au) | ||||||||||||
| Mean, Chemex | 0.918 | 5.385 | 2.554 | 0.035 | ||||||||||||
| Mean, Mineral | 0.970 | 5.500 | 2.433 | 0.038 | ||||||||||||
| Stand. Dev, Chemex | 0.997 | 6.622 | 7.037 | 0.082 | ||||||||||||
| Stand. Dev, Mineral | 1.066 | 6.653 | 7.009 | 0.094 | ||||||||||||
| CV, Chemex | 1.09 | 1.23 | 2.76 | 2.31 | ||||||||||||
| CV, Mineral | 1.10 | 1.21 | 2.88 | 2.44 | ||||||||||||
A paired t-test was performed and previously reported on the data to check bias between the laboratories. In all cases the difference between the laboratories is considered insignificant. Table 11.2 summarizes the results.
It is the opinion of the QP that the sample preparation, security and analytical procedures followed during the work on the Property were the industry standard practice for that period of time and can be relied on as the work was done by professional geologists and assayers.
| Blue Moon Mine | 56 | March 2025 |
| |
Blue Moon Metals Inc. |
Table
11.2
Paired t-test, Check Assays
| Element | Results |
| Cu | Mineral reports 0.05% higher than Chemex |
| Zn | No bias found between laboratories |
| Ag | Chemex reports 0.12 oz/ton higher than Mineral |
| Au | No bias found between laboratories |
| Blue Moon Mine | 57 | March 2025 |
| |
Blue Moon Metals Inc. |
12.0 DATA VERIFICATION
Mr. Wilson of RDA and Messrs. Jacobs and San Martin of Micon conducted a personal inspection of Blue Moon on November 5 and 6, 2024. As QP for the resource estimate, Mr. Wilson had access to the complete database of the Project including all original assay certificates, the original drill logs, the results of surveys of the original drill hole locations by Freeman and Seaman Land Surveyors, and down-hole, directional survey results for all holes used in the resource calculations. As well as the original surveyor’s report on drill hole locations, the QP was provided with a report of a 2018 survey commissioned by BMM and completed by Jones Snyder and Associates, a registered land surveyor in the state of California. The 2018 survey included resurveying of 29 of the holes used in the current resource calculation as well as monuments established by the surveys of 1984 and 1991.
All mineralized intersections used in the resource calculation are preserved in a secured storage facility on the Blue Moon Property. As part of the verification process, the author completed cross checks of the assay sample numbers recorded in the original assay certificates with drill logs and the sample tags in the core boxes for 30 of the mineralized intercepts. No discrepancies or errors were noted between the sample numbers on the tags in the core boxes and those recorded in the assay certificates. The author did not note any visual discrepancies between what was observed in the core with what was recorded in the drill logs. No assay with high zinc, copper or lead were noted to be at odds with what was observed in the drill core for the comparable interval.
The QP reviewed the results of the 2018 drill hole survey and compared these with the original surveys of 1984 and 1991. In addition, the surveys of the 2019 program were also compared for drilling in those years. The results of the surveys compare, and no material difference was found. As a check of the professional surveys, the author also checked the collar locations with a handheld GPS unit (Garmin). The co-ordinates noted matched those of the earlier surveys.
As a check on core recoveries reported in the historical logs, the QP carried out spot checks of key mineralized sections in 25 holes used in the resource calculation of this report. The core recovery noted by the author matched those reported in the historical logs. The author also checked the thicknesses of mineralization by measuring the angle between the core axis and the contact of massive sulphide zones with the bounding rhyolite host rocks. Spot checking of 25 holes used in the resource calculation with respect to drill hole length, azimuth and grid location found no material differences.
During the November 2024 site visit, the QP collected a random interval of core from Drill Hole CH7. The sample was submitted to ALS Reno USA for sample preparation. The assaying was performed at ALS Vancouver BC. ALS Reno USA and ALS Vancouver BC are both subsidiaries of ALS Global. ALS Global is independent of the issuer. ALS Global Quality complies with ISO/EIC 176025:2017. Table 12.1 shows the original assay which is used in the drilling database versus the check sample submitted by the author. The results confirm the occurrence of mineralization for that sample at the encountered drilling depth.
Table 12.1
Independent QP’s Data Verification, November 5, 2024
| Parameter | Hole ID | Sample ID | From | To | Silver (opt Ag) | Gold (opt Au) | Copper (Cu %) | Lead (Pb %) | Zinc (Zn %) | ||||||||||||||||||||||||||||
| Original | CH47 | 73860 | 1495.4 | 1496.5 | 1.9 | 0.01 | 0.9 | 0.005 | 10.7 | ||||||||||||||||||||||||||||
| Check | - | - | - | - | 0.91 | 0.001 | 0.411 | 0.001 | 5.3 | ||||||||||||||||||||||||||||
| Blue Moon Mine | 58 | March 2025 |
| |
Blue Moon Metals Inc. |
No limitations were placed on the QPs during the site visit. In the opinion of the relevant QP, the data used to estimate a mineral resource on the Property is adequate for the purpose of the preliminary economic assessment presented in this technical report.
| Blue Moon Mine | 59 | March 2025 |
| |
Blue Moon Metals Inc. |
13.0 MINERAL PROCESSING AND METALLURGICAL TESTING
| 13.1 | INTRODUCTION |
No recent metallurgical testwork has been completed using mineralized samples from the Blue Moon Project. Colony Pacific Explorations Ltd. undertook preliminary metallurgical studies at Lakefield Research, Lakefield, Ontario (now SGS Mineral Services) in 1983 and 1988 on behalf of Westmin Resources Limited. Lakefield Research was, and remains, independent of the issuer.
Both test programs are considered “historical”, and the results need to be verified using fresh, representative samples. Nevertheless, a description and discussion of the most recent 1988 study, as reported by Lakefield Research, is provided below.
The Qualified Person (QP) for this section of the report is Richard Gowans P.Eng., Principal Metallurgist of Micon International Limited. The QP was not involved with the selection of the metallurgical samples or the management of work completed by Lakefield Research. In preparing this section of the report, the QP has reviewed the following test report:
| • | Lakefield Research, An Investigation of the Recovery of Copper, Lead and Zinc from Blue Moon Project Samples, Submitted by Westmin Resources Limited, Progress Report No. 1, November 22, 1988. |
| 13.2 | METALLURGICAL TESTWORK |
A program of metallurgical testwork was undertaken using two mineralized samples by Lakefield Research in Ontario in 1988 under the direction of Wright Engineers Limited on behalf of Westmin Resources Limited. The preliminary program of work completed by Lakefield Research comprised chemical and mineralogical analyses, hardness testing, batch and locked cycle flotation, flotation concentrate analyses, gravity separation and preliminary settling tests on samples of zinc concentrate and zinc rougher tailings.
| 13.2.1 | Metallurgical Samples |
| 13.2.1.1 | Sample Provenance |
In July 1988, Lakefield Research in Ontario received four boxes of Blue Moon mineralized samples that had been selected, prepared and packaged by Westmin Resources. Two of the four boxes were labelled “Sample 1” and the others “Sample 2”. Each sample consisted of drill core and coarse reject material from an earlier exploration drilling campaign.
The drill hole locations and core intervals included in the two samples were not disclosed and therefore the spatial representivity of the samples compared to the outlined mineral resources cannot be confirmed by the QP.
Material from each sample was crushed to minus 6 mesh (3.36 mm) and 10 kilograms of each were riffled for Bond Work Index determination. The remainder was crushed to minus 10 mesh (2 mm) and separated into subsamples for individual tests. Test charges of material ground to -200 mesh (0.074 mm) were prepared.
| Blue Moon Mine | 60 | March 2025 |
| |
Blue Moon Metals Inc. |
| 13.2.1.2 | Feed Sample Analyses |
Sample 1 was reported by Lakefield Research to comprise relatively coarse high sulphide mineralization with active pyrite and sphalerite. Sample 2 was reported to contain less sulphides and be more complex and finer grained than Sample 1.
Representative fractions of the two metallurgical samples were submitted for chemical analyses and preliminary mineralogical characterization. The chemical analyses of the two head grade samples are presented in Table 13.1 alongside the average grades reported for the December 2024 mineral resource estimate.
Table 13.1
Selected Head Analyses of the Metallurgical Composite Samples
| Analyte | Units | Sample 1 | Sample 2 | Dec.2024 MRE | ||||||||||||
| Copper | % | 1.71 | 0.34 | 0.73 | ||||||||||||
| Lead | % | 0.15 | 1.03 | 0.23 | ||||||||||||
| Zinc | % | 15.1 | 6.54 | 5.97 | ||||||||||||
| Sulphur | % | 24.1 | 11.5 | - | ||||||||||||
| Arsenic | % | 0.03 | 0.01 | - | ||||||||||||
| Antimony | % | 0.024 | 0.008 | - | ||||||||||||
| Gold 1 | g/t | 0.83 | 7.95 | 1.47 | ||||||||||||
| Silver 1 | g/t | 41.1 | 67.2 | 51.0 | ||||||||||||
| Specific gravity | - | 3.51 | 3.56 | 3.26 | ||||||||||||
1 Gold and silver assays were assayed using a “pulp and metallics” procedure.
In addition to the chemical analyses shown in Table 13.1, a semi-quantitative spectrographic analysis was performed on both samples. The results of this multi-element analysis are presented in Table 13.2 with elements below detection limits not included.
Table 13.2
Semi-Quantitative Spectrographic Analyses of the Metallurgical Composite Samples
| Low | High | Sample 1 | Sample 2 | |||
| 10% | 100% | - | Si | |||
| 3% | 30% | Si, Fe, Zn, Ca, Ba | Ba | |||
| 1% | 10% | Al | Fe, Al, Zn, Ca | |||
| 0.30% | 3% | Mg, Cu | Pb | |||
| 0.10% | 1% | K, Sr | Mg, Cu, K, Sr | |||
| 300 ppm | 0.30% | Pb | ||||
| 100 ppm | 0.10% | As, Cd, Ti | Ti | |||
| 30 ppm | 300 ppm | Sb, Mn, Ga, Mo, Zr | As, Sb, Ga, Mo, Cd, Zr | |||
| 10 ppm | 100 ppm | Tl, Ge, Bi, V, Ag, Ni, Cr | Mn, Ge, V, Ag, Ni, Cr, Au, Tl | |||
| - | <3 ppm | Co | Bi |
Both samples appear to contain significant amounts of barite based on the significant barium content. They also show high calcium which could indicate anhydrite and/or gypsum, which have previously been reported as significant constituents within the deposit.
| Blue Moon Mine | 61 | March 2025 |
| |
Blue Moon Metals Inc. |
| 13.2.1.3 | Feed Sample Mineralogical Characterization |
A portion of each sample was briquetted and polished for reflected light microscopy. The results of the study by Lakefield Research showed that the samples were similar with respect to sulphide mineral species but there were differences in the amounts of each sulphide and mineral associations. In general, Sample 1 contained more sulphides and was relatively coarse grained (> 100 microns) while Sample 2 contained more non-opaque minerals and sulphide particles were smaller in size.
Mineralogy - Sample 1
The major sulphide minerals identified in Sample 1 were pyrite, sphalerite and chalcopyrite, and minor sulphides were galena, tennantite / tetrahedrite and bornite. Typically, these sulphide minerals were present as liberated grains, as mixed grains in various associations, and as inclusions of one mineral in another.
The sphalerite particles measured between 1,300 to 20 microns and it was estimated that 65% of the mineral was coarser than 75 microns. The sphalerite grains were typically colourless which suggests low iron content and only occasionally hosted other sulphides as inclusions.
The size distribution of the chalcopyrite particles was similar to sphalerite and it was associated most commonly with sphalerite and pyrite as mixed grains and inclusions.
Mineralogy - Sample 2
The sulphide minerals present in Sample 2 were pyrite, sphalerite and chalcopyrite, galena, tennantite / tetrahedrite and bornite. Generally, the sulphides were present as free grains, mixed grains of two or more different sulphides, inclusions of one sulphide on another, or inclusions in non-opaque gangue minerals.
The sphalerite particles measured less than 900 microns, were typically colourless, and occasionally occurred as free grains but mainly associated with other sulphides in mixed grains.
The chalcopyrite particles ranged from 300 to 10 microns with about 65% finer than 75 microns. The chalcopyrite was present as free particles and as mixed grains associated with pyrite, sphalerite and galena.
Galena was more abundant in Sample 2 compared with Sample 1 and had a similar size distribution to chalcopyrite. Galena grains were occasionally liberated but also occurred as mixed grains associated with sphalerite, tennantite and pyrite.
Pyrite was present as free grains and in various associations with other sulphide minerals. It was also hosted as very fine inclusions in chalcopyrite and galena.
| 13.2.2 | Grinding Testwork |
Standard Bond ball mill tests were completed by Lakefield Research on the two samples. Using a screen size of 104 microns, which produced a product size of around 80% passing 80 microns, the Bond ball mill work index for Samples 1 and 2 were 8.6 and 8.3 kWh per short ton, respectively.
| Blue Moon Mine | 62 | March 2025 |
| |
Blue Moon Metals Inc. |
The work indices are relatively low compared with most copper and zinc ores (between 11 kWh/t and 14 kWh/t), although the elevated content of barite and gypsum could explain the perceived discrepancy.
| 13.2.3 | Flotation Testwork |
Lakefield Research completed 26 separate bench scale batch flotation tests and one locked cycle test to primarily investigate the sequential flotation of copper and zinc from the two samples. A total of eight batch tests were undertaken using Sample 1, which considered primary grind size, rougher concentrate regrind, flotation reagent combinations and dosage rates, and the recovery of pyrite from the zinc tailings. Sixteen batch tests used Sample 2 and these tests also investigated grind size, rougher concentrate regrinding, reagents, pyrite recovery as well as the potential to separate copper and lead from the bulk copper/lead concentrate.
Sample 1
The preliminary flowsheet developed for Sample 1 and selected for the locked cycle test comprised primary grinding to about 80% passing 75 microns, sequential copper then zinc rougher flotation, regrinding of the copper and zinc rougher concentrates, and three stages of copper and zinc cleaning. The average results for the last three cycles from the 6-cycle test (Test 26) are summarized in Table 13.3.
Table
13.3
Summary of the Sample 1 Locked Cycle Flotation Test Results
| Grades | Distribution (%) | |||||||||||||||||||||||||||||||||||||||||||
| Product | Wt% | Cu % | Pb % | Zn % | Au g/t | Ag g/t | Cu | Pb | Zn | Au | Ag | |||||||||||||||||||||||||||||||||
| Cu Cl Concentrate | 6.1 | 26.5 | 2.35 | 7.02 | 8.42 | 484 | 93.1 | 93.2 | 2.7 | 67.9 | 68.6 | |||||||||||||||||||||||||||||||||
| Zn Cl Concentrate | 24.7 | 0.39 | 0.04 | 62.3 | 0.56 | 44.8 | 5.5 | 5.8 | 95.3 | 18.3 | 25.7 | |||||||||||||||||||||||||||||||||
| Zn Rougher Tailing | 69.2 | 0.03 | 0.002 | 0.47 | 0.15 | 3.5 | 1.3 | 1.1 | 2.0 | 13.7 | 5.7 | |||||||||||||||||||||||||||||||||
| Head (calc) | 100 | 1.73 | 0.15 | 16.14 | 0.76 | 43.01 | 100.0 | 100.0 | 100.0 | 100.0 | 100.0 | |||||||||||||||||||||||||||||||||
| Head Assay | - | 1.71 | 0.15 | 15.1 | 0.80 | 41.5 | - | - | - | - | - | |||||||||||||||||||||||||||||||||
The key results of the locked cycle test (shown here in bold) show a 93% copper recovery into a concentrate containing 26.5% Cu, 8.42 g/t Au, 484 g/t Ag, 2.35% Pb and 7.0% Zn. Lead recovery to the copper concentrate was also 93% while the recoveries of gold and silver were around 68%.
Generally, high grade zinc concentrates were produced in all batch tests. The locked cycle test results projected a 62.3% Zn concentrate with a Zn recovery of 95.3%, with 18.3% and 25.7% recovery of gold and silver, respectively. The zinc concentrate was of good quality.
The analyses of the final copper and zinc flotation concentrates from the locked cycle flotation test are presented in Table 13.4. The zinc concentrate is of high quality with negligible amounts of potential penalty elements. The copper concentrate contains higher values of problematic elements such as As, Sb, Bi and F and the elevated Pb and Zn content could also be penalized. However, both Au and Ag grades are high enough to potentially be payable.
| Blue Moon Mine | 63 | March 2025 |
| |
Blue Moon Metals Inc. |
Table 13.4
Locked Cycle Test Combined Final Concentrate Analyses
| Element / Compound | Units | Copper Concentrate | Zinc Concentrate | |||||||||
| Copper | % | 26.5 | 0.39 | |||||||||
| Lead | % | 2.35 | 0.04 | |||||||||
| Zinc | % | 7.02 | 62.3 | |||||||||
| Gold | g/t | 8.42 | 0.56 | |||||||||
| Silver | g/t | 484 | 44.8 | |||||||||
| Antimony | % | 0.12 | 0.004 | |||||||||
| Arsenic | % | 0.30 | 0.012 | |||||||||
| Iron | % | 26.1 | 1.40 | |||||||||
| Sulphur | % | 29.5 | 29.5 | |||||||||
| Bismuth | % | 0.021 | <0.002 | |||||||||
| Mercury | % | 0.0002 | 0.0014 | |||||||||
| Fluorine | % | 0.022 | 0.023 | |||||||||
| Chlorine | % | <0.005 | 0.005 | |||||||||
| Cadmium | % | - | 0.34 | |||||||||
| SiO2 | % | 0.84 | 0.86 | |||||||||
| CaO | % | 0.21 | 0.35 | |||||||||
| MgO | % | 0.083 | 0.073 | |||||||||
| Al2O3 | % | 0.33 | 0.35 | |||||||||
The two Sample 1 batch tests that included pyrite scavenger flotation of the zinc tailings recovered 10.6% (Test 15) and 19.6% (Test 25) respectively of the mass into the pyrite rougher concentrate. In both cases the recoveries of gold and silver to the pyrite rougher concentrate were less than 5%. The analyses of the pyrite rougher concentrate and tailings from Test 25 are summarized in Table 13.5.
Table 13.5
Analyses of Test 25 Pyrite Concentrate and Tailings Samples
| Sample | Fe % | S % | Cu % | Zn % | Au g/t | Ag g/t | As % | Hg g/t | Bi % | Sb % | ||||||||||||||||||||||||||||||
| Pyrite Concentrate | 29.3 | 36.8 | 0.15 | 0.84 | 0.37 | 9.5 | 0.003 | 1 | <0.002 | <0.002 | ||||||||||||||||||||||||||||||
| Pyrite Tailings | 0.41 | 13.0 | 0.03 | 0.12 | 0.09 | 2.0 | <0.001 | <0.3 | <0.002 | <0.002 | ||||||||||||||||||||||||||||||
Based on the iron assay, the pyrite concentrate is estimated to contain about 60% pyrite. Also, the relatively high sulphur content of the pyrite tailings (13%) suggests that this stream contains significant non-sulphide sulphur bearing minerals, probably barite and/or gypsum.
Sample 2
The preliminary mineralogical studies suggest that Sample 2 was more complex and fine-grained than Sample 1, it also contained more galena. Satisfactory copper-lead concentrates were produced with recoveries up to 93% of the copper and 95% of the lead in a bulk cleaner concentrate. However, separation of the copper and lead proved to be problematic. Although relatively high grade separate copper and lead products were produced (up to 30% Cu and 70% Pb), recovery losses were significant.
| Blue Moon Mine | 64 | March 2025 |
| |
Blue Moon Metals Inc. |
The gold and silver in Sample 2 tended to report with the copper and lead concentrates.
As with Sample 1, a high-quality zinc concentrate containing greater than 60% Zn was produced. The very high zinc grade in zinc concentrates in part reflects the relatively low iron content of sphalerite in the mineralized samples.
A simple batch pyrite recovery test was completed using Sample 2. Following sequential flotation of Cu/Pb and Zn, approximately 20% of the original mass was recovered to a pyrite rougher concentrate. No iron and sulphur analyses were available to ascertain the quality of this product.
| 13.2.4 | Gravity Separation Tests |
Four gravity separation tests (two on each sample) were completed by Lakefield Research. Ground samples were fed over a laboratory Wilfley Table in open circuit, with table concentrate upgraded using a Mozley Mineral Separator. Upgrading did occur but metal balances were poor, probably due to the presence of free gold particles.
| 13.3 | CONCLUSIONS AND RECOMMENDATIONS |
The metallurgical characteristics of the Blue Moon mineralization are gleaned from a program of testwork performed by Lakefield Research in 1988 using two mineralized composite samples. Although there are insufficient details concerning the selection and provenance of the testwork samples to confirm that they were representative of the Blue Moon mineral resources, it can be reasonably assumed that they were representative of the styles of mineralization occurring on the Blue Moon Property.
The conclusions from the 1988 testwork program are as follows:
| • | Good recoveries of copper and zinc into high grade concentrates were achieved using conventional sequential flotation technology. |
| • | Net recoveries of gold and silver to both the zinc and copper concentrates were 86.2% and 94.3% respectively. Typically, most of the gold and silver in the samples tended to report to the copper/lead concentrate. |
| • | The copper/lead concentrate produced contained minor amounts of deleterious elements which may incur penalties when sold to smelters. Conversely, this product also contained gold and silver in payable quantities. |
| • | The zinc concentrate produced was of high grade with relatively low iron and contained no significant amount of penalty elements. |
| • | Flotation of pyrite from zinc tailings was successful and additional work to improve the product quality is recommended. |
| • | Separation of copper and lead into separate products was challenging but further work to improve selectivity is warranted. |
| • | The work indices calculated from standard Bond ball mill tests were relatively low and need to be confirmed using fresh samples that represent the main ore types at Blue Moon. The samples contained interesting amounts of barite and gypsum. More work is required to quantify the distribution of these minerals within the deposit, the quality of these minerals, and the potential to recover these minerals as valuable by-products. |
| Blue Moon Mine | 65 | March 2025 |
| |
Blue Moon Metals Inc. |
| • | The samples appeared to contain a certain amount of free or nuggetty gold which should be investigated further. Deportment studies on the gold and silver are recommended. |
| • | Elements of particular interest that should be investigated in the next phase of metallurgical testwork include germanium and gallium. The economic potential of these elements as well as indium should be considered during the next geo-metallurgical testwork program. |
| • | Based on the limited amount of testing undertaken so far, there are no processing factors or other deleterious elements that could have a significant effect on the potential economic extraction of the deposit. |
Further geo-metallurgical studies are recommended using fresh metallurgical samples that fully represent the typical lithologies and ore-types found within the identified mineral resources at Blue Moon. The testwork should include:
| • | Pre concentration amenability tests to investigate upgrading of the mineralization and the potential to extract barite and /or gypsum before grinding. |
| • | Detailed mineralogical characterization studies. |
| • | Deportment studies for gold, silver and potential critical metals, such as Ge, Ga and In. |
| • | Hardness and comminution tests. |
| • | Additional gravity testwork. |
| • | Further flotation optimization batch tests followed by locked cycle tests. |
| • | Tailings characterization studies. |
| Blue Moon Mine | 66 | March 2025 |
| |
Blue Moon Metals Inc. |
14.0 MINERAL RESOURCE ESTIMATES
| 14.1 | SUMMARY |
The Mineral Resource Estimate (“MRE”) for this report has been determined by using inverse distance cubed (ID3) techniques for the Main, Western and Eastern Zones of the Blue Moon Massive Sulphide Deposit. Assay data was derived from the current drilling database, including drill holes completed after 2018. Mineralized domain solids were created from the coding of drill data in a three-dimensional (3D) geological modeling program. Drilling intercept assay values were capped for each mineralized domain using statistical analysis and subsequently composited forming the sample set used for the MRE grade estimates. The MRE has been determined according to the CIM Estimation of Mineral Resources and Mineral Reserves Best Practice Guidelines (November 29, 2019). Mineral Resources have been reported in accordance with the disclosure requirements under NI 43-101.
The MRE is subdivided into three zones: Main Zone (vm1), East Zone (ve) and West Zone (vw). Using compiled and modeled 3D drill data there are distinct, separate, continuous lenses of mineralization, generally striking north. The Main Zone represents the largest occurrence of mineralization. Mineralization has been identified over a strike length of 2,500 ft as well as a plunge of nearly 2,500 ft of depth. The West and East Zones display less continuity as compared to the Main Zone. These were modeled independently and subsequently appended together to form a combined east and west zone triangulation domains. In addition to the dominant mineralized lenses numerous prominent mineralized intervals exist along many drill holes throughout the deposit. Individual mineralized domain solids were developed for these intervals which were subsequently labeled east lenses (vle) and west lenses (vlw) based upon their respective relationships to the Main Zone. The “vle” and “vlw” lenses were compiled and added to the overall “ve” and “vw” domain triangulations.
Reasonable prospects of eventual economic extraction assume underground mining of the deposit, surface mill processing and production of zinc concentrates and copper concentrates. Mineral Resources are reported at a Zinc Equivalent Percent (ZnEq %) cutoff grade of 2.9%. Cutoff grade sensitivities can be found in Section 0.
ZnEq % is calculated by each assayed metal being assigned a metal price, assumed recovery percentage and overall value factor based on the metal’s price and recovery. Notwithstanding its potential for eventual economic extraction, for the purposes of this preliminary economic assessment lead was assumed not payable and so makes no contribution to ZnEq % grade. Parameters forming the basis for the ZnEq % formula are detailed in Section 14.6.
The formula used to estimate ZnEq % is:
ZnEq = Zn% + ((Cu% * 78.20)+(Pb% * 0)+(Ag opt * 25.46)+(Au opt * 1896.40))/23.83.
Table 14.1 and Table 14.2, respectively, present the Indicated and Inferred Mineral Resource Estimates. Resources are not Mineral Reserves and do not have demonstrated economic viability. There is no certainty that all or any part of the Mineral Resources will be converted into Mineral Reserves.
Figure 14.1 shows the location of drill holes on the Property, as well as a plan projection of the three mineralized zones. Figure 14.2 and Figure 14.3 show the mineralized domains on long-section 7500E looking West and East, respectively.
| Blue Moon Mine | 67 | March 2025 |
| |
Blue Moon Metals Inc. |
Table 14.1
Blue Moon Indicated Mineral Resource Estimate
Effective Date December 24, 2024
| Domain (Vein) | ZnEq Cutoff | Tons | ZnEq (%) | Copper (Cu %) | Lead (Pb %) | Zinc (Zn %) | Gold (opt Au) | Silver (opt Ag) | ||||||||||||||||
| Main | 2.9 | % | 3,073,000 | 12.66 | 0.78 | 0.16 | 5.90 | 0.04 | 1.14 | |||||||||||||||
| East | 2.9 | % | 498,000 | 18.99 | 0.47 | 0.63 | 6.64 | 0.09 | 3.72 | |||||||||||||||
| West | 2.9 | % | 78,000 | 9.50 | 0.62 | 0.33 | 4.41 | 0.03 | 0.93 | |||||||||||||||
| Total | 3,650,000 | 13.46 | 0.73 | 0.23 | 5.97 | 0.04 | 1.49 |
| Metal | Cu Mlbs | Pb Mlbs | Zn Mlbs | Au Moz | Ag Moz | |||||||||||||||||||
| Main | 47.94 | 10.08 | 362.76 | 0.11 | 3.51 | |||||||||||||||||||
| East | 4.67 | 6.29 | 66.15 | 0.04 | 1.85 | |||||||||||||||||||
| West | 0.97 | 0.52 | 6.91 | 0.00 | 0.07 | |||||||||||||||||||
| Total | 53.59 | 16.90 | 435.83 | 0.16 | 5.43 |
Table
14.2
Blue Moon Inferred Mineral Resource Estimate
Effective Date December 24, 2024
| Domain (Vein) | ZnEq Cutoff | Tons | ZnEq (%) | Copper (Cu %) | Lead (Pb %) | Zinc (Zn %) | Gold (opt Au) | Silver (opt Ag) | |||||||||||||||||
| Main | 2.9 | % | 3,261,000 | 11.41 | 0.52 | 0.23 | 5.68 | 0.04 | 1.15 | ||||||||||||||||
| East | 2.9 | % | 994,000 | 15.49 | 0.59 | 0.56 | 5.04 | 0.07 | 2.43 | ||||||||||||||||
| West | 2.9 | % | 173,000 | 6.28 | 0.73 | 0.22 | 1.98 | 0.02 | 0.40 | ||||||||||||||||
| Total | 4,428,000 | 12.12 | 0.54 | 0.30 | 5.39 | 0.04 | 1.41 | ||||||||||||||||||
| Metal | Cu Mlbs | Pb Mlbs | Zn Mlbs | Au Moz | Ag Moz | |||||||||||||||||||||
| Main | 33.65 | 14.74 | 370.27 | 0.11 | 3.76 | |||||||||||||||||||||
| East | 11.80 | 11.20 | 100.11 | 0.07 | 2.42 | |||||||||||||||||||||
| West | 2.52 | 0.74 | 6.84 | 0.00 | 0.07 | |||||||||||||||||||||
| Total | 47.97 | 26.68 | 477.22 | 0.19 | 6.25 |
Notes:
| (1) | Scott Wilson, CPG, President of RDA is responsible for this mineral resource estimate and is an independent Qualified Person as such term is defined by NI 43-101. |
| (2) | Reasonable prospects of eventual economic extraction were assessed by enclosing the mineralized material in the block model estimate in 3D wireframe shapes that were constructed based upon geological interpretations as well as adherence to a minimum mining unit with geometry appropriate for underground mining. |
| (3) | The cutoff grade of 2.9% ZnEq considered parameters of: |
| a. | Metal selling prices: Au-US$2,200/oz, Ag-US$27/oz, Cu-US$4.25/lb., Pb-US$0.90/lb., Zn-US$1.25/lb. |
| b. | Recoveries of Au 86.2%, Ag 94.3%, Cu 93.1%, Pb 0%, Zn 95.3%. |
| c. | Costs including mining, processing, general and administrative (G&A). |
| (4) | Zinc Equivalent Grade (“ZnEq”) is estimated by the formula: |
ZnEq = Zn% + ((Cu% * 78.20)+(Pb% * 0)+(Ag opt * 25.46)+(Au opt * 1896.40))/23.83
| (5) | Mineral resources are not mineral reserves and do not have demonstrated economic viability. |
| (6) | Figures may not add up due to rounding. |
| (7) | Tonnages shown in Table 14.1and Table 14.2 are short tons. |
| (8) | The QP knows of no other legal, political, environmental, or other risks that could materially affect the potential development of the mineral resources for the Project. |
| Blue Moon Mine | 68 | March 2025 |
| |
Blue Moon Metals Inc. |
Figure 14.1
Plan View of Mineralized Domains and Drilling
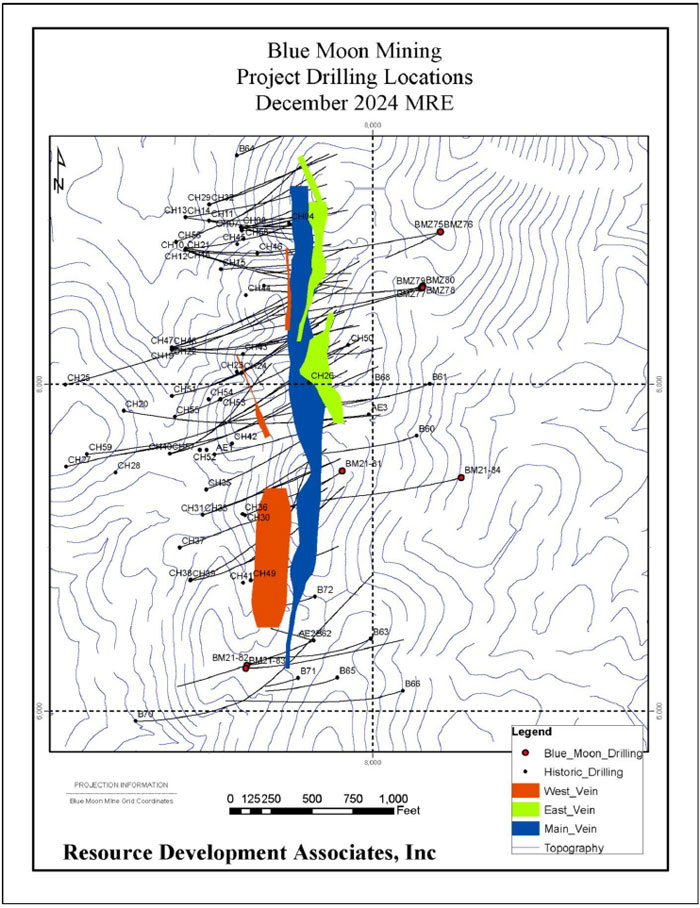
| Blue Moon Mine | 69 | March 2025 |
| |
Blue Moon Metals Inc. |
Figure 14.2
Long-Section View - 7500E Looking West - Mineralized Domains
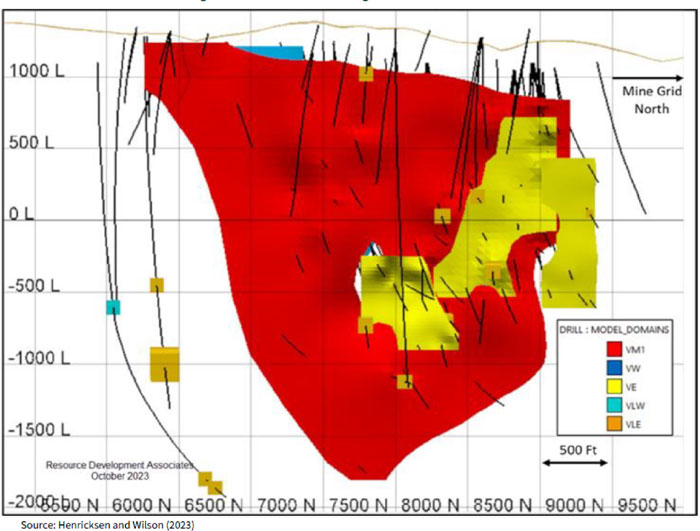
| Blue Moon Mine | 70 | March 2025 |
| |
Blue Moon Metals Inc. |
Figure 14.3
Long Section View - 7500E Looking East - Mineralized Domains
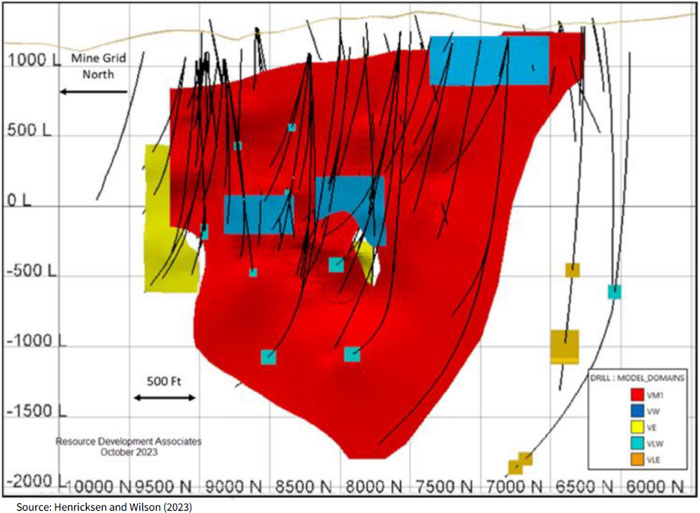
| Blue Moon Mine | 71 | March 2025 |
| |
Blue Moon Metals Inc. |
| 14.2 | DATABASE |
The database provided included a total of 87 drill holes, totaling 122,364.33 ft, of which 74 holes were used in the modeling of the mineralized domains and subsequent Mineral Resource Estimate. The drill database includes all drilling completed to date, including drill holes completed after 2018. The data received included a drill database with tables for assay and lithology. The database was verified and only one repeat assay interval was found and corrected. Assay values of 0.000 were representative of non-sampled intervals and subsequently changed to 0.001 for statistical purposes. Non-logged intervals were not used for domain modeling.
Domain solids were constructed by means of coding the drill database using cross-section interpretations for each hole included in the domain models. These codes were cross referenced with broader cross-section and long-section analysis for continuity. Assay intervals in the database are flagged with modeling codes based on inclusion within each domain. Database statistics are reported for each domain below. All non-coded assay intervals maintained a default value of (-1), referenced in the statistics as “Wall Rock” (Table 14.3).
Table 14.3
Drilling Database Assay Statistics
| Zone | Variable | Number | Mean | S.D. | Minimum | Maximum | C.V. | |||||||||||||||||||
| Au (opt) | 663 | 0.041 | 0.089 | 0.001 | 1.039 | 2.142 | ||||||||||||||||||||
| Ag (opt) | 663 | 1.490 | 3.505 | 0.001 | 40.300 | 2.353 | ||||||||||||||||||||
| All Mineralized Zones | Cu (%) | 663 | 0.714 | 1.178 | 0.001 | 10.700 | 1.649 | |||||||||||||||||||
| Pb (%) | 663 | 0.277 | 0.680 | 0.001 | 6.400 | 2.456 | ||||||||||||||||||||
| Zn (%) | 663 | 5.559 | 7.886 | 0.001 | 51.900 | 1.419 | ||||||||||||||||||||
| Au (opt) | 436 | 0.033 | 0.082 | 0.001 | 1.039 | 2.460 | ||||||||||||||||||||
| Ag (opt) | 436 | 1.152 | 3.402 | 0.001 | 40.300 | 2.953 | ||||||||||||||||||||
| Main Lens | Cu (%) | 436 | 0.776 | 1.229 | 0.001 | 10.700 | 1.585 | |||||||||||||||||||
| Pb (%) | 436 | 0.174 | 0.514 | 0.001 | 4.790 | 2.950 | ||||||||||||||||||||
| Zn (%) | 436 | 6.062 | 8.765 | 0.001 | 51.900 | 1.446 | ||||||||||||||||||||
| Au (opt) | 62 | 0.023 | 0.048 | 0.001 | 0.295 | 2.040 | ||||||||||||||||||||
| Ag (opt) | 62 | 0.953 | 2.028 | 0.012 | 11.800 | 2.128 | ||||||||||||||||||||
| Western Lenses | Cu (%) | 62 | 0.682 | 0.807 | 0.005 | 4.840 | 1.182 | |||||||||||||||||||
| Pb (%) | 62 | 0.446 | 1.005 | 0.005 | 4.870 | 2.252 | ||||||||||||||||||||
| Zn (%) | 62 | 3.678 | 4.554 | 0.010 | 23.000 | 1.238 | ||||||||||||||||||||
| Au (opt) | 165 | 0.070 | 0.109 | 0.001 | 1.032 | 1.568 | ||||||||||||||||||||
| Ag (opt) | 165 | 2.584 | 3.954 | 0.001 | 33.250 | 1.530 | ||||||||||||||||||||
| Eastern Lenses | Cu (%) | 165 | 0.563 | 1.142 | 0.001 | 7.200 | 2.028 | |||||||||||||||||||
| Pb (%) | 165 | 0.485 | 0.837 | 0.001 | 6.400 | 1.725 | ||||||||||||||||||||
| Zn (%) | 165 | 4.934 | 6.055 | 0.001 | 30.000 | 1.227 | ||||||||||||||||||||
| Au (opt) | 1968 | 0.003 | 0.006 | 0.001 | 0.128 | 2.005 | ||||||||||||||||||||
| Ag (opt) | 1968 | 0.118 | 0.675 | 0.001 | 25.860 | 5.715 | ||||||||||||||||||||
| Wall Rock | Cu (%) | 1968 | 0.057 | 0.205 | 0.001 | 3.420 | 3.610 | |||||||||||||||||||
| Pb (%) | 1968 | 0.030 | 0.185 | 0.001 | 5.270 | 6.063 | ||||||||||||||||||||
| Zn (%) | 1968 | 0.378 | 1.360 | 0.001 | 33.100 | 3.603 | ||||||||||||||||||||
| Blue Moon Mine | 72 | March 2025 |
| |
Blue Moon Metals Inc. |
| 14.2.1 | Capping |
Main, East and West zones were evaluated for capping analysis. Assays were plotted using lognormal cumulative frequency plots (QFP) to investigate the presence of anomalous high grade outlier samples. QFP plots for each zone were compared to statistical models for capping using the cutoff of 3 standard deviations above the sample population mean. This statistical capping approach proved effective in visual comparison with the mineralized zone QFP plots but was anomalously low for the Waste zone due to the large presence of samples at the lower detection limit, or non-logged value of 0.001 for all metals’ grades. Capping values were assigned in the assay database prior to compositing. Capped drill database’s statistics were then recorded, along with the number of assays capped (Table 14.4).
Table 14.4
Drill Database Capping Values
| Zone | Variable | Cap Value | Number Capped | |||||||
| Au (opt) | 0.279 | 8 | ||||||||
| Ag (opt) | 11.359 | 9 | ||||||||
| Main Lens | Cu (%) | 4.462 | 11 | |||||||
| Pb (%) | 1.715 | 8 | ||||||||
| Zn (%) | 32.359 | 12 | ||||||||
| Au (opt) | 0.166 | 2 | ||||||||
| Ag (opt) | 7.036 | 2 | ||||||||
| Western Lenses | Cu (%) | 3.103 | 1 | |||||||
| Pb (%) | 3.460 | 3 | ||||||||
| Zn (%) | 17.339 | 2 | ||||||||
| Au (opt) | 0.397 | 2 | ||||||||
| Ag (opt) | 14.445 | 2 | ||||||||
| Eastern Lenses | Cu (%) | 3.991 | 5 | |||||||
| Pb (%) | 2.997 | 2 | ||||||||
| Zn (%) | 23.099 | 5 | ||||||||
| Au (opt) | 0.100 | 2 | ||||||||
| Ag (opt) | 4.000 | 5 | ||||||||
| Wall Rock | Cu (%) | 1.500 | 8 | |||||||
| Pb (%) | 1.000 | 4 | ||||||||
| Zn (%) | 9.000 | 4 | ||||||||
| Blue Moon Mine | 73 | March 2025 |
| |
Blue Moon Metals Inc. |
Table 14.5 shows key statistics for the capped drill hole assay database.
Table 14.5
Capped Drill Database Assay Statistics
| Zone | Variable | Number | Mean | S.D. | Minimum | Maximum | C.V. | |||||||||||||||||||
| Au (opt) | 663 | 0.038 | 0.063 | 0.001 | 0.397 | 1.690 | ||||||||||||||||||||
| Ag (opt) | 663 | 1.318 | 2.398 | 0.001 | 14.445 | 1.820 | ||||||||||||||||||||
| All Mineralized Zones | Cu (%) | 663 | 0.668 | 0.957 | 0.001 | 4.462 | 1.434 | |||||||||||||||||||
| Pb (%) | 663 | 0.250 | 0.544 | 0.001 | 3.406 | 2.181 | ||||||||||||||||||||
| Zn (%) | 663 | 5.361 | 7.087 | 0.001 | 32.359 | 1.322 | ||||||||||||||||||||
| Au (opt) | 436 | 0.029 | 0.054 | 0.001 | 0.279 | 1.851 | ||||||||||||||||||||
| Ag (opt) | 436 | 0.957 | 1.979 | 0.001 | 11.359 | 2.067 | ||||||||||||||||||||
| Main Lense | Cu (%) | 436 | 0.732 | 1.019 | 0.001 | 4.462 | 1.392 | |||||||||||||||||||
| Pb (%) | 436 | 0.147 | 0.354 | 0.001 | 1.715 | 2.407 | ||||||||||||||||||||
| Zn (%) | 436 | 5.832 | 7.849 | 0.001 | 32.359 | 1.346 | ||||||||||||||||||||
| Au (opt) | 62 | 0.021 | 0.035 | 0.001 | 0.166 | 1.690 | ||||||||||||||||||||
| Ag (opt) | 62 | 0.837 | 1.490 | 0.012 | 7.036 | 1.781 | ||||||||||||||||||||
| Western Lenses | Cu (%) | 62 | 0.654 | 0.682 | 0.005 | 3.103 | 1.043 | |||||||||||||||||||
| Pb (%) | 62 | 0.399 | 0.824 | 0.005 | 3.406 | 2.062 | ||||||||||||||||||||
| Zn (%) | 62 | 3.566 | 4.139 | 0.010 | 17.339 | 1.161 | ||||||||||||||||||||
| Au (opt) | 165 | 0.066 | 0.083 | 0.001 | 0.397 | 1.262 | ||||||||||||||||||||
| Ag (opt) | 165 | 2.450 | 3.197 | 0.001 | 14.445 | 1.305 | ||||||||||||||||||||
| Eastern Lenses | Cu (%) | 165 | 0.503 | 0.854 | 0.001 | 3.991 | 1.698 | |||||||||||||||||||
| Pb (%) | 165 | 0.464 | 0.722 | 0.001 | 2.997 | 1.558 | ||||||||||||||||||||
| Zn (%) | 165 | 4.789 | 5.521 | 0.001 | 23.099 | 1.153 | ||||||||||||||||||||
| Au (opt) | 1968 | 0.003 | 0.006 | 0.001 | 0.100 | 1.916 | ||||||||||||||||||||
| Ag (opt) | 1968 | 0.105 | 0.322 | 0.001 | 4.000 | 3.079 | ||||||||||||||||||||
| Wall Rock | Cu (%) | 1968 | 0.053 | 0.159 | 0.001 | 1.500 | 3.022 | |||||||||||||||||||
| Pb (%) | 1968 | 0.025 | 0.086 | 0.001 | 1.000 | 3.389 | ||||||||||||||||||||
| Zn (%) | 1968 | 0.347 | 0.859 | 0.001 | 9.000 | 2.476 | ||||||||||||||||||||
Figure 14.4 and Figure 14.5 illustrate the relationship of the mineralized domains to the supporting drill holes.
| Blue Moon Mine | 74 | March 2025 |
| |
Blue Moon Metals Inc. |
Figure 14.4
Cross-Section through Drill Hole CH57 Showing Mineralized Domain Solids Coded to Assay Intervals
(Looking North, Mine Grid for Scale)
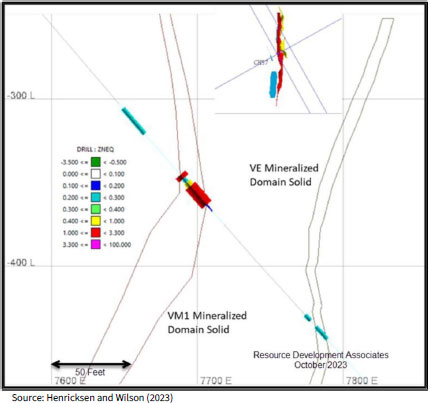
| Blue Moon Mine | 75 | March 2025 |
| |
Blue Moon Metals Inc. |
Figure 14.5
Cross-Section View 8100N Looking North - Mineralized Domain Solids
(Black Lines Indicate Drill Hole Traces)
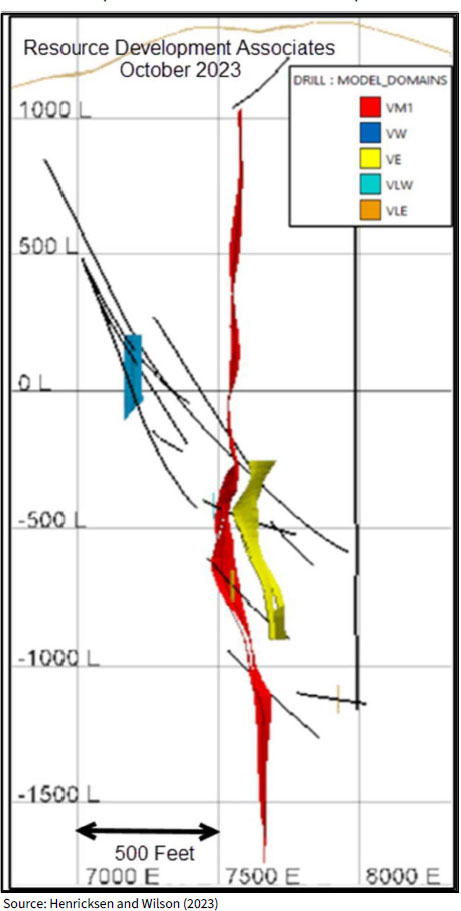
| Blue Moon Mine | 76 | March 2025 |
| |
Blue Moon Metals Inc. |
| 14.3 | COMPOSITING |
Five-foot run-length composites were developed for grade estimation through the mineral deposit. Compositing intervals were broken at the contact of the mineralized domain solids to maintain the integrity of the coded assay intercepts within the mineralized domains. Composite domain codes recorded for use in the MRE are presented in Table 14.6.
Table
14.6
Composite Database Statistics
| Zone | Variable | Number | Mean | S.D. | Minimum | Maximum | C.V. | |||||||||||||||||||
| Au (opt) | 371 | 0.033 | 0.054 | 0.001 | 0.279 | 1.629 | ||||||||||||||||||||
| Ag (opt) | 371 | 0.952 | 1.788 | 0.001 | 11.359 | 1.878 | ||||||||||||||||||||
| Main Lens | Cu (%) | 371 | 0.691 | 0.909 | 0.001 | 4.462 | 1.316 | |||||||||||||||||||
| Pb (%) | 371 | 0.144 | 0.321 | 0.001 | 1.715 | 2.230 | ||||||||||||||||||||
| Zn (%) | 371 | 5.540 | 7.112 | 0.001 | 32.359 | 1.284 | ||||||||||||||||||||
| Au (opt) | 61 | 0.019 | 0.027 | 0.001 | 0.124 | 1.446 | ||||||||||||||||||||
| Ag (opt) | 61 | 0.696 | 1.129 | 0.012 | 5.017 | 1.623 | ||||||||||||||||||||
| Western Lenses | Cu (%) | 61 | 0.652 | 0.622 | 0.008 | 3.103 | 0.955 | |||||||||||||||||||
| Pb (%) | 61 | 0.337 | 0.620 | 0.005 | 3.406 | 1.841 | ||||||||||||||||||||
| Zn (%) | 61 | 3.407 | 3.692 | 0.020 | 15.705 | 1.084 | ||||||||||||||||||||
| Au (opt) | 144 | 0.069 | 0.076 | 0.001 | 0.348 | 1.096 | ||||||||||||||||||||
| Ag (opt) | 144 | 2.648 | 3.178 | 0.005 | 14.266 | 1.200 | ||||||||||||||||||||
| Eastern Lenses | Cu (%) | 144 | 0.512 | 0.763 | 0.005 | 3.991 | 1.492 | |||||||||||||||||||
| Pb (%) | 144 | 0.489 | 0.700 | 0.003 | 2.799 | 1.431 | ||||||||||||||||||||
| Zn (%) | 144 | 5.204 | 5.380 | 0.024 | 23.099 | 1.034 | ||||||||||||||||||||
| Au (opt) | 22,738 | 0.001 | 0.001 | 0.001 | 0.039 | 1.088 | ||||||||||||||||||||
| Ag (opt) | 22,738 | 0.007 | 0.058 | 0.001 | 2.150 | 7.928 | ||||||||||||||||||||
| Wall Rock | Cu (%) | 22,738 | 0.004 | 0.029 | 0.001 | 1.020 | 7.239 | |||||||||||||||||||
| Pb (%) | 22,738 | 0.003 | 0.016 | 0.001 | 0.783 | 6.344 | ||||||||||||||||||||
| Zn (%) | 22,738 | 0.022 | 0.147 | 0.001 | 4.100 | 6.703 | ||||||||||||||||||||
| 14.4 | DENSITY |
A total of 297 specific gravity measurements are stored in the database. Density measurements are stored in the model based on the grade of total sulphide mineralization. Specific gravity determinations were binned into five grade categories based on the combined assay value of (Cu % + Pb % + Zn %) and a default Wall Rock value for non-mineralized domain sample intervals. Table 14.7 presents tonnage factor determinations based on total sulphide content.
Specific gravity measurements were then converted into their Imperial tonnage factor equivalents for use in the subsequent reporting of the MRE. Tonnage factors are assigned to blocks in the block model according to the following formula:
Tonnage Factor (ton / cu ft) = 1 / (2000 lbs/ton / (62.4 lbs/cu.ft. * SG))
| Blue Moon Mine | 77 | March 2025 |
| |
Blue Moon Metals Inc. |
Table 14.7
Tonnage Factor Determinations from Specific Gravity Values Based on Total Sulphide Content
| Zn%
+ Cu% + Pb% Range | Sample Count | Low SG | High SG | Average SG | Tonnage
Factor (TF) (tons/cu. ft.) | |||||||||||||||
| 0.0 <= 1.0 | 65 | 2.53 | 4.48 | 3.07 | 0.0958 | |||||||||||||||
| 1.0 <= 2.0 | 46 | 2.67 | 4.37 | 3.11 | 0.0970 | |||||||||||||||
| 2.0 <= 10.0 | 100 | 2.59 | 4.69 | 3.26 | 0.1017 | |||||||||||||||
| 10.0 <= 20.0 | 50 | 2.86 | 4.25 | 3.41 | 0.1064 | |||||||||||||||
| >20 | 33 | 3.32 | 4.55 | 3.75 | 0.1170 | |||||||||||||||
| Wall Rock | 32 | - | - | 3.16 | 0.0986 | |||||||||||||||
| 14.5 | BLOCK MODEL |
A single block model was created to encompass all three mineralized domain solids. Due to the thickness variability of the mineralized zones, the block model was sub-blocked to better conform to locally thin areas of the solids. Smaller blocks allow for a more accurate representation of the modeled domains. Parent block dimensions are 20 ft x 20 ft x 20 ft in the Wall Rock domain but are sub-blocked and forced to a maximum of 10 ft x 10 ft in the Y and Z dimensions on the contact of - and within - the mineralized domains. Sub-block thicknesses in the X dimension can range from 0.1 ft up to 10 ft in order to respect local variations in domain thickness.
Blocks were populated with estimation and default grade variables for subsequent grade estimates. Table 14.8 and Table 14.9 present the location and dimensions of the model and blocks, respectively.
Table 14.8
Block Model Location and Dimensions
| Model Origin | Coordinates | Offset | Length (Ft) | ||||||
| East | 7000 | East | 1200 | ||||||
| North | 5600 | North | 4000 | ||||||
| Elevation | -2000 | Elevation | 3500 |
| Table 14.9 | |||||||||||||||||||||||||||||||||||||
| Block Model - Block Dimensions | |||||||||||||||||||||||||||||||||||||
| Block | Bearing | Dip | Plunge | Block X | Block Y | Block Z | Sub-Block | Sub-Block | Sub-Block | ||||||||||||||||||||||||||||
| Class | (°) | (°) | (°) | (ft) | (ft) | (ft) | X (ft) | Y (ft) | Z (ft) | ||||||||||||||||||||||||||||
| Main | 90 | 0 | 0 | 20 | 20 | 20 | - | - | - | ||||||||||||||||||||||||||||
| Sub-Block | 90 | 0 | 0 | - | - | - | 0.1 - 10 | 10 | 10 | ||||||||||||||||||||||||||||
| 14.6 | GRADE ESTIMATION |
Metal grades for the MRE were estimated using the common Inverse Distance Cubed (ID3) estimation methodology. Single pass ID3 estimates were run for each of the composite metal values in each of the mineralized domain solids. Only samples coded for inclusion within a specific domain solid were used for estimations within that domain solid. Wall rock coded blocks were estimated but not included in the MRE. Visual and statistical inspections of the grade distribution within the block model show the ID3 model to well represent actual assay values versus estimated grade values throughout all three mineralized domains. Search parameters are summarized in Table 14.10.
| Blue Moon Mine | 78 | March 2025 |
| |
Blue Moon Metals Inc. |
Table
14.10
Summary of Search Parameters
| Zone | Variable | Pass | Az/Dip (°) |
Dist. (ft.) |
Az/Dip (°) |
Dist. (ft.) |
Az/Dip (°) |
Dist. (ft.) | ||||||||
| Zn | 1 | 90/0 | 600 | 0/0 | 600 | 0/-90 | 150 | |||||||||
| Main, West and East | Cu | 1 | 90/0 | 600 | 0/0 | 600 | 0/-90 | 150 | ||||||||
| Ag | 1 | 90/0 | 600 | 0/0 | 600 | 0/-90 | 150 | |||||||||
| Au | 1 | 90/0 | 600 | 0/0 | 600 | 0/-90 | 150 | |||||||||
| Wall Rock | Zn, Cu, Ag, Au, | 1 | Omni Directional | 200 | - | - | ||||||||||
| Pb | 1 | Omni Directional | 200 | - | - | |||||||||||
Zinc Equivalent Percent (ZnEq %) values were calculated from the raw estimated metals values in the grade estimation. Due to the large number of estimated metals, it is common for a polymetallic deposit to use a combined value variable to describe the total value of mineralized material within an estimate. ZnEq % is based on each estimated metal selling price and assumed recovery factor on a block-by-block basis. These are combined to form an overall value factor for each metal which is subsequently used in the calculation, as shown in Table 14.11. Notwithstanding its potential for eventual economic extraction, for the purposes of this preliminary economic assessment lead was assumed not payable and so makes no contribution to ZnEq % grade.
Table 14.11
Zinc Equivalent Percent (ZnEq %) Parameters Used for ZnEq % Calculation
| Variable | Metal Price | Recovery (%) | Factor | |||||||||
| Zinc | US$1.25/pound | 95.3 | 23.83 | |||||||||
| Copper | US$4.25/pound | 93.1 | 78.20 | |||||||||
| Lead | US$0.90/pound | 0 | 0 | |||||||||
| Silver | US$27.00/oz | 94.3 | 25.46 | |||||||||
| Gold | US$2,200.00/oz | 86.2 | 1,896.40 | |||||||||
ZnEq % is calculated as follows:
ZnEq = Zn% + ((Cu% * 78.20)+(Pb% * 0)+(Ag opt * 25.46)+(Au opt * 1896.40))/23.83
Figure 14.6, Figure 14.7 and Figure 14.8 show the resulting Zinc Equivalent Grades for the Main Zone, Eastern and Western Lenses, respectively.
| Blue Moon Mine | 79 | March 2025 |
| |
Blue Moon Metals Inc. |
Figure 14.6
Zinc Equivalent Grade Estimation of Main Zone - Long Section 8000E Looking West
Drill Traces as Black Lines and Resource Classification Boundary as Polygon
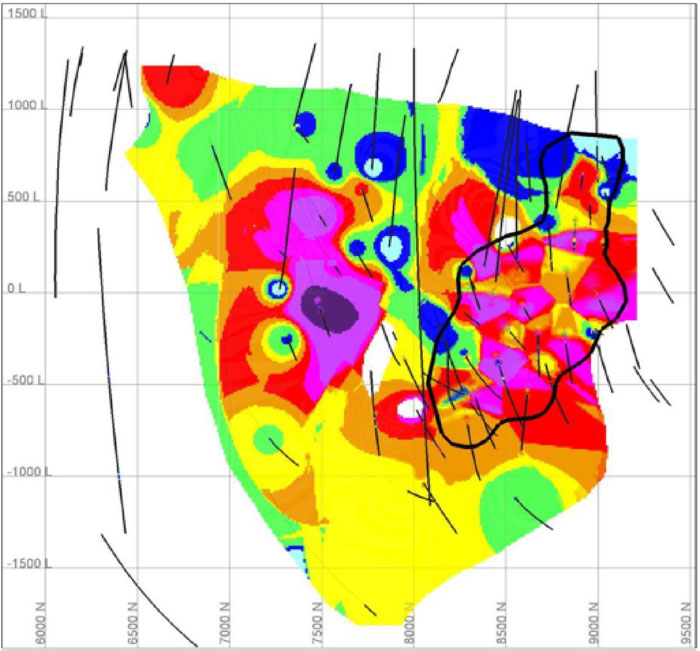
| Blue Moon Mine | 80 | March 2025 |
| |
Blue Moon Metals Inc. |
Figure 14.7
Zinc Equivalent Grade Estimation of Eastern Lenses - Long Section 8000E Looking West
Drill Traces as Black Lines and Resource Classification Boundary as Polygon
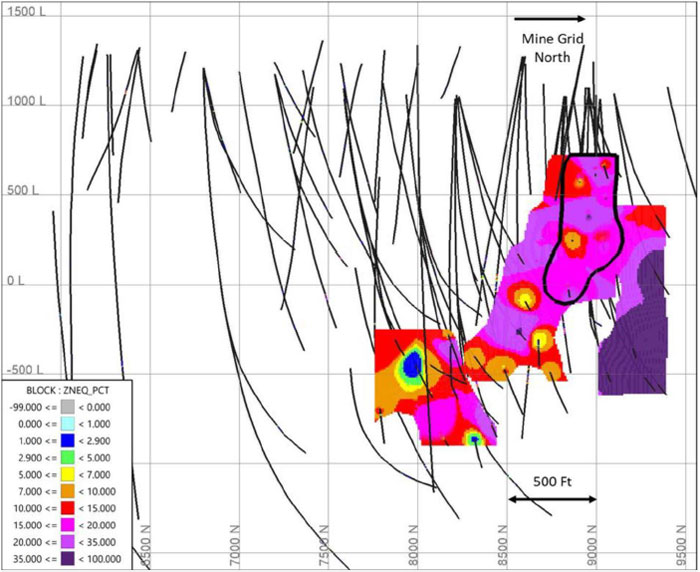
| Blue Moon Mine | 81 | March 2025 |
| |
Blue Moon Metals Inc. |
Figure 14.8
Zinc Equivalent Grade Estimation of Western Lenses - Long Section 7000E Looking East
Drill Traces as Black Lines and Resource Classification Boundary as Polygon
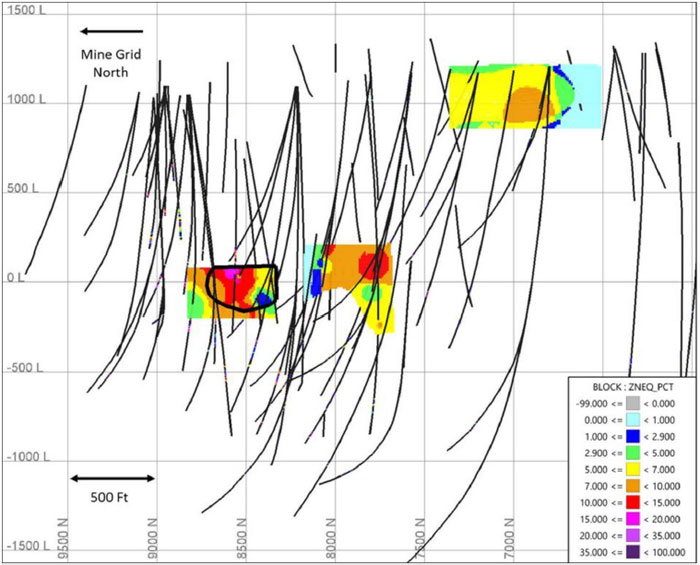
| 14.6.1 | Grade Estimation Verification |
The ID3 grade estimate model was compared visually with nearest neighbour estimates and found to align well with both the model as well as composite grades. In addition to visual methods, the grade estimate model was subjected to statistical analyses to compare block estimated grades versus original composite grades. Composite samples were flagged with corresponding block estimated grades. These results were plotted on scatter plots and trendlines analyzed in Figure 14.9, Figure 14.10, and Figure 14.11.
| Blue Moon Mine | 82 | March 2025 |
| |
Blue Moon Metals Inc. |
Figure 14.9
Main Zone Block Estimated Grades vs Capped Composite Grades - Zn %
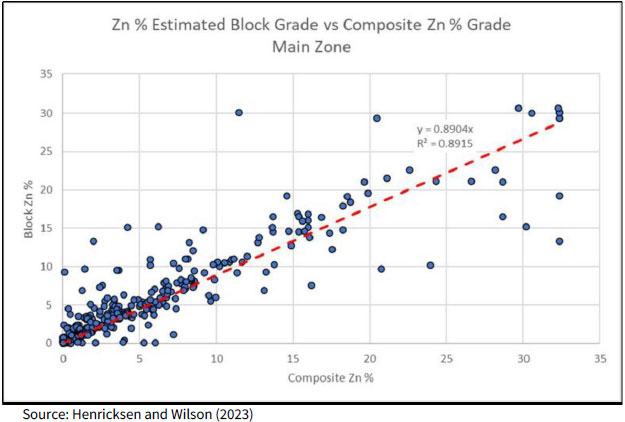
Figure 14.10
East Lenses Block Estimated Grades vs Capped Composite Grades - Zn %
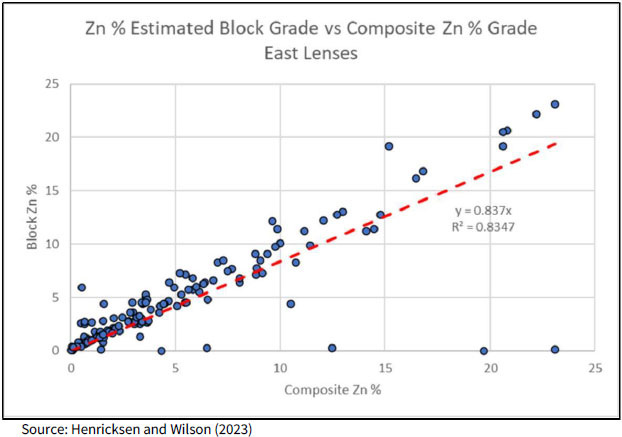
| Blue Moon Mine | 83 | March 2025 |
| |
Blue Moon Metals Inc. |
Figure 14.11
Main Zone Block Estimated Grades vs Composite Grades - Ag OPT
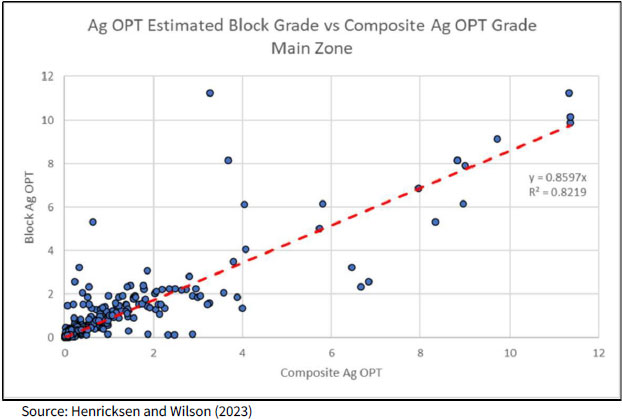
Overall, the block model grade estimate shows a lower average grade at the point of composites. This can be attributed to the grade estimation taking into account spatially close composites of lower grade material within the mineralized domain solid and not “washing out” high grade mineralization.
| 14.7 | RESOURCE CLASSIFICATION |
Mineral Resources in this Technical Report are classified according to CIM Definition Standards, which are incorporated by reference in NI 43-101. Mineralization at Blue Moon has been classified as Inferred Mineral Resources and Indicated Mineral Resources based on increasing levels of confidence in data density throughout the mineralized domain solids. The addition of new drill data post 2018 has given the author additional confidence in the MRE and Resource Classifications.
Classification of mineral resources are based on the average distance to samples on a block-by-block basis. Because grade estimates were made using distal samples, as well as more densely spaced samples, polygons were digitized in section around contiguous zones showing estimates made with an average distance to sample of approximately 150 ft or less in areas of continuous drill intercepts, eliminating spatial outliers. Polygons were then used to construct triangulated solids which were used to flag the block model. Blocks included in these solids were classified as Indicated Mineral Resources. This process was carried out on the three mineralized domain solid zones independently.
| Blue Moon Mine | 84 | March 2025 |
| |
Blue Moon Metals Inc. |
Figure 14.12
Long-Section View - Main Zone - Average Distance to Sample and
Indicated Mineral Resource Domain Boundary (Red) - 8000E Looking West
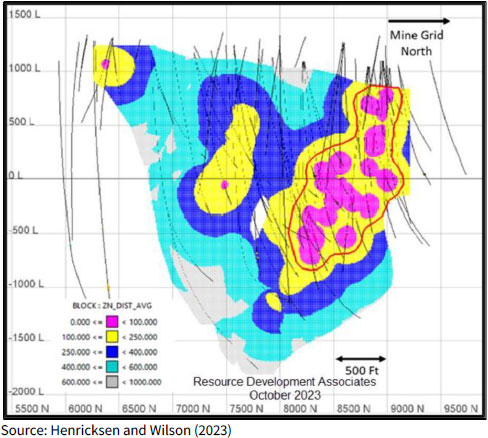
Figure 14.13
Long-Section View – East Lenses - Average Distance to Sample and
Indicated Mineral Resource Domain Boundary (Red) - 8000E Looking West
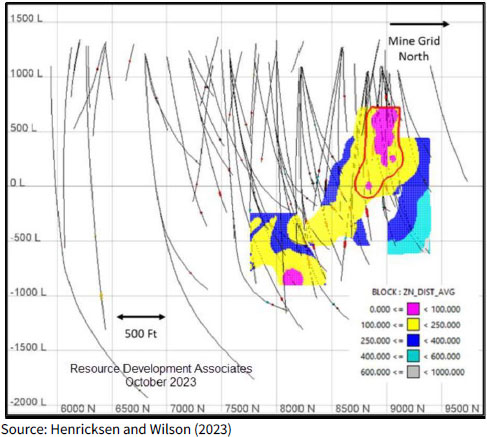
| Blue Moon Mine | 85 | March 2025 |
| |
Blue Moon Metals Inc. |
Figure 14.14
Long-Section View – West Lenses - Average Distance to Sample and
Indicated Mineral Resource Domain Boundary (Red) - 7000E Looking East
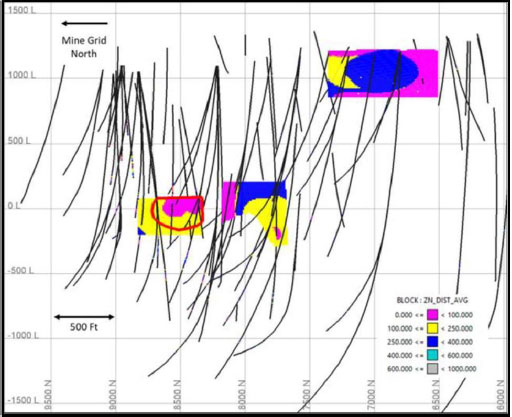
Figure 14.15
Main Zone Block Resource Classification (Red as Indicated Mineral Resource)
Long-Section 8000E Looking West
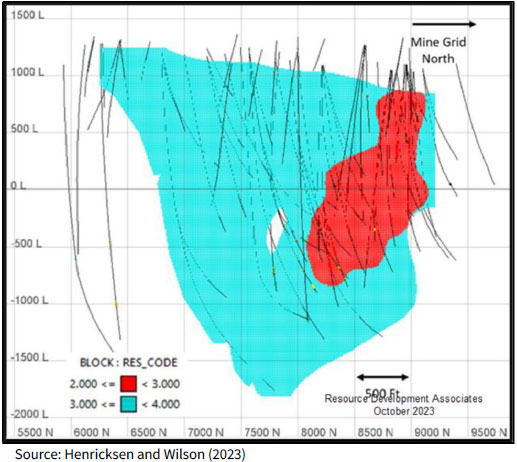
| Blue Moon Mine | 86 | March 2025 |
| |
Blue Moon Metals Inc. |
Figure 14.16
East Lenses Block Resource Classification (Red as Indicated Mineral Resource)
Long-Section 8000E Looking West
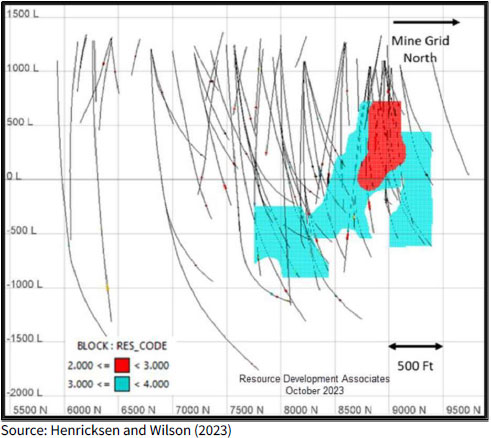
Figure 14.17
West Lenses Block Resource Classification (Red as Indicated Mineral Resource)
Long-Section 7000E Looking East
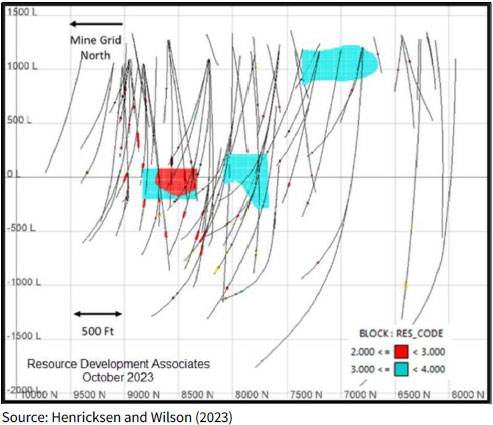
| Blue Moon Mine | 87 | March 2025 |
| |
Blue Moon Metals Inc. |
| 14.8 | Mineral Resource Estimate |
Tables in this Section detail the Mineral Resource Estimate for the Blue Moon Project as well as cutoff sensitivity analyses.
Table 14.12 summarizes the Blue Moon Mineral Resource Estimate classified according to CIM definition standards. Reasonable prospects of eventual economic extraction, as defined in this section of the Technical Report, assume underground mining, surface mill processing and production of zinc and copper concentrates. Mineral Resources are reported at a zinc equivalent cutoff grade of 2.9% ZnEq. Based on the stated metal prices and recoveries, zinc equivalent grade is defined as:
ZnEq = Zn% + ((Cu% * 78.20)+(Pb% * 0)+(Ag opt * 25.46)+(Au opt * 1896.40))/23.83
Table 14.12
Blue Moon Mineral Resource Estimate, Effective as of December 24, 2024
at a Cutoff Grade of 2.9% ZnEq
| Grade Above Cutoff | Contained Metal | ||||||||||||||||||||||||||||||||||||||
| ZONE | Tons > Cutoff | Zn % | Cu % | Pb % | Ag Oz/Ton | Au Oz/Ton | ZnEq % | Zn Mlbs | Cu Mlbs | Pb Mlbs | Ag MOz | Au Moz | |||||||||||||||||||||||||||
| Indicated | Main | 3,073,000 | 0.04 | ||||||||||||||||||||||||||||||||||||
| East | 498,000 | 6.64 | 0.47 | 0.63 | 3.72 | 0.09 | 18.99 | 66.15 | 4.67 | 6.29 | 1.85 | 0.04 | |||||||||||||||||||||||||||
| West | 78,000 | 4.41 | 0.62 | 0.33 | 0.93 | 0.03 | 9.50 | 6.91 | 0.97 | 0.52 | 0.07 | 0.00 | |||||||||||||||||||||||||||
| All Zones | 3,650,000 | 5.97 | 0.73 | 0.23 | 1.49 | 0.043 | 13.46 | 435.83 | 53.59 | 16.90 | 5.43 | 0.159 | |||||||||||||||||||||||||||
| Inferred | Main | 3,261,000 | 5.68 | 0.52 | 0.23 | 1.15 | 0.04 | 11.41 | 370.27 | 33.65 | 14.74 | 3.76 | 0.11 | ||||||||||||||||||||||||||
| East | 994,000 | 5.04 | 0.59 | 0.56 | 2.43 | 0.07 | 15.49 | 100.11 | 11.80 | 11.20 | 2.42 | 0.07 | |||||||||||||||||||||||||||
| West | 173,000 | 1.98 | 0.73 | 0.22 | 0.40 | 0.02 | 6.28 | 6.84 | 2.52 | 0.74 | 0.07 | 0.00 | |||||||||||||||||||||||||||
| All Zones | 4,428,000 | 5.39 | 0.54 | 0.30 | 1.41 | 0.043 | 12.12 | 477.22 | 47.97 | 26.68 | 6.25 | 0.190 | |||||||||||||||||||||||||||
Notes:
| (1) | Scott Wilson, CPG, President of RDA is responsible for this mineral resource estimate and is an independent Qualified Person as such term is defined by NI 43-101. |
| (2) | Reasonable prospects of eventual economic extraction were assessed by enclosing the mineralized material in the block model estimate in 3D wireframe shapes that were constructed based upon geological interpretations as well as adherence to a minimum mining unit with geometry appropriate for underground mining. |
| (3) | The cutoff grade of 2.9% ZnEq considered parameters of: |
| a. | Metal selling prices: Au-US$2,200/oz, Ag-US$27/oz, Cu-US$4.25/lb., Pb-US$0.90/lb., Zn-US$1.25/lb. |
| b. | Recoveries of Au 86.2%, Ag 94.3%, Cu 93.1%, Pb 0%, Zn 95.3% |
| c. | Costs including mining, processing, general and administrative (G&A). |
| (4) | Zinc Equivalent Grade (“ZnEq”) is estimated by the formula: ZnEq % is calculated as follows: |
ZnEq = Zn% + ((Cu% * 78.20)+(Pb% * 0)+(Ag opt * 25.46)+(Au opt * 1896.40))/23.83.
| (5) | Mineral resources are not mineral reserves and do not have demonstrated economic viability. |
| (6) | Figures may not add up due to rounding. |
| (7) | Tonnages shown in Table 14.12 are short tons. |
| (8) | The QP knows of no other legal, political, environmental, or other risks that could materially affect the potential development of the mineral resources for the Project. |
| 14.9 | Cutoff Grade Sensitivity Analysis |
Mineral Resources are sensitive to the selection of a cutoff grade. The tables in this section of the report highlight the effect of cutoff grade analysis on the reported Mineral Resource Estimates. The reader is cautioned not to misconstrue either Table 14.13 (Indicated) or Table 14.14 (Inferred) as Mineral Resource Estimates. The tabled quantities, as well as the grade-tonnage chart in Figure 14.18, are presented only to show sensitivity of the resource model to the selection of various cutoff grades reported in ZnEq %. Mineral Resources are not Mineral Reserves and do not have demonstrated economic viability. The QP has reviewed the cut-off grades used in the sensitivity analysis, and it is the opinion of the QP that they meet the test for reasonable prospects of eventual economic extraction at varying metal prices or other underlying parameters used to calculate the cut-off grade.
| Blue Moon Mine | 88 | March 2025 |
| |
Blue Moon Metals Inc. |
Table 14.13
ZnEq % Cutoff Sensitivity Analysis - Indicated Mineral Resource Classification by Mineralized Zone
| ALL ZONES | INDICATED | Grade Above Cutoff | Contained Metal | ||||||||||||||||||||||||||||||||||||||||||||||
| Cutoff > ZnEq% | Tons > Cutoff | Zn % | Cu % | Pb % | Ag Oz/Ton | Au Oz/Ton | ZnEq % | Zn Mlbs | Cu Mlbs | Pb Mlbs | Ag MOz | Au Moz | |||||||||||||||||||||||||||||||||||||
| 2.6 | 3,664,000 | 5.95 | 0.73 | 0.23 | 1.48 | 0.043 | 13.42 | 436.24 | 53.68 | 16.94 | 5.44 | 0.159 | |||||||||||||||||||||||||||||||||||||
| 2.7 | 3,660,000 | 5.96 | 0.73 | 0.23 | 1.48 | 0.043 | 13.43 | 436.13 | 53.62 | 16.93 | 5.43 | 0.159 | |||||||||||||||||||||||||||||||||||||
| 2.8 | 3,655,000 | 5.96 | 0.73 | 0.23 | 1.49 | 0.043 | 13.45 | 435.97 | 53.60 | 16.91 | 5.43 | 0.159 | |||||||||||||||||||||||||||||||||||||
| 2.9 | 3,650,000 | 5.97 | 0.73 | 0.23 | 1.49 | 0.043 | 13.46 | 435.83 | 53.59 | 16.90 | 5.43 | 0.159 | |||||||||||||||||||||||||||||||||||||
| 3 | 3,645,000 | 5.98 | 0.73 | 0.23 | 1.49 | 0.043 | 13.47 | 435.68 | 53.57 | 16.88 | 5.43 | 0.158 | |||||||||||||||||||||||||||||||||||||
| 3.1 | 3,639,000 | 5.98 | 0.74 | 0.23 | 1.49 | 0.043 | 13.49 | 435.57 | 53.56 | 16.93 | 5.43 | 0.158 | |||||||||||||||||||||||||||||||||||||
| 3.2 | 3,634,000 | 5.99 | 0.74 | 0.23 | 1.49 | 0.043 | 13.50 | 435.42 | 53.53 | 16.91 | 5.43 | 0.158 | |||||||||||||||||||||||||||||||||||||
| 3.3 | 3,625,000 | 6.00 | 0.74 | 0.23 | 1.50 | 0.043 | 13.53 | 435.12 | 53.46 | 16.88 | 5.43 | 0.158 | |||||||||||||||||||||||||||||||||||||
| 3.4 | 3,617,000 | 6.01 | 0.74 | 0.23 | 1.50 | 0.044 | 13.55 | 434.92 | 53.39 | 16.91 | 5.43 | 0.157 | |||||||||||||||||||||||||||||||||||||
| 3.5 | 3,609,000 | 6.02 | 0.74 | 0.23 | 1.50 | 0.044 | 13.58 | 434.67 | 53.33 | 16.89 | 5.43 | 0.157 | |||||||||||||||||||||||||||||||||||||
| MAIN ZONE | INDICATED | Grade Above Cutoff | Contained Metal | ||||||||||||||||||||||||||||||||||||||||||||||
| Cutoff > ZnEq% | Tons > Cutoff | Zn % | Cu % | Pb % | Ag Oz/Ton | Au Oz/Ton | ZnEq % | Zn Mlbs | Cu Mlbs | Pb Mlbs | Ag MOz | Au Moz | |||||||||||||||||||||||||||||||||||||
| 2.6 | 3,087,000 | 5.88 | 0.78 | 0.16 | 1.14 | 0.037 | 12.62 | 363.15 | 48.03 | 10.13 | 3.51 | 0.114 | |||||||||||||||||||||||||||||||||||||
| 2.7 | 3,083,000 | 5.89 | 0.78 | 0.16 | 1.14 | 0.037 | 12.63 | 363.06 | 47.97 | 10.11 | 3.51 | 0.114 | |||||||||||||||||||||||||||||||||||||
| 2.8 | 3,078,000 | 5.90 | 0.78 | 0.16 | 1.14 | 0.037 | 12.65 | 362.90 | 47.96 | 10.10 | 3.51 | 0.114 | |||||||||||||||||||||||||||||||||||||
| 2.9 | 3,073,000 | 5.90 | 0.78 | 0.16 | 1.14 | 0.037 | 12.66 | 362.76 | 47.94 | 10.08 | 3.51 | 0.114 | |||||||||||||||||||||||||||||||||||||
| 3 | 3,068,000 | 5.91 | 0.78 | 0.16 | 1.14 | 0.037 | 12.68 | 362.63 | 47.93 | 10.06 | 3.51 | 0.114 | |||||||||||||||||||||||||||||||||||||
| 3.1 | 3,063,000 | 5.92 | 0.78 | 0.17 | 1.14 | 0.037 | 12.70 | 362.52 | 47.91 | 10.11 | 3.50 | 0.113 | |||||||||||||||||||||||||||||||||||||
| 3.2 | 3,058,000 | 5.93 | 0.78 | 0.17 | 1.15 | 0.037 | 12.71 | 362.38 | 47.89 | 10.09 | 3.50 | 0.113 | |||||||||||||||||||||||||||||||||||||
| 3.3 | 3,050,000 | 5.94 | 0.78 | 0.17 | 1.15 | 0.037 | 12.74 | 362.09 | 47.82 | 10.06 | 3.50 | 0.113 | |||||||||||||||||||||||||||||||||||||
| 3.4 | 3,042,000 | 5.95 | 0.79 | 0.17 | 1.15 | 0.037 | 12.76 | 361.90 | 47.75 | 10.10 | 3.50 | 0.113 | |||||||||||||||||||||||||||||||||||||
| 3.5 | 3,034,000 | 5.96 | 0.79 | 0.17 | 1.15 | 0.037 | 12.79 | 361.65 | 47.69 | 10.07 | 3.50 | 0.112 | |||||||||||||||||||||||||||||||||||||
| EAST ZONES | INDICATED | Grade Above Cutoff | Contained Metal | ||||||||||||||||||||||||||||||||||||||||||||||
| Cutoff > ZnEq% | Tons > Cutoff | Zn % | Cu % | Pb % | Ag Oz/Ton | Au Oz/Ton | ZnEq % | Zn Mlbs | Cu Mlbs | Pb Mlbs | Ag MOz | Au Moz | |||||||||||||||||||||||||||||||||||||
| 2.6 | 498,000 | 6.64 | 0.47 | 0.63 | 3.72 | 0.086 | 18.99 | 66.15 | 4.67 | 6.29 | 1.85 | 0.043 | |||||||||||||||||||||||||||||||||||||
| 2.7 | 498,000 | 6.64 | 0.47 | 0.63 | 3.72 | 0.086 | 18.99 | 66.15 | 4.67 | 6.29 | 1.85 | 0.043 | |||||||||||||||||||||||||||||||||||||
| 2.8 | 498,000 | 6.64 | 0.47 | 0.63 | 3.72 | 0.086 | 18.99 | 66.15 | 4.67 | 6.29 | 1.85 | 0.043 | |||||||||||||||||||||||||||||||||||||
| 2.9 | 498,000 | 6.64 | 0.47 | 0.63 | 3.72 | 0.086 | 18.99 | 66.15 | 4.67 | 6.29 | 1.85 | 0.043 | |||||||||||||||||||||||||||||||||||||
| 3 | 498,000 | 6.64 | 0.47 | 0.63 | 3.72 | 0.086 | 18.99 | 66.15 | 4.67 | 6.29 | 1.85 | 0.043 | |||||||||||||||||||||||||||||||||||||
| 3.1 | 498,000 | 6.64 | 0.47 | 0.63 | 3.72 | 0.086 | 18.99 | 66.15 | 4.67 | 6.29 | 1.85 | 0.043 | |||||||||||||||||||||||||||||||||||||
| 3.2 | 498,000 | 6.64 | 0.47 | 0.63 | 3.72 | 0.086 | 18.99 | 66.15 | 4.67 | 6.29 | 1.85 | 0.043 | |||||||||||||||||||||||||||||||||||||
| 3.3 | 498,000 | 6.64 | 0.47 | 0.63 | 3.72 | 0.086 | 18.99 | 66.15 | 4.67 | 6.29 | 1.85 | 0.043 | |||||||||||||||||||||||||||||||||||||
| 3.4 | 498,000 | 6.64 | 0.47 | 0.63 | 3.72 | 0.086 | 18.99 | 66.15 | 4.67 | 6.29 | 1.85 | 0.043 | |||||||||||||||||||||||||||||||||||||
| 3.5 | 498,000 | 6.64 | 0.47 | 0.63 | 3.72 | 0.086 | 18.99 | 66.15 | 4.67 | 6.29 | 1.85 | 0.043 | |||||||||||||||||||||||||||||||||||||
| WEST ZONES | INDICATED | Grade Above Cutoff | Contained Metal | ||||||||||||||||||||||||||||||||||||||||||||||
| Cutoff > ZnEq% | Tons > Cutoff | Zn % | Cu % | Pb % | Ag Oz/Ton | Au Oz/Ton | ZnEq % | Zn Mlbs | Cu Mlbs | Pb Mlbs | Ag MOz | Au Moz | |||||||||||||||||||||||||||||||||||||
| 2.6 | 79,000 | 4.38 | 0.62 | 0.33 | 0.93 | 0.025 | 9.43 | 6.94 | 0.98 | 0.52 | 0.07 | 0.002 | |||||||||||||||||||||||||||||||||||||
| 2.7 | 79,000 | 4.39 | 0.62 | 0.33 | 0.93 | 0.025 | 9.45 | 6.93 | 0.98 | 0.52 | 0.07 | 0.002 | |||||||||||||||||||||||||||||||||||||
| 2.8 | 79,000 | 4.40 | 0.62 | 0.33 | 0.93 | 0.026 | 9.49 | 6.92 | 0.98 | 0.52 | 0.07 | 0.002 | |||||||||||||||||||||||||||||||||||||
| 2.9 | 78,000 | 4.41 | 0.62 | 0.33 | 0.93 | 0.026 | 9.50 | 6.91 | 0.97 | 0.52 | 0.07 | 0.002 | |||||||||||||||||||||||||||||||||||||
| 3 | 78,000 | 4.42 | 0.62 | 0.33 | 0.94 | 0.026 | 9.53 | 6.90 | 0.97 | 0.52 | 0.07 | 0.002 | |||||||||||||||||||||||||||||||||||||
| 3.1 | 78,000 | 4.42 | 0.62 | 0.33 | 0.94 | 0.026 | 9.54 | 6.90 | 0.97 | 0.52 | 0.07 | 0.002 | |||||||||||||||||||||||||||||||||||||
| 3.2 | 78,000 | 4.43 | 0.62 | 0.33 | 0.94 | 0.026 | 9.56 | 6.89 | 0.97 | 0.52 | 0.07 | 0.002 | |||||||||||||||||||||||||||||||||||||
| 3.3 | 78,000 | 4.44 | 0.63 | 0.34 | 0.94 | 0.026 | 9.58 | 6.88 | 0.97 | 0.52 | 0.07 | 0.002 | |||||||||||||||||||||||||||||||||||||
| 3.4 | 77,000 | 4.45 | 0.63 | 0.34 | 0.95 | 0.026 | 9.61 | 6.87 | 0.97 | 0.52 | 0.07 | 0.002 | |||||||||||||||||||||||||||||||||||||
| 3.5 | 77,000 | 4.46 | 0.63 | 0.34 | 0.95 | 0.026 | 9.62 | 6.87 | 0.97 | 0.52 | 0.07 | 0.002 | |||||||||||||||||||||||||||||||||||||
| Blue Moon Mine | 89 | March 2025 |
| |
Blue Moon Metals Inc. |
Table 14.14
ZnEq % Cutoff Sensitivity Analysis - Inferred Mineral Resource Classification by Mineralized Zone
| ALL ZONES | INFERRED | Grade Above Cutoff | Contained Metal | ||||||||||||||||||||||||||||||||||||||||||||||
| Cutoff > ZnEq% | Tons > Cutoff | Zn % | Cu % | Pb % | Ag Oz/Ton | Au Oz/Ton | ZnEq % | Zn Mlbs | Cu Mlbs | Pb Mlbs | Ag MOz | Au Moz | |||||||||||||||||||||||||||||||||||||
| 2.6 | 4,459,000 | 5.36 | 0.54 | 0.30 | 1.40 | 0.043 | 12.06 | 478.11 | 48.01 | 26.75 | 6.26 | 0.192 | |||||||||||||||||||||||||||||||||||||
| 2.7 | 4,447,000 | 5.37 | 0.54 | 0.30 | 1.41 | 0.043 | 12.08 | 477.77 | 47.97 | 26.69 | 6.26 | 0.191 | |||||||||||||||||||||||||||||||||||||
| 2.8 | 4,438,000 | 5.38 | 0.54 | 0.30 | 1.41 | 0.043 | 12.10 | 477.51 | 47.94 | 26.73 | 6.25 | 0.191 | |||||||||||||||||||||||||||||||||||||
| 2.9 | 4,428,000 | 5.39 | 0.54 | 0.30 | 1.41 | 0.043 | 12.12 | 477.22 | 47.97 | 26.68 | 6.25 | 0.190 | |||||||||||||||||||||||||||||||||||||
| 3 | 4,418,000 | 5.40 | 0.54 | 0.30 | 1.41 | 0.043 | 12.15 | 476.94 | 47.93 | 26.64 | 6.25 | 0.190 | |||||||||||||||||||||||||||||||||||||
| 3.1 | 4,403,000 | 5.41 | 0.54 | 0.30 | 1.42 | 0.043 | 12.18 | 476.46 | 47.87 | 26.65 | 6.24 | 0.190 | |||||||||||||||||||||||||||||||||||||
| 3.2 | 4,376,000 | 5.43 | 0.55 | 0.30 | 1.42 | 0.043 | 12.23 | 475.60 | 47.79 | 26.61 | 6.23 | 0.190 | |||||||||||||||||||||||||||||||||||||
| 3.3 | 4,336,000 | 5.47 | 0.55 | 0.31 | 1.43 | 0.044 | 12.31 | 474.20 | 47.71 | 26.54 | 6.21 | 0.192 | |||||||||||||||||||||||||||||||||||||
| 3.4 | 4,300,000 | 5.50 | 0.55 | 0.31 | 1.44 | 0.044 | 12.39 | 472.98 | 47.60 | 26.47 | 6.20 | 0.191 | |||||||||||||||||||||||||||||||||||||
| 3.5 | 4,258,000 | 5.54 | 0.56 | 0.31 | 1.45 | 0.045 | 12.48 | 471.50 | 47.44 | 26.47 | 6.18 | 0.190 | |||||||||||||||||||||||||||||||||||||
| MAIN ZONE | INFERRED | Grade Above Cutoff | Contained Metal | ||||||||||||||||||||||||||||||||||||||||||||||
| Cutoff > ZnEq% | Tons > Cutoff | Zn % | Cu % | Pb % | Ag Oz/Ton | Au Oz/Ton | ZnEq % | Zn Mlbs | Cu Mlbs | Pb Mlbs | Ag MOz | Au Moz | |||||||||||||||||||||||||||||||||||||
| 2.6 | 3,290,000 | 5.64 | 0.51 | 0.23 | 1.15 | 0.035 | 11.33 | 371.08 | 33.69 | 14.80 | 3.78 | 0.115 | |||||||||||||||||||||||||||||||||||||
| 2.7 | 3,279,000 | 5.65 | 0.51 | 0.23 | 1.15 | 0.035 | 11.36 | 370.77 | 33.64 | 14.75 | 3.77 | 0.115 | |||||||||||||||||||||||||||||||||||||
| 2.8 | 3,270,000 | 5.67 | 0.51 | 0.23 | 1.15 | 0.035 | 11.38 | 370.53 | 33.62 | 14.78 | 3.77 | 0.114 | |||||||||||||||||||||||||||||||||||||
| 2.9 | 3,261,000 | 5.68 | 0.52 | 0.23 | 1.15 | 0.035 | 11.41 | 370.27 | 33.65 | 14.74 | 3.76 | 0.114 | |||||||||||||||||||||||||||||||||||||
| 3 | 3,252,000 | 5.69 | 0.52 | 0.23 | 1.16 | 0.035 | 11.43 | 370.01 | 33.63 | 14.70 | 3.76 | 0.114 | |||||||||||||||||||||||||||||||||||||
| 3.1 | 3,240,000 | 5.71 | 0.52 | 0.23 | 1.16 | 0.035 | 11.46 | 369.65 | 33.56 | 14.71 | 3.75 | 0.113 | |||||||||||||||||||||||||||||||||||||
| 3.2 | 3,222,000 | 5.73 | 0.52 | 0.23 | 1.16 | 0.035 | 11.51 | 369.15 | 33.51 | 14.69 | 3.75 | 0.113 | |||||||||||||||||||||||||||||||||||||
| 3.3 | 3,197,000 | 5.76 | 0.52 | 0.23 | 1.17 | 0.036 | 11.57 | 368.35 | 33.44 | 14.64 | 3.73 | 0.115 | |||||||||||||||||||||||||||||||||||||
| 3.4 | 3,172,000 | 5.79 | 0.53 | 0.23 | 1.17 | 0.036 | 11.64 | 367.56 | 33.37 | 14.59 | 3.72 | 0.114 | |||||||||||||||||||||||||||||||||||||
| 3.5 | 3,149,000 | 5.82 | 0.53 | 0.23 | 1.18 | 0.036 | 11.70 | 366.77 | 33.31 | 14.61 | 3.70 | 0.113 | |||||||||||||||||||||||||||||||||||||
| EAST ZONES | INFERRED | Grade Above Cutoff | Contained Metal | ||||||||||||||||||||||||||||||||||||||||||||||
| Cutoff > ZnEq% | Tons > Cutoff | Zn % | Cu % | Pb % | Ag Oz/Ton | Au Oz/Ton | ZnEq % | Zn Mlbs | Cu Mlbs | Pb Mlbs | Ag MOz | Au Moz | |||||||||||||||||||||||||||||||||||||
| 2.6 | 996,000 | 5.03 | 0.59 | 0.56 | 2.43 | 0.074 | 15.47 | 100.16 | 11.80 | 11.20 | 2.42 | 0.073 | |||||||||||||||||||||||||||||||||||||
| 2.7 | 995,000 | 5.03 | 0.59 | 0.56 | 2.43 | 0.074 | 15.48 | 100.15 | 11.81 | 11.19 | 2.42 | 0.073 | |||||||||||||||||||||||||||||||||||||
| 2.8 | 995,000 | 5.03 | 0.59 | 0.56 | 2.43 | 0.074 | 15.48 | 100.14 | 11.80 | 11.20 | 2.42 | 0.073 | |||||||||||||||||||||||||||||||||||||
| 2.9 | 994,000 | 5.04 | 0.59 | 0.56 | 2.43 | 0.074 | 15.49 | 100.11 | 11.80 | 11.20 | 2.42 | 0.073 | |||||||||||||||||||||||||||||||||||||
| 3 | 993,000 | 5.04 | 0.59 | 0.56 | 2.43 | 0.074 | 15.50 | 100.09 | 11.79 | 11.19 | 2.42 | 0.073 | |||||||||||||||||||||||||||||||||||||
| 3.1 | 991,000 | 5.05 | 0.60 | 0.57 | 2.44 | 0.075 | 15.53 | 99.99 | 11.80 | 11.20 | 2.41 | 0.074 | |||||||||||||||||||||||||||||||||||||
| 3.2 | 982,000 | 5.07 | 0.60 | 0.57 | 2.46 | 0.075 | 15.64 | 99.64 | 11.78 | 11.18 | 2.41 | 0.074 | |||||||||||||||||||||||||||||||||||||
| 3.3 | 968,000 | 5.12 | 0.61 | 0.58 | 2.49 | 0.076 | 15.82 | 99.06 | 11.77 | 11.16 | 2.41 | 0.074 | |||||||||||||||||||||||||||||||||||||
| 3.4 | 958,000 | 5.15 | 0.61 | 0.58 | 2.52 | 0.077 | 15.96 | 98.63 | 11.75 | 11.13 | 2.41 | 0.073 | |||||||||||||||||||||||||||||||||||||
| 3.5 | 945,000 | 5.19 | 0.62 | 0.59 | 2.55 | 0.078 | 16.13 | 98.02 | 11.72 | 11.12 | 2.41 | 0.073 | |||||||||||||||||||||||||||||||||||||
| WEST ZONES | INFERRED | Grade Above Cutoff | Contained Metal | ||||||||||||||||||||||||||||||||||||||||||||||
| Cutoff > ZnEq% | Tons > Cutoff | Zn % | Cu % | Pb % | Ag Oz/Ton | Au Oz/Ton | ZnEq % | Zn Mlbs | Cu Mlbs | Pb Mlbs | Ag MOz | Au Moz | |||||||||||||||||||||||||||||||||||||
| 2.6 | 174,000 | 1.98 | 0.73 | 0.21 | 0.40 | 0.018 | 6.27 | 6.87 | 2.52 | 0.75 | 0.07 | 0.003 | |||||||||||||||||||||||||||||||||||||
| 2.7 | 174,000 | 1.98 | 0.73 | 0.21 | 0.40 | 0.018 | 6.27 | 6.86 | 2.52 | 0.75 | 0.07 | 0.003 | |||||||||||||||||||||||||||||||||||||
| 2.8 | 173,000 | 1.98 | 0.73 | 0.21 | 0.40 | 0.018 | 6.28 | 6.84 | 2.52 | 0.74 | 0.07 | 0.003 | |||||||||||||||||||||||||||||||||||||
| 2.9 | 173,000 | 1.98 | 0.73 | 0.22 | 0.40 | 0.018 | 6.28 | 6.84 | 2.52 | 0.74 | 0.07 | 0.003 | |||||||||||||||||||||||||||||||||||||
| 3 | 173,000 | 1.98 | 0.73 | 0.22 | 0.40 | 0.018 | 6.29 | 6.83 | 2.51 | 0.74 | 0.07 | 0.003 | |||||||||||||||||||||||||||||||||||||
| 3.1 | 172,000 | 1.98 | 0.73 | 0.22 | 0.40 | 0.018 | 6.29 | 6.82 | 2.51 | 0.74 | 0.07 | 0.003 | |||||||||||||||||||||||||||||||||||||
| 3.2 | 172,000 | 1.98 | 0.73 | 0.22 | 0.40 | 0.018 | 6.30 | 6.81 | 2.51 | 0.75 | 0.07 | 0.003 | |||||||||||||||||||||||||||||||||||||
| 3.3 | 171,000 | 1.99 | 0.73 | 0.22 | 0.40 | 0.018 | 6.32 | 6.79 | 2.50 | 0.75 | 0.07 | 0.003 | |||||||||||||||||||||||||||||||||||||
| 3.4 | 170,000 | 2.00 | 0.73 | 0.22 | 0.40 | 0.018 | 6.34 | 6.78 | 2.47 | 0.74 | 0.07 | 0.003 | |||||||||||||||||||||||||||||||||||||
| 3.5 | 165,000 | 2.04 | 0.73 | 0.23 | 0.41 | 0.019 | 6.42 | 6.72 | 2.41 | 0.74 | 0.07 | 0.003 | |||||||||||||||||||||||||||||||||||||
| Blue Moon Mine | 90 | March 2025 |
| |
Blue Moon Metals Inc. |
Figure 14.18
Grade-Tonnage Chart for the Indicated Mineral Resource Estimate – All Domains
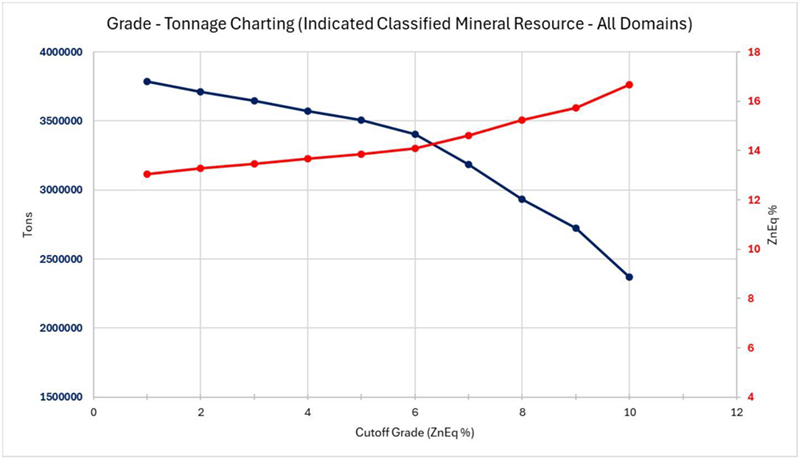
| Blue Moon Mine | 91 | March 2025 |
| |
Blue Moon Metals Inc. |
15.0 MINERAL RESERVE ESTIMATES
No current mineral reserve estimate has been established on the Blue Moon Mine Property.
| Blue Moon Mine | 92 | March 2025 |
| |
Blue Moon Metals Inc. |
16.0 MINING METHODS
| 16.1 | Introduction |
This section outlines the parameters and procedures used by Micon to perform the PEA level mine planning work for the Blue Moon Project at a proposed mill feed production rate of 1,800 tonnes per day.
This PEA is preliminary in nature. In addition to the Measured and Indicated Resources, the mine plan presented in this section includes Inferred Mineral Resources. Inferred Mineral Resources are considered too geologically speculative to have the economic considerations applied to them that would enable them to be categorized as Mineral Reserves. There is no certainty that this PEA will be realized.
This PEA utilizes the Mineral Resources described in Section 14 and only portions of the Mineral Resources that fall within the constraints defined by underground parameters of the PEA listed in this section are used to inform the Project economics.
| 16.2 | Deposit Geometry and Geotechnical Considerations |
The Blue Moon deposit exhibits a steep dip with mineralization extending along strike and to depth. Mineralized zone widths vary, with some areas pinching out to less than 10 ft, while thicker sections reach up to 50 ft. The mineralization is continuous but locally variable, with parallel lenses in certain area.
There is limited geotechnical information available for Blue Moon apart from historical reports and qualitative assessments. Based on review of the prior reports and analogues to similar deposits, the ground conditions are expected to be fair to good, amenable to cut and fill and longhole stoping. Ground control measures will include resin rebar and mesh screening for back support, with split sets used along walls where necessary. However, additional geotechnical drilling and rock mass characterization will be necessary to refine mine design and ground support strategies in subsequent study phases.
| 16.3 | Mso and Mining Method Analysis |
The mining method selection was largely guided by the results of the Mineable Shape Optimizer (MSO) analysis, which evaluated various stoping methods and sizes based on economic and operational parameters. The MSO process assessed multiple configurations, including longhole stoping and cut-and-fill methods. The following methods were not included in the analysis:
| • | Open pit mining: Surface disturbance is desired to be kept to a minimum and an open pit would likely result in high stripping demands. |
| • | Conventional methods (shrinkage, etc.): undesirable given the labour intensity and lack of productivity as well as exposure of personnel close to the face. |
| • | Caving methods: orebody geometry and size not amenable to caving, surface footprint disturbance undesirable. |
| • | Room and Pillar/Post-Pillar Cut and Fill: orebody geometry not amenable; these methods are better suited to flatter lying deposits. |
| Blue Moon Mine | 93 | March 2025 |
| |
Blue Moon Metals Inc. |
The MSO analysis examined the following stope sizes and stope dimensions, dilution factors, and cutoff grades. Longhole stopes were analyzed over an operating cost range of $65 - 90/ton, while the cut and fill stopes were analyzed over a range of $100 – 150/ton. The block model was coded with an NSR value according to the parameters in Table 16.1.
Table 16.1
NSR Parameters Used to Code Block Model for MSO Analysis
| Metal Prices | Unit | Value | |||||
| Copper | US$/lb | 4.20 | |||||
| Zinc | US$/lb | 1.25 | |||||
| Lead | US$/lb | 0.90 | |||||
| Gold | US$/oz | 2,200 | |||||
| Silver | US$/oz | 27.00 | |||||
| Process Recovery | Unit | Zn Conc. | Cu Conc. | |||||||
| Copper | % | 0.00 | 93.10 | |||||||
| Zinc | % | 95.3 | 0.00 | |||||||
| Lead | % | 0.00 | 0.00 | |||||||
| Gold | % | 18.3 | 67.90 | |||||||
| Silver | % | 25.7 | 68.60 | |||||||
| Concentrate Grade | % (Zn/Cu) | 62.3 | 26.50 | |||||||
| NSR terms | Unit | Zn Conc. | Cu Conc. | |||||||
| Metal Payable | ||||||||||
| Copper | % | 0.00 | 96.50 | |||||||
| Zinc | % | 87.20 | 0.00 | |||||||
| Lead | % | 0.00 | 0.00 | |||||||
| Gold | % | 75.00 | 96.00 | |||||||
| Silver | % | 80.00 | 90.00 | |||||||
| Minimum Deduction | ||||||||||
| Copper | % | - | 1.00 | |||||||
| Zinc | % | 8.00 | - | |||||||
| Lead | % | - | - | |||||||
| Gold | g/t Au | 1.00 | 0.00 | |||||||
| Silver | g/t Ag | 102.86 | 0.00 | |||||||
| Transport Charge | US$/wt | 72.00 | 72.00 | |||||||
| Treatment Charge | US$/t | 165.00 | 30.00 | |||||||
| Refining Charge | US$/lb (Zn/Cu) | 0.00 | 0.03 | |||||||
| Refining Charge | US$/oz Au | 0.00 | 5.00 | |||||||
| Refining Charge | US$/oz Ag | 0.00 | 0.50 | |||||||
Table 16.2 presents the various stope sizes, dilution (ELOS) and recovery factors analysed.
| Blue Moon Mine | 94 | March 2025 |
| |
Blue Moon Metals Inc. |
Table 16.2
Stope Sizes, Dilution (ELOS) and Recovery Factors Analysed
| Method | Stope Height/Level Interval (ft) | Stope Length (along strike, ft) | Min. Width (ft) | ELOS (HW, ft) | ELOS (FW, ft) | Mining Recovery (%) | ||||||||||||||||||
| Longhole/Blasthole | 65 | 20 | 6 | 1 | 1 | 90 | ||||||||||||||||||
| 80 | 20 | 6 | 1 | 1 | ||||||||||||||||||||
| 50 | 20 | 6 | 1 | 1 | ||||||||||||||||||||
| 100 | 40 | 8 | 1.5 | 1.5 | ||||||||||||||||||||
| Cut and Fill | 10 | 80 | 8 | 0.4 | 0.4 | 95 | ||||||||||||||||||
The stope shapes were then processed by applying an assumed operating cost of US$75/ton for longhole stoping and US$100/ton for cut and fill stopes, based on similar projects. The resulting operating margin results are displayed in Figure 16.1. The analysis demonstrates that over the 50 ft to 80 ft. height, the orebody is relatively insensitive to cut-offs, while the larger stopes as well as the cut-and-fill stopes suffer a diminished operating margin as the selectivity and increased cost burdens the economics.
Figure 16.1
MSO Results Over a Range of Shape Sizes and NSR Cut-Off Values
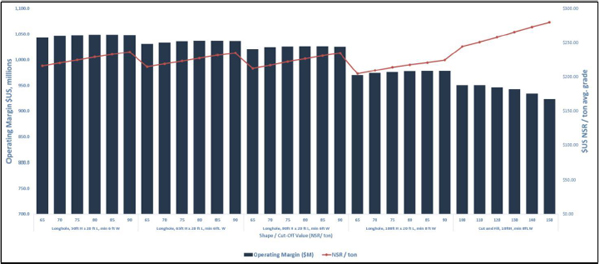
The 80 ft H, US$75/ton NSR case was selected as the basis for the mine design, as this maximises resource recovery, limits excessive sustaining capital requirements (level development), and provides the highest relative operating margin compared to the other cases considered.
Stoping operations will follow a Longitudinal Retreat sequence, illustrated in Figure 16.2.
| Blue Moon Mine | 95 | March 2025 |
| |
Blue Moon Metals Inc. |
Figure 16.2
Longitudinal Retreat Concept
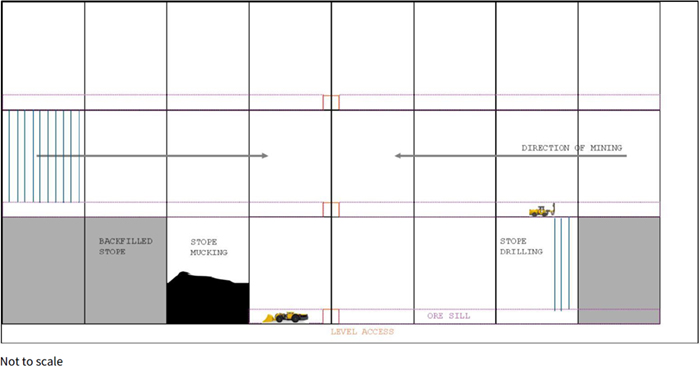
| 16.4 | Mine Access |
The mine will be accessed through a ramp system designed with a nominal grade of 13%, reaching a maximum of 15% in some sections. The initial portal and decline will provide access for exploration drilling and be utilized once the mine moves into production as the main haulage route. The layout separates the deposit into North and South mining zones to minimize level development and provide additional mine sequencing flexibility. The decline is positioned to first access the North Zone, prioritizing thicker, higher-grade levels in the mine.
Mining levels will be spaced at 80-ft vertical intervals, with mining fronts consisting of five or six levels grouped together. Each level will include essential infrastructure such as truck load-out areas, electrical substations, and dewatering sumps. The primary decline will serve as the main haulage route, with additional accesses developed as mining advances. Allowances were added (5% for Ramp, 20% for level development) to account for remucks and infrastructure cutouts. The basic criteria followed for the development design is shown in Table 16.3.
| Blue Moon Mine | 96 | March 2025 |
| |
Blue Moon Metals Inc. |
Table 16.3
Development Design Criteria
| Criteria | Value | |
| Decline Gradient | 13% to 15% | |
| Decline Size | 16.4 ft W x 16.4 ft H | |
| Level Development Size | 15 ft W x 15 ft H | |
| Fresh Air Raise Size (diameter) | 14 ft. | |
| Footwall-to-Ramp Offset | >120 ft. | |
| Ramp Turning Radius | 80 ft. | |
| Ramp Additional Allowance | 5% | |
| Level Development Additional Allowance | 20% | |
| Lateral Development Overbreak | 10% | |
| Vertical Development Overbreak | 5% |
Figure 16.3 shows a view of the mine design development and stope model. A secondary egress system is planned via the fresh air raise, providing an alternate escape route in case of emergency.
Figure 16.3
Mine Design Model View Looking West
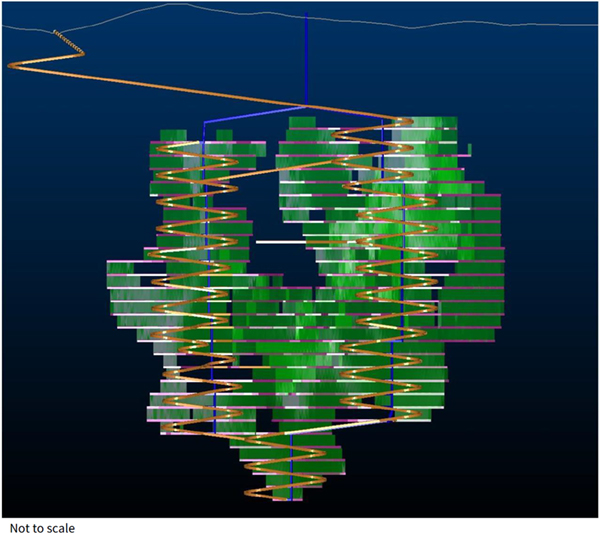
| Blue Moon Mine | 97 | March 2025 |
| |
Blue Moon Metals Inc. |
| 16.5 | Ventilation |
Fresh air will be introduced through a single surface raise via two axial fans, each of an estimated 400 hp, feeding both North and South zones through level breakthroughs, where a regulator and auxiliary fan setup will be installed, with ducting into the stoping areas. Exhaust air will be directed through the decline ramp, supplemented by booster fans to manage pressures as the mine advances deeper.
The total estimated flow required to be supplied to the mine is approximately 280,000 CFM. Table 16.4 summarises the estimate of required flow, and Figure 16.4 illustrates the ventilation network for the PEA mine design.
In the deeper sections of the mine, supplementary exhaust raises may be required to enhance airflow and maintain safe working conditions. Future trade-off work should investigate the use of battery-electric vehicles for all or some of the mobile equipment fleet.
Table 16.4
Preliminary Ventilation Flow Requirements
| Fleet Calc | Model Assumed | MSHA Part 7 Vent Rate/Factor | # | % Utilisation | Total Requirement (CFM) | ||||||||||||||
| 42-t Truck or equivalent | Epiroc MT42S | 18,999 | cfm/unit | 4 | 100 | % | 75,997 | ||||||||||||
| 6-yd LHD or equivalent | Epiroc ST14 | 12,996 | cfm/unit | 3 | 100 | % | 38,987 | ||||||||||||
| 10-yd LHD or equivalent | Epiroc ST18 | 17,022 | cfm/unit | 1 | 100 | % | 17,022 | ||||||||||||
| Jumbo Drill | Epiroc Boomer 282 | 100 | cfm/hp | 2 | 25 | % | 3,700 | ||||||||||||
| Production Drill | Epiroc Simba S7 | 100 | cfm/hp | 2 | 25 | % | 3,700 | ||||||||||||
| Bolter | Epiroc Boltec | 100 | cfm/hp | 1 | 25 | % | 1,850 | ||||||||||||
| Scissor Lift | MacLean SL2 | 100 | cfm/hp | 2 | 25 | % | 7,750 | ||||||||||||
| Grader | MacLean GR5 | 100 | cfm/hp | 1 | 50 | % | 10,100 | ||||||||||||
| Pickup Truck | Landcruiser | 100 | cfm/hp | 6 | 50 | % | 38400 | ||||||||||||
| Sub-Total Equipment Requirements | 197,506 | ||||||||||||||||||
| Personnel | 6,000 | ||||||||||||||||||
| Leakage (10%) | 20,351 | ||||||||||||||||||
| Contingency (25%) | 55,964 | ||||||||||||||||||
| Grand Total | 279,821 | ||||||||||||||||||
| Blue Moon Mine | 98 | March 2025 |
| |
Blue Moon Metals Inc. |
Figure 16.4
Ventilation Network Schematic
Blue Shows the Fresh Air Path, Red Shows the Return Air Path
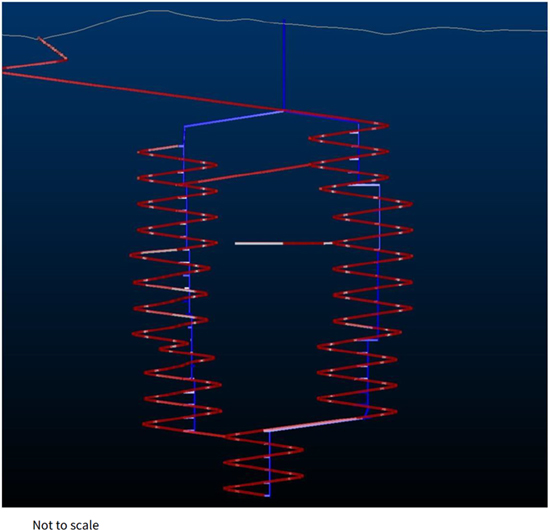
| 16.6 | Production Schedule |
The production schedule was created in Datamine’s Enhanced Production Scheduler (EPS) software, using benchmark development rates observed on recent projects. The initial decline advances to the main fresh air intake raise, before continuing to the north and beginning the north spiral ramp to the first mining front.
Separate level development crews are assigned to handle level and ventilation accesses, as well as ore sill drives. Stopes are scheduled by linking dependencies between designed stope shapes, in a Primary-Primary retreat sequence to the level access. Additional dependencies were added to the schedule to ensure ventilation breakthroughs are complete in advance of production on a level. The dedicated ramp resource crew advances to the next mining front. Overall production is targeted at 1,800 tonnes per day. Mining fronts were prioritized by grade and size to aid in early revenue generation.
Development and stoping rates were assigned using benchmark rates observed at similar projects, as outlined in Table 16.5.
| Blue Moon Mine | 99 | March 2025 |
| |
Blue Moon Metals Inc. |
Table 16.5
Resource Rates Applied in the Mine Schedule
| Resource | Rate | Comment |
| Ramp Crew | ~540 ft/mo | Single Face Maximum |
| Level Crews | ~660 ft/mo | Multi Face Maximum |
| Longhole Stopes | ~200 tpd, | All-In Rate |
| Vertical Development | 11 ft/d | Single Face |
Development was scheduled as just-in-time to avoid extraneous early development, and the schedule was backwards-levelled to pull forward development where slack exists.
Table 16.6 presents a summary of the annual mine development and production tonnages.
| Blue Moon Mine | 100 | March 2025 |
| |
Blue Moon Metals Inc. |
Table 16.6
Annual Mine Schedule Summary
| Parameter | Unit | LOM Total/ Avg. | Year -2* | Year -1 | Year 1 | Year 2 | Year 3 | Year 4 | Year 5 | Year 6 | Year 7 | Year 8 | Year 9 | Year 10 | Year 11 | ||||||||||||||||
| Mined Tons | 000 t | 9,554 | 237 | 281 | 911 | 887 | 859 | 941 | 884 | 952 | 933 | 877 | 913 | 756 | 124 | ||||||||||||||||
| Development Feet | 000 ft | 131.0 | 7.9 | 10.5 | 16.1 | 10.2 | 9.3 | 12.5 | 10.4 | 13.2 | 12.2 | 10.3 | 11.9 | 5.7 | 0.9 | ||||||||||||||||
| Mill Feed Tons | 000 t | 7,401 | 5 | 127 | 746 | 742 | 750 | 766 | 727 | 692 | 725 | 701 | 684 | 635 | 102 | ||||||||||||||||
| NSR Value | US$/ton | 222.0 | 184.1 | 194.9 | 231.6 | 251.2 | 238.0 | 226.9 | 212.5 | 209.3 | 211.9 | 165.4 | 248.0 | 230.2 | 208.7 | ||||||||||||||||
| ZnEq Grade | % | 11.64 | 10.12 | 10.39 | 12.18 | 13.17 | 12.42 | 11.89 | 11.08 | 10.99 | 11.20 | 8.61 | 13.19 | 11.99 | 10.30 | ||||||||||||||||
| Zinc Grade | % | 5.17 | 5.80 | 5.01 | 5.10 | 5.21 | 4.79 | 5.25 | 4.95 | 5.19 | 5.64 | 3.81 | 7.03 | 5.34 | 1.92 | ||||||||||||||||
| Copper Grade | % | 0.56 | 0.34 | 0.34 | 0.42 | 0.40 | 0.39 | 0.62 | 0.83 | 0.82 | 0.67 | 0.59 | 0.45 | 0.40 | 0.71 | ||||||||||||||||
| Silver Grade | opt | 1.32 | 1.98 | 1.59 | 1.82 | 2.07 | 1.80 | 1.35 | 0.96 | 1.04 | 1.08 | 0.73 | 1.29 | 0.98 | 0.76 | ||||||||||||||||
| Gold Grade | opt | 0.04 | 0.01 | 0.03 | 0.05 | 0.06 | 0.06 | 0.04 | 0.03 | 0.02 | 0.03 | 0.03 | 0.04 | 0.05 | 0.07 | ||||||||||||||||
| Lead Grade | % | 0.24 | 0.13 | 0.26 | 0.31 | 0.32 | 0.25 | 0.19 | 0.18 | 0.22 | 0.21 | 0.16 | 0.27 | 0.31 | 0.40 | ||||||||||||||||
| Ramp Feet (Equivalent) | ‘000 ft | 39.3 | 5.6 | 2.8 | 2.3 | 3.3 | 1.3 | 4.4 | 2.4 | 5.5 | 4.2 | 2.1 | 3.8 | 1.0 | 0.7 | ||||||||||||||||
| Mill Feed Development | ‘000 ft | 40.4 | 0.2 | 3.6 | 8.8 | 4.2 | 4.6 | 5.1 | 3.6 | 2.0 | 3.1 | 2.8 | 2.1 | 0.4 | 0.0 | ||||||||||||||||
| Level Development Waste (Equivalent) | ‘000 ft | 46.8 | 1.5 | 3.7 | 4.6 | 2.7 | 3.2 | 2.7 | 4.0 | 4.9 | 4.5 | 5.1 | 5.7 | 4.0 | 0.2 | ||||||||||||||||
| Raise Feet | ‘000 ft | 4.6 | 0.6 | 0.4 | 0.4 | 0.0 | 0.3 | 0.3 | 0.4 | 0.8 | 0.4 | 0.4 | 0.4 | 0.3 | 0.0 | ||||||||||||||||
| Waste Tons | ‘000 T | 2,153.3 | 232.2 | 154.5 | 165.1 | 144.4 | 108.3 | 175.2 | 156.9 | 260.4 | 208.1 | 176.1 | 229.3 | 120.7 | 22.0 |
Notes:
| 1. | Tonnages and per ton figures reflect short tons. |
| 2. | Initial Mining shown here occurring in Year -2 is assumed to be carried out earlier as part of an exploration ramp development to give access for underground drilling. Accordingly, the PEA cash flow model assumes this to be a sunk cost. |
| Blue Moon Mine | 101 | March 2025 |
| |
Blue Moon Metals Inc. |
| 16.7 | Equipment Fleet |
The underground mining fleet will include a combination of development and production equipment. The development fleet will consist of jumbo drills, bolters, load-haul-dump (LHD) machines, and scissor decks for support infrastructure installation. The production fleet will include 42 tonne haul trucks, longhole drills, and 6-yard LHDs for material movement, as detailed in Table 16.7.
Table 16.7
Annual Mine Schedule Summary
| Parameter | Year - 2* |
Year -1 |
Year 1 |
Year 2 |
Year 3 |
Year 4 |
Year 5 |
Year 6 |
Year 7 |
Year 8 |
Year 9 |
Year 10 |
Year 11 |
||||||||||||||
| Jumbos | 1 | 2 | 2 | 2 | 2 | 2 | 2 | 2 | 2 | 2 | 2 | 2 | 2 | ||||||||||||||
| Bolters | 1 | 1 | 1 | 1 | 1 | 1 | 1 | 1 | 1 | 1 | 1 | 1 | 1 | ||||||||||||||
| LHD Dev | 2 | 2 | 2 | 2 | 2 | 2 | 2 | 2 | 2 | 2 | 2 | 2 | 2 | ||||||||||||||
| Scissor Deck | 2 | 2 | 2 | 2 | 2 | 2 | 2 | 2 | 2 | 2 | 2 | 2 | 2 | ||||||||||||||
| Personnel Carrier | 2 | 2 | 2 | 2 | 2 | 2 | 2 | 2 | 2 | 2 | 2 | 2 | 2 | ||||||||||||||
| Prod. Drills | 1 | 1 | 2 | 2 | 2 | 2 | 2 | 2 | 2 | 2 | 2 | 2 | 1 | ||||||||||||||
| Prod. LHD (ST14) | 1 | 1 | 3 | 3 | 3 | 3 | 3 | 3 | 3 | 3 | 3 | 3 | 2 | ||||||||||||||
| Haul Trucks (42t) | 1 | 2 | 3 | 3 | 3 | 4 | 4 | 4 | 4 | 4 | 4 | 4 | 4 | ||||||||||||||
| Emulsion Loader (Prod.) | 1 | 1 | 1 | 1 | 1 | 1 | 1 | 1 | 1 | 1 | 1 | 1 | 1 | ||||||||||||||
| Shotcreter | 1 | 1 | 1 | 1 | 1 | 1 | 1 | 1 | 1 | 1 | 1 | 1 | 1 | ||||||||||||||
| Grouter | 1 | 1 | 1 | 1 | 1 | 1 | 1 | 1 | 1 | 1 | 1 | 1 | 1 | ||||||||||||||
| Fuel/Lube Truck | 1 | 1 | 1 | 1 | 1 | 1 | 1 | 1 | 1 | 1 | 1 | 1 | 1 | ||||||||||||||
| Utility Truck | 1 | 1 | 1 | 1 | 1 | 1 | 1 | 1 | 1 | 1 | 1 | 1 | 1 | ||||||||||||||
| Boom Truck | 1 | 1 | 1 | 1 | 1 | 1 | 1 | 1 | 1 | 1 | 1 | 1 | 1 | ||||||||||||||
| Grader | 1 | 1 | 1 | 1 | 1 | 1 | 1 | 1 | 1 | 1 | 1 | 1 | 1 | ||||||||||||||
| Pickups | 2 | 6 | 6 | 6 | 6 | 6 | 6 | 6 | 6 | 6 | 6 | 6 | 6 |
For the purposes of this PEA, it has been assumed that all the mobile mining equipment will be provided by a mining contractor.
Future studies will assess the feasibility of integrating battery-electric vehicles to reduce diesel emissions and ventilation costs.
| 16.8 | Mine Personnel |
Workforce estimates were created based on the mine schedule, assuming 2 h to 12 h shifts, with a 4 -shift rotation. Mine technical and administrative staff and certain fixed plant maintenance personnel were assumed to work 5-d weeks, day shift only.
Peak salaried and hourly-waged personnel requirements are shown below in Table 16.8 and Table 16.9, respectively.
| Blue Moon Mine | 102 | March 2025 |
| |
Blue Moon Metals Inc. |
Table 16.8
Peak Salaried Workforce Estimate
| Category | Position | Number | ||||
| Mine Site Management/Admin | Manager, Mining | 1 | ||||
| Mine Superintendent | 1 | |||||
| Mine Supervisor | 8 | |||||
| Mine Captain | 2 | |||||
| Accountant | 1 | |||||
| Junior Accountant | 1 | |||||
| Controller | 1 | |||||
| Buyer | 1 | |||||
| Warehouse Supervisor | 1 | |||||
| Warehouse Attendant | 2 | |||||
| Janitorial | 2 | |||||
| Security Superintendent | 1 | |||||
| Security Guard | 2 | |||||
| Mining Engineering | Chief Mine Engineer | 1 | ||||
| Senior Mining Engineer | 1 | |||||
| Long Range Planner | 1 | |||||
| Short Range Planner | 2 | |||||
| Ventilation Engineer/Tech | 1 | |||||
| Ground Control Engineer/Tech | 2 | |||||
| Senior Surveyor/Tech | 1 | |||||
| Surveyor | 3 | |||||
| Geology | Chief Geologist | 1 | ||||
| Senior Geologist | 1 | |||||
| Beat Geologist | 2 | |||||
| Resource Geologist | 1 | |||||
| Core Logger | 2 | |||||
| Health and Safety | Safety Superintendent | 1 | ||||
| Safety Supervisor | 1 | |||||
| Safety Personnel | 2 | |||||
| Maintenance | Maintenance Superintendent | 1 | ||||
| Maintenance Foreman | 1 | |||||
| Maintenance Planner | 1 | |||||
| Mill | Mill Superintendent | 1 | ||||
| Mill Foreman | 1 | |||||
| Project Engineer | 1 | |||||
| Mill Technician | 1 | |||||
| Mechanical Engineer | 1 | |||||
| Civil Engineer | 1 | |||||
| Electrical Engineer | 1 | |||||
| Environmental | Environmental Superintendent | 1 | ||||
| Environmental Coordinator | 1 | |||||
| Environmental Tech | 2 | |||||
| Total Salaried Staff | 61 | |||||
| Blue Moon Mine | 103 | March 2025 |
| |
Blue Moon Metals Inc. |
Table 16.9
Peak Hourly-Wage Workforce Estimate
| Category | Position | Number | ||||
| Development | Jumbo Operators | 8 | ||||
| Dev LHD Operators | 8 | |||||
| Bolters | 4 | |||||
| Services/Helpers | 16 | |||||
| Production | Longhole Drillers | 8 | ||||
| Blasters | 16 | |||||
| LHD Operators - Production | 8 | |||||
| Indirects | Truck Operators | 16 | ||||
| U/G Labourers (Material Transport) | 12 | |||||
| Ramp Maintenance/Misc | 4 | |||||
| UG Construction | Paste Operator | 4 | ||||
| Shotcreter | 4 | |||||
| General Construction Labourer | 12 | |||||
| Maintenance | Shop Mechanic | 8 | ||||
| Apprentice Mechanic | 8 | |||||
| Mobile Mechanic | 8 | |||||
| General Shop Labourer | 8 | |||||
| Millwright | 4 | |||||
| Electrician | 2 | |||||
| Welder | 2 | |||||
| Total Hourly-Wage Workforce | 160 | |||||
| 16.9 | Mine Services |
| 16.9.1 | Dewatering System |
A multi-stage “daisy chain” pumping system will be implemented to prevent excessive hydraulic head pressure, limiting head height to a maximum of 240 ft per sump. Intermediate sumps will be fed via gravity through boreholes. As mining progresses deeper, new sumps will be developed on new production levels to maintain effective water management.
In addition to sumps, drain holes will be drilled in areas with high expected water inflows to mitigate localized flooding risks. If necessary, water will be treated on the surface as required to meet environmental discharge regulations.
| 16.9.2 | Electrical Distribution |
Power will be supplied at 13.8 kV from the surface and transmitted underground via a dedicated feeder line. A central transformer station, located off the main decline above the mining zones, will step power down from 13.8 kV to 4,160 V for distribution throughout the mine. Electrical distribution will be facilitated via boreholes to feed substations near level access points. Each level substation will further step power down from 4160 V to 600 V or 480 V, depending on equipment requirements. The system will provide power to jumbo drills, production drills, fans, and pumps.
| Blue Moon Mine | 104 | March 2025 |
| |
Blue Moon Metals Inc. |
| 16.9.3 | Mine Communications and Safety |
A leaky feeder system will be installed throughout the underground workings to provide wireless communication for voice, data, and tracking systems. Standard underground mine phones and intercom stations will also be positioned at critical locations for redundancy.
To ensure worker safety, the mine will implement a stench gas emergency warning system within the intake ventilation system, allowing immediate alerting of underground personnel in case of a fire or hazardous event. A mine rescue team will be maintained on-site, with emergency response protocols integrated with local emergency providers.
| 16.9.4 | Refuge Chambers |
Mobile refuge stations will be strategically placed within the underground workings to provide a safe haven in the event of an emergency. Each chamber will be equipped to support 12 or more workers for up to 36 hours, including:
| • | Chemical toilets. |
| • | Emergency food and water supplies. |
| • | Backup power, lighting, and communications. |
| • | Oxygen supply via compressed air, oxygen cylinders, and candles. |
The refuge chambers will be in existing cut-outs and will be easily relocatable as mining progresses.
| 16.9.5 | Compressed Air System |
Two air compressors will supply underground compressed air for pneumatic equipment. Initially, both units will service the main production areas, but as mining expands, one unit may be relocated to a secondary underground access for improved distribution.
| Blue Moon Mine | 105 | March 2025 |
| |
Blue Moon Metals Inc. |
17.0 RECOVERY METHODS
The preliminary economic assessment (PEA) process design is based on treating mineralized material from the Blue Moon deposit through a sequential flotation process to produce a copper concentrate and a zinc concentrate as primary products. A pyrite concentrate can also produce as a secondary product with the remaining material considered tailings, but this is not reflected in the base case. The process design is based on testwork completed by SGS Lakefield which is described in Section 13.0 of this Technical Report.
The primary consideration in developing the process design was to ensure the process could separate a saleable copper concentrate along with a saleable zinc concentrate: the sale of these two products comprises the PEA base case. The plant layout also makes provision for a separate pyrite concentrate that could potentially remove sulphur-bearing mineral from the tailings storage facility, subject to finding a commercial outlet for this material or preferentially using it as a component of paste-fill in the underground mine. Further study is required before inclusion of either option, though, so for the purposes of this PEA, the pyrite has been considered a part of the tailings stream.
The processing facility has been designed to treat 657,000 tonnes per year, or 1,800 tonnes/day. Mineralization will be received from the underground mine at the process site which comprises the following areas:
| • | Crushing Plant. |
| • | Crushed Ore Handling and Storage. |
| • | SAG and Ball Mill Grinding Circuit. |
| • | Flotation Circuits: |
| ○ | Copper Flotation. |
| ○ | Zinc Flotation. |
| ○ | Pyrite Flotation. |
| • | Concentrate Handling by means of thickening, filtration and loading for copper, and zinc concentrates, with the option to handle pyrite concentrate also. |
| • | Tailings Handling by means of thickening, filtration and preparing for paste and dry stack storage. |
| • | Paste Backfill Plant. |
| • | Reagents Handling and Storage. |
| • | Plant Services. |
The overall process flow diagrams are seen in Figure 17.1, Figure 17.2, and Figure 17.3.
| Blue Moon Mine | 106 | March 2025 |
| |
Blue Moon Metals Inc. |
Figure 17.1
Blue Moon Process Flow Diagram – 1 of 3
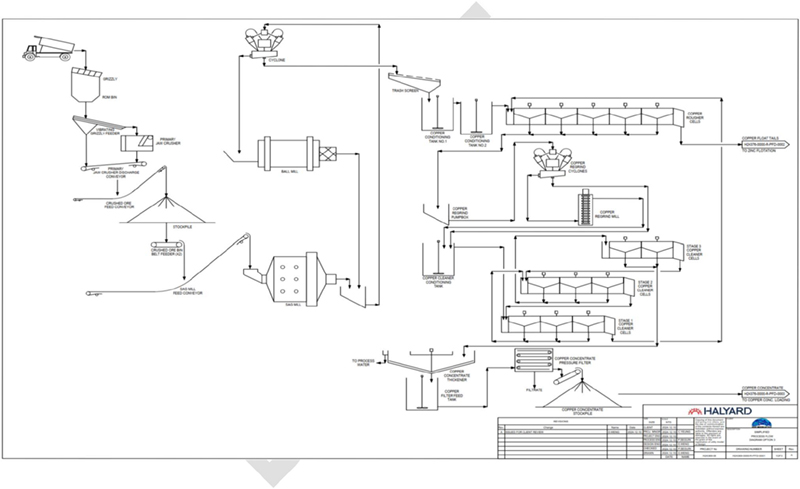
| Blue Moon Mine | 107 | March 2025 |
| |
Blue Moon Metals Inc. |
Figure 17.2
Blue Moon Process Flow Diagram – 2 of 3
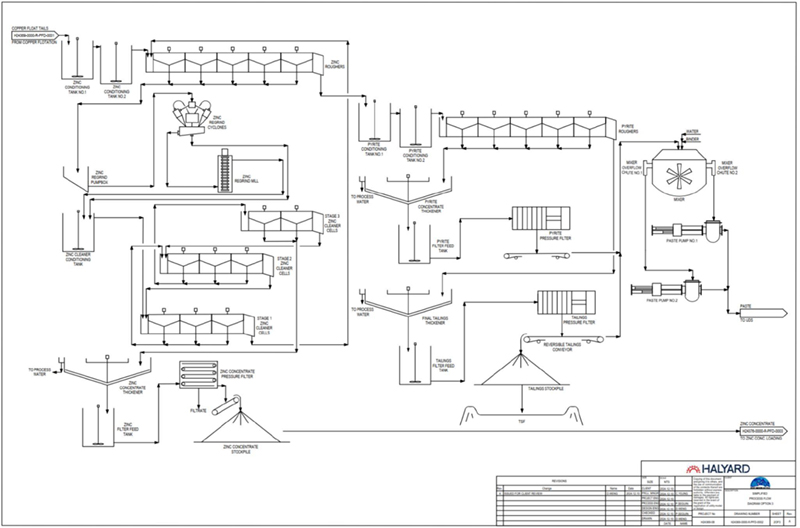
| Blue Moon Mine | 108 | March 2025 |
| |
Blue Moon Metals Inc. |
Figure 17.3
Blue Moon Process Flow Diagram – 3 of 3
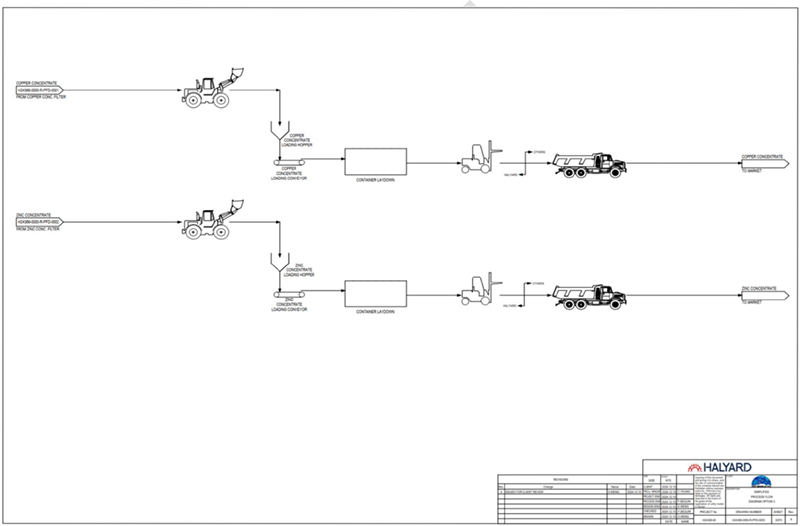
| Blue Moon Mine | 109 | March 2025 |
| |
Blue Moon Metals Inc. |
| 17.1 | Process Design Criteria |
| 17.1.1 | Design Basis |
The mineral processing operation shall begin when the haul trucks from the underground mine deliver the ore to the primary crusher station. The ore will be crushed and conveyed to a stockpile where it will be reclaimed and transported to the main mill building. The crushed ore will be sufficiently reduced in size in the grinding circuit to liberate the desired minerals. Downstream, the flotation circuits shall selectively recover the target minerals for each type of concentrate. Dedicated thickeners shall densify each slurry stream and recover the overflow water for re-use in the process, while the thickened slurry will be further dewatered through dedicated filter presses. Concentrates and tailings shall all be handled as filter cakes.
Copper and zinc concentrates shall be collected from the storage stockpile located below the filter presses and loaded onto a hopper and conveyor system which will be used to load the concentrate within a lined rectangular shipping container. Pyrite and tailings filter cake shall be conveyed by means of conveyors to a paste backfill mixer. The mixer shall blend the filtered tailings with additional water and a binder into a paste which will then be pumped to the to the underground mine by means of a piping network.
Table 17.1 provides a summary of the overall process design basis for the Blue Moon mineral processing operation. The facility has been designed to treat 1,800 tonnes per day on average, nominally operating 24 hours per day and 7 days per week. The table also provides an overview of the copper and zinc concentrate recovery performances.
Table 17.1
Process Design Basis
| Criteria | Unit | Value | ||||
| Throughput Design | ||||||
| Annual Throughput | t/year - dry | 657,000 | ||||
| Operating Days per Year | d | 365 | ||||
| Operating Availability – Crushing | h/y | 5,694 | ||||
| Operating Availability – Grinding and Flotation | h/y | 8,059 | ||||
| Operating Availability – Paste Plant | h/y | 4,380 | ||||
| Design Throughput Rate– Crushing | t/h - dry | 115 | ||||
| Design Throughput Rate – Grinding and Flotation | t/h - dry | 81.5 | ||||
| Design Production Rate – Copper Concentrate | t/h - dry | 1.57 | ||||
| Design Production Rate – Zinc Concentrate | t/h - dry | 7.5 | ||||
| Comminution | ||||||
| Crushing Feed Size – 100% Passing | in | 23.2 | ||||
| Crushing Product Size – 80% Passing | in | 5 | ||||
| Grinding Product Size – 80% Passing | µm | 74 | ||||
| Average Specific Gravity | - | 3.30 | ||||
| Ball Mill Circulating Load | % | 300 | ||||
| Bond Ball Mill Work Index – Design | kWh/t | 8.5 | ||||
| Bond Abrasion Index - Design | g | 0.20 | ||||
| Blue Moon Mine | 110 | March 2025 |
| |
Blue Moon Metals Inc. |
| Criteria | Unit | Value | ||||
| Head Grade | ||||||
| Head Grade, Copper – nominal | Cu % | 0.56 | ||||
| Head Grade, Zinc – nominal | Zn % | 5.65 | ||||
| Head Grade, Lead – nominal | Pb % | 0.27 | ||||
| Head Grade, Gold – nominal | Au ppm | 1.33 | ||||
| Head Grade, Silver - nominal | Ag ppm | 44.6 | ||||
| Concentrate Recoveries | ||||||
| Copper Concentrate - Grade | Cu % | 26.5 | ||||
| Copper Concentrate – Copper Recovery | Cu % | 93.1 | ||||
| Copper Concentrate – Zinc Recovery | Zn % | 2.7 | ||||
| Copper Concentrate – Lead Recovery | Pb % | 93.2 | ||||
| Copper Concentrate – Gold Recovery | Au % | 67.90 | ||||
| Copper Concentrate – Silver Recovery | Ag % | 68.60 | ||||
| Zinc Concentrate - Grade | Zn % | 62.3 | ||||
| Zinc Concentrate – Copper Recovery | Cu % | 5.5 | ||||
| Zinc Concentrate – Zinc Recovery | Zn % | 95.30 | ||||
| Zinc Concentrate – Lead Recovery | Pb % | 5.8 | ||||
| Zinc Concentrate – Gold Recovery | Au % | 18.30 | ||||
| Zinc Concentrate – Silver Recovery | Ag % | 25.70 | ||||
The above hourly rates have been adjusted for different areas of the process based on their operating availabilities. The crushing circuit uses a 65% availability, and the main process plant a 92% availability. Filtration circuits have an 80% availability to accommodate the regular cycle times required to operate the equipment. Dry ton throughputs are presented net of these availabilities, thus satisfying the daily throughput requirement.
| 17.1.2 | Process Design Criteria |
Table 17.2 provides a summary of key process design parameters used for the Blue Moon PEA.
Table 17.2
Process Design Criteria
| Criteria | Unit | Value | ||||
| Crushing Plant | ||||||
| Crusher Feed Bin Retention Time Required | h | 1 | ||||
| Crusher Bin Total Live Capacity | t | 115 | ||||
| Maximum Rock Feed Size | inch | 23.2 | ||||
| Maximum Rock Feed Size | mm | 590 | ||||
| Close Size Setting | inch | 2.9 | ||||
| Close Size Setting | mm | 70 | ||||
| Final Product Size - Passing (P80) | inch | 5 | ||||
| Final Product Size - Passing (P80) | mm | 127 | ||||
| Crushed Ore Handling | ||||||
| Stockpile Live Capacity | h | 24 | ||||
| Stockpile Live Capacity | t | 1,800 | ||||
| Blue Moon Mine | 111 | March 2025 |
| |
Blue Moon Metals Inc. |
| Criteria | Unit | Value | ||||||
| Grinding Circuit | ||||||||
| Feed To SAG Mill | t/d | 1,800 | ||||||
| Feed To SAG Mill | t/h | 81.5 | ||||||
| SAG Mill - Feed Size - Passing (P80) | inch | 5 | ||||||
| SAG Mill - Product Size - Passing (P80) | microns | 1,000 | ||||||
| SAG Mill - Proportion Circulating Load | % | 25 | % | |||||
| SAG Mill - Proportion of Pebbles | % | 25 | % | |||||
| SAG Mill - Grinding Mill Solids Density | %w/w | 75 | % | |||||
| SAG Mill - Estimate Average Power Draw | HP | 927 | ||||||
| SAG Mill - Estimate Mill Diameter | ft | 13.8 | ||||||
| SAG Mill - Estimate Mill Length | ft | 6.9 | ||||||
| Ball Mill - Feed Size - Passing (P80) | microns | 1,000 | ||||||
| Ball Mill - Product Size - Passing (P80) | microns | 74 | ||||||
| Ball Mill - Proportion Circulating Load | % | 300 | % | |||||
| Ball Mill - Grinding Mill Solids Density | %w/w | 73 | % | |||||
| Ball Mill - Cyclone Feed Density | %w/w | 50 | % | |||||
| Ball Mill - Cyclone U/F Solids Density | %w/w | 75 | % | |||||
| Ball Mill - Estimate Average Power Draw | HP | 855 | ||||||
| Ball Mill - Estimate Mill Diameter | ft | 11.8 | ||||||
| Ball Mill - Estimate Mill Length | ft | 17.7 | ||||||
| Copper Flotation | ||||||||
| Cu Feed Solids Density | %w/w | 33 | % | |||||
| Cu Rougher Feed Flowrate | t/h | 81.5 | ||||||
| Cu Rougher Flotation Time | mins | 20 | ||||||
| Cu Rougher Volume Requirement | ft3 | 2,467 | ||||||
| Cu Cleaner 1 Flotation Time | mins | 11 | ||||||
| Cu Cleaner 1 Volume Requirement | ft3 | 271 | ||||||
| Cu Cleaner 2 Flotation Time | mins | 9 | ||||||
| Cu Cleaner 2 Volume Requirement | ft3 | 121 | ||||||
| Cu Cleaner 3 Flotation Time | mins | 9 | ||||||
| Cu Cleaner 3 Volume Requirement | ft3 | 68 | ||||||
| Zinc Flotation | ||||||||
| Zn Feed Solids Density | %w/w | 32 | % | |||||
| Zn Rougher Feed Flowrate | t/h | 80.6 | ||||||
| Zn Rougher Flotation Time | mins | 15 | ||||||
| Zn Rougher Volume Requirement | ft3 | 2,050 | ||||||
| Zn Cleaner 1 Flotation Time | mins | 13 | ||||||
| Zn Cleaner 1 Volume Requirement | ft3 | 310 | ||||||
| Zn Cleaner 2 Flotation Time | mins | 10 | ||||||
| Zn Cleaner 2 Volume Requirement | ft3 | 171 | ||||||
| Zn Cleaner 3 Flotation Time | mins | 8 | ||||||
| Zn Cleaner 3 Volume Requirement | ft3 | 100 | ||||||
| Pyrite Flotation | ||||||||
| Feed solids density | %w/w | 32 | % | |||||
| Solids Feed rate | t/h | 81.5 | ||||||
| Pyrite Rougher Flotation Time | mins | 30 | ||||||
| Pyrite Rougher Volume Requirement | ft3 | 3,490 | ||||||
| Blue Moon Mine | 112 | March 2025 |
| |
Blue Moon Metals Inc. |
| Criteria | Unit | Value | ||||
| Concentrate Dewatering | ||||||
| Cu Average Feed Rate | t/d | 38.3 | ||||
| Cu Average Feed Rate | t/h | 1.73 | ||||
| Cu Average Concentrate Weight Recovery | % wt rec. | 2.41 | % | |||
| Cu Thickener U/F Density | %w/w | 65 | % | |||
| Cu Thickener Sizing Criteria | t/m2/h | 0.28 | ||||
| Cu Thickener Minimum Diameter | ft | 10.3 | ||||
| Cu Selected Diameter | ft | 13.1 | ||||
| Cu Filter Sizing Criteria | kg/m2/h | 250 | ||||
| Cu Filter Area Required | ft2 | 95 | ||||
| Cu Filter Product Moisture | %w/w | 8 | % | |||
| Zn Average Feed Rate | t/d | 146 | ||||
| Zn Average Feed Rate | t/h | 6.7 | ||||
| Zn Average Concentrate Weight Recovery | % wt rec. | 7.3 | % | |||
| Zn Thickener Sizing Criteria | t/m2/h | 0.28 | ||||
| Zn Thickener U/F Density | %w/w | 65 | % | |||
| Zn Minimum Diameter | ft | 19.7 | ||||
| Zn Selected Diameter | ft | 19.7 | ||||
| Zn Filter Sizing Criteria | kg/m2/h | 250 | ||||
| Zn Filter Area Required | ft2 | 363 | ||||
| Zn Filter Product Moisture | %w/w | 8 | % | |||
| Pyrite Average Feed Rate | t/d | 397 | ||||
| Pyrite Average Feed Rate | t/h | 18.0 | ||||
| Pyrite Average Concentrate Weight Recovery | % wt rec. | 20.0 | % | |||
| Pyrite Thickener Sizing Criteria | t/m2/h | 0.28 | ||||
| Pyrite Thickener U/F Density | %w/w | 65 | % | |||
| Pyrite Minimum Diameter | ft | 32.8 | ||||
| Pyrite Selected Diameter | ft | 32.8 | ||||
| Pyrite Filter Sizing Criteria | kg/m2/h | 500 | ||||
| Pyrite Filter Area Required | ft2 | 618 | ||||
| Pyrite Filter Product Moisture | %w/w | 15 | % | |||
| Tailings Dewatering | ||||||
| Average Feed Rate | t/d | 1,403 | ||||
| Average Feed Rate | t/h | 63.6 | ||||
| Average Yield | % | 70.7 | % | |||
| Design Yield | %w/w | 90.1 | % | |||
| Thickener Sizing Criteria | t/m2/h | 0.40 | ||||
| Thickener U/F Density | %w/w | 60 | % | |||
| Minimum Diameter | ft | 52.5 | ||||
| Selected Diameter | ft | 52.5 | ||||
| Tailings Filter Sizing Criteria | kg/m2/h | 500 | ||||
| Tailings Filter Area Required | ft2 | 1,754 | ||||
| Tailings Filter Product Moisture | %w/w | 15 | % | |||
| Paste Plant | ||||||
| Operating Regime | h/d | 10.8 | ||||
| Operating Regime | d/w | 7.0 | ||||
| Cement Addition | %w/w | 6 | % | |||
| Paste Solids Content | %w/w | 74 | % | |||
| Paste Solids Content | %v/v | 54 | % | |||
| Blue Moon Mine | 113 | March 2025 |
| |
Blue Moon Metals Inc. |
| 17.2 | Process Description |
| 17.2.1 | Crushing Plant |
Underground mineralized material will be transported from the underground mine portal to the crushing plant by means of haul trucks. The trucks shall tip directly into the ore bin. The ore bin has a capacity of 115 short tons and will be equipped with a 23.2-inch static grizzly to prevent oversized ore from entering the crushing circuit. A rock breaker shall be used to break oversized ore. A vibrating grizzly feeder will feed the material from the bin to the primary crusher, which will allow finer material to bypass the crusher.
The primary crusher will be designed to reduce the run-of-mine feed material to 80% passing 5 inches. The crushed material will combine with the undersize material from the grizzly feeder onto the sacrificial conveyor. The sacrificial conveyor will transport the reduced material to a second conveyor which will feed a stockpile.
The major equipment and systems found within the crushing plant are listed below:
| • | Underground ore receiving bin, 115 short tons capacity. |
| • | Vibrating Feeder, TKF11-42-2V model or equivalent. |
| • | Jaw Crusher, JC106 model or equivalent. |
| • | Crusher discharge conveyor. |
| • | Dust collection system. |
| 17.2.2 | Crushed Ore Handling |
The crushed ore handling circuit includes a covered stockpile, reclaim feeders, a SAG mill feed conveyor and a provision for front-end loader access to the stockpile.
Crushed material from the crushing plant will be transferred by means of a conveyor to the stockpile. The covered stockpile is designed to contain 24 hours of live capacity. The stockpile shall be designed to allow front-end loader access to recover material directly from the stockpile or assist in moving the dead fraction of the stockpile. Two reclaim apron feeders shall be installed below the stockpile which will withdraw the crushed material and deposit it onto a SAG mill feed conveyor. This conveyor shall transport the material to the grinding area and will utilize weightometers installed on the conveyor to control the throughput to the mill. The SAG mill feed conveyor will be equipped with an in-load bin which will allow front-end loaders to load spilled material back onto the conveyor.
The major equipment and systems found within the ore handling area are listed below:
| • | Covered stockpile with 1,980 live short tons ore storage capacity. |
| • | Two crushed ore bin apron feeders. |
| • | SAG mill feed conveyor equipped with in-load bin and weightometers. |
As an interim operating scenario, the stockpile may rely on front-end loaders to reclaim the crushed material and load directly into the in-load bin located on the SAG mill feed conveyor. This method would be utilized in the event that the reclaim feeder system capital is deferred to a later date.
| Blue Moon Mine | 114 | March 2025 |
| |
Blue Moon Metals Inc. |
| 17.2.3 | Grinding Circuit |
The PEA grinding circuit comprises a semi-autogenous grinding (SAG) mill operated in an open circuit configuration along with a ball mill operated in closed-circuit with a hydro-cyclone cluster. The overall grinding circuit will be designed to reduce the incoming ore from an 80% passing particle size of 5 inches (127 mm) to a final product size of 74 µm found in the hydro-cyclone overflow stream.
Crushed material will be transported by the SAG mill feed conveyor and be discharged into the SAG mill feed chute. The SAG mill will be a single pinion grated mill operating in an open circuit. The selected SAG mill will have an inside diameter of 13.8 ft (4.2 m) and an effective grinding length (EGL) of 6.9 ft (2.1 m). The mill feed will be mixed with an inlet water stream to maintain a pulp density of 75% solids. The SAG mill discharge slurry will reach an 80% passing product size of 1,000 µm and be collected into a common hydro-cyclone feed pump box which will also receive the discharge from the ball mill.
The selected ball mill will be a single pinion overflow mill, operating in closed circuit with the hydro-cyclone cluster. The mill has an inside diameter of 11.8 ft (3.6 m) and an EGL of 17.7 ft (5.4 m). The underflow stream from the hydro-cyclones shall discharge into the ball mill and diluted with a water stream to maintain a target pulp density of 73% solids. The ball mill discharge shall pass over a slotted trommel screen to remove any scat material from the mill.
The combined SAG and ball mill discharge will be being pumped to the hydro-cyclone cluster to recover the desired -74 µm grind product. The cyclone underflow slurry shall reach a density of approximately 75% solids while the density of the cyclone overflow slurry will be 33% solids. The cyclone overflow stream will pass through a trash screen to remove any debris or contaminants.
Operators will monitor the grinding mills discharge densities, cyclone stream densities, power draw, cyclone pressure among other parameters to maintain an 80% passing product size of 74 µm.
The major equipment and systems found within the grinding area are listed below:
| • | 13.8 ft diameter x 6.9 ft in effective grinding length SAG mill with 1000 HP motor. |
| • | 11.8 ft diameter x 17.7 ft in effective grinding length ball mill with 1400 HP motor. |
| • | Hydro-cyclone cluster and pumping system. |
| • | Grinding media handling system. |
| 17.2.4 | Copper Flotation |
The Blue Moon operation shall utilize a sequential flotation design and will begin with the recovery of copper from the incoming slurry from the grinding circuit. The zinc and pyrite flotation will follow utilizing the tails from the copper circuit.
The copper flotation circuit will prioritize the recovery of copper mineral from the slurry stream and produce a concentrate that will later be dewatered. Lead will typically also report to the copper concentrate.
The hydro-cyclone overflow slurry from the grinding circuit will pass through the trash screen and feed the conditioning tanks and be mixed with flotation reagents. The resulting slurry will then flow by gravity to the copper rougher flotation bank at a nominal density of 33% solids.
| Blue Moon Mine | 115 | March 2025 |
| |
Blue Moon Metals Inc. |
The PEA design includes conventional forced air tank cells as copper rougher flotation cells. The concentrate collected from the roughers shall feed the copper regrind circuit while the rougher tailings will report to the zinc flotation circuit.
The copper regrind circuit will consist of a hydro-cyclone cluster and a stirred vertical mill operating in open circuit. Slurry from the surge tank will be pumped to the cyclone to densify the feed and target an 80% passing size of 20 µm in the overflow that will feed the copper cleaner flotation circuit. The cyclone underflow will be pumped through the bottom of the operating vertical mill and discharge from the top and routed to the cleaner flotation circuit.
The copper cleaner circuit consist of three sequential stages of cleaner flotation. The flotation concentrates flow from the first stage downstream until it reaches the third stage cleaner, the concentrate from which will report to the copper concentrate thickener. The tailings from the cleaner cells flow counter-currently to the concentrate movement. The tailings from the first stage of cleaning will report to the zinc flotation circuit.
The major equipment and systems found within the copper flotation circuit are listed below:
| • | Five 10 m3 rougher cells. |
| • | Three 4.5 m3 cleaner 1 cells. |
| • | Three 4.5 m3 cleaner 2 cells. |
| • | Three 2.5 m3 cleaner 3 cells. |
| • | Vertical copper regrind mill with 250 HP motor. |
| • | Copper regrind hydro-cyclone cluster. |
| 17.2.5 | Zinc Flotation |
The zinc flotation circuit will prioritize the recovery of zinc mineral from the copper flotation tailings. The zinc concentrate will later be thickened and filter pressed.
The tailings stream from the copper rougher bank and the first copper cleaner bank will feed the zinc flotation conditioning tanks and mixed with appropriate flotation reagents. The discharge from the final conditioner will feed the first zinc rougher flotation cell. The concentrate collected from roughers shall report to the zinc regrind circuit while zinc rougher tailings will feed the pyrite flotation circuit.
The zinc regrind circuit will be similar to the copper regrind circuit and have a target product size of 80% passing size of 20 µm. The reground material will gravitate to the zinc cleaner circuit which consists of three sequential stages of cleaner flotation. The first cleaner stage will be dosed with hydrated lime and collectors to facilitate the selection of the zinc from the slurry. The flotation concentrates flow from the first stage downstream until it reaches the third stage cleaner, the concentrate from which reports to the zinc concentrate thickener. The tailings from the cleaner cells flow counter-currently to the concentrate movement. The tailings from the first stage of cleaning will report to the optional pyrite flotation circuit.
The major equipment and systems found within the zinc flotation circuit are listed below:
| • | Five 10 m3 rougher cells. |
| • | Three 8 m3 cleaner 1 cells. |
| Blue Moon Mine | 116 | March 2025 |
| |
Blue Moon Metals Inc. |
| • | Three 8 m3 cleaner 2 cells. |
| • | Three 8 m3 cleaner 3 cells. |
| • | Vertical zinc regrind mill with 250 HP motor. |
| • | Zinc regrind hydro-cyclone cluster. |
| 17.2.6 | Pyrite Flotation (Optional) |
Following the separation of copper and zinc concentrates the remaining minerals contained within the slurry will contain a significant portion of pyrite material. The optional pyrite circuit has been accommodated in the plant layout but is not included in the PEA base case. It relies on a single rougher bank to collect a pyrite concentrate. No cleaner stage or regrind system has been considered for the pyrite circuit at this time.
The zinc rougher and first cleaner tailings streams will both report to the pyrite conditioning tanks where flotation reagents will be added. The conditioner overflow will feed the pyrite rougher bank at a nominal density of 32% solids and a pH of approximately 7.0.
The pyrite rougher flotation cells are conventional forced air tank cells. The concentrate collected from roughers shall report to the pyrite thickener while the pyrite rougher tailings will report to the final tailings thickener.
The major equipment and systems found within the pyrite flotation circuit are listed below:
| • | Five 10 m3 rougher cells. |
| 17.2.7 | Concentrate Dewatering and Handling |
The concentrate handling circuits consists of thickener, filtration and filter cake handling equipment required to dewater the copper, zinc and pyrite concentrates.
Each concentrate steam reports to a dedicated thickener, where flocculant will be dosed to facilitate the settling of solids in the slurry and to reach an underflow density of approximately 65% solids by weight. The thickener overflows will report to the process water system to be re-used within the process plant. The underflows will each report to a dedicated agitated filter feed tank which will be able to hold 12 hours equivalent of slurry.
The copper and zinc concentrates held within their respective filter feed tanks shall each report to a dedicated tower filter press. The filters will be fed according to the required cycle time and will both produce a filter cake containing about 8% moisture by weight. Each cake will be discharged into a separate concentrate stockpile located below the filter press.
To prepare the concentrate for shipment, a front-end loader will recover the filter cake material from the desired stockpile and load a hopper and horizontal conveyor system. This system will deliver the filtered concentrate to a lined shipping container which will be used to transport the material off site. A dedicated system shall be used for each concentrate to prevent cross contamination of concentrates while loading. Dust collection systems shall also be installed to manage dust levels within the concentrate area.
| Blue Moon Mine | 117 | March 2025 |
| |
Blue Moon Metals Inc. |
Optionally, the pyrite concentrate will be pumped from the filter feed tank to a horizontal plate and frame filter press. The pyrite concentrate will be pressed as per the filter cycle and discharge a filter cake with a moisture content of 15% by weight. This pyrite filter cake will report to a conveyor belt which will convey the material to the back-fill paste mixer.
The major equipment and systems included within the concentrate dewatering circuits are listed below:
| • | 13.1 ft (4 m) diameter high-rate copper concentrate thickener. |
| • | 19.7 ft (6 m) diameter high-rate zinc concentrate thickener. |
| • | 32.8 ft (10 m) diameter high-rate pyrite concentrate thickener (optional). |
| • | Flocculant dosing system. |
| • | Copper concentrate tower filter press and loadout conveyor. |
| • | Zinc concentrate tower filter press and loadout conveyor. |
| • | Pyrite concentrate horizontal plate and frame filter press (optional). |
| • | Ancillary equipment for operation of filter presses. |
| • | Dust collection system. |
| 17.2.8 | Tailings Dewatering and Handling |
Tailings from the flotation circuits will report to a tailings thickener, where flocculant will be added to enable settling of the solids. The thickener overflow will feed the process water system for re-use in the process plant. The underflow will reach a design density of 60% solids by weight and will be pumped to an agitated filter feed tank. The filter feed tank will have a residence time of 12 hours and will feed a horizontal plate and frame filter press. The filter press will produce a filtered tailings cake containing 15% moisture, this cake will discharge onto a reversible conveyor. The conveyor will have the option to either deposit the filtered tailings to a stockpile from which it will be loaded onto trucks for long-term dry stack surface tailings storage or feed the paste plant to be used as backfill for the underground mine.
The major equipment and systems found within the tailings dewatering circuits are listed below:
| • | 52.5 ft (16 m) diameter high-rate tailings thickener. |
| • | Flocculant dosing system. |
| • | Tailings horizontal plate and frame filter press. |
| • | Reversible filter cake conveyor. |
| 17.2.9 | Paste Plant |
The paste backfill that will be used in the underground mine operation will utilize a paste mixture prepared from cement, process water and tailings of the mineral processing plant. The filtered pyrite and tailings material will both report to a paste mixer which will combine the filter cakes with a cement binder and adjustment water to reach a desired paste density. This paste will be pumped through the underground distribution network until it reaches the stopes to be filled.
Optionally, the filtered pyrite material will be used in priority to reduce the amount of sulphur-bearing material stored in the surface dry stack tailings area.
| Blue Moon Mine | 118 | March 2025 |
| |
Blue Moon Metals Inc. |
The major equipment and systems included within the tailings dewatering circuits are listed below:
| • | Paste mixer unit. |
| • | Piston paste pumps. |
| • | Cement binder addition system. |
| • | Emergency flushing pump. |
| 17.2.10 | Reagents Handling and Storage |
The Blue Moon mineral processing operation will utilize the following reagents:
| • | Sodium Isopropyl Xanthate (SIPX). |
| • | Potassium Amyl Xanthate (PAX). |
| • | Minerec M2030. |
| • | Oroform D8. |
| • | Zinc Sulphate. |
| • | Copper Sulphate. |
| • | Sodium Cyanide. |
| • | Sulphur Dioxide/Sodium Metabisulphite (SMBS). |
| • | MIBC. |
| • | Lime. |
| • | Sulphuric Acid. |
| • | Flocculant. |
| 17.2.11 | Plant Services |
Compressed air will supply the necessary air for the operation of filter presses, actuation of instruments and maintenance tools. Low pressure blowers will be used to supply air to the flotation cells.
Process water will be recycled from the collection of overflows from the thickeners. Dedicated process water tanks will be used to separate the different water qualities and will be re-used in specific areas. The lower pH copper sulphate solution will be re-used in the copper flotation circuit, the higher pH zinc solution will be used in the zinc flotation circuit and the tailings and pyrite solution will report to a common water tank given the solution is near a neutral pH.
Raw water will be used to feed the potable water system, gland water service and reagent preparation. At times raw water make-up water will be required to replenish the process water circuit as the recirculation of process waters will accumulate reagents over time.
| Blue Moon Mine | 119 | March 2025 |
| |
Blue Moon Metals Inc. |
18.0 PROJECT INFRASTRUCTURE
The infrastructure of this Project is designed to support the operation of 1,800 tonne/day processing plant and production of the underground operation. The mine and processing plant will operate 24 h/day, 7 days/week. The proposed general arrangement for the mine site is presented in Figure 18.1.
Figure 18.1
Blue Moon General Arrangement
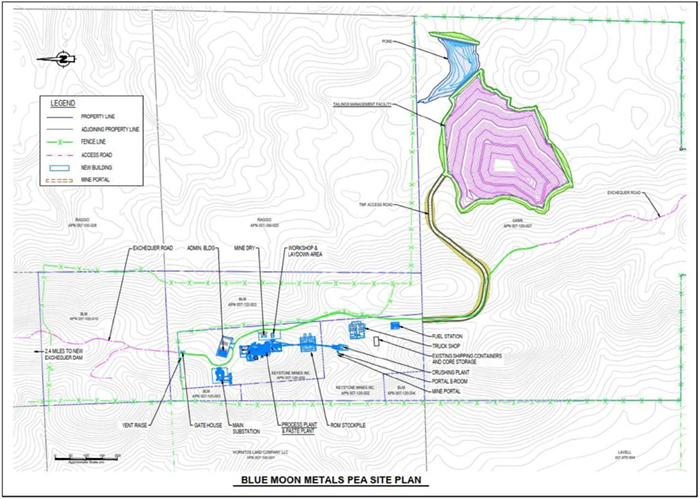
| 18.1 | Roads |
| 18.1.1 | Access Road |
Access to the Blue Moon Project is via Exchequer Rd, a 3.4 mile gravel road which connects to California County Route J16 to the south.
J16, also known as Hornitos and Bear Valley Roads, is a paved secondary highway serving the communities of Hornitos and Bear Valley.
| Blue Moon Mine | 120 | March 2025 |
| |
Blue Moon Metals Inc. |
| 18.1.2 | Haul Roads |
Mine haul roads will be developed to facilitate the transport of personnel, equipment, and materials, as well as to convey mined resources to and from the following areas:
| • | Mine portal. |
| • | Crushing plant. |
| • | Truck shop / Truck wash station. |
| • | Fuel station. |
| • | Processing plant. |
| 18.1.3 | Service Roads |
Service roads will be developed to facilitate personnel, equipment and materials transport on site to and from the following areas:
| • | Gate house. |
| • | Administration building. |
| • | Mine dry. |
| • | Main substation. |
| • | Processing plant. |
| • | Stockpile. |
| • | Explosives magazine. |
| • | Truck shop. |
| • | Mine portal. |
| 18.2 | Utilities |
| 18.2.1 | Power Supply |
Electric power will be supplied from the New Exchequer Powerhouse, which is located on Lake McClure, approximately 1.5 miles north of the Project. Provision is made in the capital cost estimate for a transmission line that will connect the New Exchequer Dam utilities to an on-site substation.
The total power demand of the mine, concentrator and recovery plant is estimated to be approximately 9 MW and requires as substation capacity of approximately 15 MVA.
| Blue Moon Mine | 121 | March 2025 |
| |
Blue Moon Metals Inc. |
| 18.2.2 | Water Systems |
| 18.2.2.1 | Process Water |
Process water will be reclaimed from the water management pond and pumped back to the plant. As described in Section 17.0, there will be multiple process water systems within the plant to minimise inter circuit reagent contamination.
Mine water will be recycled and used underground for drilling, dust suppression, and maintenance needs. All mine water will report to a main sump underground.
| 18.2.2.2 | Fresh Water |
Run-off will be directed by cut-off ditches to a Fresh Water storage pond. The pond will be maintained at a certain level to provide fire water. Should run-off be insufficient and the pond level decrease, pumps will supply water from groundwater wells, subject to hydrogeological studies to confirm capacity.
| 18.2.2.3 | Potable Water |
A modular potable water packaged plant will be used to provide potable water for the operation.
| 18.3 | Fuel Facilities |
A diesel storage tank will be in a fuel station on surface. As the mine continues to develop, underground diesel storage tanks will be installed in the underground shop and other locations in the mine as needed.
All fuel storage tanks will be in non permeable containment berms satisfying the biggest of the following conditions: 110% of the capacity of the biggest storage tank, or 100% of the biggest tank and 10% of the capacity of all the other tanks within the same containment area.
| 18.4 | Buildings |
The following new constructions will be required to support the operations:
| • | Four bay maintenance facility sized to accommodate 50-ton underground trucks |
| • | Administration building accommodating site management, meeting rooms, technical services, administration, medical treatment and training space. |
| • | Process Plant incorporating a paste plant and processing laboratory |
| • | Mine dry |
| • | Compressed air container |
| • | Gatehouse |
| • | Fuel station |
Surface facilities will be expanded as the development of the Project ramps up.
| Blue Moon Mine | 122 | March 2025 |
| |
Blue Moon Metals Inc. |
| 18.5 | Tailings Management Facility |
Tailings from the flotation plant will be thickened using a conventional underflow system and then be further dewatered using a filter press to produce a “dry” cake comprising approximately 90% solids by weight. The daily production of tailings will be approximately 1,800 tonnes, dry mass. In due course, a proportion of the filter cake tailings will be combined with a suitable binder and water to form a paste for backfilling completed underground workings.
The Tailings Management Facility (TMF), comprising a dry stack, water pond and access routes, will be located on 40 acres of land adjacent to the mine. Within this area, the dry stack area will occupy 31 acres, with the remaining land accommodating the pond and access road. The stack and pond will be located in a shallow valley on the eastern side of the Bullion Hill ridge, as indicated in Figure 18.2.
Figure 18.2
TMF General Arrangement
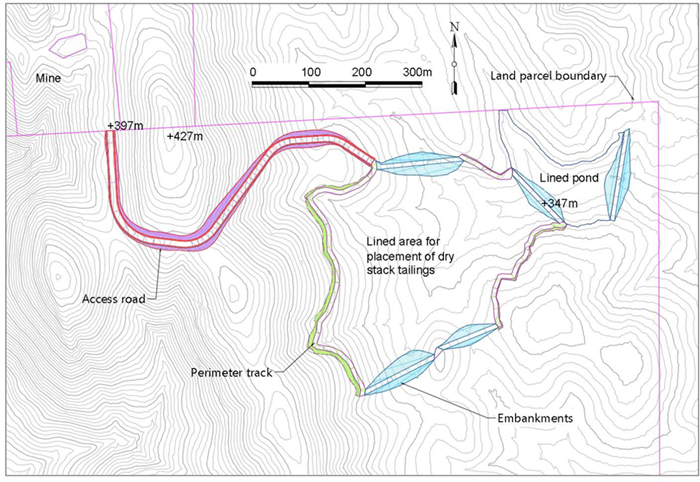
Land preparation will entail removal of vegetation, stripping of topsoil and levelling of any localised steep topography. Four low embankments will be required to infill low areas to produce a regular perimeter of the TMF, plus a fifth embankment to impound the pond.
The assumed containment system is compliant with the requirements of California Code Regulations Title 27, div. 2, 1, ch. 7, subch. 1, art. 1. For the PEA, the tailings are assumed to be group A mining wastes (i.e., containing hazardous substances which pose a significant risk to water quality). Depending on the final choice of reagents and water treatment facilities, a lower classification may be possible. However, reducing the classification to group B mining waste would not make a significant difference in the technical requirements for environmental protection measures.
| Blue Moon Mine | 123 | March 2025 |
| |
Blue Moon Metals Inc. |
The location of the TMF complies with the regulations, being remote from Holocene faults and area of rapid geological change. The location on the side a ridge is not prone to flooding risk. A composite basal sealing system will be installed, comprising a compacted clay liner, 2 ft thick, and a geomembrane of 80 Mil HDPE.
The lowest level on the stack perimeter is 50 m (164 ft) lower than the start of the access road at the mine site, with the access road designed for a maximum grade of 10%. The perimeter of the stack will be delineated by a levelled track, 25 ft wide, which will accommodate a drainage channel, anchor trench for the containment system and safety bunds, plus providing access for construction plant and tailings delivery.
Tailings will be delivered to the TMF by dump trucks and will be placed in a coordinated plan to maintain stability and controlled drainage patterns. Filling will commence in the lowest level of the TMF. Tailings will be paddock tipped and then be spread by bulldozer and compacted by a self-propelled roller to form a nominally level platform of tailings. The smooth surface and a slight fall will direct rainfall runoff to the pond, rather than infiltrating.
The tailings will be placed in a stack with maximum slope grade of 20% to ensure stability. The completed stack will reach an elevation of 383 m, which is below the height of the ridge, thereby limiting visual impact. The pond could be retained after closure.
The proposed TMF layout is shown in Figure 18.3.
Figure 18.3
TMF Layout
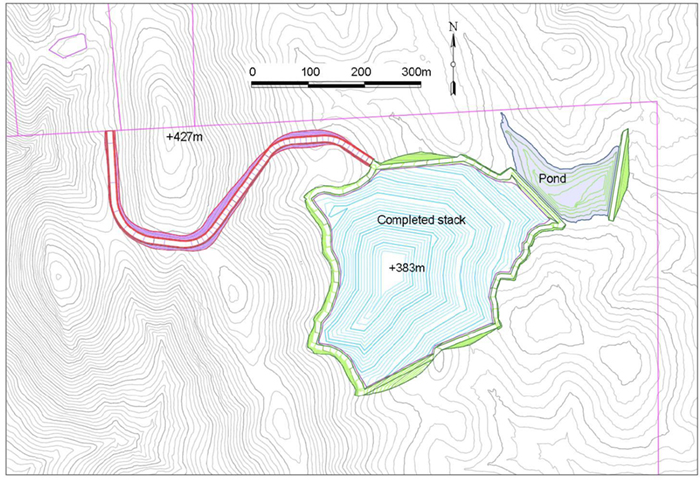
| Blue Moon Mine | 124 | March 2025 |
| |
Blue Moon Metals Inc. |
| 18.6 | Sewage Treatment |
A modular sewage treatment packaged plant will be used to treat effluent.
| 18.7 | Fire Protection |
A fire protection system will need to be installed. Firewater pumps are provided in the capital estimate for this study.
| 18.8 | Ventilation |
Ventilation of the mine will be facilitated by two 400 hp, 280,000 CFM fans to push clean air into the mine.
The ultimate sizing of the primary and secondary fans will be based upon the maximum number of diesel equipment and persons that will be working in the mine at once.
The ventilation arrangement will be designed so as to avoid drawing cold air into the portal, and to assist the naturally buoyant warm air to rise by convection through the ventilation decline.
| 18.9 | Waste Rock Storage |
It is estimated that 939,000 t of waste rock will be produced over the LOM, depending on any deviations from the current development plan. It is envisaged that some of the rock will be crushed and sold as aggregate, estimated at 45,000 t/yr. This would result in up to 400,000 t of waste rock needing to be stored on or near the site over LOM, less any additional material stockpiled off-site for continued aggregate production following mine closure. It may also be possible to identify nearby locations with a requirement for infilling, which would provide a beneficial use.
The potential for acid rock drainage (ARD) will need to be evaluated by laboratory testing. Waste rock dumps will be managed to minimise the potential for ARD, such as zoning of waste dumps, reducing infiltration, and ensuring rapid drainage.
In addition to the waste rock produced by the mine, smaller quantities of cut and fill will be produced and used by the development of the TMF. Stripping of topsoil prior to construction may produce up to 30,000 t, which will need to be temporarily stored prior to its use in restoration. Excavations of near-surface soils and weathered rock would produce up to 20,000 t of material, which could be used in landscaping the TMF.
There will be a requirement for up to 110,000 t of structural fill, primarily to build the TMF embankments. If the timing of mine excavation is suitable, these earthworks could utilise waste rock from the mine. The establishment of a crusher would enhance the opportunities for beneficial use, adding other possibilities such as road stone production.
| 18.10 | Explosives Storage |
Temporary storage magazines will be installed on surface until underground magazines are constructed. The surface and underground magazines will meet all regulatory requirements.
| Blue Moon Mine | 125 | March 2025 |
| |
Blue Moon Metals Inc. |
Once underground magazines are established, explosives will be ordered from the supplier on an as-needed basis.
| 18.11 | Mine Dewatering and Sedimentation Ponds |
Submersible trash pumps situated within each of the sumps will be activated by float switches so as to run only when needed. The size and specifications of the pumps will be determined based on ground water inflow prior to and during operations.
Excess mine water that is not kept within a storage tank nor re-used for mining will report to a sedimentation (settling) pond outside of the mine via an HDPE pipe that will exit at or near to the portal.
The sedimentation pond will be designed to allow for the required retention time so that suspended solids are given adequate time to settle out, so that any water discharged from site will meet applicable environmental regulations. A dosing station may be needed at the sedimentation pond to permit treatment of the water before it exits the pond or is pumped to the process plant.
| 18.12 | Water Usage |
The annual water balance for the processing operation is presented in Table 18.1. This shows the total quantity of water (in US gallons per year) that is used or retained at key stages in the process. The calculation represents stable conditions during the main phase of operations. There will be some transient differences during start-up and shut-down, which will be managed within the overall averages.
Table 18.1
Annual Water Balance
| Parameter | Water in Process Stages (gal/y) | Losses from Process Stages (gal/y) | Gains into Water Circuit (gal/y) | Water Availability (gal/y) | ||||||||||||
| Required for Process | 410,052,826 | - | - | - | ||||||||||||
| Grinding, Gland etc. | - | -14,237,945 | - | - | ||||||||||||
| Input to Flotation | 406,798,438 | - | - | - | ||||||||||||
| Water Lost in Concentrate | - | -1,516,019 | - | - | ||||||||||||
| Water in Raw Tailings | 405,282,419 | - | - | - | ||||||||||||
| Water Removed by Primary Thickener | - | -300,677,106 | 300,677,106 | - | ||||||||||||
| Water in Thickened Tailings | 104,605,313 | - | - | - | ||||||||||||
| Filtrate from Filter Thickener | - | -76,915,671 | 76,915,671 | - | ||||||||||||
| Water Lost in Cake Sent to TMF | - | -14,721,404 | - | - | ||||||||||||
| Water in Tailings Used for Paste | - | -12,968,238 | - | - | ||||||||||||
| Water in Circuit | 0 | - | - | |||||||||||||
| Additional Water for Paste | - | - | -14,142,389 | - | ||||||||||||
| Rainfall and Runoff | - | - | 20,737,756 | - | ||||||||||||
| Miscellaneous Losses | - | - | -1,703,381 | - | ||||||||||||
| Recovered Water | - | - | - | 382,484,763 | ||||||||||||
| Make up | - | - | 27,568,063 | - | ||||||||||||
| Available for Process | - | - | - | 410,052,826 | ||||||||||||
| Blue Moon Mine | 126 | March 2025 |
| |
Blue Moon Metals Inc. |
The average requirement for make-up water will be 75,529 gallons per day. To the extent possible, this will likely be obtained from wells sunk in the area of the mine. However, additional hydrogeological studies will be required to confirm the adequacy of borehole supply capacity.
At steady state, water circulation within the operation is predicted to be slightly higher than 1.1 million gallons per day (gpd). More than 95% of the water will be used directly in the flotation process. Minor uses will include reagent mixing, crushing, gland water, general wash-down, etc. Most of the losses from the process stages will be due to water entrained within the tailings – as paste for underground backfill or filter cake in the TMF.
Water recovery will be achieved by two stages of dewatering, in the primary thickener and filter. Approximately 1 million gpd of water will be recovered from the tailings thickeners and will be reused in the process after adjustment of the reagent composition. Smaller quantities of water will be contained in the final concentrate and lost as evaporation from the pond. This will be offset by minor water gains from precipitation onto the TMF, which will be collected into the pond. A proportion of the mine inflow, estimated as 15,000 gpd, will also contribute to the water balance.
It is assumed that the recovered water will be used directly in the process, after filtration for solids removal (at the pump inlet) and recharging with reagents. Further treatment, to remove residual reagents, is not anticipated at this stage.
| 18.13 | Water Storage |
The Project is anticipated to be a net consumer of water, and is, therefore, designed to operate as a zero-discharge facility.
The main water storage on site will be the pond associated with the TMF, which will have a design capacity of 10 million gallons for storage of process water and a back-up for short-term deficit. The containment system of the pond will be similar to the TMF, i.e., a composite liner of compacted clay covered by a geomembrane. To the extent practicable, tanks at the process site may also be used to capture thickener overflow for re-use, minimizing the pumping requirements for process water supply.
Under normal conditions the use of make-up water will allow the pond level to remain fairly constant, with small fluctuations caused by the minor gains and losses. On an operational basis, the full capacity would provide sufficient process water for at least 10 days of operations, allowing for a zone of dead storage and turbulence as levels drop. The pond management regime would allow for the water level to increase towards the maximum by the start of the dry season.
The pond will provide emergency storage for runoff from the TMF, especially in the wet season. The pond management regime would allow for the water level to decrease before the wet season starts. The design capacity is 50% higher than the runoff that would results from an expected “worst-case” rainfall event. The design regulations require a minimum storage for a 24-hour storm. This is accommodated. A recent rainfall event in the area was reported to produce 8 inches of rain over 5 days. A similar event on site would produce up to 6 million gallons of runoff, which could be accommodated by the pond if the level was kept sufficiently low.
The pond could also provide storage for stormwater runoff from the mine site, which could be piped along the access road to the TMF.
| Blue Moon Mine | 127 | March 2025 |
| |
Blue Moon Metals Inc. |
The design freeboard of the pond is 3 ft. The freeboard would be lined and would provide an emergency storage capacity of up to 4 million gallons. Thus, the runoff from a “worst-case” rainfall event could be accommodated if the pond level was 5ft below the design level.
| 18.14 | Waste Management |
In addition to mining wastes (tailings, waste rock, etc.), the mine will produce a range of waste materials during construction and operations. These will largely be commercial and industrial solid wastes such as packaging from reagents and other materials, replaced parts from equipment, off-cuts and off-spec materials, rags and spoiled PPE and office wastes. There will also be domestic wastes from canteen services. Reduction and reuse of wastes will be practiced where practicable.
Additionally, contracts will be established with licenced waste management operators for the removal of wastes, including any hazardous wastes, to appropriate facilities. Recycling and recovery will be implemented where possible, with disposal of residues to suitable landfill or other facilities as necessary.
The mine will establish a waste collection area, with containers for the temporary storage of wastes, pending collection. Containers will be weather-proof and will also deter vermin. They may be located in a fenced compound, if necessary. Waste will be segregated in coordination with the waste management contractors, with separate storage for, as example, metals, plastics, wood, card and paper, IEEE, rags. Containers will be labelled, and potentially contaminated and hazardous materials will be identified with warning signs. Wood waste will be reused, where possible. Uncontaminated construction wastes, such as surplus or demolished concrete or aggregates may be used as temporary pavements in the TMF, especially during wet weather.
It is envisaged that liquid wastes, such as waste oils and hydraulic fluid, will be taken off site and appropriately managed by the vehicle maintenance contractors. Storage tanks or drums would be located in the waste accumulation area for any ad-hoc liquid wastes that arise.
The mining process per se will not generate liquid wastes, as the solutions will be recycled and reused.
| Blue Moon Mine | 128 | March 2025 |
| |
Blue Moon Metals Inc. |
19.0 MARKET STUDIES AND CONTRACTS
| 19.1 | Contracts |
There are no material contracts in place concerning the Blue Moon Property.
For the purposes of this PEA, Micon has used its own resources to determine a reasonable estimate of concentrate off-take terms. Details of those terms are given in Section 22 of the report.
| 19.2 | Market Studies |
All the payable commodities considered in this PEA (zinc, copper, lead, gold and silver) are openly traded with price transparency. Micon has utilized its records of historical prices as well as current market trends and published institutional consensus price forecasts in setting the base-case, spot and consensus prices used in its economic analysis.
| 19.2.1 | Zinc |
Over the past ten years, the 12-month trailing average price for zinc has largely remained in the range of US$1.00 to US$1.50 per pound. Micon’s QP has used a mid-range figure of US$1.25/lb for the base case in this PEA (Figure 19.1).
Figure 19.1
Zinc Market Price 2015-2025
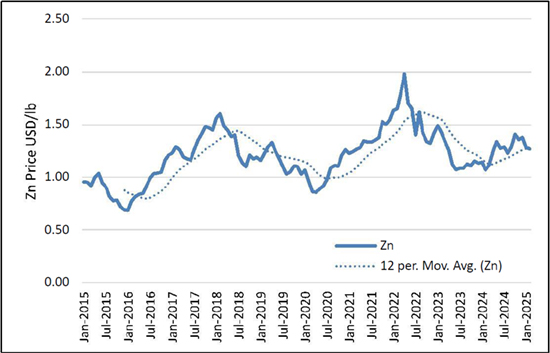
| 19.2.2 | Copper |
Copper is seen to have risen markedly in recent years and may be expected to continue to show strong price growth in the future due to supply constraints and strong demand. Micon’s QP has selected a price of US$4.20/lb for the base case in this PEA, approximating the 12-month trailing average to February 2025 (Figure 19.2).
| Blue Moon Mine | 129 | March 2025 |
| |
Blue Moon Metals Inc. |
Figure 19.2
Copper Market Price 2015-2025
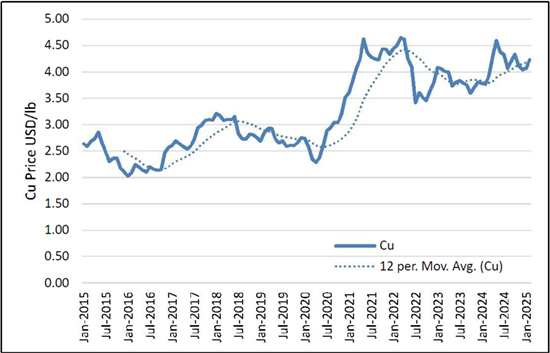
| 19.2.3 | Lead |
Lead has not been attributed any value for the purpose of this PEA. Nevertheless, it remains a component of the mineral resource and, subject to further metallurgical testwork, may become a payable metal in a future study. Lead has shown little change in price over the past 10 years, as shown in Figure 19.3.
Figure 19.3
Lead Market Price 2015-2025
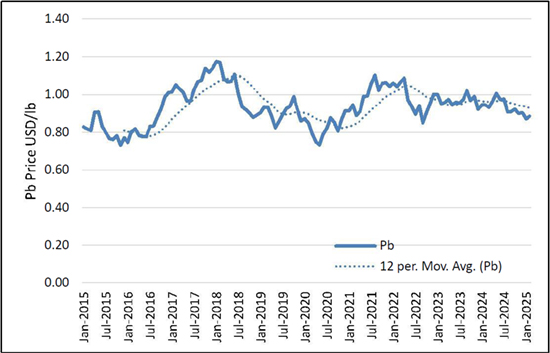
| Blue Moon Mine | 130 | March 2025 |
| |
Blue Moon Metals Inc. |
| 19.2.4 | Gold |
The gold price has climbed steadily over the past 18 months and averaged over US$2,890/oz in February, 2025. Micon’s QP has used a conservative value of US$2,200/oz for the PEA base case (Figure 19.4).
Figure 19.4
Gold Market Price 2015-2025
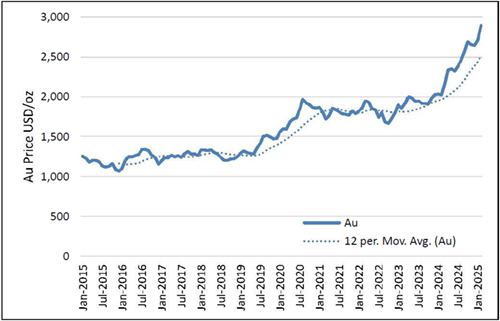
| 19.2.5 | Silver |
The silver price has also climbed steadily over the past 18 months and averaged over US$32.18/oz in February, 2025. Micon’s QP has used a conservative value of US$27/oz for the PEA base case (Figure 19.5).
Figure 19.5
Silver Market Price 2015-2025
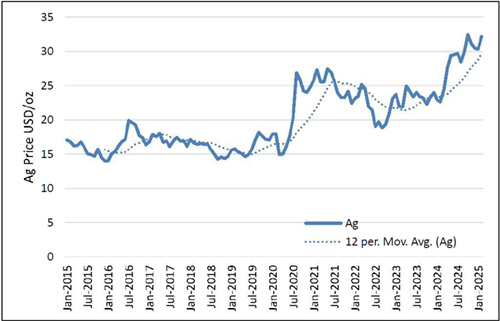
| Blue Moon Mine | 131 | March 2025 |
| |
Blue Moon Metals Inc. |
| 19.2.6 | Aggregate |
Compass Land Group conducted an analysis of the potential for sales of aggregate using waste rock from the Blue Moon Property (Main, 2024). The Compass report indicates the existence of an opportunity to supply 35,000 to 50,000 tons per year of aggregates to the local market. In its PEA, Micon has assumed that 50,000 tons per year can be supplied at a break-even price.
| 19.2.7 | Pyrite |
Metallurgical testwork has demonstrated the potential for recovery of a pyrite concentrate from the Blue Moon tailings stream. Future studies could investigate whether a market exists for purchase of that concentrate, possibly as a source of sulphur for other industrial processes. The PEA has been prepared assuming no pyrite concentrate is recovered.
| 19.2.8 | Barite |
The occurrence of barite (BaSO4) associated with metalliferous mineralization at Blue Moon has been documented. In the event that future metallurgical testwork shows barite to be recoverable, a possible market exists for barite as a component of drilling ‘mud’ used in the oil and gas industry, and the potential for sales into that market should be investigated. No barite revenue is included in the PEA.
| 19.2.9 | Gypsum |
The occurrence of gypsum (CaSO4·2H2O) associated with metalliferous mineralization at Blue Moon has also been documented. Gypsum is used in a variety of industrial applications including drywall and cement manufacture. Should future metallurgical testwork show gypsum to be recoverable from the process plant feed, the potential for gypsum sales should be investigated.
| 19.2.10 | Gallium, Germanium and Indium |
Gallium (Ga), germanium (Ge) and indium (In) are recognised as frequently occurring in trace amounts within sphalerite deposits. Further studies should therefore aim to quantify the amounts of each that might potentially be recovered into zinc concentrates at the Property, and investigate the payability of each of these metals in those concentrates.
| Blue Moon Mine | 132 | March 2025 |
| |
Blue Moon Metals Inc. |
20.0 ENVIRONMENTAL STUDIES, PERMITTING AND SOCIAL OR COMMUNITY IMPACT
This section of the report summarizes the current status of permitting and environmental studies for the Blue Moon Project. It provides an overview of the environmental and social context and identifies preliminary risks and impacts, together with conceptual strategies for management and closure planning. Information is based on secondary data, including historical baseline studies, and feedback from a site visit conducted by Micon QPs in November, 2024.
| 20.1 | Regulatory Framework and Project Permitting |
The Project is subject to the Federal laws of the USA, California State laws, and local requirements of Mariposa County. Development activities on the Property are subject to various federal, state, and local laws and regulations. The environmental effects of proposed development activities will be evaluated by the BLM and the Mariposa County Planning Department in accordance with the National Environmental Policy Act (NEPA) and the California Environmental Quality Act (CEQA). There are various federal and state environmental laws and regulations that will also apply to proposed development activities on the Property.
| 20.1.1 | Summary of Key Mining and Environmental Legislation |
The legal framework surrounding mining activities in California is comprehensive and environmental standards are high. The associated environmental permitting process can therefore be extensive and time-consuming.
The following list summarizes the key legislation that may be applicable to the Project. A more comprehensive list will be prepared as the Project advances to the next stage.
| • | Federal Mining Law of 1872 – This law governs mining activities, including processing, on unpatented mining claims located on public lands. |
| • | Federal Law Policy and Management Act (FLPMA) – This law governs the Bureau of Land Management’s administration of federal public lands consistent with the “multiple use” mandate. |
| • | Bureau of Land Management (BLM) Surface Management Regulations – These regulations guide BLM’s review of proposed mining activities for consistency with FLPMA and other applicable laws. The regulations also prescribe technical and operating standards for mining activities. |
| • | National Environmental Policy Act (NEPA) of 1970 – This Act governs the environmental review of “federal actions” such as authorizations to undertake development activities (including mining) on public lands. |
| • | California Environmental Quality Act (CEQA) of 1970– This Act governs the environmental review of proposed development activities in California (including mining). |
| • | California Surface Mining and Reclamation Act (SMARA) of 1975 – This Act prescribes standards for surface mining activities and attendant reclamation to minimize environmental impacts and provide for the land to be returned to a suitable condition after reclamation. |
| Blue Moon Mine | 133 | March 2025 |
| |
Blue Moon Metals Inc. |
| • | California Sustainable Groundwater Management Act (SGMA) of 2014 – This Act promotes the sustainable use of groundwater resources and aims to avoid their depletion. |
| • | California Code of Regulations (CCR) – This represents the official compilation and publication of all regulations adopted, amended or repealed by the various state agencies. It includes provision for infrastructure requirements relevant to mining activities, such as tailings impoundments. |
Additional relevant legislation may include, but is not limited to: the Clean Air Act, Clean Water Act, Endangered Species Act, and Safe Drinking Water Act and equivalent or similar state regulatory programs.
| 20.1.2 | Environmental Permitting Process |
Prior to construction and operation of mining projects in California, an environmental review process is required under CEQA. NEPA review is also required for federal actions. The environmental review can be documented in separate reports or a combined report that covers both Federal and State requirements. CEQA documents include Mitigated Negative Declarations (MND) and Environmental Impact Reports (EIR). NEPA documents include Environmental Assessments (EA) and Environmental Impact Statements (EIS).
An overview of the environmental review processes is as follows:
| • | Applications for development activities are filed with the BLM and the Mariposa County Planning Department (County). |
| • | Those agencies evaluate the applications for “completeness” in accordance with applicable regulations. |
| • | The agencies conduct scoping processes to evaluate the level of environmental review required under NEPA and CEQA. |
| • | For projects with activities on both public and private lands that are not exempt from environmental review pursuant to the provisions of NEPA or CEQA, the agencies can either prepare a combined environmental document to satisfy NEPA and CEQA, or BLM can prepare its own NEPA document and the County can prepare its own CEQA document. |
| • | Drafts of the environmental document(s) will be released for public review and comment. There are typically informational meetings as well where members of the public can ask the agencies questions about the proposed development activities. |
| • | The agencies will provide written responses to any public comments received prior to taking action on the permit applications. |
| • | As part of its environmental review of proposed activities, BLM and the County may need to consult with federal and state regulatory agencies in regard to impacts to certain categories of resources, such as biological resources or cultural resources. |
| • | Depending on the level of project impacts, additional permits or authorizations may be required from federal or state regulatory agencies, as discussed below. |
Various other regulatory permits and supplementary authorizations may also be necessary. These may include: rights of way for water pipelines and power lines, and permits for building, road construction and maintenance, hazardous materials, fuel storage, explosives, operation of mobile equipment, air emissions, groundwater abstraction, and sewage. The onsite handling of waters would be regulated by the Central Valley Regional Water Quality Control Board.
| Blue Moon Mine | 134 | March 2025 |
| |
Blue Moon Metals Inc. |
| 20.1.3 | Project Permitting Status |
Blue Moon Metals Inc. (BMM), holds the mineral rights to the Blue Moon VMS deposit through its wholly owned subsidiary, Keystone Mines Inc. The mineral rights cover a total land area of approximately 494 acres and comprise three distinct land tenure components:
| 1. | Two patented mining claims (American Eagle, and Blue Bell and Bonanza) owned 100% by Keystone Mines Inc. covering approximately 43 acres. |
| 2. | Eight Unpatented mining claims (Federal Lode Claims) (Red Cloud 1-8) owned 100% by Keystone Mines Inc. on land administered by the Bureau of Land Management (BLM) covering approximately 120 acres. |
| 3. | 100% interest in the mineral rights from two Spanish Land Grants of the James Gann Jr. Trust of 1991, owned by Keystone Mines Inc. in conjunction with a 40-acre surface rights lease agreement (the location of which is flexible), pursuant to an option purchase agreement completed in 2001 (known as the Gann Land, covering approximately 331 acres). |
The various mineral rights have been independently checked by a legal team on behalf of BMM and Keystone Mines Inc. All claims are understood to be in good standing. It is noted that the next payment is due to BLM by 1 September 2025 to maintain the active status of the unpatented mining claims.
The Project area is shown in Figure 20.1 and the mineral rights are further detailed Table 20.1 (over).
Keystone Mines Inc. has obtained approval for drilling activities associated with the Blue Moon Exploration Project via a Notice of Intent (NOI) from the Bureau of Land Management.
The PEA envisages surface infrastructure for the proposed Blue Moon Project will be predominantly located on the Patented Mining Claims. The Tailings Management Facility (TMF) and water storage pond will be located on a 40-acre area to the southeast, within the surface rights agreement of the privately owned Gann land.
The environmental permitting process for the Project is yet to commence. The specific requirements will be reviewed and confirmed with Mariposa County as the Project advances.
| Blue Moon Mine | 135 | March 2025 |
| |
Blue Moon Metals Inc. |
Figure 20.1
Mining Claim Boundaries
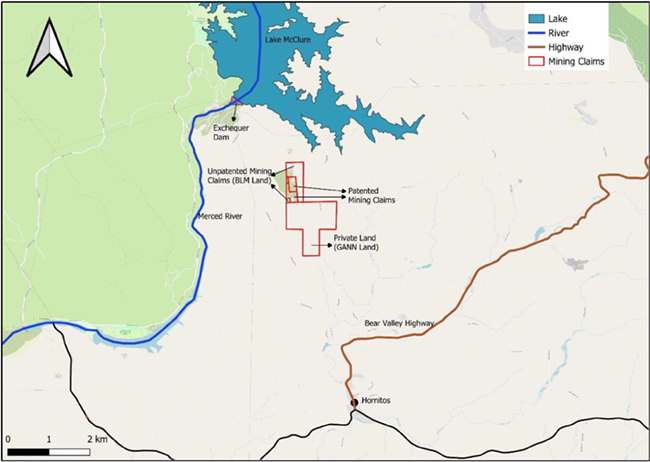
| Blue Moon Mine | 136 | March 2025 |
| |
Blue Moon Metals Inc. |
Table
20.1
Summary of Mineral Rights associated with the Blue
Moon Project
| # | Claim Type | Status | Claim Reference # |
Claim Name |
Claim Size (Acres) |
Parcel Number (APN) |
Claim Owner |
Notes |
| Patented Claims | ||||||||
| 1 | Patented Mineral Claim | Active | MS 5719 | American Eagle | 20.67 | 007-120-005-0 | Keystone Mines Inc. | Patent No. 973403 dated January 28, 1926, covering Mineral Survey No. 5719, for the American Eagle lode mining claim, covering portions of Section 30, Township 4 South, Range16 East, MDM. |
| 2 | Patented Mineral Claim |
Active | M5718 | Blue Bell and Bonanza | 22.40 | 007-120-002-0 | Keystone Mines Inc. | Patent No. 959494, dated May 18, 1925, covering Mineral Survey No. 5718, for the Blue Bell and Bonanza lode mining claims, covering portions of Section 30, Township 4 South, Range16 East, MDM. |
| BLM Land | ||||||||
| 3 | Unpatented Mining Claim (Federal Lode Claim) | Active | CA101349794 | Red Cloud #1 | 20.32 | 007-100-010-0 | Keystone Mines Inc. | Land administered by Bureau of Land Management (Federal Land) |
| 4 | Unpatented Mining Claim (Federal Lode Claim) | Active | CA101303528 | Red Cloud #2 | 20.66 | 007-100-010-0 | Keystone Mines Inc. | Land administered by Bureau of Land Management (Federal Land) |
| 5 | Unpatented Mining Claim (Federal Lode Claim) | Active | CA101300462 | Red Cloud #3 | 6.89 | 007-100-010-0 | Keystone Mines Inc. | Land administered by Bureau of Land Management (Federal Land) |
| Blue Moon Mine | 137 | March 2025 |
| |
Blue Moon Metals Inc. |
| # | Claim Type | Status | Claim Reference # |
Claim Name |
Claim Size (Acres) |
Parcel Number (APN) |
Claim Owner |
Notes |
| 6 | Unpatented Mining Claim (Federal Lode Claim) | Active | CA101301850 | Red Cloud #4 | 20.66 | 007-120-003-0 | Keystone Mines Inc. | Land administered by Bureau of Land Management (Federal Land) |
| 7 | Unpatented Mining Claim (Federal Lode Claim) | Active | CA101452189 | Red Cloud #5 | 20.66 | 007-120-003-0 | Keystone Mines Inc. | Land administered by Bureau of Land Management (Federal Land) |
| 8 | Unpatented Mining Claim (Federal Lode Claim) | Active | CA101379487 | Red Cloud #6 | 20.66 | 007-120-003-0 | Keystone Mines Inc. | Land administered by Bureau of Land Management (Federal Land) |
| 9 | Unpatented Mining Claim (Federal Lode Claim) | Active | CA101347731 | Red Cloud #7 | 3.16 | 007-120-004-0 | Keystone Mines Inc. | Land administered by Bureau of Land Management (Federal Land) |
| 10 | Unpatented Mining Claim (Federal Lode Claim) | Active | CA101378594 | Red Cloud #8 | 6.89 | 007-100-010-0 | Keystone Mines Inc. | Land administered by Bureau of Land Management (Federal Land) |
| GANN Land | ||||||||
| 11 | Private Lands | Active | Letter dated
September 1, 2001 |
Spanish Land Grant (J.GANN) | 331.28 | 007-120-007-0 | Keystone Mines Inc. | Includes 40 acres surface rights, flexible location within total 331.3 acre area |
| Blue Moon Mine | 138 | March 2025 |
| |
Blue Moon Metals Inc. |
| 20.1.4 | Good International Industry Practice |
In addition to compliance with all applicable Federal, State and County legal requirements, Blue Moon intends to develop the Project in general alignment with good international industry practice (GIIP). Such an approach will demonstrate Blue Moon’s responsible business ethics and commitment to environment, social and governance (ESG) principles, and may also help facilitate any potential financial lender requirements in the future.
Examples of relevant and widely accepted international guidelines, which represent GIIP, are as follows:
| • | International Finance Corporation Environmental and Social Performance Standards (IFC PS) – these are part of the IFC’s Sustainability Framework. The IFC PS provide a baseline of environmental and social good practice and form an important assessment reference. |
| • | Equator Principles (EP) – these form a risk management framework, adopted by international financial institutions for determining, assessing and managing environmental and social risk in projects. The EP framework is based on the IFC PS and on the World Bank Group (WBG) Environmental, Health and Safety (EHS) Guidelines on environmental and social sustainability. |
| • | World Bank Environmental, Health and Safety Guidelines (WB EHS) – these provide a source of technical information during project appraisal. They are widely accepted as technical reference documents presenting general and industry specific examples of GIIP. For the mining industry, sector specific guidelines for open-pit mining are also relevant. |
| • | International Council on Mining and Metals (ICMM) Mining Principles – these have been developed in response to evolving societal expectations of the mining industry, and include a comprehensive set of Performance Expectations, Position Statements, and Good Practice Guides, including widely recognized guidelines for integrated mine closure. |
| • | Global Industry Standard for Tailings Management (GISTM) – the Standard was developed by an independent review process in response to a number of tailings dam failures. It was initiated by the International Council on Mining and Metals (ICMM), United Nations Environment Program (UNEP) and Principles for Responsible Investment (PRI) and provides a global benchmark to achieve strong social, environmental and technical outcomes in tailings management. |
| • | The International Cyanide Management Code for the Manufacture, Transport and Use of Cyanide in the Production of Gold (Cyanide Code, ICMC) – the Cyanide Code is a voluntary, performance driven, certification program of best practices for gold and silver mining companies, and the companies producing and transporting cyanide used in gold and silver mining. |
| 20.2 | Status of Environmental and Social Studies |
The most recent technical report (November 2023) for the Blue Moon Project did not include an environmental and social component. No environmental or social studies have yet been undertaken for the current Project, and are not yet required.
Technical studies were undertaken in the 1980s under previous management of the Property, as part of the permitting process for planned development of a vertical underground shaft and associated mining/processing infrastructure, which did not progress. These studies provide an indication of baseline conditions in the Project area at the time, and can be used to inform the approach to future studies. The relevant environmental and social studies are listed in Table 20.2.
| Blue Moon Mine | 139 | March 2025 |
| |
Blue Moon Metals Inc. |
Table 20.2
Summary of Historic Environmental and Social Baseline Studies
| Report Name | Author | Date |
| Terrestrial Wildlife Resource Report for the Blue Moon Project | Cedar Creek Associates Inc. | 1988 |
| Cultural Resource Study | Napton & Greathouse | 1988 |
| Seismicity Study Blue Moon Project | Knight Piésold | 1988 |
| Hydrogeological Investigations and groundwater Modelling | Knight Piésold | 1988 |
| Blue Moon - Hydrogeological Investigations and Groundwater Modelling | Knight Piésold | 1989 |
| Water Resources Technical Report for the Blue Moon Project Underground Exploration Program | Riverside Technology Inc. | 1989 |
| Mine Waste Classification, Blue Moon Property | Philips & Plumley | 1989 |
| Mariposa Community Profile Project | D&S Whitcombe | 1991 |
As the Project design advances updated technical and environmental studies will be necessary.
The previous baseline studies did not identify any significant barriers to Project development, however, it is important to note that they were undertaken on a different project design.
| 20.3 | Environmental and Social Context |
The Blue Moon Project is located in Mariposa County, east central California, USA.
| 20.3.1 | Overview |
The Project is situated within the lower western foothills of the Sierra Nevada mountain range. There are several well-known conservation areas along the foothills, including Yosemite National Park, Stanislaus National Forest, and Sierra National Forest. The Project is situated within the Merced River watershed, with the Merced River Recreation Management Area/Wilderness Study area located approximately 15 miles east of the Project, and the river itself flowing 1 mile west of the Project site. Lake McClure, formed by the New Exchequer Dam and part of the Merced watershed, is immediately north of the Project boundary and provides water for irrigation, hydropower and recreational use (Figure 20.2, over).
The Project site is dominated by a rhyolite ridgeline with elevations ranging between 1,420 ft and 1,180 ft above mean sea level. The landscape consists of open rolling hills with dry grassland and sparse tree cover. The climate is Mediterranean (temperate), with hot summers, cool winters, and an average annual rainfall of 20 inches. Temperatures range from around 48°F to 82°F and most precipitation occurs between November and May, with the exception of summer thunderstorms (CCA Inc., 1988). It is on the western edge of the Sierra Foothills Fault System, which is a system of relatively low seismicity for the region. Exploration and mining operations can be conducted year-round.
An indication of current site conditions is provided in Figure 20.3 (see page 142).
| Blue Moon Mine | 140 | March 2025 |
| |
Blue Moon Metals Inc. |
Figure 20.2
Environmental and Social Context of Project Site
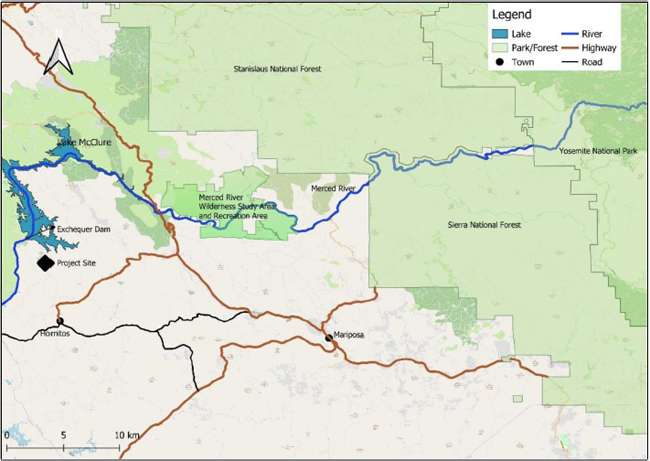
| 20.3.2 | Water Resources |
The Project site lies within the watershed of the Merced River, which originates in the Sierra Nevada to the east and flows through Yosemite National Park and past the Project site into the San Joaquin River valley in the west. Site drainage is intermittent and seasonal, flowing towards Hornitos Creek (a tributary of Merced River) south and east of the ridgeline, and towards Lake McClure and Lake McSwain in the north and west (Riverside Technology Inc., 1989). Small natural springs have been identified on site. High concentrations of metals are anticipated in the water due to the geology and legacy of mining activity. No recent water quality sampling has been undertaken.
| 20.3.3 | Biodiversity |
Baseline studies undertaken in 1988 stated that there was no aquatic habitat or wetlands in the immediate footprint of the Project, but the close proximity of Lake McClure and the Merced River was noted. Terrestrial habitat comprises Oak Woodland, Annual Grassland, Digger Pine Woodland, and limited Bucktrush Chaparral (scrubland), with old mine workings also potentially providing cave-like conditions. The area provides feeding grounds and potential habitat for a variety of birdlife including songbirds, gamebirds, woodpeckers, owls and raptors, as well as recreational bird-watching opportunities. Mule deer was the only large mammal species considered likely to be present, with low potential for mountain lion and black bear in the wider region.
| Blue Moon Mine | 141 | March 2025 |
| |
Blue Moon Metals Inc. |
Figure 20.3
Environmental Conditions at the Project Site (November 2024)
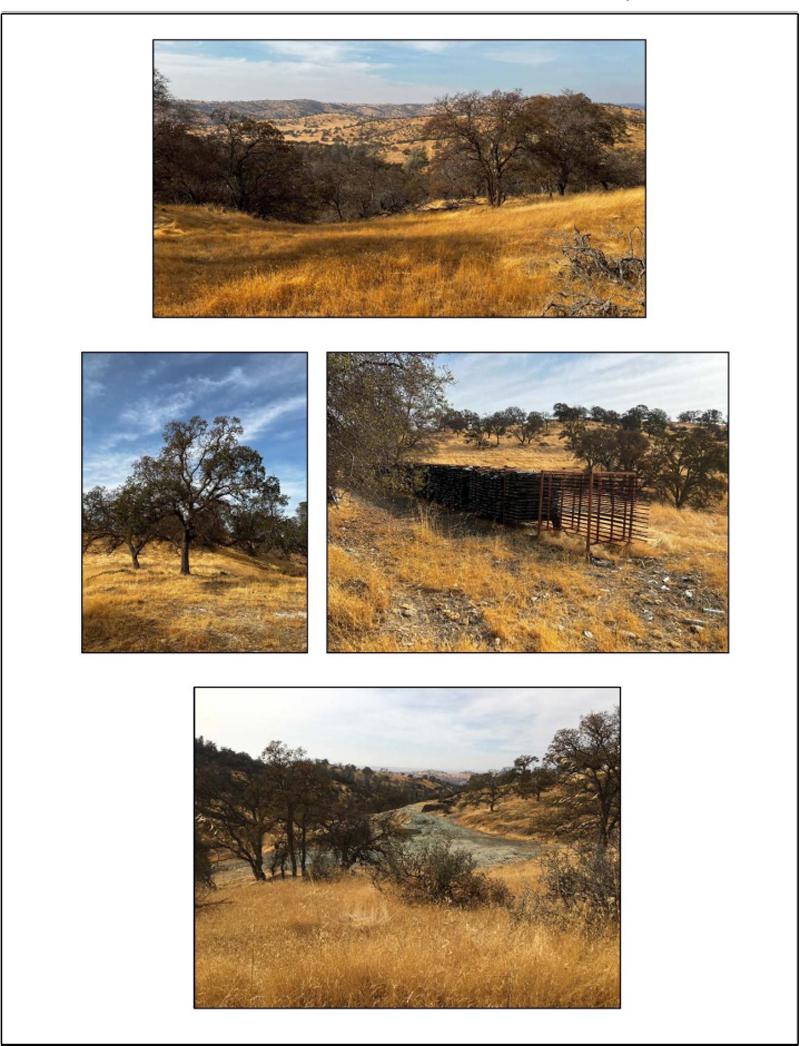
| Blue Moon Mine | 142 | March 2025 |
| |
Blue Moon Metals Inc. |
Actual wildlife sightings were limited, but the types of species likely to be present were considered typical of the region and not at significant risk from mining activities. Endangered or threatened species with potential to occur in the Project area included Pale Big-eared Bat (Corynorhinus townsendii pallescens), Spotted Bat (Euderma maculatum) and Bald Eagle (Haliaeetus leucocephalus).
| 20.3.4 | Cultural Heritage |
The area around the Project site is associated with historic Native American occupation of Bullion Hill. Eight sites of archaeological interest were found in the vicinity of the Project during the 1988 Cultural Resource Survey. None of the sites correspond with the footprint of the current Project design and only one site is close to the proposed infrastructure area within the patented claims. All sites should be carefully avoided in any future drilling programs and re-surveyed to document the current condition. Consideration should be given to protective fencing for the closest site.
| 20.3.5 | Socio-economic Setting |
The nearest settlement to the Project is the small town of Hornitos, located approximately 4.5 miles south. Hornitos was established as a mining town during the gold rush and had a population of >10,000 during the 1850s. The population has substantially declined since then, with a current estimate of <75 residents, however it is now a popular tourist attraction. The Project site is approximately 16 miles from Mariposa and 22 miles from Merced. There are active mining operations in the region, and good transport connections to Reno and Oakland port, with existing gravel access roads from Highway 49.
The Project site was historically mined as part of the Californian Gold Rush and gold, silver, copper, lead and zinc were produced there until around 1945 under previous ownership of the Property. There is evidence of old mining workings, tailings deposits and cores samples around the site and a modern core shed has been used for more recent exploration activity. Current land use in the immediate surrounding area is predominantly cattle grazing.
A survey was undertaken with local residents in 1990-1991, to understand perceptions of various socio-economic factors at the time. This survey is no longer considered relevant for the Project and a socio-economic baseline study will be required.
| 20.4 | Environmental and Social Risks and Impacts |
The Project will be designed to minimize environmental impacts as far as possible and enhance socio-economic opportunities. The site has been mined historically so is not a greenfield development, and the spatial footprint will be limited, with mining activity taking place underground and no heap leach facility.
A full review of the potential environmental and social impacts will be undertaken as the Project advances. Based on the current Project design, location, and an understanding of metal mining operations in similar environments, the main potential risks are anticipated to include the following:
Natural Hazards – The Project is located in an area of active seismic activity. The probability of a major seismic event is considered to be ‘extremely low’ (KP, 1988), but must be taken into account for TMF design. The area can also experience localized flash flooding after thunderstorms, therefore adequate water storage capacity will need to be included to ensure appropriate drainage and separation of potential contaminants during extreme events.
| Blue Moon Mine | 143 | March 2025 |
| |
Blue Moon Metals Inc. |
Disturbance from Air Quality, Noise, Vibration and Artificial Lighting – The Project will generate greenhouse gas emissions, dust, noise, vibration and artificial light from routine operational activities including movement of vehicles and equipment, drilling, blasting and crushing. This has the potential to cause disturbance to local wildlife and will need to be monitored; nearby communities are unlikely to be disturbed. A combination of engineering controls and operational controls will be used to minimize impacts.
Water Resources – The Project intends to operate as a closed loop water system, with no planned discharge to the environment (e.g. rivers). Supplementary water will be needed for operational use, with the likely source being from groundwater, subject to additional studies. Project operations have the potential to impact downstream water quality via uncontained stormwater runoff/drainage, potential seepage from waste material (tailings) and accidental spills/leaks. There is a particular risk from the use of sodium cyanide in the process plant, and specific management and monitoring measures will therefore need to be implemented. Groundwater levels may be affected by pumping for dewatering, and potential connectivity with old mine workings should be considered. Given the nature of the geology and historic mining activity, there is potential for leaching of heavy metals and potential seepage from acid generating material. Water treatment would likely be required if any discharge into the environment (i.e., beyond designated storage ponds) becomes necessary.
Biodiversity – Wildlife presence and habitat at the Project site is considered to be representative of the surrounding area. Terrestrial habitat loss due to the Project is unlikely to have a significant or long-term impact. There is potential for impacts to birds of prey that may nest in taller trees surrounding the site, and for migratory birds that may be attracted to artificial water bodies on site. Communication with relevant stakeholders is recommended, to better understand local and regional wildlife movements. Process water bodies will require appropriate bird deterrents, due to the potential presence of cyanide.
Tailings Management – The Project will require construction of an engineered Tailings Management Facility. Detailed design has not yet been undertaken but will incorporate state and international guidelines and provision for appropriate liners, drainage and monitoring systems, including for residual cyanide detection. As extensive exploration activity has historically been undertaken, pre-construction surveys will be needed to ensure that drill holes have been adequately sealed, to minimize the risk of seepage to groundwater.
Cultural Heritage – There are several sites of archaeological interest located close to the Project site, some of which were disturbed during historic mining/exploration activity. There is a risk that further exploration drilling and Project construction works may cause accidental damage to these sites. This can be managed by integrating the locations of sites into planning and design systems, using agreed vehicle access routes, and maintaining a watching brief during construction in sensitive areas. Development of a Chance Finds Procedure and Cultural Heritage Management Plan is recommended, in addition to consultation with regulatory authorities to determine if any of the sites require fencing for protection.
Socio-economic impacts – Overall, the Project is expected to have a positive impact on the local and regional economy, through creation of direct and indirect jobs and associated training opportunities. Details of job opportunities will be refined as the Project progresses through FS stage and priority will be given to hiring and procurement from local communities. Proactive engagement will be undertaken with the local communities and a Grievance Mechanism will be established.
| Blue Moon Mine | 144 | March 2025 |
| |
Blue Moon Metals Inc. |
At this stage of the Project, potential environmental and social risks and impacts are considered typical of similar exploration and mining operations in North America. Any negative impacts can be managed appropriately, provided that:
| • | The Project Design Criteria incorporates sufficient environmental protection measures. |
| • | A comprehensive environmental and social management system (ESMS) is developed and implemented prior to construction. |
| • | Sufficient financial resources are allocated for technical staff, monitoring equipment and sample analysis. |
| 20.5 | Project Closure Planning |
Responsible closure planning will be integrated into all phases of the Blue Moon Project and undertaken in compliance with Federal and California State requirements and GIIP, for example the ICMM Guidance for Integrated Mine Closure.
A Reclamation Plan will be developed and submitted to the regulatory authorities as part of the project permitting process, and this must be approved before mining commences. Financial assurance (reclamation bond) will be posted with both the BLM and Mariposa County, and reviewed annually.
The approach to closure planning will focus on returning the land to pre-mining conditions, to the extent possible. It will minimize negative environmental and social impacts, enhance environmental and social benefits, and take due consideration of public health and safety. Reclamation activities will include:
| • | Backfilling of underground mining areas and restricting access to the portal. |
| • | Dismantling of surface infrastructure and equipment. |
| • | Capping, covering with topsoil, and re-vegetating the TMF. |
| • | Planting of native tree species. |
Stakeholder engagement will take place to assess whether any of the supporting infrastructure can be left in situ for use by the local community, such as access roads.
Regular inspection of the site and environmental monitoring, particularly for downstream water quality, will be carried out post-closure.
A collaborative approach will be undertaken with BLM to assess reclamation requirements and responsibilities for old mine workings and tailings deposits in the vicinity of the Project site.
A detailed closure cost estimate has not yet been developed but an indicative amount of US$15 million has been budgeted.
| 20.6 | Recommendations |
The environmental assessment process for the Project is not yet complete, and therefore specific recommendations will arise as a result of future baseline studies, impact assessment, and the public consultation process, in addition to any terms and conditions outlined by the regulatory authorities.
| Blue Moon Mine | 145 | March 2025 |
| |
Blue Moon Metals Inc. |
Recommendations considered important for ongoing development of the Project include the following:
| 1. | Update all baseline studies and undertake additional surveys and testwork to ensure comprehensive understanding of environmental and social conditions. Particular attention should be paid to geochemical properties, seasonal differences in water bodies and biodiversity (migratory birds and mammals), potential nesting sites for birds of prey, and socio-economic conditions. |
| 2. | Demarcate any known cultural heritage sites and design infrastructure and access routes to avoid them. |
| 3. | Communicate with regulatory authorities and other relevant stakeholders to better determine the presence/absence of threatened/protected species and potential migration routes for mammals and birds. |
| 4. | Consider installing basic monitoring infrastructure, such as a weather station and groundwater monitoring boreholes to support ongoing baseline data collection. |
| 5. | Ensure all stakeholder interactions, including informal meetings, are documented and filed to assist the community relations and communications teams in future should the Project proceed to an operational mine. |
| 6. | Integrate sensitive/protected areas into the GIS used by the exploration team, to minimize the risk for damage, for example cultural heritage sites and known wildlife habitats. |
| 7. | Ensure exploration drill holes are properly closed up, to minimize land disturbance and avoid future problems with water connectivity. Establish a formal procedure for this and ensure the closure of all drill sites is properly documented. |
| 8. | Regularly review the project design, to adapt to emerging environmental and social risks and incorporate the latest available technologies for energy efficiency and environmental protection. |
| Blue Moon Mine | 146 | March 2025 |
| |
Blue Moon Metals Inc. |
21.0 CAPITAL AND OPERATING COSTS
| 21.1 | Capital Costs |
| 21.1.1 | Summary and Basis of Estimate |
The capital expenditure (CAPEX) estimate for this Preliminary Economic Assessment (PEA) has been developed using a combination of budgetary quotes from vendors, historical pricing from comparable projects, and parametric calculations based on similar equipment and infrastructure. Cost elements have been refined and itemized to enhance confidence in the estimate. However, the overall accuracy remains within the expected range for a PEA-level study. The approach ensures a robust and well-supported cost estimate while maintaining alignment with the early-stage nature of the assessment.
Conservatively, an exchange rate of CAD 1.35/US$ has been applied where required for conversion of cost inputs whereas, at the effective date of this report, the spot rate was approximately CAD 1.45/US$.
Table 21.1 summarises the initial, sustaining and total LOM capital costs for the Project.
Table 21.1
LOM Capital Cost Estimate
| Area | Initial (US$ M) | Sustaining (US$ M) | LOM Total (US$ M) | |||||||||
| Mining | 18.4 | 10.0 | 28.4 | |||||||||
| Processing | 55.0 | 42.8 | 97.7 | |||||||||
| Infrastructure | 26.7 | 11.7 | 38.4 | |||||||||
| Sub-Total Direct Costs | 100.1 | 64.5 | 164.5 | |||||||||
| Indirect | 15.9 | 0.0 | 15.9 | |||||||||
| Contingency | 28.5 | 0.0 | 28.5 | |||||||||
| Total Capital Costs | 144.5 | 64.5 | 209.0 | |||||||||
| 21.1.2 | Mining Capital |
Initial mining capital expenditure is comprised of pre-production development costs of US$18.4 million.
The PEA assumes that all mining development and production operations are carried out by a contractor that will provide all the mobile equipment necessary to meet the mine plan. Accordingly, no mobile mining equipment fleet purchases are included in the capital estimate and, instead, an amount has been added to the mining operating costs per tonne of mill-feed production to account for the cost of ownership of that fleet, based on the leasing costs of equipment worth US$14.1 million.
Furthermore, for the purposes of this PEA, almost US$30 million of capital expenditure in respect of static mining equipment and infrastructure, mine portal, initial decline ramp development and mineral exploration (core drilling and assaying) are treated as a sunk cost, given Blue Moon’s expectation that its proposed exploration program would be completed before a project construction decision is taken.
Table 21.2 presents a breakdown of the presumed exploration/study costs, initial and sustaining mining capital costs for the Project, excluding contingency.
| Blue Moon Mine | 147 | March 2025 |
| |
Blue Moon Metals Inc. |
Table 21.2
LOM Capital Cost Estimate- Mining
| Area | Study Capital (US$ M) | Initial (US$ M) | Sustaining (US$ M) | LOM Total (US$ M) | ||||||||||||
| Capitalized Pre-Production Opex | 13.9 | 18.4 | - | 18.4 | ||||||||||||
| Exploration Drilling, Engineering, etc. | 8.0 | - | - | - | ||||||||||||
| Ventilation Equipment & Infrastructure | 3.6 | - | 3.4 | 3.4 | ||||||||||||
| U/G Static Equipment & Infrastructure | 2.1 | - | 6.6 | 6.6 | ||||||||||||
| Mine Portal Establishment | 2.1 | - | - | - | ||||||||||||
| Total Mining Capital | 29.6 | 18.4 | 10.0 | 28.4 | ||||||||||||
| 21.1.3 | Processing Capital |
Table 21.3 summarises the initial, sustaining and LOM total processing capital costs for the Project, excluding contingency.
Table 21.3
LOM Capital Cost Estimate - Processing
| Area | Initial (US$ M) | Sustaining (US$ M) | LOM Total (US$ M) | |||||||||
| Crushing/Milling/Flotation | 2.995 | - | - | |||||||||
| Ore Bin | 0.347 | - | - | |||||||||
| Grinding | 0.501 | - | - | |||||||||
| Cu Flotation | 11.065 | - | - | |||||||||
| Zn Flotation | 4.704 | - | - | |||||||||
| Tailings | 3.884 | - | - | |||||||||
| Plant Services | 0.159 | - | - | |||||||||
| Reagents | 0.321 | - | - | |||||||||
| Processing Plant | 10.823 | - | - | |||||||||
| Processing Plant Buildings | 4.311 | - | - | |||||||||
| Sub-Total Direct Costs - Plant | 39.109 | 17.208 | 56.317 | |||||||||
| Paste Mixing Plant | 0.483 | - | - | |||||||||
| Paste Pumping | 6.750 | - | - | |||||||||
| Paste Piping, etc. | 1.642 | - | - | |||||||||
| Sub-Total Direct Costs - Paste | 8.875 | 3.905 | 12.780 | |||||||||
| Tailings Disposal | 6.988 | 21.662 | 28.649 | |||||||||
| Total Processing Capital | 54.972 | 42.775 | 97.747 | |||||||||
Approximately half of the sustaining capital in the process area is for two phases of expansion at the tailings storage facility which is planned to be carried out in Year 3 and Year 7. The remainder of the process sustaining capital is a provision for routine equipment rebuilds and replacements over the LOM period.
| 21.1.4 | Infrastructural Capital |
Table 21.4 summarises the initial, sustaining and LOM total infrastructural capital costs for the Project, excluding contingency.
| Blue Moon Mine | 148 | March 2025 |
| |
Blue Moon Metals Inc. |
Table 21.4
LOM Capital Cost Estimate – Infrastructure
| Area | Initial (US$ M) | Sustaining (US$ M) | LOM Total (US$ M) | |||||||||
| Site Preparation | 3.175 | - | - | |||||||||
| Workshop | 2.788 | - | - | |||||||||
| Site Buildings | 1.866 | - | - | |||||||||
| Surface Water Management | 0.392 | - | - | |||||||||
| Equipment | 0.613 | - | - | |||||||||
| Sub-Total On-Site infrastructure | 8.835 | 3.887 | 12.723 | |||||||||
| Electrical Supply | 0.833 | - | - | |||||||||
| Access Road Upgrade | 1.029 | - | - | |||||||||
| Sub-Total Off-Site Infrastructure | 1.862 | 0.820 | 2.682 | |||||||||
| Fire Protection | 0.245 | - | - | |||||||||
| Water Supply | 1.506 | - | - | |||||||||
| Electrical Distribution | 12.922 | - | - | |||||||||
| Communications | 0.719 | - | - | |||||||||
| Fuel Storage | 0.459 | - | - | |||||||||
| Solid Waste Disposal | 0.148 | - | - | |||||||||
| Sub-Total Common Services | 15.998 | 7.039 | 23.038 | |||||||||
| Total Infrastructure Capital | 26.696 | 11.746 | 38.442 | |||||||||
| 21.1.5 | Indirect Capital and Contingency |
Table 21.5 summarises the LOM total indirect capital costs for the Project, as well as the individual contingency provisions which in total equate to 27.1% of the overall base estimate. Contingency on individual line items ranges from 20% to 35%, appropriate to the degree of scope definition.
Table 21.5
LOM Capital Cost Estimate – Indirect Costs
| Area | Initial (US$ M) | Sustaining (US$ M) | LOM Total (US$ M) | |||||||||
| Pre-Production Operations Labour | 1.579 | - | - | |||||||||
| Vendor Commissioning | 0.369 | - | - | |||||||||
| Mobilization/Demobilization | 0.543 | - | - | |||||||||
| Site Running Costs | 0.407 | - | - | |||||||||
| Sub-Total Pre-Production Costs | 2.900 | - | 2.900 | |||||||||
| Process Plant First Fills | 0.115 | - | - | |||||||||
| Spares and Consumables Stock | 0.919 | - | - | |||||||||
| Sustaining Capital/Spares | 2.100 | - | - | |||||||||
| Sub-Total Spares and First Fills | 3.134 | - | 3.134 | |||||||||
| EPCM | 7.672 | - | 7.672 | |||||||||
| Owner’s Costs | 2.189 | - | 2.189 | |||||||||
| Indirect Capital excl. Contingency | 15.895 | - | 15.895 | |||||||||
| Contingency | 28.528 | - | 28.528 | |||||||||
| Grand Total Indirect plus Contingency | 44.423 | - | 44.423 | |||||||||
| Blue Moon Mine | 149 | March 2025 |
| |
Blue Moon Metals Inc. |
| 21.1.6 | Closure, Rehabilitation and Salvage |
Blue Moon intends to provide a corporate bond against future closure costs. A provision of US$15.0 million has been made in Year 12 of the Project cash flow to account for the expected cash costs incurred on closure of the mine. This provision is net of the amount that may be realised upon disposal of plant and equipment following mine closure.
| 21.2 | Operating Costs |
Table 21.6 provides a summary of the estimated life-of-mine (LOM) PEA operating costs.
Table
21.6
LOM
Operating Cost Estimate
| Area | LOM
Average (US$/t) | LOM
Cost (US$’000) | ||||||
| Mining | 75.02 | 503,709 | ||||||
| Processing | 36.11 | 242,453 | ||||||
| E/S and G&A | 5.10 | 34,239 | ||||||
| Total Direct Costs | 116.24 | 780,401 | ||||||
| Selling Costs | 22.30 | 149,740 | ||||||
| Royalties | 0.35 | 2,350 | ||||||
| Total Operating Costs | 138.89 | 931,991 | ||||||
Over the LOM, mining accounts for 65% of the estimated direct on-site cash costs, while processing costs altogether account for a further 31% of costs, the balance (4%) are environmental, social, general and administrative costs.
The operating costs have been estimated from first principals and in each area of the operating cost estimate, labour costs are based on the proposed headcount, estimated salary and burden for each position.
| 21.2.1 | Mining Operating Costs |
Table 21.7 shows a breakdown of the estimated mine operating costs, based on contractor mining budgetary rates and the QP’s estimate of in-house technical support, management and supervisory labour costs. Pre-production development costs are all capitalized, and all on-going development during the LOM period are assumed to be expensed.
| Blue Moon Mine | 150 | March 2025 |
| |
Blue Moon Metals Inc. |
Table
21.7
Summary of Estimated Mine Operating Costs
| Description | LOM
Cost (US$’000) | LOM
Average (US$/T) | ||||||
| Mining Operating Costs - ROM | 365,039 | 54.37 | ||||||
| Mining Development Costs -Ramp | 71,028 | 10.58 | ||||||
| Mining Development Costs -Lateral (W) | 80,199 | 11.95 | ||||||
| Mining Development Costs -Raises | 6,937 | 1.03 | ||||||
| Mining – Operations Support Services | 6,131 | 0.91 | ||||||
| Mining – Technical Support Services | 4,088 | 0.61 | ||||||
| Mining - Mgmt. Supervision | 2,555 | 0.38 | ||||||
| Less Capitalized Pre-Production | (32,267 | ) | (4.81 | ) | ||||
| Total Mine Operating Costs | 503,709 | 75.02 | ||||||
| 21.2.2 | Processing Operating Costs |
A summary of the LOM estimated process operating costs is presented in Table 21.8.
Table
21.8
Summary
of Estimated Process Operating Costs
| Description | Number of Employees | LOM Cost (US$’000) | LOM Average (US$/T) | |||||||||
| Process Management and Admin Labour | 2 | 3,539 | 0.53 | |||||||||
| Plant Operations Labour | 35 | 29,961 | 4.46 | |||||||||
| Plant Maintenance Labour | 11 | 10,336 | 1.54 | |||||||||
| Chemical Laboratory Labour | 7 | 8,785 | 1.31 | |||||||||
| Operating Supplies | - | 62,625 | 9.33 | |||||||||
| Surface Tailings Management | - | 4,565 | 0.68 | |||||||||
| Maintenance Supplies | - | 23,884 | 3.56 | |||||||||
| Electrical Power | - | 57,375 | 8.55 | |||||||||
| Backfill Plant | 6 | 41,384 | 6.16 | |||||||||
| Total Processing Operating Costs | 61 | 242,453 | 36.11 | |||||||||
The process operating costs have been estimated from first principles with costs sub-divided into the following areas:
| • | Labour: |
| ○ | Plant operations. |
| ○ | Plant maintenance. |
| ○ | Chemical laboratory. |
| • | Operating supplies: |
| ○ | Wear parts. |
| ○ | Reagents. |
| Blue Moon Mine | 151 | March 2025 |
| |
Blue Moon Metals Inc. |
| ○ | Laboratory supplies. |
| ○ | Fuel. |
| • | Surface tailings management |
| • | Electrical power |
| • | Maintenance supplies |
| • | Backfill plant: |
| ○ | Labour |
| ○ | Operating supplies |
| ○ | Electrical power |
| ○ | Maintenance supplies |
A breakdown of the average process unit operating costs is illustrated in Figure 21.1. The highest cost area is consumables with flotation reagents the major contributor.
Figure 21.1
Breakdown of Average LOM Process Operating Costs
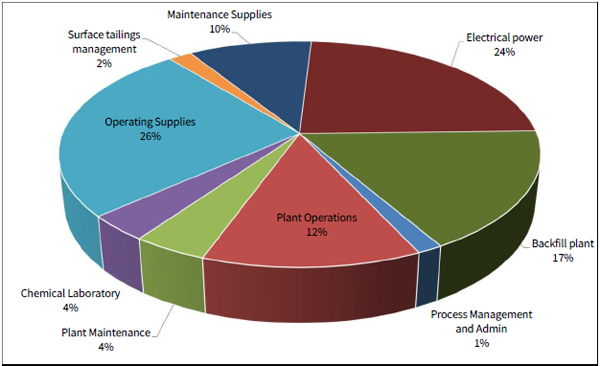
| 21.2.2.1 | Labour |
The total concentrator labour complement has been estimated at 55 personnel comprising two management/administrative employees, 35 process plant operators, 11 plant maintenance personnel and seven laboratory workers. The manpower includes tailings haul truck drivers but excludes backfill personnel who are accounted for in the backfill plant category.
Total estimated annual cost for processing labour is US$4.8 million or US$6.71/T processed
| Blue Moon Mine | 152 | March 2025 |
|
Blue Moon Metals Inc. |
| 21.2.2.2 | Operating Supplies |
The estimated consumption wear parts include crusher and mill liners, and grinding media for the mills (SAG, primary ball and concentrate regrind). The usage rates are based on typical industry factors applied to the estimated abrasion index and standard unit operation work indices. The unit costs for wear parts were estimated from similar recent projects.
Flotation reagent and their consumptions were based on metallurgical testwork and unit supply costs from Micon’s in-house project data base. The consumption rates were discounted by 25% as the flowsheet and conditions used for the laboratory bench scale testwork were not optimized. The operating supplies also includes an allowance for concentrate and tailings dewatering chemicals.
An allowance for fuel to drive plant vehicles and standby generators has been included.
| 21.2.2.3 | Electrical Power |
The cost of electrical power is based on a very high-level estimate of installed power per operating area, operating and power efficiency factors for each area, and a unit power cost of US$0.175/kWh. The total installed power for the processing facilities is estimated at approximately 5 MW, average operating power of 4 MW and an average annual power consumption of 48 kWh/t processed.
| 21.2.2.4 | Maintenance Supplies |
The estimate annual costs for maintenance supplies were factored based on the total installed costs for mechanical equipment and piping, buildings, electrical and instrumentation equipment, and mobile equipment.
| 21.2.2.5 | Surface Tailings Management |
The estimate costs for surface tailings management are based the cost of loading and hauling tailings filter cake to the tailings management facility and an allowance for TMF management which includes sampling and monitoring, dozer usage etc.
| 21.2.2.6 | Backfill Plant |
The estimated backfill plant operating costs includes labour (6 operators), operating supplies (cement), electrical power and maintenance supplies.
| 21.2.3 | Environmental and Social, and General and Administration Operating Costs |
The estimated annual costs for environmental/social management and general and administration are summarized in Table 21.9.
| Blue Moon Mine | 153 | March 2025 |
|
Blue Moon Metals Inc. |
Table 21.9
Estimated Annual E&S and G&A Operating Costs
| Annual Cost | ||||
| Area | (US$’000) | |||
| Environmental and Social | 360 | |||
| G&A Labour | 1,391 | |||
| G&A Expenses | 1,600 | |||
| Total | 3,351 | |||
The G&A labour comprises 12 site personnel that covers management, administration, HR, safety and warehouse. G&A expenses cover office supplies, safety/first aid supplies, insurance, IT, licenses and permits, office utilities, waste management and security.
| 21.2.4 | Indirect Off-Site Costs |
The estimated indirect costs include concentrate marketing and selling costs and royalties.
| 21.2.4.1 | Concentrate Sales Costs |
The total estimated cost for product sales equates to US$22.30/ t processed over the life of the Project and includes the following items for both the copper and zinc flotation concentrates:
| • | Concentrate transportation. |
| • | Treatment charge. |
| • | Refining charges. |
| 21.2.4.2 | Royalties |
Royalties are discussed in detail elsewhere in this report. The total estimated royalties paid over the life of mine amounts to about US$2.35 million.
| Blue Moon Mine | 154 | March 2025 |
|
Blue Moon Metals Inc. |
22.0 ECONOMIC ANALYSIS
| 22.1 | Cautionary Statement |
This Section presents the results of a preliminary economic assessment (PEA) of the Blue Moon Mine based on the mineral resource estimate and the annual forecasts of production, operating cost and capital expenditures presented in this Technical Report, in order to establish the economic potential of the Property.
This PEA is preliminary in nature. It includes Inferred Mineral Resources that are considered too speculative geologically to have the economic considerations applied to them that would enable them to be categorized as mineral reserves, and there is no certainty that the PEA will be realized. Mineral Resources that are not Mineral Reserves do not have demonstrated economic viability.
Information that is forward-looking includes:
| • | Mineral Resource and Mineral Reserve estimates. |
| • | Forecast commodity prices and exchange rates. |
| • | The proposed mine production plan. |
| • | Projected mining losses, dilution and process recovery rates. |
| • | Capital and operating cost estimates and working capital requirements; |
| • | Assumptions as to closure costs and closure requirements. |
| • | Assumptions as to environmental, permitting and social considerations and risks. |
Additional risks to the forward-looking information include:
| • | Changes to costs of production from what is assumed. |
| • | Unrecognized environmental risks. |
| • | Unanticipated reclamation expenses; |
| • | Unexpected variations in quantity of mineralized material, grade or recovery rates. |
| • | Geotechnical or hydrogeological considerations differing from those that have been assumed. |
| • | Failure of mining methods or equipment to operate as anticipated. |
| • | Failure of plant, equipment or processes to operate as anticipated. |
| • | Changes to assumptions as to the availability and cost of electrical power and process reagents. |
| • | Ability to maintain the social licence to operate. |
| • | Accidents, labour disputes and other risks of the mining industry. |
| • | Changes to interest rates. |
| • | Changes to tax rates and availability of allowances for depreciation and amortization. |
| Blue Moon Mine | 155 | March 2025 |
|
Blue Moon Metals Inc. |
| 22.2 | Basis of Evaluation |
Micon’s QP has prepared the following PEA of the Project on the basis of a discounted cash flow model, from which Net Present Value (NPV), Internal Rate of Return (IRR) and payback period can be determined. Assessments of NPV are generally accepted within the mining industry as representing the economic value of a project after allowing for the cost of capital invested.
The objective of the study was to determine a potential economic value of the Project. In order to do this, the cash flow arising from the base case has been forecast using constant US dollars. The sensitivity of NPV to changes in the base case assumptions for price, operating costs and capital expenditure was then examined.
| 22.3 | Macro-Economic Assumptions |
| 22.3.1 | Exchange Rate and Inflation |
All results are expressed in United States dollars ($ or US$) except where stated otherwise. Conservatively, an exchange rate of CAD 1.35/US$ has been applied where required for conversion of cost inputs whereas, at the effective date of this report, the spot rate was approximately CAD 1.45/US$.
Cost estimates and other inputs to the cash flow model for the Project have been prepared using constant, first quarter 2025 money terms, i.e., without provision for escalation or inflation.
| 22.3.2 | Weighted Average Cost of Capital |
In order to find the NPV of the cash flows forecast for the Project, an appropriate discount factor must be applied which represents the weighted average cost of capital (WACC) imposed on the Project by the capital markets. The cash flow projections used for the evaluation have been prepared on an all-equity basis. This being the case, WACC is equal to the market cost of equity.
In this case, Micon has selected an annual discount rate of 8% in real terms for its base case and has tested the sensitivity of the Project to changes in this rate.
| 22.3.3 | Royalty and Taxation Regime |
California’s royalty on sales of gold (US$5.00/oz) and silver (US$0.50/oz) and State income tax of 8.84% are taken into account. US federal income tax is also then provided for at the rate of 21%, after depreciation of capital expenditures on a straight-line basis over seven years. A third-party royalty, capped at US$500,000, is also provided for.
| 22.3.4 | Expected Metal Prices |
Project revenues will be generated from the sale of zinc and copper concentrates, with credits for gold and silver content. The Project has been evaluated using constant metal prices of US$4.20/lb copper, US$1.25/lb zinc, US$2,200/oz Au and US$27/oz Ag. No credit or penalty has been applied for lead or any other by-product content in concentrates.
Section 19.0 of this report provides a rationale for the use of these values.
| Blue Moon Mine | 156 | March 2025 |
|
Blue Moon Metals Inc. |
| 22.4 | Technical Assumptions |
The technical parameters, production forecasts and estimates described elsewhere in this report are reflected in the base case cash flow model. These inputs to the model are summarised below.
| 22.4.1 | Mine Construction and Development |
The PEA considers a 15-month construction period for the Blue Moon process plant and surface and underground infrastructure. Prior to this construction period, it is assumed that an exploration decline will have been developed to permit the drilling from underground of additional boreholes to improve confidence in the resource estimate and provide material for further metallurgical testwork. Therefore, for the purposes of this PEA, the cost of that development as well as the drilling, analytical and metallurgical testwork costs amounting to approximately US$30 million in total, are considered as a sunk cost.
| 22.4.2 | Production and Sales |
The Blue Moon Mine is expected to achieve its designed process throughput rate of 1,800 tonnes/day within the first year of operation and maintain that steady state in Years 2-10 before ramping down ahead of mine closure in Year 11. Figure 22.1 shows the annual tonnages and mill-feed grades.
Figure 22.1
LOM Mill Feed Production Schedule
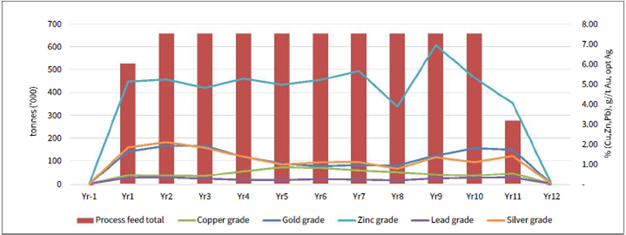
The Blue Moon Mine will produce a zinc concentrate and a copper concentrate. The Micon QP has used in-house data and experience to forecast typical treatment and refining charges (TC/RC) for each concentrate.
The assumed TC/RC terms for the copper concentrate are given in Table 22.1 and for the zinc concentrate in Table 22.2.
| Blue Moon Mine | 157 | March 2025 |
|
Blue Moon Metals Inc. |
Table 22.1
Assumed TC/RC terms-Copper Concentrate
| Description | Units | Value | ||||
| Copper Content of Concentrate Shipped | % | 26.50 | ||||
| Moisture Content of Concentrate Shipped | % | 8.00 | ||||
| Treatment Charge | US$/dmt conc. | 30.00 | ||||
| Transport Charge | US$/wmt conc. | 72.00 | ||||
| Payability - Copper | % | 96.50 | ||||
| Payability - Gold | % | 96.00 | ||||
| Payability - Silver | % | 90.00 | ||||
| Minimum Deduction - Copper | % | 1.00 | ||||
| Minimum Deduction - Gold | g/t | - | ||||
| Minimum Deduction - Silver | g/t | - | ||||
| Refining Charge - Copper | US$/lb | 0.03 | ||||
| Refining Charge - Gold | US$/oz | 5.00 | ||||
| Refining Charge - Silver | US$/oz | 0.50 |
Table 22.2
Assumed TC/RC terms-Zinc Concentrate
| Description | Units | Value | ||||
| Zinc Content of Concentrate Shipped | % | 62.30 | ||||
| Moisture Content of Concentrate Shipped | % | 8.00 | ||||
| Treatment Charge | US$/dmt conc. | 165.00 | ||||
| Transport Charge | US$/wmt conc. | 72.00 | ||||
| Payability – Zinc (at 62.3% Zn in conc.) | % | 87.16 | ||||
| Payability - Gold | % | 96.00 | ||||
| Payability - Silver | % | 90.00 | ||||
| Deduction - Zinc | % | 8.00 | ||||
| Minimum Deduction - Gold | g/t | 1.00 | ||||
| Minimum Deduction - Silver | g/t | 93.30 | ||||
| Refining Charge - Zinc | US$/lb | - | ||||
| Refining Charge - Gold | US$/oz | - | ||||
| Refining Charge - Silver | US$/oz | - |
Gross sales revenue is equivalent to US$268.30/tonne treated. Selling costs (for concentrate transport, treatment and refining) amount to US$22.30/tonne, yielding an average net smelter return (NSR) value of mill-feed of US$246.00/tonne over the LOM period. The annual contribution to net revenue of each metal is shown in Figure 22.2. No credit or penalty was assumed for lead or any other potential by-products or deleterious elements.
| Blue Moon Mine | 158 | March 2025 |
|
Blue Moon Metals Inc. |
Figure 22.2
Annual NSR Contribution by Metal
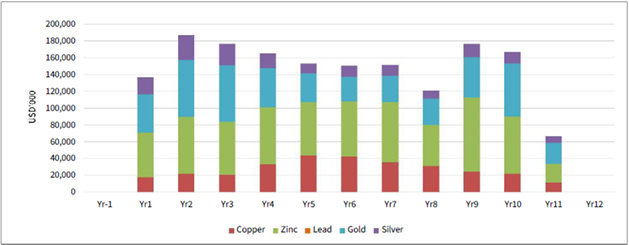
A high proportion of the credits for gold and silver are attributed to the copper concentrate, resulting in its value exceeding that of the zinc concentrate despite the zinc metal itself having more than twice the value of payable copper. Figure 22.3 compares the value of each concentrate, while Figure 22.4 shows the contribution of each metal to total revenue.
Figure 22.3
NSR value by Concentrate Type
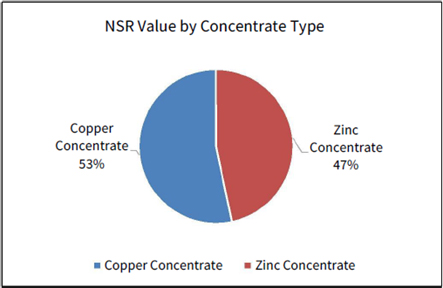
| Blue Moon Mine | 159 | March 2025 |
|
Blue Moon Metals Inc. |
Figure 22.4
NSR value by Metal
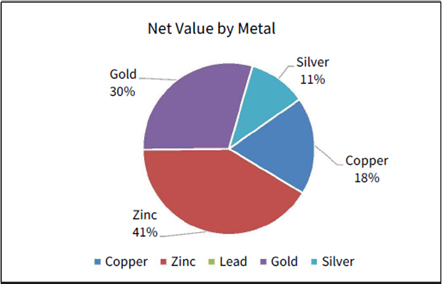
| 22.4.3 | Cash Operating Costs |
Direct cash operating costs for the Blue Moon Mine are estimated at an average of US$116.24/t over the LOM period. Selling costs (i.e., TC/RC and concentrate transport) add a further US$22.58/t for a total of US$138.89/t. A summary of these costs is given in Table 22.3. A more detailed breakdown is provided in Section 21.2 of this report.
Table
22.3
LOM
Average Operating Costs
| Unit Cost | LOM Total | |||||||
| Description | (US$/tonne Milled) | (US$’000) | ||||||
| Mining | 75.02 | 503,709 | ||||||
| Processing | 36.11 | 242,453 | ||||||
| General & Administrative | 5.10 | 34,239 | ||||||
| Sub-Total Direct Costs | 116.24 | 780,401 | ||||||
| Selling Costs | 22.30 | 149,740 | ||||||
| Royalties | 0.35 | 2,350 | ||||||
| Total Operating Costs | 138.89 | 932,491 | ||||||
Figure 22.5 shows the annual cash operating costs of the Blue Moon Mine compared to the net smelter returns on concentrate sales, demonstrating the positive operating margin achieved in each year of the Project, averaging 53% over the LOM period.
| Blue Moon Mine | 160 | March 2025 |
|
Blue Moon Metals Inc. |
Figure 22.5
Annual Operating Costs
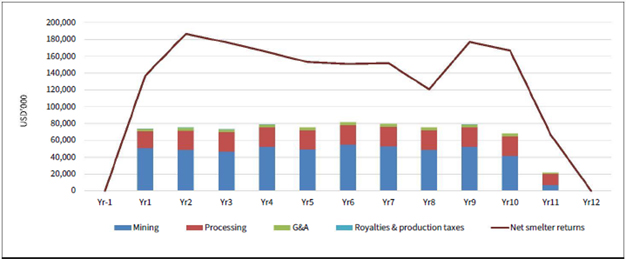
| 22.4.4 | Capital Expenditure |
The Blue Moon Mine is expected to require an initial investment of US$144.5 million, with a further US$64.5 million in sustaining capital over the LOM period. In addition, upon closure, approximately US$15.0 million in demolition and rehabilitation costs is expected to be incurred, net of any realizable salvage or scrap value of equipment. A breakdown of these amounts is given in Table 22.4.
Table
22.4
LOM
Capital Costs
| Initial Capital | Sustaining Capital | LOM Total Capital | ||||||||||
| Description | (US$ M) | (US$ M) | (US$ M) | |||||||||
| Capitalized Pre-Production Opex, etc. | 18.4 | 10.0 | 28.4 | |||||||||
| Process Plant | 39.1 | 17.2 | 56.3 | |||||||||
| Backfill Plant | 8.9 | 3.9 | 12.8 | |||||||||
| Tailings Disposal | 7.0 | 21.7 | 28.6 | |||||||||
| On-Site Infrastructure | 8.8 | 3.9 | 12.7 | |||||||||
| Off-Site Infrastructure | 1.9 | 0.8 | 2.7 | |||||||||
| Common Services | 16.0 | 7.0 | 23.0 | |||||||||
| Indirect - Site Costs | 2.9 | - | 2.9 | |||||||||
| Indirect - Spares & First Fills | 3.1 | - | 3.1 | |||||||||
| EPCM | 7.7 | - | 7.7 | |||||||||
| Owners Cost | 2.2 | - | 2.2 | |||||||||
| Contingency | 28.5 | - | 28.5 | |||||||||
| Total Capital Expenditure excl. Closure | 144.5 | 64.5 | 209.0 | |||||||||
| Closure & Reclamation provision | - | 15.0 | 15.0 | |||||||||
| Grand Total Capital Expenditure | 144.5 | 79.5 | 224.0 | |||||||||
| Blue Moon Mine | 161 | March 2025 |
|
Blue Moon Metals Inc. |
| 22.4.5 | Working Capital |
Estimated working capital requirements assume 25 days each for accounts receivable, payables and stores. Net working capital averages US$11.0 million over the LOM period, with a maximum requirement of US$13.6 million in Year 2.
| 22.5 | Base Case Economics |
| 22.5.1 | Key Statistics |
Table 22.5 presents some key statistics for the Blue Moon Mine base case economic assessment.
Table
22.5
Base
Case: Key Statistics
| Item | Units | Value | ||||
| Nominal Processing Capacity | tonnes per day | 1,800 | ||||
| LOM Total Processed | ‘000 tonnes | 6,714 | ||||
| Zinc Equivalent Grade Processed | % ZnEq | 12.55 | ||||
| Net Smelter Return | US$/tonne treated | 246.00 | ||||
| Copper | 000’lbs | 7,237 | ||||
| Zinc | 000’lbs | 62,260 | ||||
| Average Annual Payable | Gold | oz | 22,566 | |||
| Production (LOM) | Silver | oz | 681,784 | |||
| ZnEq | 000’lbs | 151,046 | ||||
The average C1 cash cost over the LOM is estimated at US$0.60/lb zinc equivalent. Including sustaining and mine closure expenses, the average All-in Sustaining Cost (AISC) over the LOM is estimated at US$0.66/lb zinc equivalent and, including initial capital, the average All-in Cost (AIC) over the LOM is estimated at US$0.77/lb zinc equivalent.
| 22.5.2 | Base Case Cash Flow |
A summary of the LOM cash flow projection is given in Table 22.6 and Figure 22.6. Details of the annual cash flow projection are given in Table 22.7.
The base case cash flow equates to a pre-tax IRR of 48% and a net present value at an 8% annual discount rate (NPV8) of US$354 million before tax. After-tax base-case cash flows provide an IRR of 38% and evaluate to NPV8 of US$244 million. After-tax undiscounted payback is achieved in approximately 2.8 years.
| Blue Moon Mine | 162 | March 2025 |
|
Blue Moon Metals Inc. |
Table
22.6
LOM
Cash Flow Summary
| LOM | ||||||||||||
| Parameter | (US$ M) | US$/t Treated | US$/lb ZnEq | |||||||||
| Gross Sales Revenue | 1,801.3 | 268.30 | 1.17 | |||||||||
| Mining | 503.7 | 75.02 | 0.33 | |||||||||
| Processing | 242.5 | 36.11 | 0.16 | |||||||||
| G&A | 34.2 | 5.10 | 0.02 | |||||||||
| Selling Costs | 149.7 | 22.30 | 0.10 | |||||||||
| Royalties & Production Taxes | 2.3 | 0.35 | 0.00 | |||||||||
| C1 Cash Operating Costs | 932.5 | 138.89 | 0.60 | |||||||||
| Sustaining Capital Expenditure | 64.5 | 9.60 | 0.04 | |||||||||
| Reclamation & Closure | 15.0 | 2.23 | 0.01 | |||||||||
| All-in Sustaining Cost | 1,012.0 | 150.73 | 0.66 | |||||||||
| Initial Capital | 144.5 | 21.52 | 0.09 | |||||||||
| All-in-Cost | 1,156.4 | 172.24 | 0.75 | |||||||||
| Income Taxes | 181.0 | 26.96 | 0.12 | |||||||||
| Net Cashflow | 463.9 | 69.10 | 0.30 | |||||||||
Figure 22.6
Annual Cash Flow Projection
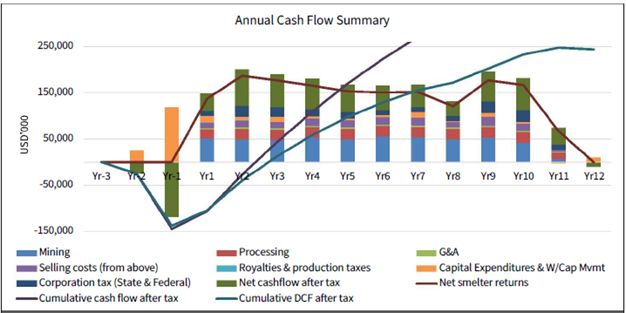
| Blue Moon Mine | 163 | March 2025 |
|
Blue Moon Metals Inc. |
Table
22.7
LOM Annual Cash Flow
| Project Years | LOM Total | Yr-2 | Yr-1 | Yr1 | Yr2 | Yr3 | Yr4 | Yr5 | Yr6 | Yr7 | Yr8 | Yr9 | Yr10 | Yr11 | Yr12 | |||||||||||||||||||||||||||||||
| Tonnes mill-feed | tonnes | 6,714 | 0 | 0 | 526 | 657 | 657 | 657 | 657 | 657 | 657 | 657 | 657 | 657 | 275 | 0 | ||||||||||||||||||||||||||||||
| Copper grade in mill-feed | % | 0.56 | 0.00 | 0.00 | 0.42 | 0.40 | 0.39 | 0.62 | 0.83 | 0.80 | 0.67 | 0.58 | 0.45 | 0.40 | 0.51 | 0.00 | ||||||||||||||||||||||||||||||
| Zinc grade in mill-feed | % | 5.17 | 0.00 | 0.00 | 5.10 | 5.21 | 4.79 | 5.25 | 4.95 | 5.19 | 5.64 | 3.86 | 6.93 | 5.31 | 4.02 | 0.00 | ||||||||||||||||||||||||||||||
| Lead grade in mill-feed | % | 0.24 | 0.00 | 0.00 | 0.31 | 0.32 | 0.25 | 0.19 | 0.18 | 0.22 | 0.21 | 0.16 | 0.27 | 0.30 | 0.32 | 0.00 | ||||||||||||||||||||||||||||||
| Gold grade in mill-feed | % | 1.38 | 0.00 | 0.00 | 1.61 | 1.90 | 1.90 | 1.34 | 1.01 | 0.88 | 0.94 | 0.91 | 1.41 | 1.78 | 1.70 | 0.00 | ||||||||||||||||||||||||||||||
| Silver grade in mill-feed | g/t | 45.36 | 0.00 | 0.00 | 62.42 | 71.10 | 61.88 | 46.37 | 32.94 | 36.65 | 36.96 | 25.96 | 45.05 | 36.77 | 47.54 | 0.00 | ||||||||||||||||||||||||||||||
| Products shipped | ||||||||||||||||||||||||||||||||||||||||||||||
| Copper Concentrate (26.5% Cu) | t | 131.5 | 0.0 | 0.0 | 7.7 | 9.3 | 8.9 | 14.4 | 19.1 | 18.4 | 15.5 | 13.5 | 10.4 | 9.3 | 5.0 | 0.0 | ||||||||||||||||||||||||||||||
| Zinc Concentrate (62.3% Zn) | t | 531.5 | 0.0 | 0.0 | 41.0 | 52.4 | 48.1 | 52.8 | 49.7 | 52.2 | 56.7 | 38.8 | 69.6 | 53.3 | 16.9 | 0.0 | ||||||||||||||||||||||||||||||
| Copper concentrate | 900,324 | 0 | 0 | 74,901 | 104,493 | 100,527 | 91,061 | 87,433 | 82,936 | 78,006 | 68,388 | 83,208 | 89,019 | 40,353 | 0 | |||||||||||||||||||||||||||||||
| Zinc Concentrate | 901,024 | 0 | 0 | 73,422 | 96,644 | 89,302 | 89,202 | 80,321 | 82,952 | 89,675 | 63,627 | 112,188 | 92,254 | 31,438 | 0 | |||||||||||||||||||||||||||||||
| Gross Sales Revenue | US$’000 | 1,801,348 | 0 | 0 | 148,323 | 201,136 | 189,829 | 180,263 | 167,754 | 165,888 | 167,681 | 132,015 | 195,396 | 181,273 | 71,791 | 0 | ||||||||||||||||||||||||||||||
| Copper concentrate | 20,452 | 0 | 0 | 1,381 | 1,757 | 1,654 | 2,200 | 2,676 | 2,604 | 2,240 | 1,915 | 1,695 | 1,531 | 799 | 0 | |||||||||||||||||||||||||||||||
| Zinc Concentrate | 129,289 | 0 | 0 | 9,974 | 12,737 | 11,705 | 12,842 | 12,098 | 12,687 | 13,796 | 9,426 | 16,930 | 12,974 | 4,118 | 0 | |||||||||||||||||||||||||||||||
| Selling Costs | US$’000 | 149,740 | 0 | 0 | 11,355 | 14,494 | 13,359 | 15,042 | 14,774 | 15,292 | 16,036 | 11,341 | 18,625 | 14,506 | 4,917 | 0 | ||||||||||||||||||||||||||||||
| Net smelter returns | ||||||||||||||||||||||||||||||||||||||||||||||
| Copper Concentrate | 879,872 | 0 | 0 | 73,520 | 102,736 | 98,873 | 88,861 | 84,757 | 80,331 | 75,766 | 66,473 | 81,514 | 87,488 | 39,554 | 0 | |||||||||||||||||||||||||||||||
| Zinc Concentrate | 771,736 | 0 | 0 | 63,448 | 83,906 | 77,598 | 76,360 | 68,223 | 70,265 | 75,879 | 54,201 | 95,257 | 79,279 | 27,320 | 0 | |||||||||||||||||||||||||||||||
| Total net smelter returns | US$’000 | 1,651,608 | 0 | 0 | 136,968 | 186,642 | 176,471 | 165,221 | 152,979 | 150,596 | 151,645 | 120,673 | 176,771 | 166,767 | 66,873 | 0 | ||||||||||||||||||||||||||||||
| Operating Expenses | ||||||||||||||||||||||||||||||||||||||||||||||
| Mining | 503,709 | 0 | 0 | 50,723 | 48,451 | 46,577 | 52,038 | 48,942 | 54,910 | 52,862 | 48,812 | 52,029 | 41,587 | 6,778 | 0 | |||||||||||||||||||||||||||||||
| Processing | 242,453 | 0 | 0 | 19,882 | 23,229 | 23,229 | 23,229 | 23,229 | 23,229 | 23,229 | 23,229 | 23,229 | 23,229 | 13,510 | 0 | |||||||||||||||||||||||||||||||
| G&A | 34,239 | 0 | 0 | 2,680 | 3,351 | 3,351 | 3,351 | 3,351 | 3,351 | 3,351 | 3,351 | 3,351 | 3,351 | 1,404 | 0 | |||||||||||||||||||||||||||||||
| S/Total Direct Operating Costs | US$’000 | 780,401 | 0 | 0 | 73,286 | 75,031 | 73,156 | 78,617 | 75,522 | 81,490 | 79,442 | 75,392 | 78,608 | 68,166 | 21,692 | 0 | ||||||||||||||||||||||||||||||
| Selling costs (from above) | 149,740 | 0 | 0 | 11,355 | 14,494 | 13,359 | 15,042 | 14,774 | 15,292 | 16,036 | 11,341 | 18,625 | 14,506 | 4,917 | 0 | |||||||||||||||||||||||||||||||
| Royalties & production taxes | 2,350 | 0 | 0 | 687 | 274 | 258 | 180 | 127 | 121 | 125 | 110 | 176 | 201 | 91 | 0 | |||||||||||||||||||||||||||||||
| Total Operating Costs (C1) | 932,491 | 0 | 0 | 85,328 | 89,799 | 86,773 | 93,839 | 90,423 | 96,902 | 95,603 | 86,843 | 97,409 | 82,872 | 26,700 | 0 | |||||||||||||||||||||||||||||||
| Operating cash flow (EBITDA) | 53% | 868,857 | 0 | 0 | 62,996 | 111,338 | 103,056 | 86,424 | 77,330 | 68,986 | 72,078 | 45,172 | 97,987 | 98,401 | 45,090 | 0 | ||||||||||||||||||||||||||||||
| Capital Expenditures & W/Cap Mvmt | 223,955 | 25,218 | 119,260 | 14,575 | 7,911 | 11,213 | 4,427 | 3,471 | 4,839 | 12,179 | 2,028 | 8,166 | 3,399 | (2,929 | ) | 10,197 | ||||||||||||||||||||||||||||||
| Net cashflow before tax | US$’000 | 644,902 | (25,218 | ) | (119,260 | ) | 48,420 | 103,426 | 91,843 | 81,997 | 73,860 | 64,147 | 59,899 | 43,144 | 89,821 | 95,002 | 48,019 | (10,197 | ) | |||||||||||||||||||||||||||
| Corporation tax (State & Federal) | 180,999 | 0 | 0 | 10,540 | 23,871 | 21,229 | 16,250 | 13,526 | 11,007 | 11,530 | 10,727 | 25,502 | 25,771 | 11,046 | 0 | |||||||||||||||||||||||||||||||
| Net cashflow after tax | US$’000 | 463,903 | (25,218 | ) | (119,260 | ) | 37,880 | 79,555 | 70,615 | 65,748 | 60,333 | 53,139 | 48,368 | 32,417 | 64,319 | 69,231 | 36,973 | (10,197 | ) |
| Blue Moon Mine | 164 | March 2025 |
|
Blue Moon Metals Inc. |
| 22.6 | Sensitivity Analysis |
| 22.6.1 | Base Case Sensitivity |
Micon has tested the sensitivity of the base case NPV8 and IRR to changes in prices (which may also be used as a proxy for ore grades and recoveries), as well as operating costs and capital expenditures. The results are shown in Figure 22.7 and Figure 22.8, respectively.
Figure
22.7
Base Case NPV Sensitivity Analysis
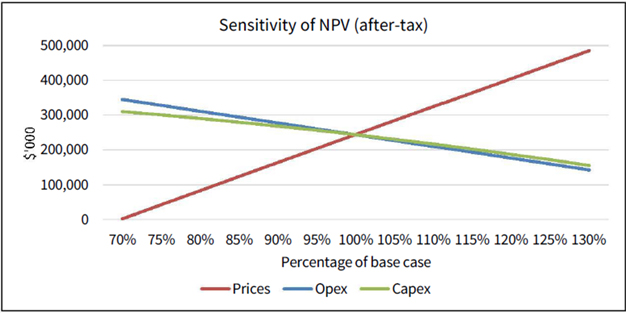
Figure
22.8
Base Case IRR Sensitivity Analysis
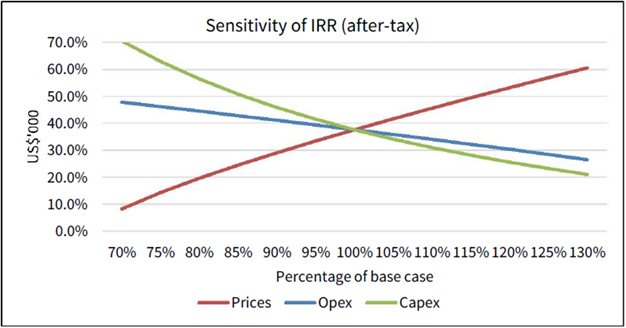
| Blue Moon Mine | 165 | March 2025 |
|
Blue Moon Metals Inc. |
The Project is most sensitive to changes in product prices with a 30% reduction resulting in a near-zero NPV8. A 30% increase in operating and capital costs reduce NPV8 to US$144 million and US$155 million, respectively, showing the Project to be relatively insensitive to either factor alone.
| 22.6.2 | Discount Rate Sensitivity |
Sensitivity of after-tax NPV to discount rate has also been tested, as shown in Figure 22.9.
Figure
22.9
Base Case Sensitivity to Discount Rate
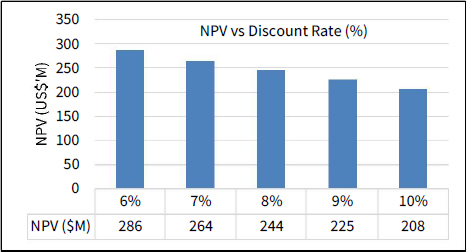
| 22.6.3 | Detailed Metal Price Sensitivity |
Table 22.8 compares the key economic results for metal prices 10% lower and higher than the base case, as well as at long-term consensus prices forecast in 2024 and average spot prices observed in February, 2025.
Table
22.8
Detailed
Metal Price Sensitivity
| Parameters | PEA
Base Case |
-10% Pricing |
+10% Pricing |
Long-Term Consensus Forecast |
Spot
Prices Average. 2025-02 |
|||||||||||||||||
| Copper US$/lb | 4.20 | 3.78 | 4.62 | 4.75 | 4.23 | |||||||||||||||||
| Metal Prices Assumed | Zinc US$/lb | 1.25 | 1.13 | 1.38 | 1.26 | 1.27 | ||||||||||||||||
| Gold US$/oz | 2,200 | 1,980 | 2,420 | 2,181 | 2,895 | |||||||||||||||||
| Silver US$/oz | 27.00 | 24.30 | 29.70 | 26.16 | 32.18 | |||||||||||||||||
| After-Tax NPV (US$ M, 8% Discount Rate) | $ | 244 | $ | 163 | $ | 324 | $ | 260 | $ | 340 | ||||||||||||
| After-Tax IRR (%) | 38 | % | 29 | % | 46 | % | 39 | % | 48 | % | ||||||||||||
| First 6 Years of After-Tax Cashflow (US$ M) | $ | 367 | $ | 293 | $ | 442 | $ | 382 | $ | 458 | ||||||||||||
| Payback Period (Years) | 2.4 | 2.9 | 2.0 | 2.3 | 1.9 | |||||||||||||||||
| C1 Cost (US$/lb ZnEq) | $ | 0.60 | $ | 0.60 | $ | 0.61 | $ | 0.60 | $ | 0.55 | ||||||||||||
| LOM Average Head Grade (ZnEq %) | 12.55 | 12.66 | 12.47 | 12.72 | 13.83 | |||||||||||||||||
| Blue Moon Mine | 166 | March 2025 |
|
Blue Moon Metals Inc. |
23.0 ADJACENT PROPERTIES
Currently there are no adjacent properties with similar mineralization to the Blue Moon Property.
| Blue Moon Mine | 167 | March 2025 |
|
Blue Moon Metals Inc. |
24.0 OTHER RELEVANT DATA AND INFORMATION
The Authors know of no other relevant data and information that would make the report understandable and not misleading.
| Blue Moon Mine | 168 | March 2025 |
|
Blue Moon Metals Inc. |
25.0 INTERPRETATION AND CONCLUSIONS
| 25.1 | Overview |
Micon was engaged by Blue Moon Metals Inc. to prepare a preliminary economic assessment conforming to NI 43-101 standards, evaluating the potential economic viability of the Blue Moon Project based on the updated 2024 mineral resource estimate.
This technical report, compliant with NI 43-101, was prepared by experienced independent consultants employing established geological and engineering methodologies. The report provides detailed findings from exploration, geological modeling, mineral resource estimation, mining methods, metallurgical testing, processing techniques, infrastructure needs, environmental considerations, tailings and water management, and capital and operating cost estimations. The investigation meets or surpasses typical industry standards for preliminary economic assessments.
The Qualified Persons collectively conclude that the Blue Moon Project, as detailed in this PEA, contains sufficient supporting information to substantiate a positive preliminary economic outlook. The Blue Moon deposit hosts significant resources enriched in zinc, copper, silver, and gold, suitable for underground mining and conventional processing methods. No fatal flaws have been identified at this stage. The report’s findings justify advancing the Project to a preliminary feasibility study.
| 25.2 | Geological Setting, Exploration, and Resources |
The Blue Moon Project exhibits a typical volcanogenic massive sulphide (VMS) system with mineralization enriched in zinc, copper, lead, gold, and silver. Current drilling defines mineralization extending over 900 m in strike length and to depths of approximately 300 m. Recent exploration programs successfully expanded and confirmed mineralized zones, highlighting considerable potential for resource growth through continued exploration drilling. Updated resource estimates indicate substantial Indicated Resources of 3.7 million tons grading 13.46% zinc equivalent and Inferred Resources of 4.4 million tons grading approximately 12.12% zinc equivalent.
| 25.3 | Mining Methods and Infrastructure |
The recommended underground longhole retreat mining method is appropriate for the Blue Moon deposit, offering safe and efficient extraction at planned production levels. Infrastructure plans, including processing facilities, road enhancements, and tailings management, require detailed engineering but are considered achievable and within industry standards.
| 25.4 | Metallurgy and Processing |
Metallurgical tests confirm effective and robust recovery rates using conventional flotation and gravity separation methods, achieving approximately 95% recovery for zinc, 93.1% for copper, and economically significant recoveries for silver and gold. The testing validated that concentrates produced meet or exceed industry-standard specifications for marketability, providing strong support for the economic and technical feasibility of the proposed processing techniques. Further testwork during feasibility studies is recommended to refine and optimize processing parameters.
| Blue Moon Mine | 169 | March 2025 |
|
Blue Moon Metals Inc. |
| 25.5 | Environmental, Permitting, and Social Impact |
The Project is expected to have a positive social impact. An initial review of environmental risks indicates that any negative impacts can be managed through appropriate engineering controls, implementation of an environmental and social management system, and adequate resources for technical staff and monitoring equipment/analysis. Specific permitting requirements will need to be confirmed with Mariposa County as the Project advances.
| 25.6 | Capital and Operating Costs |
Preliminary capital cost estimates for the Blue Moon Project are approximately US$209 million (LOM), inclusive of mine development, processing plant construction, and necessary infrastructure improvements. Total operating costs are estimated at approximately US$116.24 per tonne milled. More detailed engineering studies are recommended to further refine these estimates, optimize project economics, and reduce uncertainties associated with early-stage assessments.
| 25.7 | Economic Analysis |
This PEA is preliminary in nature. It includes Inferred Mineral Resources that are considered too speculative geologically to have the economic considerations applied to them that would enable them to be categorized as mineral reserves, and there is no certainty that the PEA will be realized. Mineral Resources that are not Mineral Reserves do not have demonstrated economic viability.
The base case cash flow projection displays positive economic returns, supporting the potential viability of the plant-feed material included in the LOM production forecast.
| Blue Moon Mine | 170 | March 2025 |
|
Blue Moon Metals Inc. |
26.0 RECOMMENDATIONS
The following recommended work program adopts a two-phased approach to the further development of the project. BMM intends to construct an exploration decline to access a broader portion of the mineral deposit. Drilling of the deposit from underground offers technical and cost benefits over surface drilling; therefore, development an exploration decline is recommended. BMM must obtain permits prior to construction of the decline. Phase 1 of the work program includes the steps necessary to obtain the required permitting for construction. Phase 1 culminates with the decision to advance to Phase 2; the construction of the exploration decline. Section 26.1 and Section 26.2 describe the work program phases in detail.
| 26.1 | Phase 1: Planning, Hiring and Permitting |
Following the completion of the PEA, BMM plans to initiate permitting for the development of an exploration decline which, by providing underground access, will allow more efficient exploration core drilling as well as facilitating the geotechnical, hydrogeological, and metallurgical studies which are to be carried out in Phase 2.
Concurrently, Blue Moon intends to expand its team by recruiting additional California-based staff to manage the project’s continued development.
It is recommended that BMM complete the ongoing collation and digitization of paper records from previous work on the Property as a guide to future exploration and development work.
To the extent possible, core from earlier drill programs not already stored securely should also be preserved and examined to provide geological and geotechnical data relevant to the Project.
| 26.2 | Phase 2: Exploration Decline Development and Further Studies |
| 26.2.1 | Exploration Decline Development |
Upon finalizing the permitting process for the exploration decline, BMM intends to tender and award a construction contract for its development. The decline’s construction is anticipated to take around one year and will support underground exploration and geotechnical drilling, reducing both surface disturbance and drilling costs. Additionally, the decline will be designed for dual functionality, serving as the primary access and haulage way once the mine is in operation. It is projected to extend to a depth of approximately 1,000 feet below the surface.
| 26.2.2 | Geology and Exploration |
The Blue Moon mineralization remains open along strike to the south and at depth. A program of exploration drilling is suggested in order to improve confidence in the resource estimate, aimed at bringing at least part of the Inferred Resource into the Indicated category. That drilling would permit geotechnical logging of the core and generate fresh samples on which to conduct metallurgical testwork. As proposed, therefore, Phase 2 includes an exploration drilling program comprising 13 holes totaling 10,650 m, to be conducted from the decline described above. Beyond mineral resource expansion, the program aims to improve understanding of underground geotechnical conditions to refine assumptions regarding stope spans, backfill strength and mining dilution, providing critical data for future mine planning efforts.
| Blue Moon Mine | 171 | March 2025 |
|
Blue Moon Metals Inc. |
| 26.2.3 | Hydrogeological Fieldwork |
Pump-testing of existing boreholes should be used to confirm their adequacy as a source of make-up water for the proposed process plant. Additional hydrogeological field work will be conducted to better define mine dewatering requirements during mine operation.
| 26.2.4 | Metallurgical Testwork |
Metallurgical testwork on representative composite samples of fresh core should be undertaken to (a) confirm the process design criteria currently based on results of earlier testwork; (b) establish whether barite, gypsum, and/or pyrite can be recovered economically; (c) investigate the occurrence of gallium, germanium and indium in the concentrates. Drill core from the exploration drilling program will be used for this purpose, and the testwork should include:
| • | Pre concentration amenability tests to investigate upgrading of the mineralization and the potential to extract barite and /or gypsum before grinding. |
| • | Detailed mineralogical characterization studies. |
| • | Deportment studies for gold, silver and potential critical metals, such as gallium, germanium and indium. |
| • | Hardness and comminution tests. |
| • | Additional gravity testwork. |
| • | Further flotation optimization batch tests followed by locked cycle tests. |
| • | Tailings characterization studies. |
Based on the additional testwork described above, the process flowsheet and equipment sizing may be refined, and the location of the plant and ancillary services may be optimized to minimize capital and operating costs and improve the quality of concentrates produced.
| 26.2.5 | Environmental and Social |
Recommendations considered important for ongoing development of the Project include the following:
| 1. | Update all baseline studies and undertake additional surveys and testwork to ensure comprehensive understanding of environmental and social conditions. Particular attention should be paid to geochemical properties, seasonal differences in water bodies and biodiversity (migratory birds and mammals), potential nesting sites for birds of prey, and socio-economic conditions. |
| 2. | Demarcate any known cultural heritage sites and design infrastructure and access routes to avoid them, in collaboration with regulatory authorities. |
| 3. | Communicate with regulatory authorities and other relevant stakeholders to better determine the presence/absence of threatened/protected species and potential migration routes for mammals and birds. |
| 4. | Consider installing basic monitoring infrastructure, such as a weather station and groundwater monitoring boreholes to support ongoing baseline data collection. |
| Blue Moon Mine | 172 | March 2025 |
|
Blue Moon Metals Inc. |
| 5. | Ensure all stakeholder interactions, including informal meetings, are documented and filed to assist the community relations and communications teams in future should the Project proceed to an operational mine. |
| 6. | Integrate sensitive/protected areas into the GIS used by the exploration team, to minimize the risk for damage, for example cultural heritage sites and known wildlife habitats. |
| 7. | Ensure all future exploration drill holes are properly closed up, to minimize land disturbance and avoid future problems with water connectivity. Establish a formal procedure for this and ensure the closure of all drill sites is properly documented. |
| 8. | Regularly review the project design, to adapt to emerging environmental and social risks and incorporate the latest available technologies for energy efficiency and environmental protection. |
| 26.2.6 | Feasibility Study |
The results of the Phase 2 field work programs will inform a Feasibility Study (“FS”) undertaken to refine the Project’s economic and technical parameters, reduce project risks, and enhance resource confidence, while supporting permitting efforts. Upon completion of a FS, a formal construction decision will be made by the BMM board of directors.
| 26.3 | Work Program |
A provisional budget estimate for the aforementioned work programs is outlined in Table 26.1.
Table 26.1
Blue Moon Preliminary Feasibility Study Work Program
| Activity | Amount (US$’000) | |||
| Phase 1 | ||||
| Permitting of Exploration Decline | 500 | |||
| Digitization of drill logs and other paper records | 25 | |||
| Relogging and preservation of historical core | 45 | |||
| Hiring of California-based project development team | 230 | |||
| Exploration decline design, tender & award | 200 | |||
| Phase 1 work program subtotal | 1,000 | |||
| Phase 2 | ||||
| Exploration Decline construction and underground development | 21,635 | |||
| Exploration drilling, logging, surveys and assaying | 3,730 | |||
| Hydrogeological field work | 120 | |||
| Metallurgical testwork program on fresh core | 600 | |||
| Environmental testwork and monitoring, social studies | 500 | |||
| FS and updated Technical Report | 2,500 | |||
| Phase 2 work program subtotal | 29,085 | |||
| Total | 30,085 | |||
| Blue Moon Mine | 173 | March 2025 |
|
Blue Moon Metals Inc. |
27.0 REFERENCES
Anonymous, 1957, California Division of Mines and Geology Vol 53, Numbers 1 and 2, Mines and Mineral Deposits of Mariposa County, California; p. 35
Briggs, B. 1989, Westmin Mines Limited Blue Moon Project Mining Plan, private company report dated December 1989.
Carpenter, Tom, 2023, Summary of the gravity survey conducted for Keystone Mines Inc. on the Blue Moon Project, September 25 through 30, 2023, 20 pp.
Cedar Creek Associates Inc., 1988. Terrestrial Wildlife Resource Report for the Blue Moon Project.
D&S Whitcombe, 1991, Mariposa Community Profile Project. Eric, John H., and Cox, Manning W., 1948, Zinc deposits of the American Eagle- Blue Moon area, Mariposa County, California: California Div. Mines Bull. 144, pp. 133-150.
Giroux, G.H. and O’Connor, L.J., 2018, Resource Estimate for the Blue Moon Massive Sulfide Occurrence, Mariposa County, CA, Technical Report for Blue Moon Zinc, 70 pp.
Graham, R.W., 1987, The Geology and Geochemistry of the Blue Moon Polymetallic Sulfide Deposit, Mariposa County, California, M.S. Thesis, Colorado School of Mines, 163 pp.
Hendricksen, A.H. and Wilson, S., 2023, Technical Report for the Blue Moon Mine Township 4 South, Range 16 East MDB&M, Mariposa County, California, November 19, 2023, 74pp.
Hutchinson, R.W., 1973, Volcanogenic sulfide deposits and their metallogenic significance: Economic Geology, v. 68, p 1223-1246.
Knight Piésold, 1988, Seismicity Study Blue Moon Project.
Knight Piésold, 1988, Hydrogeological Investigations and groundwater Modelling.
Knight Piésold, 1989, Blue Moon - Hydrogeological Investigations and Groundwater Modelling
Lakefield Research, An Investigation of The Recovery of Copper, Lead and Zinc from Blue Moon Project Samples Submitted by Westmin Resources Limited, Progress Report No. 1, dated November 22, 1988.
Leader, J. 1987, Colony Pacific Explorations Ltd. Blue Moon Project Mariposa California, private company report, dated November 27, 1997.
Main, J. 2024, Aggregate Sales Opportunity from Blue Moon Mining Project, memorandum from Compass Land Group to Blue Moon Metals, dated November 14, 2024.
Martin, R.C. 1988, Volcanogenic massive sulfide belt of the Western Sierra Nevada foothills, California Geology, September 1998, p 1995-204.
Meade H. D. 2002, Summary Report on Geological, Engineering and Economic Evaluation on Blue Moon Property Mariposa County, California. Private report prepared for Expatriate Resources Ltd., dated September 12, 2002.
Meade H.D. and MacVeigh, G. 1995, Blue Moon, private company report for Westmin Resources Limited dated October 1995.
Meade H. D. 1996, Addendum to Blue Moon Report, private company report for Westmin Resources Limited, dated April 3, 1996.
| Blue Moon Mine | 174 | March 2025 |
|
Blue Moon Metals Inc. |
Meade, H. D. 1996, Blue Moon Project, Mariposa County, California, Executive Summary, private company report for Westmin Resources Limited, dated December 1996.
Morris, R.J. and Giroux, G. 2008, Resource Estimate for the Blue Moon Massive Sulphide Occurrence, 4 3-101 Report for Savant Explorations Ltd., February 7, 2008.
Napton & Greathouse, 1988, Cultural Resource Study.
Philips & Plumley, 1989, Mine Waste Classification, Blue Moon Property
Riverside Technology Inc., 1989, Water Resources Technical Report for the Blue Moon Project Underground Exploration Program.
Terry, D.A., 1998, Exploration Proposal for the Blue Moon Project, Mariposa County, California, private company report for Boliden Limited, June 11, 1988.
| Blue Moon Mine | 175 | March 2025 |
|
Blue Moon Metals Inc. |
28.0 DATE AND SIGNATURE PAGE
RESOURCE DEVELOPMENT ASSOCIATES INC.
“ Scott Wilson” {signed and sealed as of the report date}
| Scott E. Wilson, C.P.G. SME-RM | Report Date: April 14, 2025 |
| Principal | Effective Date: March 03, 2025 |
MICON INTERNATIONAL LIMITED
“ Peter Szkilnyk” {signed and sealed as of the report date}
| Peter Szkilnyk, P.Eng. | Report Date: April 14, 2025 |
| Mining Lead | Effective Date: March 03, 2025 |
“ Alan San Martin” {signed and sealed as of the report date}
| Alan J. San Martin, P.Eng. | Report Date: April 14, 2025 |
| Senior Mining Engineer | Effective Date: March 03, 2025 |
“ Richard Gowans” {signed and sealed as of the report date}
| Richard M. Gowans, P.Eng. | Report Date: April 14, 2025 |
| Principal Metallurgist | Effective Date: March 03, 2025 |
“ Abel Obeso” {signed and sealed as of the report date}
| Abel Obeso, P.Eng. | Report Date: April 14, 2025 |
| Project Manager | Effective Date: March 03, 2025 |
“ Christopher Jacobs” {signed and sealed as of the report date}
| Christopher Jacobs, CEng, MIMMM | Report Date: April 14, 2025 |
| Mining Economist | Effective Date: March 03, 2025 |
| Blue Moon Mine | 176 | March 2025 |
|
Blue Moon Metals Inc. |
29.0 CERTIFICATES
Certificates for each of the Qualified Persons responsible for this Technical Report are include in this section.
| Blue Moon Mine | 177 | March 2025 |
|
Blue Moon Metals Inc. |
Scott E. Wilson
I, Scott E. Wilson, CPG, SME-RM, of Highlands Ranch, Colorado, as co-author of this report for Blue Moon Metals Inc. entitled “NI 43-101 Technical Report for the Preliminary Economic Assessment of the Blue Moon Mine, Mariposa County, California” dated April 14, 2025, with an effective date of March 03, 2025, do hereby certify that:
| 1. | I am currently employed as President by Resource Development Associates, Inc., 10262 Willowbridge Way, Highlands Ranch, Colorado USA 80126. |
| 2. | I graduated with a Bachelor of Arts degree in Geology from the California State University, Sacramento in 1989. |
| 3. | I am a Certified Professional Geologist and member of the American Institute of Professional Geologists (CPG #10965) and a Registered Member (#4025107) of the Society for Mining, Metallurgy and Exploration, Inc. |
| 4. | I have been employed as both a geologist and a mining engineer continuously for a total of 34 years. My experience included resource estimation, mine planning, geological modeling, geostatistical evaluations, project development, and authorship of numerous technical reports and preliminary economic assessments of various projects throughout North America, South America and Europe. I have employed and mentored mining engineers and geologists continuously since 2003. |
| 5. | I have read the definition of “Qualified Person” set out in National Instrument 43-101 (“NI 43-101) and certify that by reason of my education, affiliation with a professional association (as defined in NI 43-101) and past relevant work experience, I fulfill the requirements to be a “Qualified Person” for the purposes of NI 43-101. |
| 6. | I conducted a personal inspection of the Blue Moon Project on November 5 to 6, 2024. |
| 7. | I am responsible for Sections 1.2-1.5, 1.7, 4-12, 14, 23, 25.2, and 26 (except 26.2.4 and 26.2.5) of the Technical Report. |
| 8. | I am independent of the Issuer as independence is described in Section 1.5 of NI 43-101. |
| 9. | The Issuer retained my services in August 2023 to independently estimate mineral resources for the Project. |
| 10. | I have read NI 43-101 and Form 43-101F1, and this Technical Report was prepared in compliance with NI 43-101. |
| 11. | As of the effective date of this Technical Report, to the best of my knowledge, information and belief, the portions of the Technical Report for which I am responsible contain all scientific and technical information that is required to be disclosed to make the portions of the Technical Report for which I am responsible not misleading. |
Report dated April 14, 2025, with an effective date of March 03, 2025.
“Scott Wilson” {signed and sealed}
Scott E. Wilson, CPG, SME-RM
President
| Blue Moon Mine | 178 | March 2025 |
|
Blue Moon Metals Inc. |
Peter Szkilnyk, P.Eng.
As the co-author of this report for Blue Moon Metals Inc. entitled “NI 43-101 Technical Report for the Preliminary Economic Assessment of the Blue Moon Mine, Mariposa County, California” dated April 14, 2025, with an effective date of March 03, 2025, I, Peter Szkilnyk, do hereby certify that:
| 1. | I am employed as Principal Mining Engineer by, and carried out this assignment for, Micon International Limited, Suite 601, 90 Eglinton Ave. East, Toronto, Ontario M4P 2Y3, tel. (416) 362-5135, email: pszkilnyk@micon-international.com. |
| 2. | I hold the following academic qualifications: |
B.ASc (Mining Engineering), Queen’s University, 2008
M.B.A., Smith School of Business, Queen’s University, 2018
| 3. | I am a licensed Professional Engineer in the Province of Ontario (PEO license #100182869) and a member in good standing of the Canadian Institute of Mining, Metallurgy and Petroleum. By virtue of my education, professional registration, and relevant work history, I fulfill the requirements of a Qualified Person as defined in NI 43-101. |
| 4. | I have over 15 years of progressive experience in the mining industry, including roles in mine engineering, technical due diligence, M&A evaluation, mineral reserve estimates, and strategic planning for both open-pit and underground operations. During my career, I have participated in multiple scoping, prefeasibility, and feasibility studies across various commodities, led or supported due diligence reviews for corporate development activities, and served as a technical consultant on projects in Canada and internationally. |
| 5. | I have not visited the Blue Moon Property that is the subject of this report. |
| 6. | I have had no prior involvement with the Blue Moon Property which is the subject of this Technical Report. |
| 7. | I am responsible for Sections 1.8, 1.9, 15, 16 (except 16.2 and 16.3), 21.2.1, and 25.3 of this Technical Report. |
| 8. | I am independent of Blue Moon Metals Inc. and its related entities, as defined in Section 1.5 of NI 43-101. |
| 9. | I have read NI 43-101 and the Sections of this report for which I am responsible have been prepared in compliance with the instrument. |
| 10. | As of the date of this certificate to the best of my knowledge, information and belief, the sections of this Technical Report for which I am responsible contain all scientific and technical information that is required to be disclosed to make this report not misleading. |
Report dated April 14, 2025, with an effective date of March 03, 2025.
“Peter Szkilnyk” {signed and sealed as of the report date}
Peter Szkilnyk, P.Eng
Principal Mining Engineer
| Blue Moon Mine | 179 | March 2025 |
|
Blue Moon Metals Inc. |
Alan J. San Martin, B.Eng., P.Eng.
As the co-author of this report for Blue Moon Metals Inc. entitled “NI 43-101 Technical Report for the Preliminary Economic Assessment of the Blue Moon Mine, Mariposa County, California” dated April 14, 2025, with an effective date of March 03, 2025, I, Alan J. San Martin, do hereby certify that:
| 1. | I am employed by, and carried out this assignment for, Micon International Limited, whose address is Suite 601, 90 Eglington Ave. East, Toronto, Ontario M4P 2Y3., tel: (416) 362-5135, e-mail asanmartin@micon-international.com. |
| 2. | I hold the following academic qualifications: |
Bachelor’s degree in Mining Engineering (B.Eng.) from the National University of Piura, Peru, 1999.
| 3. | I am a registered Professional Engineer of Ontario (PEO License # 100568064); as well, I am a member in good standing of: |
Canadian Institute of Mining, Metallurgy and Petroleum, Member ID 151724.
Colegio de Ingenieros del Perú (CIP), Membership # 79184.
| 4. | I have been working as a mining engineer and geoscientist in the mineral industry for over 25 years; |
| 5. | I am familiar with the current NI 43-101 and, by reason of education, experience and professional registration as Licensed Professional Engineer, I fulfill the requirements of a Qualified Person as defined in NI 43-101. My work experience includes 5 years as Mining Engineer in exploration (Peru), 4 years as Resource Estimator in exploration (Ecuador) and 16 years as mining consultant in Canada; |
| 6. | I have read NI 43-101 and Form 43-101F1 and the portions of this Technical Report for which I am responsible have been prepared in compliance with that instrument and form. |
| 7. | I visited the Blue Moon Property that is the subject of this report on November 5 to 6, 2024. |
| 8. | I have had no prior involvement with the Blue Moon Property which is the subject of this Technical Report. |
| 9. | I am independent of Blue Moon Metals Inc. and its related entities, as defined in Section 1.5 of NI 43-101. |
| 10. | I am responsible for Sections 16.2 and 16.3 of this Technical Report. |
| 11. | As of the date of this certificate, to the best of my knowledge, information and belief, the Technical Report contains all scientific and technical information that is required to be disclosed to make this technical report not misleading. |
Report dated April 14, 2025, with an effective date of March 03, 2025.
“Alan San Martin” {signed and sealed}
Alan J. San Martin, P.Eng.
Senior Mining Engineer
| Blue Moon Mine | 180 | March 2025 |
|
Blue Moon Metals Inc. |
Richard M. Gowans, P.Eng.
As the co-author of this report for Blue Moon Metals Inc. entitled “NI 43-101 Technical Report for the Preliminary Economic Assessment of the Blue Moon Mine, Mariposa County, California” dated April 14, 2025, with an effective date of March 03, 2025, I, Richard Gowans do hereby certify that:
| 1. | I am employed by, and carried out this assignment for, Micon International Limited, Suite 601, 90 Eglinton Ave. East, Toronto, Ontario M4P 2Y3, tel. (416) 362-5135, e-mail rgowans@micon-international.com. |
| 2. | I hold the following academic qualifications: |
B.Sc. (Hons) Minerals Engineering, The University of Birmingham, U.K.1980.
| 3. | I am a registered Professional Engineer of Ontario (membership number 90529389); as well, I am a member in good standing of the Canadian Institute of Mining, Metallurgy and Petroleum. |
| 4. | I am familiar with NI 43-101 and by reason of education, experience and professional registration, fulfill the requirements of a Qualified Person as defined in NI 43-101. I have worked for over 30 years in a wide range of technical areas as a consultant, manager and engineer; including mineral processing, hydrometallurgy, pyrometallurgy, logistics and infrastructure design and review, and capital and operating cost estimation. |
| 5. | I have read NI 43-101 and this Technical Report has been prepared in compliance with the instrument. |
| 6. | I have not visited the Blue Moon Property which is the subject of this Technical Report. |
| 7. | I have had no prior involvement with the Blue Moon Property which is the subject of this Technical Report. |
| 8. | I am independent of Blue Moon Metals Inc. and its related entities, as defined in Section 1.5 of NI 43-101. |
| 9. | I am responsible for Sections 1.6, 1.10, 13, 17, 21.2.2, 25.4, and 26.2.4 of this Technical Report. |
| 10. | As of the date of this certificate, to the best of my knowledge, information and belief, the Technical Report contains all scientific and technical information that is required to be disclosed to make this technical report not misleading. |
Report dated April 14, 2025, with an effective date of March 03, 2025.
“ Richard Gowans” {signed and sealed}
Richard Gowans P.Eng.
Principal Metallurgist
| Blue Moon Mine | 181 | March 2025 |
|
Blue Moon Metals Inc. |
Abel Obeso, P.Eng.
As the co-author of this report for Blue Moon Metals Inc. entitled “NI 43-101 Technical Report for the Preliminary Economic Assessment of the Blue Moon Mine, Mariposa County, California” dated April 14, 2025, with an effective date of March 03, 2025, I, Abel Obeso do hereby certify that:
| 1. | I am employed by, and carried out this assignment for, Halyard Inc, 212 King Street W, Suite 501, Toronto, Ontario, M5H1K5; parent company of Micon International Limited, Suite 601, 90 Eglinton Ave. East, Toronto, Ontario M4P 2Y3, tel. (437) 248-8350, e-mail abel@halyard.ca. |
| 2. | I hold the following academic qualifications: |
M.Sc. Industrial Engineering, Universidad de Oviedo, Escuela Politécnica de Ingeniería de Gijón (EPSIG), Spain, 2011.
| 3. | I am a registered Professional Engineer in Ontario (P.Eng., License 100559895) and British Columbia (P.Eng., License 61181). |
| 4. | I am familiar with NI 43-101 and, by reason of education, experience, and professional registration, fulfill the requirements of a Qualified Person as defined in NI 43-101. My work experience includes 4 years in the management of technical studies and design of metallurgical processing plants. |
| 5. | I have read NI 43-101 and this Technical Report has been prepared in compliance with the instrument. |
| 6. | I have not visited the Blue Moon Property which is the subject of this Technical Report. |
| 7. | I have had no prior involvement with the Blue Moon Property which is the subject of this Technical Report. |
| 8. | I am independent of Blue Moon Metals Inc. and its related entities, as defined in Section 1.5 of NI 43-101. |
| 9. | I am responsible for Sections 1.11, 18, and 21.1.3-21.1.5 of this Technical Report. |
| 10. | As of the date of this certificate, to the best of my knowledge, information and belief, the Technical Report contains all scientific and technical information that is required to be disclosed to make this technical report not misleading. |
Report dated April 14, 2025, with an effective date of March 03, 2025.
“ Abel Obeso” {signed and sealed as of the report date}
Abel Obeso P.Eng.
Mechanical Engineer / Project Manager
| Blue Moon Mine | 182 | March 2025 |
|
Blue Moon Metals Inc. |
Christopher Jacobs, CEng, MIMMM
As the co-author of this report for Blue Moon Metals Inc. entitled “NI 43-101 Technical Report for the Preliminary Economic Assessment of the Blue Moon Mine, Mariposa County, California” dated April 14, 2025, with an effective date of March 03, 2025, I, Christopher Jacobs, do hereby certify that:
| 1. | I am employed as Mining Economist by, and carried out this assignment for, Micon International Limited, Suite 601, 90 Eglinton Ave. East, Toronto, Ontario M4P 2Y3, tel. (416) 362-5135, email: cjacobs@micon-international.com. |
| 2. | I hold the following academic qualifications: |
B.Sc. (Hons) Geochemistry, University of Reading, 1980;
M.B.A., Gordon Institute of Business Science, University of Pretoria, 2004.
| 3. | I am a Chartered Engineer registered with the Engineering Council of the U.K. (registration number 369178), as well, I am a member in good standing of: |
The Institute of Materials Minerals and Mining
The Canadian Institute of Mining, Metallurgy and Petroleum
| 4. | I am familiar with NI 43-101 and by reason of education, experience and professional registration, fulfill the requirements of a Qualified Person as defined in NI 43-101. I have worked in the minerals industry for more than 45 years; my work experience includes 10 years as an exploration and mining geologist on gold, platinum, copper/nickel and chromite deposits; 10 years as a technical/operations manager in both open-pit and underground mines; 3 years as strategic (mine) planning manager and the remainder as an independent consultant, in which capacity I have worked on a variety of deposits including gold and base metals. |
| 5. | I visited the Blue Moon Property that is the subject of this report on November 5 to 6, 2024. |
| 6. | I have had no prior involvement with the Blue Moon Property which is the subject of this Technical Report |
| 7. | I am responsible for Sections 1.1, 1.12-1.15, 2, 3, 19, 20, 21.1.1, 21.1.2,21.1.6, 21.2.3, 21.2.4, 22, 24,25.5-25.7, 26.2.5 and 27 of this Technical Report. |
| 8. | I am independent of Blue Moon Metals Inc. and its related entities, as defined in Section 1.5 of NI 43-101. |
| 9. | I have read NI 43-101 and the Sections of this report for which I am responsible have been prepared in compliance with the instrument. |
| 10. | As of the date of this certificate to the best of my knowledge, information and belief, the sections of this Technical Report for which I am responsible contain all scientific and technical information that is required to be disclosed to make this report not misleading. |
Report dated April 14, 2025, with an effective date of March 03, 2025.
“Christopher Jacobs” {signed and sealed as of the report date}
Christopher Jacobs, CEng, MIMMM
Mining Economist
| Blue Moon Mine | 183 | March 2025 |