Exhibit 99.28
Exhibit 99.28
Important Notice
This Technical Report was prepared as a National Instrument 43-101 Technical Report in accordance with Form 43-101F1, for Mayfair Gold Corp. (Mayfair Gold or the Company), by Qualified Persons working for T. Maunula & Associates Consulting Inc. (TMAC) or Haggarty Technical Services Corporation. The quality of information, conclusions, and estimates contained in this report are based on: i) information available at the time of preparation of data; ii) data from outside sources; and iii) the assumptions, conditions, and qualifications as put forth by the report authors. This report is intended to be used by Mayfair Gold, subject to TMAC’s terms and conditions. The relationship permits Mayfair Gold to file this report as a Technical Report with applicable securities regulatory authorities pursuant to provincial securities legislation.
| MAYFAIR GOLD CORP.
|
| |
| National Instrument 43-101 Technical Report—Mineral Resource Estimate Update Fenn–Gib Project, Ontario, Canada |
Contents
| 1 |
SUMMARY | 1-1 | ||||||||
| 1.1 | Project Description, Location, and Ownership | 1-1 | ||||||||
| 1.2 | History | 1-1 | ||||||||
| 1.3 | Mayfair Gold Exploration and Diamond Drilling | 1-2 | ||||||||
| 1.4 | Geology and Mineralization | 1-2 | ||||||||
| 1.5 | Metallurgical Testing and Mineral Processing | 1-3 | ||||||||
| 1.6 | Mineral Resource Estimate | 1-4 | ||||||||
| 1.7 | Recovery Methods | 1-5 | ||||||||
| 1.8 | Conclusions and Recommendations | 1-5 | ||||||||
| 2 |
INTRODUCTION | 2-1 | ||||||||
| 2.1 | Sources of Information | 2-1 | ||||||||
| 2.2 | Qualifications and Responsibilities | 2-1 | ||||||||
| 2.3 | Site Visit | 2-2 | ||||||||
| 2.4 | Units, Currency, and Rounding | 2-2 | ||||||||
| 3 |
RELIANCE ON OTHER EXPERTS | 3-1 | ||||||||
| 4 |
PROPERTY DESCRIPTION AND LOCATION | 4-1 | ||||||||
| 4.1 | Location | 4-1 | ||||||||
| 4.2 | Project Ownership | 4-1 | ||||||||
| 4.3 | Mineral Tenure | 4-1 | ||||||||
| 4.4 | Mining Rights | 4-18 | ||||||||
| 4.4.1 | Patented Land | 4-18 | ||||||||
| 4.4.2 | Unpatented Land | 4-18 | ||||||||
| 4.5 | Surface Rights | 4-18 | ||||||||
| 4.6 | Royalties and Encumbrances | 4-18 | ||||||||
| 4.7 | Permits | 4-19 | ||||||||
| 4.8 | Environmental Liabilities and Social License | 4-19 | ||||||||
| 4.9 | Significant Risk Factors | 4-19 | ||||||||
| 5 |
ACCESSIBILITY, CLIMATE, LOCAL RESOURCES, INFRASTRUCTURE, AND PHYSIOGRAPHY | 5-1 | ||||||||
| 5.1 | Accessibility | 5-1 | ||||||||
| 5.2 | Climate | 5-1 | ||||||||
| 5.3 | Local Resources and Infrastructure | 5-1 | ||||||||
| 5.4 | Physiography | 5-2 | ||||||||
| 5.5 | Sufficiency of Surface Rights | 5-2 | ||||||||
| 6 |
HISTORY | 6-1 | ||||||||
| 6.1 | Exploration History 1911–2011 | 6-1 | ||||||||
| 6.1.1 | Mineral Resource Estimate—2011 | 6-3 | ||||||||
| 6.2 | Exploration History 2012–2019 | 6-3 | ||||||||
| 6.3 | Exploration Targets | 6-3 | ||||||||
|
|
TOC | i October 10, 2025 |
| MAYFAIR GOLD CORP.
|
| |
| National Instrument 43-101 Technical Report—Mineral Resource Estimate Update Fenn–Gib Project, Ontario, Canada |
| 6.4 | Acquisition by Mayfair Gold—2020 | 6-5 | ||||||||
| 6.5 | Historical Mineral Resource Estimates Commissioned by Mayfair Gold | 6-5 | ||||||||
| 7 |
GEOLOGICAL SETTING AND MINERALIZATION | 7-1 | ||||||||
| 7.1 | Regional Geology | 7-1 | ||||||||
| 7.2 | Project Geology | 7-1 | ||||||||
| 7.3 | Mineralization | 7-3 | ||||||||
| 7.4 | Prospects and Exploration Targets | 7-4 | ||||||||
| 8 |
DEPOSIT TYPES | 8-1 | ||||||||
| 9 |
EXPLORATION | 9-1 | ||||||||
| 9.1 | Diamond Drilling | 9-1 | ||||||||
| 9.2 | Mayfair Gold—2021–Present | 9-1 | ||||||||
| 9.2.1 | Geochemistry | 9-1 | ||||||||
| 9.2.2 | Geophysical Surveys | 9-1 | ||||||||
| 9.2.3 | Other | 9-3 | ||||||||
| 10 |
DRILLING | 10-1 | ||||||||
| 10.1 | Historical Drilling | 10-1 | ||||||||
| 10.2 | Mayfair Gold Drilling | 10-1 | ||||||||
| 10.3 | Diamond Drilling Procedures | 10-3 | ||||||||
| 10.3.1 | Spotting Drill Holes | 10-3 | ||||||||
| 10.3.2 | Drilling | 10-3 | ||||||||
| 10.3.3 | Collar Surveys | 10-3 | ||||||||
| 10.3.4 | Downhole Surveys | 10-4 | ||||||||
| 10.3.5 | Geotechnical and Hydrological Drilling | 10-4 | ||||||||
| 10.4 | Qualified Person’s Opinion | 10-11 | ||||||||
| 11 |
SAMPLE PREPARATION, ANALYSES, AND SECURITY | 11-1 | ||||||||
| 11.1 | Historical Sampling Pre-2011 | 11-1 | ||||||||
| 11.2 | Historical Sampling Post 2011 | 11-2 | ||||||||
| 11.3 | Mayfair Gold Sampling | 11-2 | ||||||||
| 11.3.1 | Sampling Procedure | 11-2 | ||||||||
| 11.3.2 | Sample Preparation and Analysis | 11-3 | ||||||||
| 11.3.3 | Quality Control Samples | 11-6 | ||||||||
| 11.3.4 | QA/QC Control Charts | 11-7 | ||||||||
| 11.4 | Density Determinations | 11-14 | ||||||||
| 11.5 | Adequacy Statement | 11-14 | ||||||||
| 12 |
DATA VERIFICATION | 12-1 | ||||||||
| 12.1 | Historical Verification | 12-1 | ||||||||
| 12.2 | TMAC Verification | 12-1 | ||||||||
| 12.2.1 | Site Visits | 12-1 | ||||||||
| 12.2.2 | Diamond Drilling | 12-2 | ||||||||
| 12.2.3 | Database Verification | 12-2 | ||||||||
| 12.2.4 | Qualified Persons’ Opinion | 12-3 | ||||||||
| 13 |
MINERAL PROCESSING AND METALLURGICAL TESTING | 13-1 | ||||||||
| 13.1 | Conclusion from Metallurgical Testing | 13-1 | ||||||||
|
|
TOC | ii October 10, 2025 |
| MAYFAIR GOLD CORP.
|
| |
| National Instrument 43-101 Technical Report—Mineral Resource Estimate Update Fenn–Gib Project, Ontario, Canada |
| 13.2 | Findings from Metallurgical Testing | 13-1 | ||||||||
| 13.3 | Metallurgical Testwork | 13-2 | ||||||||
| 13.3.1 | Composite Sample Selection | 13-2 | ||||||||
| 13.3.2 | Lithology | 13-3 | ||||||||
| 13.3.3 | Composite Sample Details | 13-4 | ||||||||
| 13.3.4 | Rock Hardness Characterization | 13-8 | ||||||||
| 13.3.5 | Mineralogy | 13-9 | ||||||||
| 13.3.6 | Previous 2015–2022 Metallurgical Studies | 13-11 | ||||||||
| 13.3.2 | Metallurgical Studies—2023–2024 | 13-17 | ||||||||
| 13.4 | Recovery Estimates | 13-35 | ||||||||
| 13.5 | Metallurgical Variability | 13-38 | ||||||||
| 13.6 | Deleterious Elements | 13-39 | ||||||||
| 13.7 | Additional Metallurgical Testwork | 13-39 | ||||||||
| 14 |
MINERAL RESOURCE ESTIMATE | 14-1 | ||||||||
| 14.1 | Key Assumptions | 14-1 | ||||||||
| 14.2 | Data | 14-1 | ||||||||
| 14.3 | Geological Model | 14-1 | ||||||||
| 14.4 | Exploratory Data Analysis | 14-3 | ||||||||
| 14.4.1 | Assays | 14-3 | ||||||||
| 14.4.2 | Grade Capping and Outlier Restrictions | 14-3 | ||||||||
| 14.4.3 | Composites | 14-7 | ||||||||
| 14.5 | Density Assignment | 14-8 | ||||||||
| 14.6 | Variography | 14-9 | ||||||||
| 14.7 | Block Model Definition | 14-11 | ||||||||
| 14.8 | Estimation and Interpolation Methods | 14-11 | ||||||||
| 14.9 | Block Model Validation | 14-13 | ||||||||
| 14.9.1 | Visual Verification | 14-13 | ||||||||
| 14.9.2 | Statistical Validation | 14-16 | ||||||||
| 14.9.3 | Swath Plots | 14-16 | ||||||||
| 14.10 | Classification of Mineral Resources | 14-19 | ||||||||
| 14.11 | Reasonable Prospects of Economic Extraction | 14-19 | ||||||||
| 14.12 | Mineral Resource Statement | 14-20 | ||||||||
| 14.13 | Factors That May Affect the Mineral Resource Estimate | 14-21 | ||||||||
| 15 |
MINERAL RESERVE ESTIMATES | 15-1 | ||||||||
| 16 |
MINING METHODS | 16-1 | ||||||||
| 17 |
RECOVERY METHODS | 17-1 | ||||||||
| 18 |
PROJECT INFRASTRUCTURE | 18-1 | ||||||||
| 19 |
MARKET STUDIES AND CONTRACTS | 19-1 | ||||||||
| 20 |
ENVIRONMENTAL STUDIES, PERMITTING, AND COMMUNITY IMPACTS | 20-1 | ||||||||
| 21 |
CAPITAL AND OPERATING COSTS | 21-1 | ||||||||
| 22 |
ECONOMIC ANALYSIS | 22-1 | ||||||||
| 23 |
ADJACENT PROPERTIES | 23-1 | ||||||||
|
|
TOC | iii October 10, 2025 |
| MAYFAIR GOLD CORP.
|
| |
| National Instrument 43-101 Technical Report—Mineral Resource Estimate Update Fenn–Gib Project, Ontario, Canada |
| 24 |
OTHER RELEVANT DATA AND INFORMATION | 24-1 | ||||||||
| 25 |
INTERPRETATIONS AND CONCLUSIONS | 25-1 | ||||||||
| 25.1 | Interpretations | 25-1 | ||||||||
| 25.2 | Factors That May Affect the Mineral Resource Estimate | 25-1 | ||||||||
| 25.3 | Conclusions | 25-2 | ||||||||
| 26 |
RECOMMENDATIONS | 26-1 | ||||||||
| 27 |
REFERENCES | 27-1 | ||||||||
| 28 |
CERTIFICATE OF AUTHORS | 28-1 | ||||||||
| 28.1 | Tim Maunula, P.Geo | 28-1 | ||||||||
| 28.2 | Steven C. Haggarty, P.Eng | 28-2 | ||||||||
Tables
| Table 1-1: |
Fenn–Gib Project Mineral Resource Estimate |
1-5 | ||||
| Table 1-2: |
Recommended Work Programs and Cost Estimate |
1-6 | ||||
| Table 2-1: |
QP Responsibilities |
2-2 | ||||
| Table 2-2: |
QP Site Visit |
2-2 | ||||
| Table 4-1: |
Summary of Staked Claims |
4-4 | ||||
| Table 4-2: |
Summary of Mining Patents |
4-14 | ||||
| Table 4-3: |
Summary of Leased Claims |
4-15 | ||||
| Table 6-1: |
Mineral Occurrences within the Fenn–Gib Project |
6-2 | ||||
| Table 6-2: |
LSG and Tahoe Exploration Activities |
6-3 | ||||
| Table 10-1: |
Mayfair Gold Drill-Hole Summary by Year |
10-1 | ||||
| Table 10-2: |
Significant Drill-Hole Intersections |
10-5 | ||||
| Table 13-1: |
Fenn–Gib Project Composite Sample Identification and Lithology |
13-3 | ||||
| Table 13-2: |
Composite Sample Details |
13-5 | ||||
| Table 13-3: |
Rock Hardness Characterization Test Data |
13-9 | ||||
| Table 13-4: |
Composite Sample Gravity Recoverable Gold Content |
13-12 | ||||
| Table 13-5: |
Direct Cyanidation Gold Extraction versus Feed Sulphide Content |
13-14 | ||||
| Table 13-6: |
Diagnostic Leaching Tests Results |
13-15 | ||||
| Table 13-7: |
Pressure Oxidation Amenability Testwork |
13-16 | ||||
| Table 13-8: |
Heavy Liquid Separation Test Results |
13-17 | ||||
| Table 13-9: |
Rougher Flotation Test Data |
13-23 | ||||
| Table 13-10: |
Concentrate Regrind and Cyanidation Test Data |
13-27 | ||||
| Table 13-11: |
Cyanidation Gold Dissolution Rate Kinetics |
13-30 | ||||
| Table 13-12: |
Concentrate Regrinding—HIG Mill SGE Testwork (3 mm media at 45% solids) |
13-33 | ||||
| Table 13-13: |
Concentrate Regrinding—HIG Mill SGE Testwork (3 mm media at 47% solids) |
13-33 | ||||
| Table 13-14: |
Concentrate Regrinding—HIG Mill SGE Testwork (4 mm media at 47% solids) |
13-33 | ||||
| Table 13-15: |
Concentrate Regrinding—HIG Mill Slurry Viscosity Measurements |
13-34 | ||||
| Table 13-16: |
Acid-Base Accounting Test Results |
13-34 | ||||
| Table 13-17: |
Overall Gold Recovery from Flotation, Concentrate Regrind, and Cyanidation Test Data |
13-35 | ||||
| Table 14-1: |
Geology Block Model Codes and Descriptions |
14-2 | ||||
| Table 14-2: |
Capping Analysis Summary |
14-4 |
|
|
TOC | iv October 10, 2025 |
| MAYFAIR GOLD CORP.
|
| |
| National Instrument 43-101 Technical Report—Mineral Resource Estimate Update Fenn–Gib Project, Ontario, Canada |
| Table 14-3: |
Assigned Density Values |
14-8 | ||||
| Table 14-4: |
Correlogram Parameters |
14-10 | ||||
| Table 14-5: |
Block Model Workspace |
14-11 | ||||
| Table 14-6: |
Interpolation Parameters by Domain Code |
14-12 | ||||
| Table 14-7: |
Special Models |
14-13 | ||||
| Table 14-8: |
Grade Comparison by Interpolation Method |
14-16 | ||||
| Table 14-9: |
Pit Design Criteria |
14-19 | ||||
| Table 14-10: |
Fenn–Gib Project Mineral Resource Estimate |
14-20 | ||||
| Table 25-1: |
Fenn–Gib Project Mineral Resource Estimate |
25-1 | ||||
| Table 26-1: |
Recommended Work Programs and Cost Estimate |
26-1 |
Figures
| Figure 1-1: |
Plan View of Mineralized Envelopes |
1-3 | ||||
| Figure 4-1: |
Fenn–Gib Project Location |
4-2 | ||||
| Figure 4-2: |
Property Summarizing Mineral Tenure and Surface Rights (North Block) |
4-3 | ||||
| Figure 6-1: |
Geological Map Illustrating Mineral Showings |
6-1 | ||||
| Figure 6-2: |
Project Geology Showing Exploration Targets |
6-4 | ||||
| Figure 7-1: |
Regional Geology of the Timmins Area |
7-2 | ||||
| Figure 7-2: |
Plan View of Mineralized Envelopes |
7-3 | ||||
| Figure 9-1: |
Fenn–Gib North Block Mayfair Gold Drill Hole Locations |
9-2 | ||||
| Figure 10-1: |
Plan of Drill-Hole Locations used for the Fenn–Gib Mineral Resource Estimate |
10-2 | ||||
| Figure 11-1: |
Core Storage Yard, Matheson, Ontario |
11-3 | ||||
| Figure 11-2: |
Control Chart—Blank Material |
11-7 | ||||
| Figure 11-3: |
Control Chart—CRM OREAS 251b |
11-9 | ||||
| Figure 11-4: |
Control Chart—CRM OREAS 254b |
11-10 | ||||
| Figure 11-5: |
Control Chart—CRM OREAS 256b |
11-11 | ||||
| Figure 11-6: |
Control Chart—Duplicate Samples |
11-12 | ||||
| Figure 11-7: |
Control Chart—Check Assays, Swastika vs. ActLabs |
11-13 | ||||
| Figure 11-8: |
Control Chart—Check Assays, AGAT vs. ActLabs |
11-14 | ||||
| Figure 12-1: |
Collar Labelling, FG23-347 |
12-2 | ||||
| Figure 13-1: |
Composite Sample g/t Au versus Sulphide Content |
13-10 | ||||
| Figure 13-2: |
Composite Sample, g/t Au versus Gravity Recoverable Gold Content |
13-11 | ||||
| Figure 13-3: |
Direct Cyanidation—Feed Sulphide Content versus Overall Gold Extraction |
13-13 | ||||
| Figure 13-4: |
Heavy Liquid Separation—Au Distribution versus Slurry Specific Gravity |
13-18 | ||||
| Figure 13-5: |
Flotation Feed Grind Size versus %Recovery Gold and S2- to Rougher Concentrate |
13-20 | ||||
| Figure 13-6: |
Mass Pull versus %Recovery Gold and S2- to Rougher Concentrate |
13-21 | ||||
| Figure 13-7: |
Rougher Flotation Gold and S2- Rate Kinetics |
13-22 | ||||
| Figure 13-8: |
Concentrate Regrind Size versus %Extraction and CN Residue g/t Au |
13-27 | ||||
| Figure 13-9: |
Gold Extraction Rate Kinetics Relative to Cyanidation Retention Time |
13-30 | ||||
| Figure 13-10: |
Concentrate Regrind—HIG Mill Specific Grinding Energy kWh/t Data |
13-32 | ||||
| Figure 13-11: |
Geometallurgical Modelled Gold Head Grade versus Overall Gold Recovery |
13-38 | ||||
| Figure 14-1: |
Plan View of Drill-Hole Traces and Geological Block Model |
14-2 | ||||
| Figure 14-2: |
Boxplot of Uncapped Gold Grades (g/t) by Domain Code |
14-3 | ||||
| Figure 14-3: |
Log Probability Plot, Deformation Zone (Au g/t) |
14-5 |
|
|
TOC | v October 10, 2025 |
| MAYFAIR GOLD CORP.
|
| |
| National Instrument 43-101 Technical Report—Mineral Resource Estimate Update Fenn–Gib Project, Ontario, Canada |
| Figure 14-4: |
Log Probability Plot, Main Zone (Au g/t) |
14-6 | ||||
| Figure 14-5: |
1.5 m Composites Reported by Domain Code, Capped Au (g/t) |
14-7 | ||||
| Figure 14-6: |
5 m Composites Reported by Domain Code, Capped Au (g/t) |
14-8 | ||||
| Figure 14-7: |
5180 Elevation, Composites versus Block Model (Capped Au g/t) |
14-14 | ||||
| Figure 14-8: |
East 558500, Composites versus Block Model (Capped Au g/t) |
14-15 | ||||
| Figure 14-9: |
Swath Plot of NN and OK Mean Block Model Gold Grades with Mean Composite Gold Grade (g/t) |
14-17 | ||||
| Figure 14-10: |
Swath Plot of NN and IDW2 Mean Block Model Gold Grades with Mean Composite Gold Grade (g/t) |
14-18 |
Glossary
Abbreviations, Acronyms, and Units of Measure
| $ |
Canadian dollar | |
| < |
less than | |
| > |
greater than | |
| °C |
degrees Celsius | |
| µm |
micrometre | |
| % |
percent | |
| AAN |
Apitipi Anicinapek Nation | |
| ActLabs |
Activation Laboratories Ltd. | |
| Aero-3477 |
isobutyl dithiophosphate | |
| Aero-3501 |
isoamyl dithiophosphate | |
| AGAT |
AGAT Laboratories | |
| AGP |
acid generating potential | |
| ARD |
acid rock drainage | |
| Au |
gold | |
| Axb |
Rock Competency Index (no units) | |
| CIL |
carbon-in-leach | |
| CIM |
CIM Standards and Definitions for Mineral Resources and Mineral Reserves (CIM Definition Standards) | |
| CIP |
carbon-in-pulp | |
| cm |
centimetre | |
| CN |
cyanide | |
| CNG |
compressed natural gas | |
| Constantine |
Constantine Metal Resources Ltd. | |
| CRM |
Certified Reference Materials | |
| CV |
coefficient of variation | |
| Datamine |
Datamine Studio EM | |
| DC |
direct current |
|
|
TOC | vi October 10, 2025 |
| MAYFAIR GOLD CORP.
|
| |
| National Instrument 43-101 Technical Report—Mineral Resource Estimate Update Fenn–Gib Project, Ontario, Canada |
| DDH |
diamond drill hole | |
| Fenn–Gib or the Project |
Fenn–Gib Project | |
| g |
gram | |
| g/t Au |
grams per tonne of gold | |
| g/t |
grams per tonne | |
| Fenn–Gib or the Project |
Fenn–Gib Project | |
| GEMS |
Geovia GEMS 6.8.3 Desktop | |
| GeoticLog |
GeoticLog 8.2.14 | |
| GJ/d |
Gigajoules per day | |
| g/L |
grams per litre | |
| GRG |
Gravity recoverable gold | |
| ha |
hectare | |
| HLS |
Heavy liquid separation | |
| ID |
identification | |
| IDW2 |
inverse distance weighting squared | |
| IP |
induced polarization | |
| km |
kilometre | |
| kV |
kilovolt | |
| kWh/t |
kilowatt hour per tonne | |
| lb |
pounds | |
| LSG |
Lake Shore Gold Corp | |
| m |
metres | |
| Major Drilling |
Major Drilling Group International | |
| masl |
metres above sea level | |
| Mayfair Gold or the Company |
Mayfair Gold Corp. | |
| Metalla |
Metalla Royalty and Streaming Ltd. | |
| MIBC |
methyl isobutyl carbinol | |
| MinePlan |
HxGN MinePlan 16.2.1 | |
| MLAS |
Mining Lands Administration System | |
| mm |
millimetre | |
| mm/a |
millimetre per annum | |
| MMI |
mobile metal ion | |
| Moneta |
Moneta Gold Inc. | |
| mPa-sec |
millipascal-second | |
| MRE |
Mineral Resource estimate | |
| Mt |
million tonnes | |
| NI |
National Instrument | |
| NN |
nearest neighbour | |
| non-PAG or NAG |
non-potentially acid generating |
|
|
TOC | vii October 10, 2025 |
| MAYFAIR GOLD CORP.
|
| |
| National Instrument 43-101 Technical Report—Mineral Resource Estimate Update Fenn–Gib Project, Ontario, Canada |
| NP |
neutralizing potential | |
| NPI |
net profit interest | |
| NPR |
net proceeds royalty | |
| NRC |
National Research Council Canada | |
| NSR |
net smelter return | |
| OK |
ordinary kriging | |
| oz |
troy ounces | |
| P80 |
passing 80% | |
| PAG |
potentially acid generating | |
| Pan American |
Pan American Silver Corp. | |
| Pangea |
Pangea Goldfields Inc. | |
| PAX |
potassium amyl xanthate | |
| POX |
pressure oxidation | |
| QA/QC |
quality assurance and quality control | |
| QP |
Qualified Person | |
| Q-Q |
quartile–quartile | |
| RC |
reverse circulation | |
| RQD |
rock quality designation | |
| SEM |
scanning electron microscopy | |
| SG |
specific gravity | |
| SGH |
soil gas hydrocarbons | |
| SGS |
SGS Lakefield Inc. | |
| SHA |
SHA Geophysics Ltd. | |
| SI |
Système Métrique International (International System of Units) | |
| SMU |
selective mining unit | |
| SPT |
Static Pressure Test | |
| Swastika |
Swastika Laboratories | |
| Tahoe Resources |
Tahoe Resources Inc. | |
| TIMA-X |
TESCAN Integrated Mineral Analyzer | |
| TMAC |
T. Maunula & Associates Consulting Inc. | |
| w/w |
weight percentage |
|
|
TOC | viii October 10, 2025 |
| MAYFAIR GOLD CORP.
|
| |
| National Instrument 43-101 Technical Report—Mineral Resource Estimate Update Fenn–Gib Project, Ontario, Canada |
| 1 | SUMMARY |
T. Maunula & Associates Consulting Inc. (TMAC) prepared this Technical Report for Mayfair Gold Corp. (Mayfair Gold or the Company) in accordance with the Canadian Securities Administrators’ National Instrument (NI) 43-101 and Form 43-101F1, collectively referred to as NI 43-101 for the Fenn–Gib Project (Fenn–Gib or the Project) located in Ontario, Canada.
| 1.1 | Project Description, Location, and Ownership |
The Fenn–Gib Project is in Guibord and Munro Townships in northeast Ontario. The Project is 43 km northwest of Kirkland Lake and 21 km east of Matheson, south of Abitibi Lake. The property center is at UTM 17N 559078 5374037 (NAD 83) or 48°31’ N 80°12’ W. The Project is accessible year round by Highway 101, which passes through the Project. Highway 101 connects with the Trans-Canada Highway at Matheson. The nearest airport is 20 km north of Timmins, which itself is 80 km from the property. The Project is in a very mining-friendly jurisdiction amongst dozens of historical mines and several active mines between Rouyn and Timmins gold-mining camps.
Mayfair Gold owns a 100% interest in 21 fee simple patented properties, 145 unpatented mining claims, and six mining lease properties in the Guibord, Munro, Michaud, and McCool Townships in northeast Ontario, Canada (collectively, the Fenn–Gib Project) that cover 1,877.8 ha. Lake Shore Gold Corp (LSG) agreed to sell the Fenn–Gib Project to Mayfair Gold pursuant to an asset purchase agreement dated June 8, 2020. The Project is subject to a 1.0% net smelter royalty held by Metalla Royalty and Streaming Ltd. (Metalla).
| 1.2 | History |
From its initial discovery and work in 1911 the Fenn–Gib Property has been explored and developed by various operators, including Pangea Goldfields Incorporated, Lake Shore Gold Corp. (LSG), and Tahoe Resources Inc. (Tahoe).
In 2011, LSG completed a program of eight drill holes, three of which were twins used for verification purposes. In addition, SGS (2011) authored an NI 43-101 technical report and Mineral Resource estimate.
During 2012, exploration activities conducted on the Fenn–Gib Property in the southwest half of Lot 5 Concession VI consisted of LSG’s drilling contractors, Norex Drilling Ltd., completing 34 diamond drill holes (DDH) totalling 15,802 m. Reconnaissance mapping and prospecting were also carried out on both the North and South claim blocks during 2012.
During 2014, LSG carried out outcrop investigations and prospecting consisting of 14 samples.
During 2017, Tahoe conducted a surface-definition diamond drilling program on the Fenn–Gib Deposit, which included 98 holes for a total of 40,235 m. After 2017, Tahoe completed no further exploration activities or drilling at Fenn–Gib.
|
|
PAGE | 1-1 October 10, 2025 |
| MAYFAIR GOLD CORP.
|
| |
| National Instrument 43-101 Technical Report—Mineral Resource Estimate Update Fenn–Gib Project, Ontario, Canada |
| 1.3 | Mayfair Gold Exploration and Diamond Drilling |
The Company acquired a 100% interest in the Fenn–Gib Property on December 31, 2020, and in mid-January 2021 commenced infill and expansion resource drilling on the Fenn–Gib Deposit on the North Block. As of June 20, 2025, the Company has completed approximately 190,000 m in 339 drill holes.
Exploration conducted by Mayfair Gold since 2021 includes:
| • | SHA Geophysics Ltd. (SHA) carried out a Heli-GT helicopter-towed, three-axis magnetic gradiometer survey over the North and South property blocks in 2021 (Munroe, 2021). |
| • | Surface work on the North Block included an orientation soil and vegetation sample mobile-metal-ion (MMI) and soil-gas hydrocarbons (SGH) test sampling program during 2022 (Aurora Geosciences, 2023). |
| • | Aurora conducted a direct current (DC) resistivity-induced polarization (IP) survey for the Company on the North Block’s Grid A and Grid B of the Fenn–Gib Project in 2022 and 2023 (Jelenic, 2023). |
In 2022, a LiDAR survey and aerial photography acquisition over both the Fenn-Gib Project North and South Blocks was contracted to McElhanney (2022).
The Company commissioned three NI 43-101 Mineral Resource estimate updates on the Fenn–Gib Deposit (Kirkham et al., 2021; Mayfair Gold, 2022; Maunula, 2023).
| 1.4 | Geology and Mineralization |
Significant concentrations of gold mineralization on the Fenn–Gib Project primarily occur within two zones: 1) the Main Zone and 2) the Deformation Zone. These two zones overlap and are shown in Figure 1-1. The third zone, Footwall Zone, also contains gold mineralization and is approximately 100 m north of the Main Zone.
The Main Zone is a broad zone of disseminated gold mineralization up to 500 m wide, with grades for gold between 0.50 and 3.00 g/t Au. Massive, pillowed, and variolitic basalts crop out and can be seen in diamond drill core from holes collared near Highway 101. Hydrothermally altered variolitic basalts are the principal hosts of the Main Zone mineralization. These basalts were affected by pervasive and vein silicification, carbonatization, albitization, pervasive but weak hematization, and vein sericitization. Syenite and lamprophyre dykes intruded the basalts and are locally mineralized. Pyrite is the main sulphide mineral and occurs as disseminations and in veins, locally up to 50%, over narrow intervals (average 5% to 10%).
|
|
PAGE | 1-2 October 10, 2025 |
| MAYFAIR GOLD CORP.
|
| |
| National Instrument 43-101 Technical Report—Mineral Resource Estimate Update Fenn–Gib Project, Ontario, Canada |
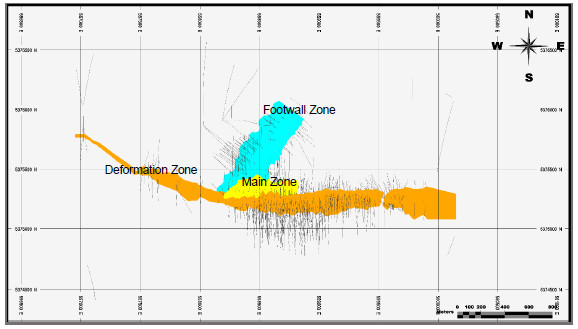
Source: Maunula (2024)
| Figure | 1-1: Plan View of Mineralized Envelopes |
The Deformation Zone contains narrower and higher-grade intersections associated with altered sediments, intermediate dykes, and grey syenite. Gold mineralization is associated with pyrite either in quartz-healed breccias or as very fine disseminations. The Contact Fault has been interpreted to have acted as a channel for gold-bearing hydrothermal fluids and is host to the Deformation Zone and the southern boundary of the Main Zone. The Deformation Zone mineralization has been defined for approximately 2.0 km along strike.
The Footwall Zone is north of the Main Zone (Figure 1-1). The Footwall Zone structural and mineralized corridor strikes in a north-easterly direction and drilling has intercepted the zone over a strike length of approximately 500 m to a vertical depth of about 600 m below surface (open in all directions). The Footwall Zone consists of multiple mineralized zones hosted primarily in the footwall mafic volcanic assemblage, with a steep northerly dip. Mineralization consists of bleached, buff-altered (silica-albite-sericite-carbonate alteration), pillowed mafic volcanic with pyrite ranging from 2% to over 20%.
| 1.5 | Metallurgical Testing and Mineral Processing |
Metallurgical testing of Fenn-Gib composite samples over a range in head grade from 0.2 to 19.1 g/t Au and 0.3 to 8.1% S2- resulted in the development of a hybrid process approach, which is applicable to all associated deposit lithologies and rock types.
|
|
PAGE | 1-3 October 10, 2025 |
| MAYFAIR GOLD CORP.
|
| |
| National Instrument 43-101 Technical Report—Mineral Resource Estimate Update Fenn–Gib Project, Ontario, Canada |
Treatment of Fenn-Gib mineralization considers a P80 106 µm flotation feed size with an approximate 23% mass pull to a rougher concentrate. Subsequent regrinding of the concentrate to P80 10 to 13 µm is followed by cyanidation yielding an estimated overall 89.6% Au extraction at a 1.5 g/t Au feed grade.
Direct cyanidation of Fenn-Gib mineralization was evaluated and established as not applicable due to losses in Au recovery with increased sulphide content at coarser material grind sizes, relative to secondary processing of a lower weight percentage reground flotation concentrate.
Metallurgical testwork and associated process criteria defined to date is representative and supports the associated Mineral Resource Estimate and is complete to support a Pre-Feasibility study. Future testwork will focus on specific parameters required for process design and advanced engineering, along with additional variability testwork to improve technical confidence and statistical accuracy of gold recovery estimates.
| 1.6 | Mineral Resource Estimate |
Mr. Tim Maunula, P.Geo., Principal Geologist, of T. Maunula & Associates Consulting Inc. (TMAC), is the QP responsible for completing the Project’s Mineral Resources estimate.
The Mineral Resource estimate incorporates extensive drill hole data from surface diamond drill programs combining both historical drilling completed prior to 2017 and Mayfair Gold’s drilling campaigns completed from 2021–2024. The cut-off date for assay data used in the 2024 Mineral Resource estimate was April 30, 2024. All data received were in NAD 83 UTM coordinates (Zone 17).
The Mineral Resource estimate was:
| • | Prepared using Hexagon Mining, HxGN MinePlan 16.2.1 (MinePlan) |
| • | Classified according to the CIM Definition Standards |
| • | Reported at a 0.3 g/t Au cut-off grade, which is amenable to open pit extraction. |
The Mineral Resource estimate for the Project is based on diamond drill hole data consisting of gold assays, geological descriptions, and density measurements.
The drill-hole database for the Mineral Resource estimate used 457 historical drill holes (140,283 m) and 291 Mayfair Gold drill holes, which together yielded 217,334 assays used in the Mineral Resource estimate.
The primary gold mineralization for the Project was modelled in three domains: Main Zone, Deformation Zone, and Footwall Zone (which included a Footwall Zone High Grade). However, gold mineralization is also contained within the other contiguous geological domains: mafic volcanics, pyroxenite, ultramafic volcanics, and sediments (Section 14.3). Mayfair Gold modelled the rock type groups using Datamine Studio EM (Datamine). TMAC reviewed and validated these wireframes for use in the Mineral Resource estimate. Gold grades were estimated separately by rock type within each domain.
|
|
PAGE | 1-4 October 10, 2025 |
| MAYFAIR GOLD CORP.
|
| |
| National Instrument 43-101 Technical Report—Mineral Resource Estimate Update Fenn–Gib Project, Ontario, Canada |
The Fenn–Gib block model was estimated using three interpolation methods: nearest neighbour (NN), inverse distance weighting squared (IDW2), and ordinary kriging (OK). Uncapped and capped gold grades were estimated for the OK model. Only capped gold grades were estimated for the NN and IDW2 models.
The Fenn-Gib Project hosts Mineral Resources at a 0.3 g/t Au cut-off grade comprised of an Indicated Resource of 181.3 Mt grading 0.74 g/t Au for 4.3 million contained gold ounces plus an additional Inferred Resource of 8.9 Mt at 0.49 g/t Au containing 141,000 gold ounces. Table 1-1 presents the Mineral Resource estimate reported within a constraining resource pit shell and categorized by resource classification. The Mineral resource estimate has an effective date of September 3, 2024, and was prepared by TMAC.
Table 1-1: Fenn–Gib Project Mineral Resource Estimate
| Resource Category |
Cut-Off |
Tonnes | Au (g/t) |
Au (oz) |
||||||||||
| Indicated |
0.3 | 181,302,000 | 0.74 | 4,313,000 | ||||||||||
| Inferred |
0.3 | 8,921,000 | 0.49 | 141,000 | ||||||||||
Source: Maunula (2024)
Notes:
| • | Effective date of this updated mineral resource estimate is September 3, 2024. The assay cut-off date for drill holes included in the mineral resource was April 30, 2024. |
| • | All mineral resources have been estimated in accordance with the CIM Definitions Standards, as required under National Instrument (NI) 43-101. Mineral Resource Statement prepared by Tim Maunula, P.Geo. (TMAC) in accordance with NI 43-101. |
| • | Mineral Resources reported demonstrate reasonable prospect of eventual economic extraction, as required under NI 43-101. Mineral Resources are not Mineral Reserves and do not have demonstrated economic viability. The Mineral Resources may be materially affected by environmental, permitting, legal, marketing, and other relevant issues. |
| • | Mineral Resources are reported at a cut-off grade of 0.30 g/t Au for an open-pit mining scenario using a 50° pit slope angle. Cut-off grades are based on a price of US$2,000/oz gold, and an open pit mining cost of $3.25/t, process cost of $15.50/t and G&A $2.00/t. Metallurgical recovery of 94% was used. Densities were assigned based on interpreted lithology. |
| • | Troy ounce = tonnes x grade / 31.10348. All numbers have been rounded to reflect the relative accuracy of the estimate. |
| • | The quantity and grade of reported Inferred Resources are uncertain in nature and there has not been sufficient work to define these Inferred Resources as Indicated or Measured Resources. It is reasonably expected that many of the Inferred Mineral Resources could be upgraded to Indicated Mineral Resources with continued exploration. |
| • | Tonnages and ounces in the tables are rounded to the nearest thousand. Numbers may not total due to rounding. |
| 1.7 | Recovery Methods |
This section is not applicable to this Technical Report.
| 1.8 | Conclusions and Recommendations |
The Fenn–Gib Project represents an advanced-stage-of-exploration project with a substantial gold resource base of over 4.3 million ounces of gold in the Indicated classification category. Based on the positive results to date, TMAC recommends advancing the project through targeted work programs designed to both grow and expand the current Mineral Resource and evaluate the economic potential of both the Fenn–Gib Project and the broader property area.
|
|
PAGE | 1-5 October 10, 2025 |
| MAYFAIR GOLD CORP.
|
| |
| National Instrument 43-101 Technical Report—Mineral Resource Estimate Update Fenn–Gib Project, Ontario, Canada |
The next phases of work are recommended to evaluate the economic potential of the Fenn–Gib Project are:
| • | Environmental studies and the continued collection of baseline environmental data to support the pre-development of the Project |
| • | Process engineering and design work to support a pre-feasibility study for the development of a 4,800 t/d operation. |
A summary of the proposed work program, including a budget estimate, is outlined in Table 1-2.
| Table1-2: | Recommended Work Programs and Cost Estimate |
| Activity |
Description |
Estimate Cost ($) |
||||
| Phase 1—Environmental Studies |
||||||
| Environmental studies including baseline data collection |
Advance work and studies to understand the site study area environmental baseline conditions to support a 4,800 t/d operation | 4,000,000 | ||||
|
|
|
|||||
| Phase 1 Total |
4,000,000 | |||||
|
|
|
|||||
| Phase 2—Engineering and Design |
||||||
| Engineering and design to advance an economic evaluation of the Project |
Advance the Project designs and engineering to complete a pre-feasibility study to define a 4,800 t/d operation | 6,000,000 | ||||
|
|
|
|||||
| Phase 2 Total |
6,000,000 | |||||
|
|
|
|||||
| Phases 1 and 2 Total |
10,000,000 | |||||
| 10.0% Contingency |
1,000,000 | |||||
|
|
|
|||||
| Grand Total |
11,000,000 | |||||
|
|
|
|||||
TMAC also recommends additional infill drilling to upgrade the Inferred Mineral Resources to Indicated Mineral Resources. This program may also allow for the upgrade of all portions of the deposit to Measured Mineral Resources. The mineralized zones encountered at the Fenn–Gib Deposit remain open at depth and along strike east and west, additional targeted expansion drilling is therefore warranted.
A Pre-Feasibility study is currently underway to evaluate the economic potential of developing a 4,800 t/d operation, with completion expected in Q4 2025. Future drilling programs will be planned strategically to further expand and upgrade the resource base.
|
|
PAGE | 1-6 October 10, 2025 |
| MAYFAIR GOLD CORP.
|
| |
| National Instrument 43-101 Technical Report—Mineral Resource Estimate Update Fenn–Gib Project, Ontario, Canada |
| 2 | INTRODUCTION |
T. Maunula & Associates Consulting Inc. (TMAC) prepared this report, National Instrument 43-101 Technical Report—Mineral Resource Estimate Update: Fenn–Gib Project, Ontario, Canada (the Technical Report) for Mayfair Gold Corp. (Mayfair Gold or the Company) in accordance with the Canadian Securities Administrators’ National Instrument (NI) 43-101 and Form 43-101F1, collectively referred to as NI 43-101. The Mineral Resource estimate reported herein was prepared to conform to generally accepted Canadian Institute of Mining, Metallurgy and Petroleum’s (CIM) CIM Estimation of Mineral Resources and Mineral Reserves Best Practice Guidelines, published on November 29, 2019 (CIM, 2019).
This Technical Report supersedes all prior technical reports and Mineral Resource estimates prepared for the Project.
The address of the Company’s registered, and records office is Suite 700–1199 West Hastings Street, Vancouver, B.C., Canada, V6E 3T5. The Company’s principal place of business is 489 MacDougall Street, Matheson, ON, Canada, P0K 1N0. The principal business of the Company is to acquire, explore, evaluate, and develop mineral properties.
| 2.1 | Sources of Information |
This Technical Report is based, in part, on internal Company technical reports and maps, published government reports, company letters and memoranda, and public information listed in Section 27. Several sections from reports authored by other consultants have been directly quoted or summarized in this Technical Report.
Mayfair Gold has reviewed a draft copy of this Technical Report for factual errors regarding the Company, history of the property, and the current Mineral Resource (which TMAC prepared).
TMAC has relied on Mayfair Gold’s historical and current knowledge of the Fenn–Gib Project (the Project) and work performed thereon. Any statements made and opinions expressed in this document are made in good faith, and in the belief that such statements and opinions are not false and misleading at the date of this Technical Report.
| 2.2 | Qualifications and Responsibilities |
The Qualified Persons (QP) preparing this Technical Report are specialists in the fields of geology, exploration, Mineral Resource estimation, or metallurgy.
None of the QPs or any associates employed in preparing this Technical Report have any beneficial interest in Mayfair Gold, nor are they insiders, associates, or affiliates of Mayfair Gold. The results of this report are not dependent upon any prior agreements concerning the conclusions to be reached, nor are there any undisclosed understandings concerning any future business dealings between Mayfair Gold and the QPs. The QPs are being paid a fee for their work in accordance with normal professional consulting practice.
|
|
PAGE | 2-1 October 10, 2025 |
| MAYFAIR GOLD CORP.
|
| |
| National Instrument 43-101 Technical Report—Mineral Resource Estimate Update Fenn–Gib Project, Ontario, Canada |
The QPs are, by virtue of their education, experience, and professional association, considered QPs as defined in the NI 43-101, and are members in good standing of appropriate professional institutions and associations. Their report responsibilities are given in Table 2-1.
Table 2-1: QP Responsibilities
| Qualified Persons |
Company |
QP Responsibility/Role |
Report Section(s) | |||
| Tim Maunula, P.Geo. | T. Maunula & Associates Consulting Inc. | Geology, QA/QC, Data Verification, Drilling, MRE | All of 3 to 12, 14 to 16, 18 to 24 and portions of 1, 2, 25, 26, and 27. | |||
| Steven Haggarty, P.Eng. | Haggarty Technical Services Corporation | Metallurgy | All of 13 and 17; and portions of 1, 2, 25, 26, and 27. | |||
Source: TMAC (2025)
Note: QA/QC = Quality Assurance/Quality Control; MRE = Mineral Resource estimate.
| 2.3 | Site Visit |
In accordance with NI 43-101 guidelines, the most recent site visit, between April 15 and 17, 2024, is summarized in Table 2-2. Mr. Maunula made a prior site visit from February 6 to 7, 2023. Mr. Haggarty has not visited the Project site and has relied on observations made during Mr. Maunula’s visit.
Table 2-2: QP Site Visit
| Qualified Person |
Company |
Date |
Description of Inspection | |||
| Tim Maunula, P.Geo. | T. Maunula & Associates Consulting Inc. | April 15–17, 2024 | The site visit included an inspection of the property, diamond drilling, core storage, and sampling and logging facilities in Matheson. | |||
Source: TMAC (2025)
| 2.4 | Units, Currency, and Rounding |
The units of measure used in this report are those of the International System of Units (SI) (or metric), except for units commonly used in industry (e.g., troy ounces [oz] and pounds [lb] for the mass of precious and base metals).
All dollar figures are quoted in this report in Canadian dollars ($) unless otherwise noted.
Frequently used abbreviations and acronyms are included below the table of contents. This report includes technical information that required subsequent calculations to derive subtotals, totals, and weighted averages. Such calculations inherently involve a degree of rounding and consequently introduce a margin of error. Where these occur, the QPs do not consider them to be material.
|
|
PAGE | 2-2 October 10, 2025 |
| MAYFAIR GOLD CORP.
|
| |
| National Instrument 43-101 Technical Report—Mineral Resource Estimate Update Fenn–Gib Project, Ontario, Canada |
| 3 | RELIANCE ON OTHER EXPERTS |
The QPs’ opinions contained in this Technical Report are based on information Mayfair and others provided throughout the course of the study. The QPs have taken reasonable measures to confirm information provided by others.
The QPs used their experience to determine if the information from previous reports was suitable for inclusion in this Technical Report, and adjusted information that required amending.
The QPs have not verified the legal status, legal title to any permit, or the legality of any underlying agreements for the subject properties regarding mineral rights, surface rights, permitting, and environmental issues in sections of this technical report. The QPs have relied upon information provided by Mayfair Gold personnel which forms the basis for Section 4 of this report.
|
|
PAGE | 3-1 October 10, 2025 |
| MAYFAIR GOLD CORP.
|
| |
| National Instrument 43-101 Technical Report—Mineral Resource Estimate Update Fenn–Gib Project, Ontario, Canada |
| 4 | PROPERTY DESCRIPTION AND LOCATION |
| 4.1 | Location |
The Fenn–Gib Project is in Guibord and Munro Townships in northeast Ontario. The Project lies 43 km northwest of Kirkland Lake and 21 km east of Matheson, south of Abitibi Lake. The property center is at UTM 17N 559078 5374037 (NAD 83) or 48°31’ N 80°12’ W. The Project is accessible year-round by Highway 101, which passes directly through the Project. Highway 101 connects with the Trans-Canada Highway at Matheson (Figure 4-1). The nearest airport is 20 km north of Timmins, which itself is 80 km from the property. The Project is in a very mining-friendly jurisdiction amongst dozens of historical mines and several active mines between Rouyn and Timmins gold-mining camps.
| 4.2 | Project Ownership |
Mayfair Gold owns a 100% interest in 21 fee simple patented properties, 145 unpatented mining claims, and 6 mining lease properties in the Guibord, Munro, Michaud, and McCool Townships in northeast Ontario, Canada (collectively, the Fenn–Gib Project) that cover 1,877.8 ha (Figure 4-2). Lake Shore Gold Corp (LSG) agreed to sell the Fenn–Gib Project to Mayfair Gold pursuant to an asset purchase agreement dated June 8, 2020.
| 4.3 | Mineral Tenure |
The QP’s review of permits and agreements summarized in this section (Table 4-1 to Table 4-3) between third parties is based on information provided by Mayfair Gold and their third-party expert’s report of the land tenure completed on Mining Lands Administration System (MLAS) in June 2024 (Poehlman, 2024). An independent verification of land title was not conducted. Mayfair Gold has confirmed that there are no known litigations potentially affecting the Fenn-Gib Project.
The QPs did not independently verify the legality of any underlying agreement that may exist concerning the licences or other agreement between third parties have instead relied on information provided by Mayfair Gold.
|
|
PAGE | 4-1 October 10, 2025 |
| MAYFAIR GOLD CORP.
|
| |
| National Instrument 43-101 Technical Report—Mineral Resource Estimate Update Fenn–Gib Project, Ontario, Canada |
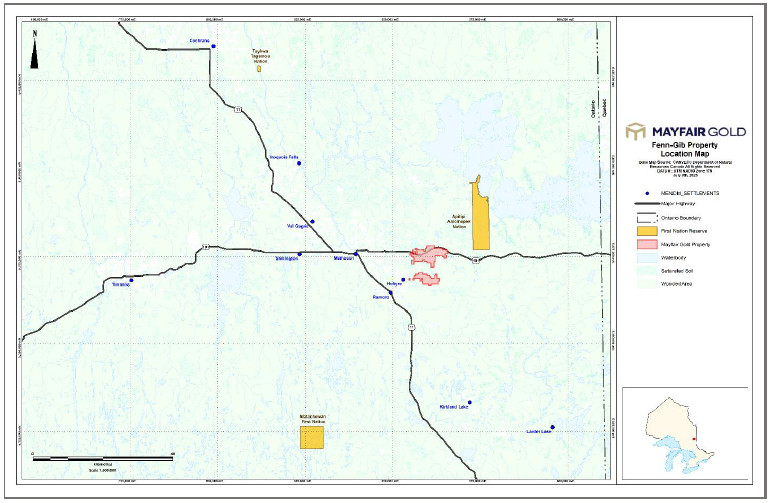
Source: Mayfair (2025)
Figure 4-1: Fenn–Gib Project Location
|
|
PAGE | 4-2 October 10, 2025 |
| MAYFAIR GOLD CORP.
|
| |
| National Instrument 43-101 Technical Report—Mineral Resource Estimate Update Fenn–Gib Project, Ontario, Canada |
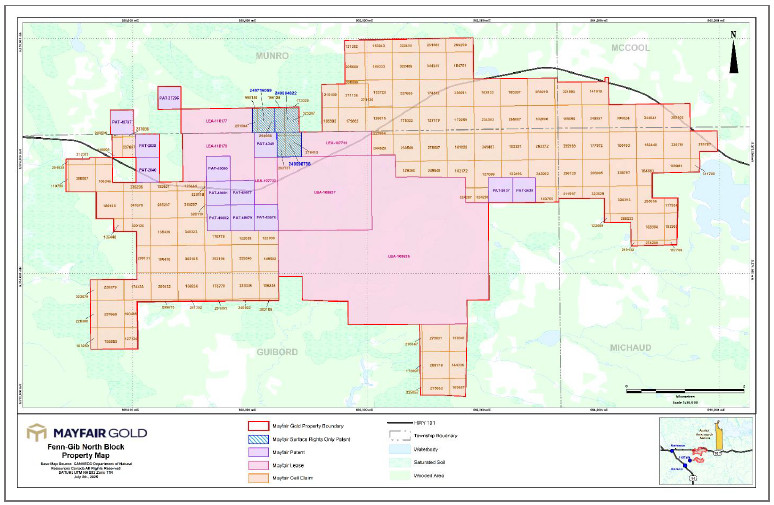
Source: Mayfair (2025)
Figure 4-2: Property Summarizing Mineral Tenure and Surface Rights (North Block)
|
|
PAGE | 4-3 October 10, 2025 |
| MAYFAIR GOLD CORP.
|
| |
| National Instrument 43-101 Technical Report—Mineral Resource Estimate Update Fenn–Gib Project, Ontario, Canada |
Table 4-1: Summary of Staked Claims
| Legacy Claim No. |
Township or Area |
Tenure ID |
Anniversary Date |
Recorded |
Work |
Royalty |
Royalty % and Basis | |||||||||
| 1200195 |
GUIBORD | 106345 | 2027-10-20 | Mayfair 100% | 200 | Stanley G. Hawkins | 2% NSR | |||||||||
| 1200195 |
GUIBORD | 341670 | 2027-04-23 | Mayfair 100% | 400 | Stanley G. Hawkins | 2% NSR | |||||||||
| 1200195 |
GUIBORD | 340323 | 2027-04-23 | Mayfair 100% | 400 | Stanley G. Hawkins | 2% NSR | |||||||||
| 1200195 |
GUIBORD | 320120 | 2027-04-23 | Mayfair 100% | 200 | Stanley G. Hawkins | 2% NSR | |||||||||
| 1200195 |
GUIBORD | 320119 | 2027-04-23 | Mayfair 100% | 200 | Stanley G. Hawkins | 2% NSR | |||||||||
| 1200195 |
GUIBORD | 320118 | 2027-04-23 | Mayfair 100% | 200 | Stanley G. Hawkins | 2% NSR | |||||||||
| 1200195 |
GUIBORD | 254207 | 2027-04-23 | Mayfair 100% | 400 | Stanley G. Hawkins | 2% NSR | |||||||||
| 1200195 |
GUIBORD | 235237 | 2027-04-23 | Mayfair 100% | 400 | Stanley G. Hawkins | 2% NSR | |||||||||
| 1200195 |
GUIBORD | 235236 | 2027-04-23 | Mayfair 100% | 200 | Stanley G. Hawkins | 2% NSR | |||||||||
| 1200195 |
GUIBORD | 199631 | 2027-04-23 | Mayfair 100% | 200 | Stanley G. Hawkins | 2% NSR | |||||||||
| 1200195 |
GUIBORD | 180138 | 2027-04-23 | Mayfair 100% | 200 | Stanley G. Hawkins | 2% NSR | |||||||||
| 1200195 |
GUIBORD | 178778 | 2027-04-23 | Mayfair 100% | 200 | Stanley G. Hawkins | 2% NSR | |||||||||
| 1200195 |
GUIBORD | 135440 | 2027-04-23 | Mayfair 100% | 200 | Stanley G. Hawkins | 2% NSR | |||||||||
| 1200195 |
GUIBORD | 135439 | 2027-04-23 | Mayfair 100% | 400 | Stanley G. Hawkins | 2% NSR | |||||||||
| 1200195 |
GUIBORD | 123444 | 2027-04-23 | Mayfair 100% | 200 | Stanley G. Hawkins | 2% NSR | |||||||||
| 1200196 |
GUIBORD | 106836 | 2027-04-23 | Mayfair 100% | 400 | Stanley G. Hawkins | 2% NSR | |||||||||
| 1200196 |
GUIBORD | 340323 | 2027-04-23 | Mayfair 100% | 400 | Stanley G. Hawkins | 2% NSR | |||||||||
| 1200196 |
GUIBORD | 320120 | 2027-04-23 | Mayfair 100% | 200 | Stanley G. Hawkins | 2% NSR | |||||||||
| 1200196 |
GUIBORD | 302105 | 2027-04-23 | Mayfair 100% | 400 | Stanley G. Hawkins | 2% NSR | |||||||||
| 1200196 |
GUIBORD | 299673 | 2027-04-23 | Mayfair 100% | 200 | Stanley G. Hawkins | 2% NSR | |||||||||
| 1200196 |
GUIBORD | 281352 | 2027-04-23 | Mayfair 100% | 200 | Stanley G. Hawkins | 2% NSR | |||||||||
| 1200196 |
GUIBORD | 280132 | 2027-04-23 | Mayfair 100% | 400 | Stanley G. Hawkins | 2% NSR | |||||||||
| 1200196 |
GUIBORD | 280131 | 2027-04-23 | Mayfair 100% | 200 | Stanley G. Hawkins | 2% NSR | |||||||||
| 1200196 |
GUIBORD | 196478 | 2027-04-23 | Mayfair 100% | 400 | Stanley G. Hawkins | 2% NSR | |||||||||
| 1200196 |
GUIBORD | 190465 | 2027-04-23 | Mayfair 100% | 200 | Stanley G. Hawkins | 2% NSR | |||||||||
| 1200196 |
GUIBORD | 174433 | 2027-04-23 | Mayfair 100% | 200 | Stanley G. Hawkins | 2% NSR | |||||||||
| 1200196 |
GUIBORD | 135439 | 2027-04-23 | Mayfair 100% | 400 | Stanley G. Hawkins | 2% NSR | |||||||||
| 1200197 |
GUIBORD | 106835 | 2027-04-23 | Mayfair 100% | 200 | Stanley G. Hawkins | 2% NSR | |||||||||
| 1200197 |
GUIBORD | 340323 | 2027-04-23 | Mayfair 100% | 400 | Stanley G. Hawkins | 2% NSR | |||||||||
| 1200197 |
GUIBORD | 302106 | 2027-04-23 | Mayfair 100% | 200 | Stanley G. Hawkins | 2% NSR | |||||||||
| 1200197 |
GUIBORD | 302105 | 2027-04-23 | Mayfair 100% | 400 | Stanley G. Hawkins | 2% NSR | |||||||||
|
|
PAGE | 4-4 October 10, 2025 |
| MAYFAIR GOLD CORP.
|
| |
| National Instrument 43-101 Technical Report—Mineral Resource Estimate Update Fenn–Gib Project, Ontario, Canada |
| Legacy Claim No. |
Township or Area |
Tenure ID |
Anniversary Date |
Recorded |
Work |
Royalty |
Royalty % and Basis | |||||||||
| 1200197 |
GUIBORD | 302104 | 2027-04-23 | Mayfair 100% | 400 | Stanley G. Hawkins | 2% NSR | |||||||||
| 1200197 |
GUIBORD | 281352 | 2027-04-23 | Mayfair 100% | 200 | Stanley G. Hawkins | 2% NSR | |||||||||
| 1200197 |
GUIBORD | 281351 | 2027-04-23 | Mayfair 100% | 200 | Stanley G. Hawkins | 2% NSR | |||||||||
| 1200197 |
GUIBORD | 246022 | 2027-04-23 | Mayfair 100% | 200 | Stanley G. Hawkins | 2% NSR | |||||||||
| 1200197 |
GUIBORD | 233345 | 2027-04-23 | Mayfair 100% | 400 | Stanley G. Hawkins | 2% NSR | |||||||||
| 1200197 |
GUIBORD | 225340 | 2027-04-23 | Mayfair 100% | 400 | Stanley G. Hawkins | 2% NSR | |||||||||
| 1200197 |
GUIBORD | 178779 | 2027-04-23 | Mayfair 100% | 400 | Stanley G. Hawkins | 2% NSR | |||||||||
| 1200197 |
GUIBORD | 178778 | 2027-04-23 | Mayfair 100% | 200 | Stanley G. Hawkins | 2% NSR | |||||||||
| 1200197 |
GUIBORD | 149502 | 2027-04-23 | Mayfair 100% | 200 | Stanley G. Hawkins | 2% NSR | |||||||||
| 1200197 |
GUIBORD | 122039 | 2027-04-23 | Mayfair 100% | 200 | Stanley G. Hawkins | 2% NSR | |||||||||
| 1200197 |
GUIBORD | 122038 | 2027-04-23 | Mayfair 100% | 200 | Stanley G. Hawkins | 2% NSR | |||||||||
| 1200197 |
GUIBORD | 106836 | 2027-04-23 | Mayfair 100% | 400 | Stanley G. Hawkins | 2% NSR | |||||||||
| 1200198 |
GUIBORD | 103250 | 2027-04-23 | Mayfair 100% | 200 | Stanley G. Hawkins | 2% NSR | |||||||||
| 1200198 |
GUIBORD | 323679 | 2027-04-23 | Mayfair 100% | 200 | Stanley G. Hawkins | 2% NSR | |||||||||
| 1200198 |
GUIBORD | 287668 | 2027-04-23 | Mayfair 100% | 400 | Stanley G. Hawkins | 2% NSR | |||||||||
| 1200198 |
GUIBORD | 228380 | 2027-04-23 | Mayfair 100% | 200 | Stanley G. Hawkins | 2% NSR | |||||||||
| 1200198 |
GUIBORD | 228379 | 2027-04-23 | Mayfair 100% | 200 | Stanley G. Hawkins | 2% NSR | |||||||||
| 1200198 |
GUIBORD | 190465 | 2027-04-23 | Mayfair 100% | 200 | Stanley G. Hawkins | 2% NSR | |||||||||
| 1200198 |
GUIBORD | 174433 | 2027-04-23 | Mayfair 100% | 200 | Stanley G. Hawkins | 2% NSR | |||||||||
| 1200198 |
GUIBORD | 155055 | 2027-04-23 | Mayfair 100% | 200 | Stanley G. Hawkins | 2% NSR | |||||||||
| 1200198 |
GUIBORD | 127124 | 2027-04-23 | Mayfair 100% | 200 | Stanley G. Hawkins | 2% NSR | |||||||||
| 4258499 |
GUIBORD | 230569 | 2027-07-07 | Mayfair 100% | 200 | None | — | |||||||||
| 4258499 |
GUIBORD | 344528 | 2027-07-07 | Mayfair 100% | 200 | None | — | |||||||||
| 4258499 |
GUIBORD, MUNRO | 227696 | 2027-07-07 | Mayfair 100% | 200 | None | — | |||||||||
| 4258499 |
GUIBORD, MUNRO | 171033 | 2027-07-07 | Mayfair 100% | 400 | None | — | |||||||||
| 4258968 |
GUIBORD | 106345 | 2027-10-20 | Mayfair 100% | 200 | None | — | |||||||||
| 4258968 |
GUIBORD | 312371 | 2027-10-20 | Mayfair 100% | 200 | None | — | |||||||||
| 4258968 |
GUIBORD | 305057 | 2027-10-20 | Mayfair 100% | 200 | None | — | |||||||||
| 4258968 |
GUIBORD | 291635 | 2027-10-20 | Mayfair 100% | 200 | None | — | |||||||||
| 4258968 |
GUIBORD | 110758 | 2027-10-20 | Mayfair 100% | 200 | None | — | |||||||||
| 4258968 |
GUIBORD | 110605 | 2027-10-20 | Mayfair 100% | 200 | None | — | |||||||||
| 4272132 |
GUIBORD | 110605 | 2027-10-20 | Mayfair 100% | 200 | None | — | |||||||||
|
|
PAGE | 4-5 October 10, 2025 |
| MAYFAIR GOLD CORP.
|
| |
| National Instrument 43-101 Technical Report—Mineral Resource Estimate Update Fenn–Gib Project, Ontario, Canada |
| Legacy Claim No. |
Township or Area |
Tenure ID |
Anniversary Date |
Recorded |
Work |
Royalty |
Royalty % and Basis | |||||||||
| 4272132 |
GUIBORD | 237687 | 2027-06-21 | Mayfair 100% | 200 | None | — | |||||||||
| 4272132 |
GUIBORD, MUNRO | 237686 | 2027-06-21 | Mayfair 100% | 200 | None | — | |||||||||
| 4272132 |
GUIBORD, MUNRO | 208539 | 2027-06-21 | Mayfair 100% | 200 | None | — | |||||||||
| 737677 |
GUIBORD | 161029 | 2028-01-18 | Mayfair 100% | 400 | Meunier; 2329113 Ont Inc | — | |||||||||
| 737677 |
GUIBORD | 278587 | 2028-01-18 | Mayfair 100% | 400 | Meunier; 2329113 Ont Inc | — | |||||||||
| 737677 |
GUIBORD, MUNRO | 172259 | 2028-01-18 | Mayfair 100% | 400 | Meunier; 2329113 Ont Inc | — | |||||||||
| 737677 |
GUIBORD, MUNRO | 127179 | 2028-01-18 | Mayfair 100% | 400 | Meunier; 2329113 Ont Inc | — | |||||||||
| 737678 |
GUIBORD | 102172 | 2028-01-18 | Mayfair 100% | 200 | Meunier; 2329113 Ont Inc | — | |||||||||
| 737678 |
GUIBORD | 278587 | 2028-01-18 | Mayfair 100% | 400 | Meunier; 2329113 Ont Inc | — | |||||||||
| 737678 |
GUIBORD | 249548 | 2028-01-18 | Mayfair 100% | 200 | Meunier; 2329113 Ont Inc | — | |||||||||
| 737678 |
GUIBORD | 161029 | 2028-01-18 | Mayfair 100% | 400 | Meunier; 2329113 Ont Inc | — | |||||||||
| 737679 |
GUIBORD | 129350 | 2028-01-18 | Mayfair 100% | 200 | Meunier; 2329113 Ont Inc | — | |||||||||
| 737679 |
GUIBORD | 278587 | 2028-01-18 | Mayfair 100% | 400 | Meunier; 2329113 Ont Inc | — | |||||||||
| 737679 |
GUIBORD | 249548 | 2028-01-18 | Mayfair 100% | 200 | Meunier; 2329113 Ont Inc | — | |||||||||
| 737679 |
GUIBORD | 230569 | 2028-07-07 | Mayfair 100% | 200 | Meunier; 2329113 Ont Inc | — | |||||||||
| 737680 |
GUIBORD | 230569 | 2028-07-07 | Mayfair 100% | 200 | Meunier; 2329113 Ont Inc | 2.5% NSR (2.25% Meunier and 0.25% 2329113 Ontario Inc.) | |||||||||
| 737680 |
GUIBORD | 278587 | 2028-01-18 | Mayfair 100% | 400 | Meunier; 2329113 Ont Inc | 2.5% NSR (2.25% Meunier and 0.25% 2329113 Ontario Inc.) | |||||||||
| 737680 |
GUIBORD, MUNRO | 171033 | 2027-07-07 | Mayfair 100% | 400 | Meunier; 2329113 Ont Inc | 2.5% NSR (2.25% Meunier and 0.25% 2329113 Ontario Inc.) | |||||||||
| 737680 |
GUIBORD, MUNRO | 127179 | 2028-01-18 | Mayfair 100% | 400 | Meunier; 2329113 Ont Inc | 2.5% NSR (2.25% Meunier and 0.25% 2329113 Ontario Inc.) | |||||||||
| 758895 |
GUIBORD | 292372 | 2028-01-18 | Mayfair 100% | 400 | Meunier; 2329113 Ont Inc | 2.5% NSR (2.25% Meunier and 0.25% 2329113 Ontario Inc.) | |||||||||
| 758895 |
GUIBORD, MCCOOL, MICHAUD, MUNRO | 169590 | 2028-01-18 | Mayfair 100% | 400 | Meunier; 2329113 Ont Inc | 2.5% NSR (2.25% Meunier and 0.25% 2329113 Ontario Inc.) | |||||||||
| 758895 |
GUIBORD, MICHAUD | 295969 | 2028-01-18 | Mayfair 100% | 400 | Meunier; 2329113 Ont Inc | 2.5% NSR (2.25% Meunier and 0.25% 2329113 Ontario Inc.) | |||||||||
| 758895 |
GUIBORD, MUNRO | 102606 | 2028-01-18 | Mayfair 100% | 400 | Meunier; 2329113 Ont Inc | 2.5% NSR (2.25% Meunier and 0.25% 2329113 Ontario Inc.) | |||||||||
| 758896 |
GUIBORD | 292372 | 2028-01-18 | Mayfair 100% | 400 | Meunier; 2329113 Ont Inc | 2.5% NSR (2.25% Meunier and 0.25% 2329113 Ontario Inc.) | |||||||||
| 758896 |
GUIBORD | 343062 | 2028-01-18 | Mayfair 100% | 200 | Meunier; 2329113 Ont Inc | 2.5% NSR (2.25% Meunier and 0.25% 2329113 Ontario Inc.) | |||||||||
| 758896 |
GUIBORD, MICHAUD | 296129 | 2028-01-18 | Mayfair 100% | 400 | Meunier; 2329113 Ont Inc | 2.5% NSR (2.25% Meunier and 0.25% 2329113 Ontario Inc.) | |||||||||
| 758896 |
GUIBORD, MICHAUD | 295969 | 2028-01-18 | Mayfair 100% | 400 | Meunier; 2329113 Ont Inc | 2.5% NSR (2.25% Meunier and 0.25% 2329113 Ontario Inc.) | |||||||||
| 758897 |
GUIBORD | 143705 | 2028-01-18 | Mayfair 100% | 200 | Meunier; 2329113 Ont Inc | 2.5% NSR (2.25% Meunier and 0.25% 2329113 Ontario Inc.) | |||||||||
| 758897 |
GUIBORD | 343062 | 2028-01-18 | Mayfair 100% | 200 | Meunier; 2329113 Ont Inc | 2.5% NSR (2.25% Meunier and 0.25% 2329113 Ontario Inc.) | |||||||||
| 758897 |
GUIBORD, MICHAUD | 296129 | 2028-01-18 | Mayfair 100% | 400 | Meunier; 2329113 Ont Inc | 2.5% NSR (2.25% Meunier and 0.25% 2329113 Ontario Inc.) | |||||||||
| 758897 |
GUIBORD, MICHAUD | 211597 | 2028-01-18 | Mayfair 100% | 200 | Meunier; 2329113 Ont Inc | 2.5% NSR (2.25% Meunier and 0.25% 2329113 Ontario Inc.) | |||||||||
| 758898 |
GUIBORD | 122493 | 2028-01-18 | Mayfair 100% | 200 | Meunier; 2329113 Ont Inc | 2.5% NSR (2.25% Meunier and 0.25% 2329113 Ontario Inc.) | |||||||||
|
|
PAGE | 4-6 October 10, 2025 |
| MAYFAIR GOLD CORP.
|
| |
| National Instrument 43-101 Technical Report—Mineral Resource Estimate Update Fenn–Gib Project, Ontario, Canada |
| Legacy Claim No. |
Township or Area |
Tenure ID |
Anniversary Date |
Recorded |
Work |
Royalty |
Royalty % and Basis | |||||||||
| 758898 |
GUIBORD | 343062 | 2028-01-18 | Mayfair 100% | 200 | Meunier; 2329113 Ont Inc | 2.5% NSR (2.25% Meunier and 0.25% 2329113 Ontario Inc.) | |||||||||
| 758898 |
GUIBORD | 292372 | 2028-01-18 | Mayfair 100% | 400 | Meunier; 2329113 Ont Inc | 2.5% NSR (2.25% Meunier and 0.25% 2329113 Ontario Inc.) | |||||||||
| 758898 |
GUIBORD | 182387 | 2028-01-18 | Mayfair 100% | 400 | Meunier; 2329113 Ont Inc | 2.5% NSR (2.25% Meunier and 0.25% 2329113 Ontario Inc.) | |||||||||
| 758899 |
GUIBORD | 182387 | 2028-01-18 | Mayfair 100% | 400 | Meunier; 2329113 Ont Inc | 2.5% NSR (2.25% Meunier and 0.25% 2329113 Ontario Inc.) | |||||||||
| 758899 |
GUIBORD | 292372 | 2028-01-18 | Mayfair 100% | 400 | Meunier; 2329113 Ont Inc | 2.5% NSR (2.25% Meunier and 0.25% 2329113 Ontario Inc.) | |||||||||
| 758899 |
GUIBORD, MUNRO | 265007 | 2028-01-18 | Mayfair 100% | 400 | Meunier; 2329113 Ont Inc | 2.5% NSR (2.25% Meunier and 0.25% 2329113 Ontario Inc.) | |||||||||
| 758899 |
GUIBORD, MUNRO | 102606 | 2028-01-18 | Mayfair 100% | 400 | Meunier; 2329113 Ont Inc | 2.5% NSR (2.25% Meunier and 0.25% 2329113 Ontario Inc.) | |||||||||
| 758900 |
MCCOOL, MUNRO | 321590 | 2028-01-18 | Mayfair 100% | 200 | Meunier; 2329113 Ont Inc | 2.5% NSR (2.25% Meunier and 0.25% 2329113 Ontario Inc.) | |||||||||
| 758901 |
GUIBORD, MCCOOL, MICHAUD, MUNRO | 169590 | 2028-01-18 | Mayfair 100% | 400 | Meunier; 2329113 Ont Inc | 2.5% NSR (2.25% Meunier and 0.25% 2329113 Ontario Inc.) | |||||||||
| 758901 |
MCCOOL, MUNRO | 321590 | 2028-01-18 | Mayfair 100% | 200 | Meunier; 2329113 Ont Inc | 2.5% NSR (2.25% Meunier and 0.25% 2329113 Ontario Inc.) | |||||||||
| 758902 |
GUIBORD, MCCOOL, MICHAUD, MUNRO | 169590 | 2028-01-18 | Mayfair 100% | 400 | Meunier; 2329113 Ont Inc | 2.5% NSR (2.25% Meunier and 0.25% 2329113 Ontario Inc.) | |||||||||
| 758902 |
MCCOOL | 141919 | 2028-01-18 | Mayfair 100% | 200 | Meunier; 2329113 Ont Inc | 2.5% NSR (2.25% Meunier and 0.25% 2329113 Ontario Inc.) | |||||||||
| 758902 |
MCCOOL, MICHAUD | 340957 | 2028-01-18 | Mayfair 100% | 200 | Meunier; 2329113 Ont Inc | 2.5% NSR (2.25% Meunier and 0.25% 2329113 Ontario Inc.) | |||||||||
| 758902 |
MCCOOL, MUNRO | 321590 | 2028-01-18 | Mayfair 100% | 200 | Meunier; 2329113 Ont Inc | 2.5% NSR (2.25% Meunier and 0.25% 2329113 Ontario Inc.) | |||||||||
| 783656 |
MUNRO | 103522 | 2028-01-18 | Mayfair 100% | 200 | Meunier; 2329113 Ont Inc | 2.5% NSR (2.25% Meunier and 0.25% 2329113 Ontario Inc.) | |||||||||
| 783656 |
MUNRO | 185337 | 2028-01-18 | Mayfair 100% | 200 | Meunier; 2329113 Ont Inc | 2.5% NSR (2.25% Meunier and 0.25% 2329113 Ontario Inc.) | |||||||||
| 783657 |
GUIBORD, MUNRO | 234383 | 2028-01-18 | Mayfair 100% | 400 | Meunier; 2329113 Ont Inc | 2.5% NSR (2.25% Meunier and 0.25% 2329113 Ontario Inc.) | |||||||||
| 783657 |
GUIBORD, MUNRO | 265007 | 2028-01-18 | Mayfair 100% | 400 | Meunier; 2329113 Ont Inc | 2.5% NSR (2.25% Meunier and 0.25% 2329113 Ontario Inc.) | |||||||||
| 783657 |
MUNRO | 185337 | 2028-01-18 | Mayfair 100% | 200 | Meunier; 2329113 Ont Inc | 2.5% NSR (2.25% Meunier and 0.25% 2329113 Ontario Inc.) | |||||||||
| 783657 |
MUNRO | 103522 | 2028-01-18 | Mayfair 100% | 200 | Meunier; 2329113 Ont Inc | 2.5% NSR (2.25% Meunier and 0.25% 2329113 Ontario Inc.) | |||||||||
| 783658 |
GUIBORD, MUNRO | 172259 | 2028-01-18 | Mayfair 100% | 400 | Meunier; 2329113 Ont Inc | 2.5% NSR (2.25% Meunier and 0.25% 2329113 Ontario Inc.) | |||||||||
| 783658 |
GUIBORD, MUNRO | 234383 | 2028-01-18 | Mayfair 100% | 400 | Meunier; 2329113 Ont Inc | 2.5% NSR (2.25% Meunier and 0.25% 2329113 Ontario Inc.) | |||||||||
| 783658 |
MUNRO | 336091 | 2028-01-18 | Mayfair 100% | 200 | Meunier; 2329113 Ont Inc | 2.5% NSR (2.25% Meunier and 0.25% 2329113 Ontario Inc.) | |||||||||
| 783658 |
MUNRO | 103522 | 2028-01-18 | Mayfair 100% | 200 | Meunier; 2329113 Ont Inc | 2.5% NSR (2.25% Meunier and 0.25% 2329113 Ontario Inc.) | |||||||||
| 783659 |
MUNRO | 103522 | 2028-01-18 | Mayfair 100% | 200 | Meunier; 2329113 Ont Inc | 2.5% NSR (2.25% Meunier and 0.25% 2329113 Ontario Inc.) | |||||||||
| 783659 |
MUNRO | 336091 | 2028-01-18 | Mayfair 100% | 200 | Meunier; 2329113 Ont Inc | 2.5% NSR (2.25% Meunier and 0.25% 2329113 Ontario Inc.) | |||||||||
| 783660 |
MCCOOL, MICHAUD | 306824 | 2028-01-18 | Mayfair 100% | 200 | Meunier; 2329113 Ont Inc | 2.5% NSR (2.25% Meunier and 0.25% 2329113 Ontario Inc.) | |||||||||
| 783660 |
MCCOOL, MICHAUD | 344041 | 2028-01-18 | Mayfair 100% | 200 | Meunier; 2329113 Ont Inc | 2.5% NSR (2.25% Meunier and 0.25% 2329113 Ontario Inc.) | |||||||||
| 783660 |
MICHAUD | 182448 | 2028-01-18 | Mayfair 100% | 400 | Meunier; 2329113 Ont Inc | 2.5% NSR (2.25% Meunier and 0.25% 2329113 Ontario Inc.) | |||||||||
| 783660 |
MICHAUD | 165183 | 2028-01-18 | Mayfair 100% | 400 | Meunier; 2329113 Ont Inc | 2.5% NSR (2.25% Meunier and 0.25% 2329113 Ontario Inc.) | |||||||||
| 783661 |
MICHAUD | 164380 | 2028-01-18 | Mayfair 100% | 200 | Meunier; 2329113 Ont Inc | 2.5% NSR (2.25% Meunier and 0.25% 2329113 Ontario Inc.) | |||||||||
| 783661 |
MICHAUD | 338797 | 2028-01-18 | Mayfair 100% | 400 | Meunier; 2329113 Ont Inc | 2.5% NSR (2.25% Meunier and 0.25% 2329113 Ontario Inc.) | |||||||||
|
|
PAGE | 4-7 October 10, 2025 |
| MAYFAIR GOLD CORP.
|
| |
| National Instrument 43-101 Technical Report—Mineral Resource Estimate Update Fenn–Gib Project, Ontario, Canada |
| Legacy Claim No. |
Township or Area |
Tenure ID |
Anniversary Date |
Recorded |
Work |
Royalty |
Royalty % and Basis | |||||||||
| 783661 |
MICHAUD | 182448 | 2028-01-18 | Mayfair 100% | 400 | Meunier; 2329113 Ont Inc | 2.5% NSR (2.25% Meunier and 0.25% 2329113 Ontario Inc.) | |||||||||
| 783661 |
MICHAUD | 165183 | 2028-01-18 | Mayfair 100% | 400 | Meunier; 2329113 Ont Inc | 2.5% NSR (2.25% Meunier and 0.25% 2329113 Ontario Inc.) | |||||||||
| 783662 |
MICHAUD | 164380 | 2028-01-18 | Mayfair 100% | 200 | Meunier; 2329113 Ont Inc | 2.5% NSR (2.25% Meunier and 0.25% 2329113 Ontario Inc.) | |||||||||
| 783662 |
MICHAUD | 338797 | 2028-01-18 | Mayfair 100% | 400 | Meunier; 2329113 Ont Inc | 2.5% NSR (2.25% Meunier and 0.25% 2329113 Ontario Inc.) | |||||||||
| 783662 |
MICHAUD | 326393 | 2028-01-18 | Mayfair 100% | 400 | Meunier; 2329113 Ont Inc | 2.5% NSR (2.25% Meunier and 0.25% 2329113 Ontario Inc.) | |||||||||
| 783662 |
MICHAUD | 285056 | 2028-01-18 | Mayfair 100% | 200 | Meunier; 2329113 Ont Inc | 2.5% NSR (2.25% Meunier and 0.25% 2329113 Ontario Inc.) | |||||||||
| 783663 |
MICHAUD | 152984 | 2028-01-18 | Mayfair 100% | 400 | Meunier; 2329113 Ont Inc | 2.5% NSR (2.25% Meunier and 0.25% 2329113 Ontario Inc.) | |||||||||
| 783663 |
MICHAUD | 326393 | 2028-01-18 | Mayfair 100% | 400 | Meunier; 2329113 Ont Inc | 2.5% NSR (2.25% Meunier and 0.25% 2329113 Ontario Inc.) | |||||||||
| 783663 |
MICHAUD | 285056 | 2028-01-18 | Mayfair 100% | 200 | Meunier; 2329113 Ont Inc | 2.5% NSR (2.25% Meunier and 0.25% 2329113 Ontario Inc.) | |||||||||
| 783663 |
MICHAUD | 266322 | 2028-01-18 | Mayfair 100% | 200 | Meunier; 2329113 Ont Inc | 2.5% NSR (2.25% Meunier and 0.25% 2329113 Ontario Inc.) | |||||||||
| 783664 |
MICHAUD | 152984 | 2028-01-18 | Mayfair 100% | 400 | Meunier; 2329113 Ont Inc | 2.5% NSR (2.25% Meunier and 0.25% 2329113 Ontario Inc.) | |||||||||
| 783664 |
MICHAUD | 274289 | 2028-01-18 | Mayfair 100% | 200 | Meunier; 2329113 Ont Inc | 2.5% NSR (2.25% Meunier and 0.25% 2329113 Ontario Inc.) | |||||||||
| 783664 |
MICHAUD | 266322 | 2028-01-18 | Mayfair 100% | 200 | Meunier; 2329113 Ont Inc | 2.5% NSR (2.25% Meunier and 0.25% 2329113 Ontario Inc.) | |||||||||
| 783664 |
MICHAUD | 219132 | 2028-01-18 | Mayfair 100% | 200 | Meunier; 2329113 Ont Inc | 2.5% NSR (2.25% Meunier and 0.25% 2329113 Ontario Inc.) | |||||||||
| 783665 |
MICHAUD | 122689 | 2028-01-18 | Mayfair 100% | 200 | Meunier; 2329113 Ont Inc | 2.5% NSR (2.25% Meunier and 0.25% 2329113 Ontario Inc.) | |||||||||
| 783665 |
MICHAUD | 326393 | 2028-01-18 | Mayfair 100% | 400 | Meunier; 2329113 Ont Inc | 2.5% NSR (2.25% Meunier and 0.25% 2329113 Ontario Inc.) | |||||||||
| 783665 |
MICHAUD | 323029 | 2028-01-18 | Mayfair 100% | 200 | Meunier; 2329113 Ont Inc | 2.5% NSR (2.25% Meunier and 0.25% 2329113 Ontario Inc.) | |||||||||
| 783665 |
MICHAUD | 266322 | 2028-01-18 | Mayfair 100% | 200 | Meunier; 2329113 Ont Inc | 2.5% NSR (2.25% Meunier and 0.25% 2329113 Ontario Inc.) | |||||||||
| 783666 |
MICHAUD | 152983 | 2028-01-18 | Mayfair 100% | 200 | Meunier; 2329113 Ont Inc | 2.5% NSR (2.25% Meunier and 0.25% 2329113 Ontario Inc.) | |||||||||
| 783666 |
MICHAUD | 274289 | 2028-01-18 | Mayfair 100% | 200 | Meunier; 2329113 Ont Inc | 2.5% NSR (2.25% Meunier and 0.25% 2329113 Ontario Inc.) | |||||||||
| 783666 |
MICHAUD | 157789 | 2028-01-18 | Mayfair 100% | 200 | Meunier; 2329113 Ont Inc | 2.5% NSR (2.25% Meunier and 0.25% 2329113 Ontario Inc.) | |||||||||
| 783666 |
MICHAUD | 152984 | 2028-01-18 | Mayfair 100% | 400 | Meunier; 2329113 Ont Inc | 2.5% NSR (2.25% Meunier and 0.25% 2329113 Ontario Inc.) | |||||||||
| 783667 |
MICHAUD | 117934 | 2028-01-18 | Mayfair 100% | 200 | Meunier; 2329113 Ont Inc | 2.5% NSR (2.25% Meunier and 0.25% 2329113 Ontario Inc.) | |||||||||
| 783667 |
MICHAUD | 285056 | 2028-01-18 | Mayfair 100% | 200 | Meunier; 2329113 Ont Inc | 2.5% NSR (2.25% Meunier and 0.25% 2329113 Ontario Inc.) | |||||||||
| 783667 |
MICHAUD | 152984 | 2028-01-18 | Mayfair 100% | 400 | Meunier; 2329113 Ont Inc | 2.5% NSR (2.25% Meunier and 0.25% 2329113 Ontario Inc.) | |||||||||
| 783667 |
MICHAUD | 152983 | 2028-01-18 | Mayfair 100% | 200 | Meunier; 2329113 Ont Inc | 2.5% NSR (2.25% Meunier and 0.25% 2329113 Ontario Inc.) | |||||||||
| 783673 |
MCCOOL, MUNRO | 321590 | 2028-01-18 | Mayfair 100% | 200 | Meunier; 2329113 Ont Inc | 2.5% NSR (2.25% Meunier and 0.25% 2329113 Ontario Inc.) | |||||||||
| 783673 |
MUNRO | 289219 | 2028-01-18 | Mayfair 100% | 200 | Meunier; 2329113 Ont Inc | 2.5% NSR (2.25% Meunier and 0.25% 2329113 Ontario Inc.) | |||||||||
| 783674 |
GUIBORD, MCCOOL, MICHAUD, MUNRO | 169590 | 2028-01-18 | Mayfair 100% | 400 | Meunier; 2329113 Ont Inc | 2.5% NSR (2.25% Meunier and 0.25% 2329113 Ontario Inc.) | |||||||||
| 783674 |
GUIBORD, MUNRO | 102606 | 2028-01-18 | Mayfair 100% | 400 | Meunier; 2329113 Ont Inc | 2.5% NSR (2.25% Meunier and 0.25% 2329113 Ontario Inc.) | |||||||||
| 783674 |
MCCOOL, MUNRO | 321590 | 2028-01-18 | Mayfair 100% | 200 | Meunier; 2329113 Ont Inc | 2.5% NSR (2.25% Meunier and 0.25% 2329113 Ontario Inc.) | |||||||||
| 783674 |
MUNRO | 289219 | 2028-01-18 | Mayfair 100% | 200 | Meunier; 2329113 Ont Inc | 2.5% NSR (2.25% Meunier and 0.25% 2329113 Ontario Inc.) | |||||||||
|
|
PAGE | 4-8 October 10, 2025 |
| MAYFAIR GOLD CORP.
|
| |
| National Instrument 43-101 Technical Report—Mineral Resource Estimate Update Fenn–Gib Project, Ontario, Canada |
| Legacy Claim No. |
Township or Area |
Tenure ID |
Anniversary Date |
Recorded |
Work |
Royalty |
Royalty % and Basis | |||||||||
| 783675 |
GUIBORD, MUNRO | 102606 | 2028-01-18 | Mayfair 100% | 400 | Meunier; 2329113 Ont Inc | 2.5% NSR (2.25% Meunier and 0.25% 2329113 Ontario Inc.) | |||||||||
| 783675 |
GUIBORD, MUNRO | 265007 | 2028-01-18 | Mayfair 100% | 400 | Meunier; 2329113 Ont Inc | 2.5% NSR (2.25% Meunier and 0.25% 2329113 Ontario Inc.) | |||||||||
| 783675 |
MUNRO | 289219 | 2028-01-18 | Mayfair 100% | 200 | Meunier; 2329113 Ont Inc | 2.5% NSR (2.25% Meunier and 0.25% 2329113 Ontario Inc.) | |||||||||
| 783675 |
MUNRO | 185337 | 2028-01-18 | Mayfair 100% | 200 | Meunier; 2329113 Ont Inc | 2.5% NSR (2.25% Meunier and 0.25% 2329113 Ontario Inc.) | |||||||||
| 783676 |
MUNRO | 185337 | 2028-01-18 | Mayfair 100% | 200 | Meunier; 2329113 Ont Inc | 2.5% NSR (2.25% Meunier and 0.25% 2329113 Ontario Inc.) | |||||||||
| 783676 |
MUNRO | 289219 | 2028-01-18 | Mayfair 100% | 200 | Meunier; 2329113 Ont Inc | 2.5% NSR (2.25% Meunier and 0.25% 2329113 Ontario Inc.) | |||||||||
| 783677 |
GUIBORD, MCCOOL, MICHAUD, MUNRO | 169590 | 2028-01-18 | Mayfair 100% | 400 | Meunier; 2329113 Ont Inc | 2.5% NSR (2.25% Meunier and 0.25% 2329113 Ontario Inc.) | |||||||||
| 783677 |
GUIBORD, MICHAUD | 295969 | 2028-01-18 | Mayfair 100% | 400 | Meunier; 2329113 Ont Inc | 2.5% NSR (2.25% Meunier and 0.25% 2329113 Ontario Inc.) | |||||||||
| 783677 |
MCCOOL, MICHAUD | 340957 | 2028-01-18 | Mayfair 100% | 200 | Meunier; 2329113 Ont Inc | 2.5% NSR (2.25% Meunier and 0.25% 2329113 Ontario Inc.) | |||||||||
| 783677 |
MICHAUD | 177972 | 2028-01-18 | Mayfair 100% | 400 | Meunier; 2329113 Ont Inc | 2.5% NSR (2.25% Meunier and 0.25% 2329113 Ontario Inc.) | |||||||||
| 783678 |
MCCOOL, MICHAUD | 340957 | 2028-01-18 | Mayfair 100% | 200 | Meunier; 2329113 Ont Inc | 2.5% NSR (2.25% Meunier and 0.25% 2329113 Ontario Inc.) | |||||||||
| 783678 |
MICHAUD | 177972 | 2028-01-18 | Mayfair 100% | 400 | Meunier; 2329113 Ont Inc | 2.5% NSR (2.25% Meunier and 0.25% 2329113 Ontario Inc.) | |||||||||
| 783679 |
MICHAUD | 177972 | 2028-01-18 | Mayfair 100% | 400 | Meunier; 2329113 Ont Inc | 2.5% NSR (2.25% Meunier and 0.25% 2329113 Ontario Inc.) | |||||||||
| 783679 |
MICHAUD | 206995 | 2028-01-18 | Mayfair 100% | 400 | Meunier; 2329113 Ont Inc | 2.5% NSR (2.25% Meunier and 0.25% 2329113 Ontario Inc.) | |||||||||
| 783680 |
GUIBORD, MICHAUD | 295969 | 2028-01-18 | Mayfair 100% | 400 | Meunier; 2329113 Ont Inc | 2.5% NSR (2.25% Meunier and 0.25% 2329113 Ontario Inc.) | |||||||||
| 783680 |
GUIBORD, MICHAUD | 296129 | 2028-01-18 | Mayfair 100% | 400 | Meunier; 2329113 Ont Inc | 2.5% NSR (2.25% Meunier and 0.25% 2329113 Ontario Inc.) | |||||||||
| 783680 |
MICHAUD | 206995 | 2028-01-18 | Mayfair 100% | 400 | Meunier; 2329113 Ont Inc | 2.5% NSR (2.25% Meunier and 0.25% 2329113 Ontario Inc.) | |||||||||
| 783680 |
MICHAUD | 177972 | 2028-01-18 | Mayfair 100% | 400 | Meunier; 2329113 Ont Inc | 2.5% NSR (2.25% Meunier and 0.25% 2329113 Ontario Inc.) | |||||||||
| 783681 |
GUIBORD, MICHAUD | 211597 | 2028-01-18 | Mayfair 100% | 200 | Meunier; 2329113 Ont Inc | 2.5% NSR (2.25% Meunier and 0.25% 2329113 Ontario Inc.) | |||||||||
| 783681 |
GUIBORD, MICHAUD | 296129 | 2028-01-18 | Mayfair 100% | 400 | Meunier; 2329113 Ont Inc | 2.5% NSR (2.25% Meunier and 0.25% 2329113 Ontario Inc.) | |||||||||
| 783681 |
MICHAUD | 323029 | 2028-01-18 | Mayfair 100% | 200 | Meunier; 2329113 Ont Inc | 2.5% NSR (2.25% Meunier and 0.25% 2329113 Ontario Inc.) | |||||||||
| 783681 |
MICHAUD | 206995 | 2028-01-18 | Mayfair 100% | 400 | Meunier; 2329113 Ont Inc | 2.5% NSR (2.25% Meunier and 0.25% 2329113 Ontario Inc.) | |||||||||
| 783682 |
MICHAUD | 206995 | 2028-01-18 | Mayfair 100% | 400 | Meunier; 2329113 Ont Inc | 2.5% NSR (2.25% Meunier and 0.25% 2329113 Ontario Inc.) | |||||||||
| 783682 |
MICHAUD | 323029 | 2028-01-18 | Mayfair 100% | 200 | Meunier; 2329113 Ont Inc | 2.5% NSR (2.25% Meunier and 0.25% 2329113 Ontario Inc.) | |||||||||
| 783683 |
MCCOOL, MICHAUD | 306824 | 2028-01-18 | Mayfair 100% | 200 | Meunier; 2329113 Ont Inc | 2.5% NSR (2.25% Meunier and 0.25% 2329113 Ontario Inc.) | |||||||||
| 783683 |
MCCOOL, MICHAUD | 340957 | 2028-01-18 | Mayfair 100% | 200 | Meunier; 2329113 Ont Inc | 2.5% NSR (2.25% Meunier and 0.25% 2329113 Ontario Inc.) | |||||||||
| 783683 |
MICHAUD | 177972 | 2028-01-18 | Mayfair 100% | 400 | Meunier; 2329113 Ont Inc | 2.5% NSR (2.25% Meunier and 0.25% 2329113 Ontario Inc.) | |||||||||
| 783683 |
MICHAUD | 165183 | 2028-01-18 | Mayfair 100% | 400 | Meunier; 2329113 Ont Inc | 2.5% NSR (2.25% Meunier and 0.25% 2329113 Ontario Inc.) | |||||||||
| 783684 |
MICHAUD | 165183 | 2028-01-18 | Mayfair 100% | 400 | Meunier; 2329113 Ont Inc | 2.5% NSR (2.25% Meunier and 0.25% 2329113 Ontario Inc.) | |||||||||
| 783684 |
MICHAUD | 338797 | 2028-01-18 | Mayfair 100% | 400 | Meunier; 2329113 Ont Inc | 2.5% NSR (2.25% Meunier and 0.25% 2329113 Ontario Inc.) | |||||||||
| 783684 |
MICHAUD | 206995 | 2028-01-18 | Mayfair 100% | 400 | Meunier; 2329113 Ont Inc | 2.5% NSR (2.25% Meunier and 0.25% 2329113 Ontario Inc.) | |||||||||
| 783684 |
MICHAUD | 177972 | 2028-01-18 | Mayfair 100% | 400 | Meunier; 2329113 Ont Inc | 2.5% NSR (2.25% Meunier and 0.25% 2329113 Ontario Inc.) | |||||||||
|
|
PAGE | 4-9 October 10, 2025 |
| MAYFAIR GOLD CORP.
|
| |
| National Instrument 43-101 Technical Report—Mineral Resource Estimate Update Fenn–Gib Project, Ontario, Canada |
| Legacy Claim No. |
Township or Area |
Tenure ID |
Anniversary Date |
Recorded |
Work |
Royalty |
Royalty % and Basis | |||||||||
| 783685 |
MICHAUD | 206995 | 2028-01-18 | Mayfair 100% | 400 | Meunier; 2329113 Ont Inc | 2.5% NSR (2.25% Meunier and 0.25% 2329113 Ontario Inc.) | |||||||||
| 783685 |
MICHAUD | 338797 | 2028-01-18 | Mayfair 100% | 400 | Meunier; 2329113 Ont Inc | 2.5% NSR (2.25% Meunier and 0.25% 2329113 Ontario Inc.) | |||||||||
| 783685 |
MICHAUD | 326393 | 2028-01-18 | Mayfair 100% | 400 | Meunier; 2329113 Ont Inc | 2.5% NSR (2.25% Meunier and 0.25% 2329113 Ontario Inc.) | |||||||||
| 783685 |
MICHAUD | 323029 | 2028-01-18 | Mayfair 100% | 200 | Meunier; 2329113 Ont Inc | 2.5% NSR (2.25% Meunier and 0.25% 2329113 Ontario Inc.) | |||||||||
| 783686 |
GUIBORD | 182387 | 2028-01-18 | Mayfair 100% | 400 | Meunier; 2329113 Ont Inc | 2.5% NSR (2.25% Meunier and 0.25% 2329113 Ontario Inc.) | |||||||||
| 783686 |
GUIBORD | 341457 | 2028-01-18 | Mayfair 100% | 400 | Meunier; 2329113 Ont Inc | 2.5% NSR (2.25% Meunier and 0.25% 2329113 Ontario Inc.) | |||||||||
| 783686 |
GUIBORD, MUNRO | 265007 | 2028-01-18 | Mayfair 100% | 400 | Meunier; 2329113 Ont Inc | 2.5% NSR (2.25% Meunier and 0.25% 2329113 Ontario Inc.) | |||||||||
| 783686 |
GUIBORD, MUNRO | 234383 | 2028-01-18 | Mayfair 100% | 400 | Meunier; 2329113 Ont Inc | 2.5% NSR (2.25% Meunier and 0.25% 2329113 Ontario Inc.) | |||||||||
| 783687 |
GUIBORD | 122493 | 2028-01-18 | Mayfair 100% | 200 | Meunier; 2329113 Ont Inc | 2.5% NSR (2.25% Meunier and 0.25% 2329113 Ontario Inc.) | |||||||||
| 783687 |
GUIBORD | 341457 | 2028-01-18 | Mayfair 100% | 400 | Meunier; 2329113 Ont Inc | 2.5% NSR (2.25% Meunier and 0.25% 2329113 Ontario Inc.) | |||||||||
| 783687 |
GUIBORD | 182387 | 2028-01-18 | Mayfair 100% | 400 | Meunier; 2329113 Ont Inc | 2.5% NSR (2.25% Meunier and 0.25% 2329113 Ontario Inc.) | |||||||||
| 783687 |
GUIBORD | 127699 | 2028-01-18 | Mayfair 100% | 200 | Meunier; 2329113 Ont Inc | 2.5% NSR (2.25% Meunier and 0.25% 2329113 Ontario Inc.) | |||||||||
| 783688 |
GUIBORD | 102172 | 2028-01-18 | Mayfair 100% | 200 | Meunier; 2329113 Ont Inc | 2.5% NSR (2.25% Meunier and 0.25% 2329113 Ontario Inc.) | |||||||||
| 783688 |
GUIBORD | 324287 | 2028-01-18 | Mayfair 100% | 200 | Meunier; 2329113 Ont Inc | 2.5% NSR (2.25% Meunier and 0.25% 2329113 Ontario Inc.) | |||||||||
| 783688 |
GUIBORD | 324286 | 2028-01-18 | Mayfair 100% | 200 | Meunier; 2329113 Ont Inc | 2.5% NSR (2.25% Meunier and 0.25% 2329113 Ontario Inc.) | |||||||||
| 783688 |
GUIBORD | 127699 | 2028-01-18 | Mayfair 100% | 200 | Meunier; 2329113 Ont Inc | 2.5% NSR (2.25% Meunier and 0.25% 2329113 Ontario Inc.) | |||||||||
| 783689 |
GUIBORD | 102172 | 2028-01-18 | Mayfair 100% | 200 | Meunier; 2329113 Ont Inc | 2.5% NSR (2.25% Meunier and 0.25% 2329113 Ontario Inc.) | |||||||||
| 783689 |
GUIBORD | 341457 | 2028-01-18 | Mayfair 100% | 400 | Meunier; 2329113 Ont Inc | 2.5% NSR (2.25% Meunier and 0.25% 2329113 Ontario Inc.) | |||||||||
| 783689 |
GUIBORD | 161029 | 2028-01-18 | Mayfair 100% | 400 | Meunier; 2329113 Ont Inc | 2.5% NSR (2.25% Meunier and 0.25% 2329113 Ontario Inc.) | |||||||||
| 783689 |
GUIBORD | 127699 | 2028-01-18 | Mayfair 100% | 200 | Meunier; 2329113 Ont Inc | 2.5% NSR (2.25% Meunier and 0.25% 2329113 Ontario Inc.) | |||||||||
| 783690 |
GUIBORD | 161029 | 2028-01-18 | Mayfair 100% | 400 | Meunier; 2329113 Ont Inc | 2.5% NSR (2.25% Meunier and 0.25% 2329113 Ontario Inc.) | |||||||||
| 783690 |
GUIBORD | 341457 | 2028-01-18 | Mayfair 100% | 400 | Meunier; 2329113 Ont Inc | 2.5% NSR (2.25% Meunier and 0.25% 2329113 Ontario Inc.) | |||||||||
| 783690 |
GUIBORD, MUNRO | 234383 | 2028-01-18 | Mayfair 100% | 400 | Meunier; 2329113 Ont Inc | 2.5% NSR (2.25% Meunier and 0.25% 2329113 Ontario Inc.) | |||||||||
| 783690 |
GUIBORD, MUNRO | 172259 | 2028-01-18 | Mayfair 100% | 400 | Meunier; 2329113 Ont Inc | 2.5% NSR (2.25% Meunier and 0.25% 2329113 Ontario Inc.) | |||||||||
| 783691 |
MUNRO | 184751 | 2028-01-18 | Mayfair 100% | 200 | Meunier; 2329113 Ont Inc | 2.5% NSR (2.25% Meunier and 0.25% 2329113 Ontario Inc.) | |||||||||
| 783691 |
MUNRO | 344243 | 2028-01-18 | Mayfair 100% | 400 | Meunier; 2329113 Ont Inc | 2.5% NSR (2.25% Meunier and 0.25% 2329113 Ontario Inc.) | |||||||||
| 783691 |
MUNRO | 299259 | 2028-01-18 | Mayfair 100% | 200 | Meunier; 2329113 Ont Inc | 2.5% NSR (2.25% Meunier and 0.25% 2329113 Ontario Inc.) | |||||||||
| 783691 |
MUNRO | 251563 | 2028-01-18 | Mayfair 100% | 200 | Meunier; 2329113 Ont Inc | 2.5% NSR (2.25% Meunier and 0.25% 2329113 Ontario Inc.) | |||||||||
| 783692 |
MUNRO | 174512 | 2028-01-18 | Mayfair 100% | 400 | Meunier; 2329113 Ont Inc | 2.5% NSR (2.25% Meunier and 0.25% 2329113 Ontario Inc.) | |||||||||
| 783692 |
MUNRO | 344243 | 2028-01-18 | Mayfair 100% | 400 | Meunier; 2329113 Ont Inc | 2.5% NSR (2.25% Meunier and 0.25% 2329113 Ontario Inc.) | |||||||||
| 783692 |
MUNRO | 336091 | 2028-01-18 | Mayfair 100% | 200 | Meunier; 2329113 Ont Inc | 2.5% NSR (2.25% Meunier and 0.25% 2329113 Ontario Inc.) | |||||||||
| 783692 |
MUNRO | 184751 | 2028-01-18 | Mayfair 100% | 200 | Meunier; 2329113 Ont Inc | 2.5% NSR (2.25% Meunier and 0.25% 2329113 Ontario Inc.) | |||||||||
|
|
PAGE | 4-10 October 10, 2025 |
| MAYFAIR GOLD CORP.
|
| |
| National Instrument 43-101 Technical Report—Mineral Resource Estimate Update Fenn–Gib Project, Ontario, Canada |
| Legacy Claim No. |
Township or Area |
Tenure ID |
Anniversary Date |
Recorded |
Work |
Royalty |
Royalty % and Basis | |||||||||
| 783693 |
MUNRO | 174512 | 2028-01-18 | Mayfair 100% | 400 | Meunier; 2329113 Ont Inc | 2.5% NSR (2.25% Meunier and 0.25% 2329113 Ontario Inc.) | |||||||||
| 783693 |
MUNRO | 336091 | 2028-01-18 | Mayfair 100% | 200 | Meunier; 2329113 Ont Inc | 2.5% NSR (2.25% Meunier and 0.25% 2329113 Ontario Inc.) | |||||||||
| 783694 |
MUNRO | 251563 | 2028-01-18 | Mayfair 100% | 200 | Meunier; 2329113 Ont Inc | 2.5% NSR (2.25% Meunier and 0.25% 2329113 Ontario Inc.) | |||||||||
| 783694 |
MUNRO | 344243 | 2028-01-18 | Mayfair 100% | 400 | Meunier; 2329113 Ont Inc | 2.5% NSR (2.25% Meunier and 0.25% 2329113 Ontario Inc.) | |||||||||
| 783694 |
MUNRO | 322406 | 2028-01-18 | Mayfair 100% | 400 | Meunier; 2329113 Ont Inc | 2.5% NSR (2.25% Meunier and 0.25% 2329113 Ontario Inc.) | |||||||||
| 783694 |
MUNRO | 322405 | 2028-01-18 | Mayfair 100% | 200 | Meunier; 2329113 Ont Inc | 2.5% NSR (2.25% Meunier and 0.25% 2329113 Ontario Inc.) | |||||||||
| 783695 |
MUNRO | 174512 | 2028-01-18 | Mayfair 100% | 400 | Meunier; 2329113 Ont Inc | 2.5% NSR (2.25% Meunier and 0.25% 2329113 Ontario Inc.) | |||||||||
| 783695 |
MUNRO | 344243 | 2028-01-18 | Mayfair 100% | 400 | Meunier; 2329113 Ont Inc | 2.5% NSR (2.25% Meunier and 0.25% 2329113 Ontario Inc.) | |||||||||
| 783695 |
MUNRO | 322406 | 2028-01-18 | Mayfair 100% | 400 | Meunier; 2329113 Ont Inc | 2.5% NSR (2.25% Meunier and 0.25% 2329113 Ontario Inc.) | |||||||||
| 783695 |
MUNRO | 227695 | 2028-01-18 | Mayfair 100% | 400 | Meunier; 2329113 Ont Inc | 2.5% NSR (2.25% Meunier and 0.25% 2329113 Ontario Inc.) | |||||||||
| 783696 |
MUNRO | 174512 | 2028-01-18 | Mayfair 100% | 400 | Meunier; 2329113 Ont Inc | 2.5% NSR (2.25% Meunier and 0.25% 2329113 Ontario Inc.) | |||||||||
| 783696 |
MUNRO | 227695 | 2028-01-18 | Mayfair 100% | 400 | Meunier; 2329113 Ont Inc | 2.5% NSR (2.25% Meunier and 0.25% 2329113 Ontario Inc.) | |||||||||
| 783697 |
GUIBORD, MUNRO | 127179 | 2028-01-18 | Mayfair 100% | 400 | Meunier; 2329113 Ont Inc | 2.5% NSR (2.25% Meunier and 0.25% 2329113 Ontario Inc.) | |||||||||
| 783697 |
GUIBORD, MUNRO | 171033 | 2028-01-18 | Mayfair 100% | 400 | Meunier; 2329113 Ont Inc | 2.5% NSR (2.25% Meunier and 0.25% 2329113 Ontario Inc.) | |||||||||
| 783697 |
MUNRO | 227695 | 2028-01-18 | Mayfair 100% | 400 | Meunier; 2329113 Ont Inc | 2.5% NSR (2.25% Meunier and 0.25% 2329113 Ontario Inc.) | |||||||||
| 783697 |
MUNRO | 174512 | 2028-01-18 | Mayfair 100% | 400 | Meunier; 2329113 Ont Inc | 2.5% NSR (2.25% Meunier and 0.25% 2329113 Ontario Inc.) | |||||||||
| 783698 |
GUIBORD, MUNRO | 127179 | 2028-01-18 | Mayfair 100% | 400 | Meunier; 2329113 Ont Inc | 2.5% NSR (2.25% Meunier and 0.25% 2329113 Ontario Inc.) | |||||||||
| 783698 |
GUIBORD, MUNRO | 172259 | 2028-01-18 | Mayfair 100% | 400 | Meunier; 2329113 Ont Inc | 2.5% NSR (2.25% Meunier and 0.25% 2329113 Ontario Inc.) | |||||||||
| 783698 |
MUNRO | 336091 | 2028-01-18 | Mayfair 100% | 200 | Meunier; 2329113 Ont Inc | 2.5% NSR (2.25% Meunier and 0.25% 2329113 Ontario Inc.) | |||||||||
| 783698 |
MUNRO | 174512 | 2028-01-18 | Mayfair 100% | 400 | Meunier; 2329113 Ont Inc | 2.5% NSR (2.25% Meunier and 0.25% 2329113 Ontario Inc.) | |||||||||
| 783727 |
MUNRO | 153043 | 2028-01-18 | Mayfair 100% | 200 | Meunier; 2329113 Ont Inc | 2.5% NSR (2.25% Meunier and 0.25% 2329113 Ontario Inc.) | |||||||||
| 783727 |
MUNRO | 322406 | 2028-01-18 | Mayfair 100% | 400 | Meunier; 2329113 Ont Inc | 2.5% NSR (2.25% Meunier and 0.25% 2329113 Ontario Inc.) | |||||||||
| 783727 |
MUNRO | 322405 | 2028-01-18 | Mayfair 100% | 200 | Meunier; 2329113 Ont Inc | 2.5% NSR (2.25% Meunier and 0.25% 2329113 Ontario Inc.) | |||||||||
| 783727 |
MUNRO | 168333 | 2028-01-18 | Mayfair 100% | 400 | Meunier; 2329113 Ont Inc | 2.5% NSR (2.25% Meunier and 0.25% 2329113 Ontario Inc.) | |||||||||
| 783728 |
MUNRO | 123728 | 2028-01-18 | Mayfair 100% | 200 | Meunier; 2329113 Ont Inc | 2.5% NSR (2.25% Meunier and 0.25% 2329113 Ontario Inc.) | |||||||||
| 783728 |
MUNRO | 322406 | 2028-01-18 | Mayfair 100% | 400 | Meunier; 2329113 Ont Inc | 2.5% NSR (2.25% Meunier and 0.25% 2329113 Ontario Inc.) | |||||||||
| 783728 |
MUNRO | 227695 | 2028-01-18 | Mayfair 100% | 400 | Meunier; 2329113 Ont Inc | 2.5% NSR (2.25% Meunier and 0.25% 2329113 Ontario Inc.) | |||||||||
| 783728 |
MUNRO | 168333 | 2028-01-18 | Mayfair 100% | 400 | Meunier; 2329113 Ont Inc | 2.5% NSR (2.25% Meunier and 0.25% 2329113 Ontario Inc.) | |||||||||
| 783729 |
MUNRO | 123728 | 2028-01-18 | Mayfair 100% | 200 | Meunier; 2329113 Ont Inc | 2.5% NSR (2.25% Meunier and 0.25% 2329113 Ontario Inc.) | |||||||||
| 783729 |
MUNRO | 227695 | 2028-01-18 | Mayfair 100% | 400 | Meunier; 2329113 Ont Inc | 2.5% NSR (2.25% Meunier and 0.25% 2329113 Ontario Inc.) | |||||||||
| 783730 |
GUIBORD, MUNRO | 171033 | 2028-01-18 | Mayfair 100% | 400 | Meunier; 2329113 Ont Inc | 2.5% NSR (2.25% Meunier and 0.25% 2329113 Ontario Inc.) | |||||||||
| 783730 |
GUIBORD, MUNRO | 227696 | 2028-01-18 | Mayfair 100% | 200 | Meunier; 2329113 Ont Inc | 2.5% NSR (2.25% Meunier and 0.25% 2329113 Ontario Inc.) | |||||||||
|
|
PAGE | 4-11 October 10, 2025 |
| MAYFAIR GOLD CORP.
|
| |
| National Instrument 43-101 Technical Report—Mineral Resource Estimate Update Fenn–Gib Project, Ontario, Canada |
| Legacy Claim No. |
Township or Area |
Tenure ID |
Anniversary Date |
Recorded |
Work |
Royalty |
Royalty % and Basis | |||||||||
| 783730 |
MUNRO | 227695 | 2028-01-18 | Mayfair 100% | 400 | Meunier; 2329113 Ont Inc | 2.5% NSR (2.25% Meunier and 0.25% 2329113 Ontario Inc.) | |||||||||
| 783730 |
MUNRO | 123728 | 2028-01-18 | Mayfair 100% | 200 | Meunier; 2329113 Ont Inc | 2.5% NSR (2.25% Meunier and 0.25% 2329113 Ontario Inc.) | |||||||||
| 783731 |
MUNRO | 123728 | 2028-01-18 | Mayfair 100% | 200 | Meunier; 2329113 Ont Inc | 2.5% NSR (2.25% Meunier and 0.25% 2329113 Ontario Inc.) | |||||||||
| 783732 |
MUNRO | 123728 | 2028-01-18 | Mayfair 100% | 200 | Meunier; 2329113 Ont Inc | 2.5% NSR (2.25% Meunier and 0.25% 2329113 Ontario Inc.) | |||||||||
| 783732 |
MUNRO | 168333 | 2028-01-18 | Mayfair 100% | 400 | Meunier; 2329113 Ont Inc | 2.5% NSR (2.25% Meunier and 0.25% 2329113 Ontario Inc.) | |||||||||
| 783733 |
MUNRO | 153043 | 2028-01-18 | Mayfair 100% | 200 | Meunier; 2329113 Ont Inc | 2.5% NSR (2.25% Meunier and 0.25% 2329113 Ontario Inc.) | |||||||||
| 783733 |
MUNRO | 168333 | 2028-01-18 | Mayfair 100% | 400 | Meunier; 2329113 Ont Inc | 2.5% NSR (2.25% Meunier and 0.25% 2329113 Ontario Inc.) | |||||||||
| 783734 |
MUNRO | 121382 | 2028-01-18 | Mayfair 100% | 200 | Meunier; 2329113 Ont Inc | 2.5% NSR (2.25% Meunier and 0.25% 2329113 Ontario Inc.) | |||||||||
| 783734 |
MUNRO | 205680 | 2028-01-18 | Mayfair 100% | 200 | Meunier; 2329113 Ont Inc | 2.5% NSR (2.25% Meunier and 0.25% 2329113 Ontario Inc.) | |||||||||
| 783734 |
MUNRO | 168333 | 2028-01-18 | Mayfair 100% | 400 | Meunier; 2329113 Ont Inc | 2.5% NSR (2.25% Meunier and 0.25% 2329113 Ontario Inc.) | |||||||||
| 783734 |
MUNRO | 153043 | 2028-01-18 | Mayfair 100% | 200 | Meunier; 2329113 Ont Inc | 2.5% NSR (2.25% Meunier and 0.25% 2329113 Ontario Inc.) | |||||||||
| 783735 |
MUNRO | 123728 | 2028-01-18 | Mayfair 100% | 200 | Meunier; 2329113 Ont Inc | 2.5% NSR (2.25% Meunier and 0.25% 2329113 Ontario Inc.) | |||||||||
| 783735 |
MUNRO | 330899 | 2028-01-18 | Mayfair 100% | 200 | Meunier; 2329113 Ont Inc | 2.5% NSR (2.25% Meunier and 0.25% 2329113 Ontario Inc.) | |||||||||
| 783735 |
MUNRO | 205680 | 2028-01-18 | Mayfair 100% | 200 | Meunier; 2329113 Ont Inc | 2.5% NSR (2.25% Meunier and 0.25% 2329113 Ontario Inc.) | |||||||||
| 783735 |
MUNRO | 168333 | 2028-01-18 | Mayfair 100% | 400 | Meunier; 2329113 Ont Inc | 2.5% NSR (2.25% Meunier and 0.25% 2329113 Ontario Inc.) | |||||||||
| 783780 |
MCCOOL | 141919 | 2028-01-18 | Mayfair 100% | 200 | Meunier; 2329113 Ont Inc | 2.5% NSR (2.25% Meunier and 0.25% 2329113 Ontario Inc.) | |||||||||
| 783780 |
MCCOOL, MUNRO | 321590 | 2028-01-18 | Mayfair 100% | 200 | Meunier; 2329113 Ont Inc | 2.5% NSR (2.25% Meunier and 0.25% 2329113 Ontario Inc.) | |||||||||
| 783781 |
MCCOOL, MICHAUD | 285102 | 2028-01-18 | Mayfair 100% | 200 | Meunier; 2329113 Ont Inc | 2.5% NSR (2.25% Meunier and 0.25% 2329113 Ontario Inc.) | |||||||||
| 783781 |
MCCOOL, MICHAUD | 344041 | 2028-01-18 | Mayfair 100% | 200 | Meunier; 2329113 Ont Inc | 2.5% NSR (2.25% Meunier and 0.25% 2329113 Ontario Inc.) | |||||||||
| 783781 |
MICHAUD | 225791 | 2028-01-18 | Mayfair 100% | 200 | Meunier; 2329113 Ont Inc | 2.5% NSR (2.25% Meunier and 0.25% 2329113 Ontario Inc.) | |||||||||
| 783781 |
MICHAUD | 182448 | 2028-01-18 | Mayfair 100% | 400 | Meunier; 2329113 Ont Inc | 2.5% NSR (2.25% Meunier and 0.25% 2329113 Ontario Inc.) | |||||||||
| 783817 |
MICHAUD | 164380 | 2028-01-18 | Mayfair 100% | 200 | Meunier; 2329113 Ont Inc | 2.5% NSR (2.25% Meunier and 0.25% 2329113 Ontario Inc.) | |||||||||
| 783817 |
MICHAUD | 225791 | 2028-01-18 | Mayfair 100% | 200 | Meunier; 2329113 Ont Inc | 2.5% NSR (2.25% Meunier and 0.25% 2329113 Ontario Inc.) | |||||||||
| 783817 |
MICHAUD | 189061 | 2028-01-18 | Mayfair 100% | 200 | Meunier; 2329113 Ont Inc | 2.5% NSR (2.25% Meunier and 0.25% 2329113 Ontario Inc.) | |||||||||
| 783817 |
MICHAUD | 182448 | 2028-01-18 | Mayfair 100% | 400 | Meunier; 2329113 Ont Inc | 2.5% NSR (2.25% Meunier and 0.25% 2329113 Ontario Inc.) | |||||||||
| 783818 |
MICHAUD | 189061 | 2028-01-18 | Mayfair 100% | 200 | Meunier; 2329113 Ont Inc | 2.5% NSR (2.25% Meunier and 0.25% 2329113 Ontario Inc.) | |||||||||
| 783818 |
MICHAUD | 311788 | 2028-01-18 | Mayfair 100% | 200 | Meunier; 2329113 Ont Inc | 2.5% NSR (2.25% Meunier and 0.25% 2329113 Ontario Inc.) | |||||||||
| 783818 |
MICHAUD | 311787 | 2028-01-18 | Mayfair 100% | 200 | Meunier; 2329113 Ont Inc | 2.5% NSR (2.25% Meunier and 0.25% 2329113 Ontario Inc.) | |||||||||
| 783818 |
MICHAUD | 225791 | 2028-01-18 | Mayfair 100% | 200 | Meunier; 2329113 Ont Inc | 2.5% NSR (2.25% Meunier and 0.25% 2329113 Ontario Inc.) | |||||||||
| 894174 |
GUIBORD | 203737 | 2027-07-14 | Mayfair 100% | 200 | A. Fenn | 5% NPR | |||||||||
| 894174 |
GUIBORD | 276413 | 2027-07-14 | Mayfair 100% | 200 | A. Fenn | 5% NPR | |||||||||
| 894174 |
GUIBORD, MUNRO | 323207 | 2027-07-14 | Mayfair 100% | 200 | A. Fenn | 5% NPR | |||||||||
|
|
PAGE | 4-12 October 10, 2025 |
| MAYFAIR GOLD CORP.
|
| |
| National Instrument 43-101 Technical Report—Mineral Resource Estimate Update Fenn–Gib Project, Ontario, Canada |
| Legacy Claim No. |
Township or Area |
Tenure ID |
Anniversary Date |
Recorded |
Work |
Royalty |
Royalty % and Basis | |||||||||
| 894174 |
GUIBORD, MUNRO | 294568 | 2027-07-14 | Mayfair 100% | 200 | A. Fenn | 5% NPR | |||||||||
| 894178 |
GUIBORD, MUNRO | 251594 | 2027-07-14 | Mayfair 100% | 200 | A. Fenn | 5% NPR | |||||||||
| 894178 |
GUIBORD, MUNRO | 294568 | 2027-07-14 | Mayfair 100% | 200 | A. Fenn | 5% NPR | |||||||||
| 894179 |
GUIBORD, MUNRO | 294568 | 2027-07-14 | Mayfair 100% | 200 | A. Fenn | 5% NPR | |||||||||
| 894179 |
GUIBORD, MUNRO | 323207 | 2027-07-14 | Mayfair 100% | 200 | A. Fenn | 5% NPR | |||||||||
| 894179 |
MUNRO | 173320 | 2027-07-14 | Mayfair 100% | 200 | A. Fenn | 5% NPR | |||||||||
| 894179 |
MUNRO | 155186 | 2027-07-14 | Mayfair 100% | 200 | A. Fenn | 5% NPR | |||||||||
| — |
MUNRO | 950149 | 2027-06-26 | Mayfair 100% | 400 | A. Fenn | 5% NPR | |||||||||
| 3015737 |
GUIBORD, MUNRO | 126576 | 2027-12-21 | Mayfair 100% | 200 | Meunier3 | 2.5% NSR | |||||||||
| 3015737 |
MUNRO | 271126 | 2027-12-21 | Mayfair 100% | 200 | Meunier3 | 2.5% NSR | |||||||||
| 3015737 |
MUNRO | 271125 | 2027-12-21 | Mayfair 100% | 200 | Meunier3 | 2.5% NSR | |||||||||
| 3015737 |
GUIBORD, MUNRO | 179863 | 2027-12-21 | Mayfair 100% | 200 | Meunier3 | 2.5% NSR | |||||||||
| 1192489 |
GUIBORD | 109887 | 2027-04-02 | Mayfair 100% | 200 | Meunier3 | 2.5% NSR | |||||||||
| 1192489 |
GUIBORD | 325857 | 2027-04-02 | Mayfair 100% | 200 | Meunier3 | 2.5% NSR | |||||||||
| 1192489 |
GUIBORD | 275832 | 2027-04-02 | Mayfair 100% | 200 | Meunier3 | 2.5% NSR | |||||||||
| 1192489 |
GUIBORD | 275831 | 2027-04-02 | Mayfair 100% | 200 | Meunier3 | 2.5% NSR | |||||||||
| 1192489 |
GUIBORD | 259178 | 2027-04-02 | Mayfair 100% | 400 | Meunier3 | 2.5% NSR | |||||||||
| 1192489 |
GUIBORD | 203147 | 2027-04-02 | Mayfair 100% | 200 | Meunier3 | 2.5% NSR | |||||||||
| 1192489 |
GUIBORD | 172897 | 2027-04-02 | Mayfair 100% | 200 | Meunier3 | 2.5% NSR | |||||||||
| 1192489 |
GUIBORD | 144336 | 2027-04-02 | Mayfair 100% | 200 | Meunier3 | 2.5% NSR | |||||||||
| 1192489 |
GUIBORD | 138341 | 2027-04-02 | Mayfair 100% | 200 | Meunier3 | 2.5% NSR | |||||||||
| 4257820 |
GUIBORD, MUNRO | 179863 | 2027-12-21 | Mayfair 100% | 200 | Meunier3 | 2.5% NSR | |||||||||
| 4257820 |
MUNRO | 271126 | 2027-12-21 | Mayfair 100% | 200 | Meunier3 | 2.5% NSR | |||||||||
| 4257820 |
MUNRO | 271125 | 2027-12-21 | Mayfair 100% | 200 | Meunier3 | 2.5% NSR | |||||||||
| 4257820 |
MUNRO | 215180 | 2027-12-21 | Mayfair 100% | 200 | Meunier3 | 2.5% NSR | |||||||||
| 4257820 |
GUIBORD, MUNRO | 185902 | 2027-12-21 | Mayfair 100% | 200 | Meunier3 | 2.5% NSR | |||||||||
Notes: NSR = net smelter return; NPI = net profits interests.
Source: Mayfair (2025)
|
|
PAGE | 4-13 October 10, 2025 |
| MAYFAIR GOLD CORP.
|
| |
| National Instrument 43-101 Technical Report—Mineral Resource Estimate Update Fenn–Gib Project, Ontario, Canada |
Table 4-2: Summary of Mining Patents
| Patents |
Township |
Parcel No. |
Legal Rights |
Description |
Ha |
PIN No. |
Royalty Holder/s |
Royalty% and Basis | ||||||||
| Fenn–Gib North |
||||||||||||||||
| PAT-490811 |
GUIBORD | 4220SEC | Mining and Surface Rights | L9189, NE1/4 of S1/2 Lot 8 Con 6 | 16.946 | 65379-0191(LT) | None | — | ||||||||
| PAT-490821 |
GUIBORD | 4219SEC | Mining and Surface Rights | L9190, SE1/4 of S1/2 Lot 8 Con 6 | 16.946 | 65379-0192(LT) | None | — | ||||||||
| PAT-490801 |
GUIBORD | 4217SEC | Mining and Surface Rights | L9188, SE 1/4 of N1/2 Lot 8 Con 6 | 16.946 | 65379-0189(LT) | None | — | ||||||||
| PAT-490791 |
GUIBORD | 4218SEC | Mining and Surface Rights | L8290, SW1/4 of S1/2 Lot 7 Con 6 | 16.896 | 65379-0194(LT) | None | — | ||||||||
| PAT-490781 |
GUIBORD | 4215SEC | Mining and Surface Rights | L9252, SE1/4 of S1/2 Lot 7 Con 6 | 17.3 | 65379-0195(LT) | None | — | ||||||||
| PAT-490771 |
GUIBORD | 4216SEC | Mining and Surface Rights | L8289, NW1/4 of S1/2 Lot 7 Con 6 | 16.896 | 65379-0193(LT) | None | — | ||||||||
| PAT-272961 |
MUNRO | 2636SEC | Mining and Surface Rights | NE 1/4 OF S 1/2 OF LOT 9 CON 1 | 16.036 | 65367-0116(LT) | None | — | ||||||||
| PAT-43491 |
GUIBORD | 11391SEC | Mining and Surface Rights | NE 1/4 OF N 1/2 LOT 7 CON 6 - L45564 | 16.896 | 65379-0196(LT) | None | — | ||||||||
| L455611 |
MUNRO | 11516SEC | Surface Rights | L45561 | 16 | 65367-0145(LT) | Same land as L894178 | — | ||||||||
| L455621 |
MUNRO | 11393SEC | Surface Rights | L45562 | 16 | 65367-0119(LT) | Same land as L894179 | — | ||||||||
| L455631 |
GUIBORD | 11392SEC | Surface Rights | L45563 | 16 | 65379-0197(LT) | Same land as L894174 | — | ||||||||
| Backman | ||||||||||||||||
| PAT-487971 |
MUNRO | 12010SEC | Mining Rights | SE1/4 S1/2 LOT 10 CON 1 - L52228 | 15.682 | 65367-0153(LT) | Backman | 5% NPR | ||||||||
| Dyer | ||||||||||||||||
| PAT-2640 |
GUIBORD | 4074SEC | Mining and Surface Rights | SW1/4 of N1/2 Lot 9 Con 6 | 16.744 | 65379-0186(LT) | Dyer | 2% NSR | ||||||||
| PAT-2639 |
GUIBORD | 281SEC | Mining and Surface Rights | NW1/4 of N1/2 Lot 9 Con 6 | 16.744 | 65379-0185(LT) | Dyer | 2% NSR | ||||||||
| PAT-2638 |
GUIBORD | 3920SEC | Mining and Surface Rights | NW1/4 of S1/2 Lot 1 Con 6 | 16.592 | 65379-0201(LT) | Dyer | 2% NSR | ||||||||
| PAT-2637 |
GUIBORD | 3929SEC | Mining and Surface Rights | NE1/4 of S1/2 Lot 2 Con 6 | 17.199 | 65379-0200(LT) | Dyer | 2% NSR | ||||||||
| Fenn–Gib South | ||||||||||||||||
| PAT-5494 |
GUIBORD | 9275SEC | Mining and Surface Rights | LOT 8 CON 3 - L37004 | 16.187 | 65379-0159(LT) | New Klondike Exploration | 2% NSR | ||||||||
| PAT-5493 |
GUIBORD | 9274SEC | Mining and Surface Rights | LOT 7 CON 3 - L37003 | 16.137 | 65379-0160(LT) | New Klondike Exploration | 2% NSR | ||||||||
| PAT-5492 |
GUIBORD | 9273SEC | Mining and Surface Rights | LOT 7 CON 3 - L37002 | 16.137 | 65379-0161(LT) | New Klondike Exploration | 2% NSR | ||||||||
| PAT-5491 |
GUIBORD | 9271SEC | Mining and Surface Rights | NW 1/4 OF S 1/2 LOT 5, CON 2, L36779 | 16.238 | 65379-0135(LT) | New Klondike Exploration | 2% NSR | ||||||||
| PAT-5490 |
GUIBORD | 9272SEC | Mining and Surface Rights | LOT 6 CON 2- L36778 | 16.238 | 65379-0134(LT) | New Klondike Exploration | 2% NSR | ||||||||
Notes: 1 Subject to Barrick Gold Corporation’s back-in rights, described in Section 4.4. NSR = net smelter return; NPI = net profits interests.
Source: Mayfair (2024)
|
|
PAGE | 4-14 October 10, 2025 |
| MAYFAIR GOLD CORP.
|
| |
| National Instrument 43-101 Technical Report—Mineral Resource Estimate Update Fenn–Gib Project, Ontario, Canada |
Table 4-3: Summary of Leased Claims
| Lease |
Legacy Claims |
Township | Parcel No. | Legal Rights | Lease |
Area |
PIN No. | Royalty Holder/s |
Royalty % and Basis | |||||||||
| Fenn–Gib North | ||||||||||||||||||
| LEA-108626 |
L475766 | GUIBORD | 1600 SEC LC | Mining and Surface Rights |
2032-03-31 | 673.854 | 65379- 0199(LT) |
0799714 B.C. Ltd. | 1.0% NSR on gold and 2.0% NSR on all other minerals | |||||||||
| L475767 | — | — | — | — | — | — | 0799714 B.C. Ltd. | 1.5% NSR | ||||||||||
| L475768 | — | — | — | — | — | — | 0799714 B.C. Ltd. | 1.0% NSR on gold and 2.0% NSR on all other minerals | ||||||||||
| L475769 | — | — | — | — | — | — | 0799714 B.C. Ltd. | 1.0% NSR on gold and 2.0% NSR on all other minerals | ||||||||||
| L475770 | — | — | — | — | — | — | 0799714 B.C. Ltd. | 1.5% NSR | ||||||||||
| L475777 | — | — | — | — | — | — | 0799714 B.C. Ltd. | 1.5% NSR | ||||||||||
| L475778 | — | — | — | — | — | — | 0799714 B.C. Ltd. | 1.5% NSR | ||||||||||
| L475779 | — | — | — | — | — | — | 0799714 B.C. Ltd. | 1.0% NSR on gold and 2.0% NSR on all other minerals | ||||||||||
| L475780 | — | — | — | — | — | — | 0799714 B.C. Ltd. | 1.0% NSR on gold and 2.0% NSR on all other minerals | ||||||||||
| L475781 | — | — | — | — | — | — | 0799714 B.C. Ltd. | 1.0% NSR on gold and 2.0% NSR on all other minerals | ||||||||||
| L475782 | — | — | — | — | — | — | 0799714 B.C. Ltd. | 1.0% NSR on gold and 2.0% NSR on all other minerals | ||||||||||
| L475784 | — | — | — | — | — | — | 0799714 B.C. Ltd. | 1.0% NSR on gold and 2.0% NSR on all other minerals | ||||||||||
| L475799 | — | — | — | — | — | — | 0799714 B.C. Ltd. | 1.5% NSR | ||||||||||
| L475800 | — | — | — | — | — | — | 0799714 B.C. Ltd. | 1.5% NSR | ||||||||||
| L475801 | — | — | — | — | — | — | 0799714 B.C. Ltd. | 1.0% NSR on gold and 2.0% NSR on all other minerals | ||||||||||
| L475802 | — | — | — | — | — | — | 0799714 B.C. Ltd. | 1.0% NSR on gold and 2.0% NSR on all other minerals | ||||||||||
| L475803 | — | — | — | — | — | — | 0799714 B.C. Ltd. | 1.0% NSR on gold and 2.0% NSR on all other minerals | ||||||||||
| L477208 | — | — | — | — | — | — | 0799714 B.C. Ltd. | 1.0% NSR on gold and 2.0% NSR on all other minerals | ||||||||||
| L477209 | — | — | — | — | — | — | 0799714 B.C. Ltd. | 1.0% NSR on gold and 2.0% NSR on all other minerals | ||||||||||
| L477212 | — | — | — | — | — | — | 0799714 B.C. Ltd. | 1.0% NSR on gold and 2.0% NSR on all other minerals | ||||||||||
| L477222 | — | — | — | — | — | — | 0799714 B.C. Ltd. | 1.0% NSR on gold and 2.0% NSR on all other minerals | ||||||||||
| L477223 | — | — | — | — | — | — | 0799714 B.C. Ltd. | 1.0% NSR on gold and 2.0% NSR on all other minerals | ||||||||||
| L477224 | — | — | — | — | — | — | 0799714 B.C. Ltd. | 1.0% NSR on gold and 2.0% NSR on all other minerals | ||||||||||
| L477225 | — | — | — | — | — | — | 0799714 B.C. Ltd. | 1.0% NSR on gold and 2.0% NSR on all other minerals | ||||||||||
| L477226 | — | — | — | — | — | — | 0799714 B.C. Ltd. | 1.0% NSR on gold and 2.0% NSR on all other minerals | ||||||||||
| L477227 | — | — | — | — | — | — | 0799714 B.C. Ltd. | 1.0% NSR on gold and 2.0% NSR on all other minerals | ||||||||||
| L477228 | — | — | — | — | — | — | 0799714 B.C. Ltd. | 1.0% NSR on gold and 2.0% NSR on all other minerals | ||||||||||
| L477237 | — | — | — | — | — | — | 0799714 B.C. Ltd. | 1.0% NSR on gold and 2.0% NSR on all other minerals | ||||||||||
| L477238 | — | — | — | — | — | — | 0799714 B.C. Ltd. | 1.5% NSR | ||||||||||
|
|
PAGE | 4-15 October 10, 2025 |
| MAYFAIR GOLD CORP.
|
| |
| National Instrument 43-101 Technical Report—Mineral Resource Estimate Update Fenn–Gib Project, Ontario, Canada |
| Lease |
Legacy Claims |
Township | Parcel No. | Legal Rights | Lease |
Area |
PIN No. | Royalty Holder/s |
Royalty % and Basis | |||||||||
| L477239 | — | — | — | — | — | — | 0799714 B.C. Ltd. | 1.0% NSR on gold and 2.0% NSR on all other minerals | ||||||||||
| L477240 | — | — | — | — | — | — | 0799714 B.C. Ltd. | 1.0% NSR on gold and 2.0% NSR on all other minerals | ||||||||||
| L477241 | — | — | — | — | — | — | 0799714 B.C. Ltd. | 1.0% NSR on gold and 2.0% NSR on all other minerals | ||||||||||
| L477242 | — | — | — | — | — | — | 0799714 B.C. Ltd. | 1.0% NSR on gold and 2.0% NSR on all other minerals | ||||||||||
| L477243 | — | — | — | — | — | — | 0799714 B.C. Ltd. | 1.0% NSR on gold and 2.0% NSR on all other minerals | ||||||||||
| L477244 | — | — | — | — | — | — | 0799714 B.C. Ltd. | 1.0% NSR on gold and 2.0% NSR on all other minerals | ||||||||||
| L477252 | — | — | — | — | — | — | 0799714 B.C. Ltd. | 1.0% NSR on gold and 2.0% NSR on all other minerals | ||||||||||
| L477256 | — | — | — | — | — | — | 0799714 B.C. Ltd. | 1.0% NSR on gold and 2.0% NSR on all other minerals | ||||||||||
| L477258 | — | — | — | — | — | — | 0799714 B.C. Ltd. | 1.0% NSR on gold and 2.0% NSR on all other minerals | ||||||||||
| L477259 | — | — | — | — | — | — | 0799714 B.C. Ltd. | 1.0% NSR on gold and 2.0% NSR on all other minerals | ||||||||||
| L477260 | — | — | — | — | — | — | 0799714 B.C. Ltd. | 1.0% NSR on gold and 2.0% NSR on all other minerals | ||||||||||
| L477261 | — | — | — | — | — | — | 0799714 B.C. Ltd. | 1.0% NSR on gold and 2.0% NSR on all other minerals | ||||||||||
|
LEA-107733 |
L894175 | GUIBORD | Mining and Surface Rights |
2025-12-31 | 84.74 | 65379- 0256(LT) |
A. Fenn | 5% NPR | ||||||||||
| L894176 | — | — | — | — | — | — | A. Fenn | 5% NPR | ||||||||||
| L894177 | — | — | — | — | — | — | A. Fenn | 5% NPR | ||||||||||
|
LEA-108627 |
L475771 | GUIBORD | 1595 SEC LC |
Mining and Surface Rights |
2032-01-31 | 203.472 | 65379- 0198(LT) |
0799714 B.C. Ltd. | 1.0% NSR on gold and 2.0% NSR on all other minerals | |||||||||
| L475772 | — | — | — | — | — | — | 0799714 B.C. Ltd. | 1.0% NSR on gold and 2.0% NSR on all other minerals | ||||||||||
| L475773 | — | — | — | — | — | — | 0799714 B.C. Ltd. | 1.5% NSR | ||||||||||
| L475774 | — | — | — | — | — | — | 0799714 B.C. Ltd. | 1.5% NSR | ||||||||||
| L475775 | — | — | — | — | — | — | 0799714 B.C. Ltd. | 1.5% NSR | ||||||||||
| L475776 | — | — | — | — | — | — | 0799714 B.C. Ltd. | 1.5% NSR | ||||||||||
| L475797 | — | — | — | — | — | — | 0799714 B.C. Ltd. | 1.5% NSR | ||||||||||
| L475798 | — | — | — | — | — | — | 0799714 B.C. Ltd. | 1.5% NSR | ||||||||||
| L477312 | — | — | — | — | — | — | 0799714 B.C. Ltd. | 1.5% NSR | ||||||||||
| L477313 | — | — | — | — | — | — | 0799714 B.C. Ltd. | 1.5% NSR | ||||||||||
| L477316 | — | — | — | — | — | — | 0799714 B.C. Ltd. | 1.0% NSR on gold and 2.0% NSR on all other minerals | ||||||||||
| L477317 | — | — | — | — | — | — | 0799714 B.C. Ltd. | 1.0% NSR on gold and 2.0% NSR on all other minerals |
|
|
PAGE | 4-16 October 10, 2025 |
| MAYFAIR GOLD CORP.
|
| |
| National Instrument 43-101 Technical Report—Mineral Resource Estimate Update Fenn–Gib Project, Ontario, Canada |
| Lease |
Legacy Claims |
Township | Parcel No. | Legal Rights | Lease |
Area |
PIN No. | Royalty Holder/s |
Royalty % and Basis | |||||||||
| Fenn–Gib Horseshoe | ||||||||||||||||||
| LEA-110178 |
L427809 | GUIBORD | 1312LC | Mining and Surface Rights |
2045-08-31 | 84.63 | 65379- 0190(LT) |
Croesus Gold Mines Limited, Constantine | Croesus GM—2% NSR; Constantine—1% NSR | |||||||||
| L427810 | — | — | — | — | — | — | — | — | ||||||||||
| L427811 | — | — | — | — | — | — | — | — | ||||||||||
| L442115 | — | — | — | — | — | — | — | — | ||||||||||
| L442116 | — | — | — | — | — | — | — | — | ||||||||||
| LEA-110177 |
L427812 | MUNRO | 1313LC | Mining and Surface Rights |
2045-08-31 | 45.883 | 65367- 0118(LT) |
Croesus Gold Mines Limited, Constantine | Croesus GM—2% NSR; Constantine—1% NSR | |||||||||
| L427813 | — | — | — | — | — | — | — | — | ||||||||||
| L427814 | — | — | — | — | — | — | — | — | ||||||||||
| Fenn–Gib South | ||||||||||||||||||
| LEA-108908 |
— | GUIBORD | 1613LC | Mining and Surface Rights |
2032-08-31 | 1410.139 | 65379- 0004(LT) |
None | — | |||||||||
Notes: NPR = net proceeds royalty; NSR = net smelter return.
Source: Mayfair (2025)
|
|
PAGE | 4-17 October 10, 2025 |
| MAYFAIR GOLD CORP.
|
| |
| National Instrument 43-101 Technical Report—Mineral Resource Estimate Update Fenn–Gib Project, Ontario, Canada |
| 4.4 | Mining Rights |
| 4.4.1 | Patented Land |
The patented land parcels are the most secure form of land tenure and are subject to an annual mining tax payable to the Crown. The patented lands are described by the legal survey of individual mining claims and surveyed mining locations. The patented (or leasehold) mining lands consist of 21-year mining leases issued for mining claims that have been legally surveyed as individual mining claims or defined by the perimeter survey of groups of mining claims. Plans of a perimeter survey of multiple contiguous mining claims in unsurveyed territory include CLM (Ontario Surveyor). Leaseholders are subject to an annual rental payable to the Crown. The Ontario Mining Act contains provisions for the renewal of 21-year mining leases. Applications for renewal are subject to Ministry review and consent.
| 4.4.2 | Unpatented Land |
Ontario modernized its mining claim system on April 10, 2018, transitioning from a manual ground and paper staking system to an online platform. All active, unpatented claims were converted from their legally defined location by claim posts on the ground or by township survey to a cell-based provincial grid. Mining claims are now legally defined by their cell position on the grid and coordinate location in the Mining Lands Administration System (MLAS) map viewer. The unpatented mining claims (cell mining claims) Mayfair Gold holds do not confer upon the Company any right, title, interest, or claims in or to the mining claims other than the right to proceed as is in the Ontario Mining Act, R.S.O. 1990, Chapter M. Upon registering cell mining claims (cells), the Company must perform and file exploration assessment work and apply assessment work credits on those cells to maintain them in good standing. The first unit of assessment work of $400/~20 ha is required by the second anniversary date of recording the cell, and an additional unit is required to be performed and filed for each year thereafter. Until a mining lease for the mining claims is issued, the Company does not have the right to remove or otherwise dispose of any minerals found in, upon, or under the mining claim.
| 4.5 | Surface Rights |
Mayfair Gold does not have a right, title, or claim to the surface rights of the claims except to enter upon, use, and occupy such part or parts necessary for the purpose of prospecting and exploration (Ontario Mining Act, R.S. O. 1990, Chapter M).
| 4.6 | Royalties and Encumbrances |
Mayfair Gold owns a 100% interest in 21 fee simple patented properties, 145 unpatented mining claims, and 6 mining lease properties in the Guibord, Munro, Michaud, and McCool Townships in northeast Ontario, Canada (collectively, the Fenn–Gib Project). LSG agreed to sell the Fenn–Gib Project to Mayfair pursuant to an asset purchase agreement dated June 8, 2020. Concurrent with the closing of Mayfair’s acquisition of the Fenn–Gib Project, Mayfair granted LSG a 1% NSR royalty over the entirety of the Fenn– Gib Project to be paid in addition to those summarized in Table 4-1 to Table 4-3. LSG subsequently sold the interest in the 1% NSR royalty to Metalla Royalty and Smelting Ltd.
|
|
PAGE | 4-18 October 10, 2025 |
| MAYFAIR GOLD CORP.
|
| |
| National Instrument 43-101 Technical Report—Mineral Resource Estimate Update Fenn–Gib Project, Ontario, Canada |
Barrick Gold Corporation holds a back-in right to acquire a 51% interest in certain claims (as noted in Table 4-2) within the Fenn-Gib Project by paying Mayfair twice the expenditures made on the property and to advance the Fenn-Gib Project. This right is triggered if a NI 43-101 technical report demonstrates a mineral resource of at least 5 million ounces of gold on the relevant claims. This right expires on August 18, 2032.
| 4.7 | Permits |
There are two valid exploration permits in place on the Fenn–Gib North Block that includes mechanized drilling, Exploration Permit PR-23-000124 issued on June 14, 2023, and Exploration Permit PR-25-000120 issued on July 29, 2025. There are no active exploration permits on the Fenn–Gib South Block. All exploration permits are valid for a term of three years from the date of issue and issued pursuant to subsection 78.3(2) of the Mining Act, R.S.O. 1990, Chapter M.
| 4.8 | Environmental Liabilities and Social License |
The Fenn–Gib property benefits from straightforward permitting requirements, as it does not intersect with any federal lands, parks, or other land categories that would require additional special permits or complex negotiations. Surrounding First Nations communities hold traditional treaty rights to hunt, fish, trap, and harvest the land. An Exploration Agreement was signed between LSG and the Wahgoshig First Nation known as Apitipi Anicinapek Nation (AAN) on February 9, 2017; the agreement discusses the collaboration between the company and the Wahgoshig First Nation during exploration activities and has been transferred to Mayfair under the Asset Purchase Agreement with LSG.
Mayfair continues to consult and is working collaboratively with the AAN, under the terms of the Exploration Agreement, and expects to develop a Community–Company agreement to advance the Fenn–Gib Project.
The QP does not expect that Exploration Agreement or any other significant environmental liabilities would affect Mayfair’s access, title, or the right or ability to perform work on the property.
| 4.9 | Significant Risk Factors |
The QP did not independently verify the legality of any underlying agreement that may exist concerning the licences or other agreement between third parties but have instead relied on the client’s solicitors to have conducted the proper legal due diligence.
The QP is not aware of any other significant factors and risks that would affect Mayfair’s access, title, or the right or ability to perform work on the property.
|
|
PAGE | 4-19 October 10, 2025 |
| MAYFAIR GOLD CORP.
|
| |
| National Instrument 43-101 Technical Report—Mineral Resource Estimate Update Fenn–Gib Project, Ontario, Canada |
| 5 | ACCESSIBILITY, CLIMATE, LOCAL RESOURCES, INFRASTRUCTURE, AND PHYSIOGRAPHY |
| 5.1 | Accessibility |
The Property is easily accessible, east from Timmins, via Highway 101, which crosses the upper central part of the property. The highway links the provinces of Ontario and Quebec between the towns of Matheson and Duparquet; the highway becomes Autoroute 388 in the Province of Quebec. A few drill trails cross the property in a north–south direction.
| 5.2 | Climate |
Climatic conditions are continental; characterized by cold winters with snow, and warm summers with moderate precipitation. The temperature ranges between 11°C to 25°C during the summer and between -10°C to -25°C during the winter. July is the warmest month and January the coldest. Total precipitation ranges between 801 and 1,200 mm/a. The rainiest month is July, with an average of 92 mm, and January gets an average of 62 mm of snow. Exploration activities can be undertaken all year long. However, work is made difficult during transitional seasons where the ground is saturated with water from the melting snow in spring, and before winter when lakes are not frozen.
| 5.3 | Local Resources and Infrastructure |
The Project benefits from its location near multiple established mining centres, including Matheson (pop. 2,500) just 20 km west of the Project, and the larger mining hubs of Kirkland Lake (pop. 6,000), Timmins (pop. 41,000), and Rouyn-Noranda (pop. 42,000) all within a one hour drive, providing access to mining services, skilled labour, and supplies.
An Ontario Hydro 27 kV power-transmission line follows Highway 101 through the property; a high-voltage transformer station is located at Ramore, some 15 km to the southwest. Natural gas is available approximately 17.5 km away, and there is a compressed natural gas (CNG) station between Timmins and Matheson with a capacity of 10,000 GJ/d.
The Fenn–Gib Project is partially transected by Highway 101, which provides easy access to the Project. The highway is not viewed as an impediment or risk to development currently, but realignment of the highway may be required as part of future Project development.
In addition, the area is generally and intermittently covered by shallow sloughs and wetlands. Some streams and water bodies on site are considered fish habitat, as a few small-bodied fish were captured during surveys. Many streams are not well-defined channels and instead flow as braided surface water through wet, boggy forest. Studies to determine the flora and fauna that may be affected by potential mining operations and infrastructure are ongoing. However, it is not believed that these water bodies and features pose a risk to development. It is not believed there is any risk to access, permitting, or social license based on information available at this time.
|
|
PAGE | 5-1 October 10, 2025 |
| MAYFAIR GOLD CORP.
|
| |
| National Instrument 43-101 Technical Report—Mineral Resource Estimate Update Fenn–Gib Project, Ontario, Canada |
| 5.4 | Physiography |
The Fenn–Gib Project lies within the extensive Abitibi Clay Belt, a continuous flat-lying sheet of glaciolacustrine sediments deposited in glacial lakes Barlow and Ojibway as the Laurentide Ice Sheet receded during the Quaternary period approximately 10,000 years ago. A large glaciofluvial deposit, the Munro Esker, flanks the Project area on the east, rising about 40 m above the clay plain.
Averaging 315 m above sea level (masl), most of the Property is covered by dense alder swamp that supports a thin growth of poorly developed black spruce. Higher parts of the area support a mature growth of black spruce, jack pine, poplar, and white birch. Most of the timber on the Project site has little commercial value, but the esker’s well-drained sands and gravels support commercially valuable white pine stands. Differences in elevation are not more than 15 m throughout the Property.
| 5.5 | Sufficiency of Surface Rights |
Water resources are locally available, and the site has significant lakes and wetlands from which to service operations. Cellphone coverage extends to the property. Mayfair holds sufficient surface rights necessary for exploration activities, along with potential future mining operations.
|
|
PAGE | 5-2 October 10, 2025 |
| MAYFAIR GOLD CORP.
|
| |
| National Instrument 43-101 Technical Report—Mineral Resource Estimate Update Fenn–Gib Project, Ontario, Canada |
| 6 | HISTORY |
| 6.1 | Exploration History 1911–2011 |
Since its initial discovery and early exploration in 1911, the Fenn–Gib property has been explored and developed by various operators. In 2017 LSG carried out the last physical work prior to Mayfair’s acquisition on December 31, 2020. The primary sources of information referenced and paraphrased in this section are historical, with significant reliance on the findings presented in the 2011 SGS NI 43-101 Technical Report (Dagbert & Desharnais, 2011), which also referenced Pangea’s Fenn–Gib Drilling Report (Brown, 2002).
Figure 6-1 illustrates the position of various mineral showings on or around the Fenn–Gib Project. Table 6-1 summarizes the exploration activities conducted. Further details on the exploration history may be reviewed in Maunula (2023) and Dagbert & Desharnais (2011).
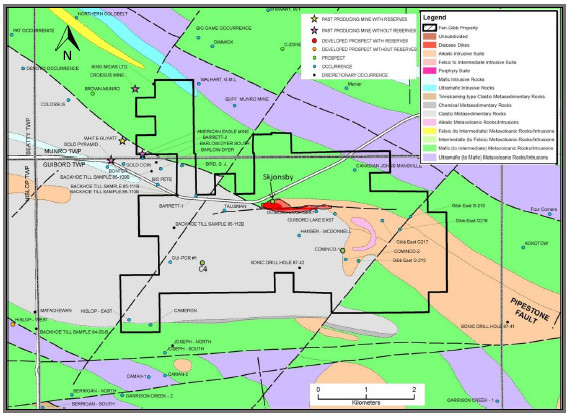
Source: SGS (2011)
Figure 6-1: Geological Map Illustrating Mineral Showings
|
|
PAGE | 6-1 October 10, 2025 |
| MAYFAIR GOLD CORP.
|
| |
| National Instrument 43-101 Technical Report—Mineral Resource Estimate Update Fenn–Gib Project, Ontario, Canada |
| Table |
6-1: Mineral Occurrences within the Fenn–Gib Project |
| Name |
Identifier |
Description |
Source Map |
Commodity | ||||
| American Eagle Mine | MDI42A09SE00018 | The shaft 0.03 km north and 2.2 km east of the southwest corner of Munro Township |
OGS 1980, P866 Munro TP | Gold | ||||
| Backhoe Till Sample 85-110B | MDI42A08NE00049 | Sample pit | OGS 1986 MAP 80-843 | Gold | ||||
| Backhoe Till Sample 85-111B | MDI42A08NE00050 | Sample pit | OGS 1986 MAP 80-843 | Gold | ||||
| Backhoe Till Sample 85-112B | MDI42A08NE00051 | Sample pit | OGS 1986 MAP 80-843 | Gold | ||||
| Barrett—1 | MDI42A09SE00155 | Diamond drill hole | OGS 1951 MAP 1951-6 Guibord | Gold, copper, zinc | ||||
| Bird, S. J. | MDI42A09SE00057 | Pit | OGS 1987 GDIF 399 Exploration Data Map | Gold | ||||
| C4 | NA | Several anomalous gold including 6.7 m at 7.1 g/t Au (C4-1A) | Rennick 2004 (Tandem Resources HW101) | Gold | ||||
| Cameron | MDI42A09SE00062 | Trenches & DDH | OGS 1987 GDIF 399 Exploration Data Map | Gold, zinc | ||||
| Canadian Johns Mansville | MDI42A09SE00193 | Stripped area | OGS 1987 GDIF 399 Exploration Data Map | Gold, copper | ||||
| Cominco-1 | MDI42A09SE00054 | Diamond drill hole (G80-1: 1.9 m at 5.4 g/t Au) | OGS 1987 GDIF 399 Exploration Data Map | Gold | ||||
| Cominco-2 | MDI42A09SE00187 | Point | OGS 1987, GDIF 399 Exploration Data Map | Gold, copper | ||||
| Gibb East G-213 | MDI000000000540 | DDH G-313 in assessment file KL-5295 | DDH G-213 | Gold | ||||
| Gibb East G-215 | MDI000000000539 | Diamond drill hole G-215 | DDH G-215 | Gold | ||||
| Gibb East G216 | MDI000000000541 | DDH G-216 in assessment file KL-5295 | DDH G-216 in file KL-5295 | Gold | ||||
| Gibb East G217 | MDI000000000542 | DDH G-217 in assessment file KL-5295 | DDH G-217 | Gold | ||||
| Guibord Lake East | MDI42A09SE00190 | Diamond drill hole 397 | OGS 1987 GDIF 399 Exploration Data Map | Gold, copper, zinc | ||||
| Guibord Lake West | MDI42A08SE00121 | Diamond drill hole #398 | OGS 1987 GDIF 399 Exploration Data Map | Gold, copper, lead, zinc | ||||
| GUI-POR#1 | MDI42A09SE00052 | Point | OGS 1987 GDIF 399 Exploration Data Map | Gold | ||||
| Hansen—Mcdonnell | MDI42A09SE00063 | Point | OGS 1987 GDIF 399 Exploration Data Map | Gold | ||||
| Hislop—East | MDI42A08SW00019 | Quartz vein | OGS 1956 MAP 1955-5 Township of Hislop | Gold | ||||
| Sonic Drill Hole 87-42 | MDI42A09SE00066 | Diamond drill hole 87-42 | OGS 1988 Map 81-119 | Gold | ||||
| Skjonsby | N/A | N/A | N/A | Gold | ||||
| Talisman | MDI42A09SE00188 | Shaft | OGS 1951 AR VOL 60 PT9 MAP 1951-6 Guibord | Gold, lead, silver |
Notes: Refer to Figure 6-1 for location.
Mainly compiled by the Ontario Ministry of Northern Development and Mines.
Source: Dagbert & Desharnais (2011)
|
|
PAGE | 6-2 October 10, 2025 |
| MAYFAIR GOLD CORP.
|
| |
| National Instrument 43-101 Technical Report—Mineral Resource Estimate Update Fenn–Gib Project, Ontario, Canada |
| 6.1.1 | Mineral Resource Estimate—2011 |
SGS completed a Mineral Resource estimate in 2011 that included 40.8 Mt grading 0.99 g/t Au in the Indicated category and 24.5 Mt at 0.95 g/t Au in the Inferred category (Dagbert & Desharnais, 2011). The Indicated and Inferred Mineral Resources are historical estimates and use the categories set out in NI 43-101, effective as of November 17, 2011. The 2011 SGS Mineral Resource estimate is not current and should not be relied upon.
| 6.2 | Exploration History 2012–2019 |
LSG carried out exploration between 2012 and 2019 as summarized in Table 6-2. Additional details regarding the programs and results can be found in Maunula (2023).
Tahoe Resources Inc. (Tahoe Resources) acquired LSG as a subsidiary on February 10, 2016. Pan American Silver Corp. (Pan American) bought Tahoe Resources on February 12, 2019, and LSG became its subsidiary.
| Table | 6-2: LSG and Tahoe Exploration Activities |
| Year |
Company |
Description | ||
| 2012 | LSG | Diamond drill program: 34 drill holes totalling 15,802 m | ||
| LSG | Reconnaissance mapping and prospecting: 291 field samples | |||
| 2014 | LSG | Outcrop investigation and prospecting: 14 samples | ||
| 2017 | Tahoe | Definition diamond drill programs: 80 drill holes, 32,1013 m and 4 drill holes, 2,589 m | ||
| Tahoe | Exploration diamond drill program: 14 drill holes, 5,653 m | |||
| Tahoe | Metallurgical testwork: 14 composite samples from 1⁄2 cut NQ drill core | |||
Source: TMAC (2024)
| 6.3 | Exploration Targets |
Tahoe Resources carried out a desktop review for LSG on several early-stage exploration targets on the Fenn–Gib Project, including American Eagle, G-101, Central Syenite, Horseshoe Zone, Canamax Zone, Perry Lake Prospect, and South Block (Brace et al., 2017). The location of the exploration targets on the Fenn–Gib Project is shown in Figure 6-2. Details for the exploration targets are provided in Maunula (2023).
|
|
PAGE | 6-3 October 10, 2025 |
| MAYFAIR GOLD CORP.
|
| |
| National Instrument 43-101 Technical Report—Mineral Resource Estimate Update Fenn–Gib Project, Ontario, Canada |
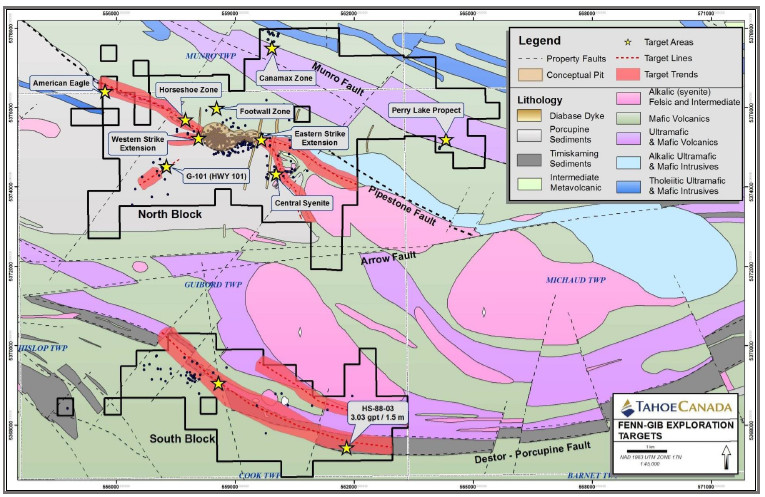
Source: Brace et al. (2017)
Figure 6-2: Project Geology Showing Exploration Targets
|
|
PAGE | 6-4 October 10, 2025 |
| MAYFAIR GOLD CORP.
|
| |
| National Instrument 43-101 Technical Report—Mineral Resource Estimate Update Fenn–Gib Project, Ontario, Canada |
| 6.4 | Acquisition by Mayfair Gold—2020 |
On June 8, 2020, the Company entered into a binding asset purchase agreement with LSG for the Fenn–Gib Project. Under the terms of the agreement, Mayfair Gold agreed to acquire 21 fee simple patented properties, 144 unpatented mining claims, and 153 patented leasehold mining claims located in the Guibord, Munro, Michaud, and McCool Townships in northeast Ontario. The Company assumed 100% ownership of the Fenn–Gib Project on December 31, 2020, and commenced exploration in mid-January 2021.
| 6.5 | Historical Mineral Resource Estimates Commissioned by Mayfair Gold |
Between 2020 and 2023 the Company commissioned three Mineral Resource updates on the Fenn–Gib Project:
| 1. | An open pit-constrained NI 43-101 Mineral Resource estimate dated February 5, 2021, which reported a total Indicated Mineral Resource of 70.2 Mt containing 2.08 Moz of gold grading 0.921 g/t Au, and an Inferred Mineral Resource of 3.8 Mt containing 75,000 oz of gold grading 0.618 g/t Au at a 0.35 g/t Au cut-off grade (Kirkham et al., 2021). The 2021 Mineral Resource estimate is not current and should not be relied upon. |
| 2. | An updated NI 43-101 Mineral Resource estimate of an open pit constrained Indicated Mineral Resource of 118.07 Mt containing 3.06 Moz of gold grading 0.81 g/t Au, and an Inferred Mineral Resource of 13.8 Mt containing 0.31 Moz of gold grading 0.70 g/t Au at a 0.35 g/t Au cut-off grade (Mayfair Gold, October 2022). The 2022 Mineral Resource estimate is not current and should not be relied upon. |
| 3. | The Mineral Resources for the Fenn–Gib Project within a 50° constrained open pit at a 0.4 g/t Au cut-off grade were: Indicated Resource of 113.7 Mt at 0.93 g/t Au; and an Inferred Resource of 5.7 Mt at 0.85 g/t Au with an effective date of April 6, 2023 (Maunula, 2023). The 2023 Mineral Resource estimate is not current and should not be relied upon. |
|
|
PAGE | 6-5 October 10, 2025 |
| MAYFAIR GOLD CORP.
|
| |
| National Instrument 43-101 Technical Report—Mineral Resource Estimate Update Fenn–Gib Project, Ontario, Canada |
| 7 | GEOLOGICAL SETTING AND MINERALIZATION |
This section is largely summarized from Pangea drilling reports (Brown, 2002; Marchand, 1996).
| 7.1 | Regional Geology |
The Fenn–Gib Project is in the southern portion of the Abitibi Subprovince, which is part of the Superior Province of the Canadian Shield. The Abitibi Subprovince is principally composed of volcanic and sedimentary assemblages that have generally been metamorphosed to greenschist facies and intruded by late tectonic plutons of tonalite and trondhjemite affinity. The Project area is underlain by rocks of the Hoyle Assemblage (sedimentary) and the Kidd–Munro Assemblage (volcanic) and lies on the northern portion of the Blake River Synclinorium and approximately 2 km north of the of the Porcupine–Destor Fault (Figure 7-1).
The main structural features of the area are the Blake River Synclinorium, the Porcupine–Destor Fault Zone and the Cadillac–Larder Lake Fault Zone. The fault zones are respectively located on the north and south limbs of the synclinorium. These structures were formed during the Kenoran Orogeny, a period of north–south compression. It appears that all known major gold deposits in the southern Abitibi are located within a few kilometres of these two fault zones.
Within the vicinity of the Fenn–Gib Project the Porcupine–Destor Fault Zone occurs as a Z-shaped sigmoidal structure that splits into three branches. Both extremities of the Z-shaped structure are east–west trending, while the central portion is more southeasterly trending. Due to poor exposure, the sense and magnitude of displacement along the structure in the Fenn–Gib Project area is unknown but based on more regional information it is thought to be mainly vertical. In the Timmins area where it is well exposed, a sinistral strike-slip movement with a vertical component is reported, whereby the south block moved up relative to the north block (Berger, 2002).
| 7.2 | Project Geology |
The Project is underlain by the dominantly volcanic Kidd–Munro assemblage to the north and the dominantly sedimentary Hoyle assemblage to the south. The two sequences are juxtaposed along the Contact Fault, an east–west to southeast trending shear zone, which is interpreted to be a splay of the Porcupine–Destor Fault Zone. Within the deposit, the Contact Fault is characterized by brittle deformation accompanied by intense carbonatization and silicification. Rocks from both assemblages were intruded by a variety of late intrusive rock including syenite and granitoid plugs and dykes, lamprophyre dykes, and diabase dykes. A 3 km-long, by 100 to 200 m-wide mafic intrusive complex intrudes the Kidd–Munro Assemblage at or near its southern contact.
|
|
PAGE | 7-1 October 10, 2025 |
| MAYFAIR GOLD CORP.
|
| |
| National Instrument 43-101 Technical Report—Mineral Resource Estimate Update Fenn–Gib Project, Ontario, Canada |
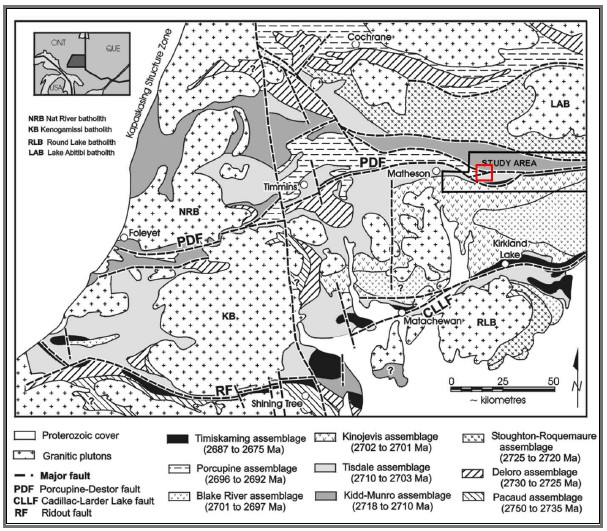
Note: The location of the Fenn–Gib Project is shown by the red square.
Source: Berger (2002)
Figure 7-1: Regional Geology of the Timmins Area
All lithologic units in and adjacent to the Deformation Zone are moderately to intensely altered. This alteration persists for a distance north and south of the fault, outlining a major alteration halo at least 2 km long and 500 m wide. A variety of alteration styles occur within the broad alteration halo, including silicification, albitization, potash metasomatism, carbonatization, sericitization, chloritization, and hematization. Fuchsite (Mariposite) can occur within the Deformation Zone. Sulphide mineralization, mainly pyrite, occurs as disseminations and fracture fillings in concentrations ranging from trace to 20% in association with the more strongly altered areas. Gold is commonly associated with the sulphide mineralization, especially in areas of coincident silicification and albitization.
|
|
PAGE | 7-2 October 10, 2025 |
| MAYFAIR GOLD CORP.
|
| |
| National Instrument 43-101 Technical Report—Mineral Resource Estimate Update Fenn–Gib Project, Ontario, Canada |
Several styles of gold mineralization have been identified within the Fenn–Gib Project area. The most common style consists of quartz–carbonate veins, stringers, and breccias hosted within intensely altered volcanic rocks and granitoid intrusions (i.e., the Main Zone and Deformation Zone). A second style is characterized by gold associated with intensely altered sediments, containing variable amounts of fine crystalline pyrite within and in the hanging wall to the Deformation Zone. A third style involves gold mineralization related to alteration, shearing, and sulphide mineralization within north-northeast-trending structures including the Main Zone, Deformation Zone, and Footwall Zone.
| 7.3 | Mineralization |
Significant concentrations of gold mineralization on the Fenn–Gib Project primarily occur within two zones: the Main Zone and the Deformation Zone. These two zones overlap and are shown in Figure 7-2. The third zone, Footwall Zone, also contains gold mineralization and is approximately 100 m north of the Main Zone.
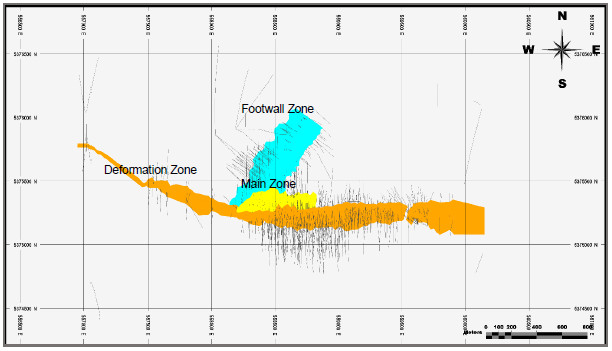
Source: Maunula (2024)
Figure 7-2: Plan View of Mineralized Envelopes
The Main Zone is a broad zone of disseminated gold mineralization up to 500 m wide, with grades for gold between 0.50 and 3.00 g/t Au. Massive, pillowed, and variolitic basalts crop out and can be seen in diamond drill core from holes collared near Highway 101. Hydrothermally altered variolitic basalts are the principal hosts of the Main Zone mineralization. These basalts were affected by pervasive and vein silicification, carbonatization, albitization, pervasive but weak hematization, and vein sericitization. Syenite and lamprophyre dykes intruded the basalts and are locally mineralized. Pyrite is the main sulphide mineral and occurs as disseminations and in veins, locally up to 50%, over narrow intervals (average 5% to 10%).
|
|
PAGE | 7-3 October 10, 2025 |
| MAYFAIR GOLD CORP.
|
| |
| National Instrument 43-101 Technical Report—Mineral Resource Estimate Update Fenn–Gib Project, Ontario, Canada |
The Deformation Zone contains narrower and higher-grade intersections associated with altered sediments, intermediate dykes, and grey syenite. Gold mineralization is associated with pyrite either in quartz-healed breccias or as very fine disseminations. The Contact Fault has been interpreted to have acted as a channel for gold-bearing hydrothermal fluids and is host to the Deformation Zone and the southern boundary of the Main Zone. The Deformation Zone mineralization has been defined for approximately 2.0 km along strike.
The Footwall Zone is north of the Main Zone (Figure 7-2). The Footwall Zone’s structural and mineralized corridor strikes in a north easterly direction, and drilling has intercepted the zone over a strike length of approximately 500 m and a vertical depth of about 600 m below surface (open in all directions). The Footwall Zone consists of multiple mineralized zones hosted primarily in the footwall mafic volcanic assemblage, with a steep northerly dip. Mineralization consists of bleached, buff-altered (silica-albite-sericite-carbonate alteration), pillowed mafic volcanic with pyrite ranging from 2% to over 20%.
| 7.4 | Prospects and Exploration Targets |
A diatreme breccia was encountered in diamond drill core in the southeast part of the property; see Cominco showings in Figure 6-1. This breccia is associated with anomalous gold mineralization and represents another exploration target on the Fenn–Gib Project. Rocks in this area are ultrapotassic, pseudoleucite-bearing, and associated with fluorite.
Two historical mines were operated in the early 1900s within quartz–carbonate veins in the Hoyle sediments (Talisman and American Eagle on Figure 6-1).
|
|
PAGE | 7-4 October 10, 2025 |
| MAYFAIR GOLD CORP.
|
| |
| National Instrument 43-101 Technical Report—Mineral Resource Estimate Update Fenn–Gib Project, Ontario, Canada |
| 8 | DEPOSIT TYPES |
Four major types of gold deposits are recognized in the Abitibi-Greenstone Belt (which is within the Abitibi Subprovince)—Robert and Poulsen (1997) identified three major types and Berger and Amelin (1998) have suggested a fourth. In order of the timing of development, these deposit types are: synvolcanic and synsedimentary deposits, syenite-associated deposits, syntectonic mesothermal vein deposits, and remobilized post-tectonic vein deposits.
Synvolcanic deposits include volcanogenic massive sulphide-related gold deposits with ocean floor alteration and replacement facies, represented primarily by the Horne Deposit in Quebec. Synsedimentary gold deposition is considered to be a key factor in the localization of gold at the Aunor and Dome Deposits in the Timmins camp. These early mineralizing events have drawn attention to the role of volcanic and sedimentary processes.
Syntectonic plutons, intruded near regional-scale shear zones, became the focus of exploration and research due to their close spatial relationships with some gold deposits. Mineralizing fluids are interpreted to have been derived from the plutons during emplacement. Numerous examples of this type of deposit can be found in the Abitibi, including at least one phase of mineralization at the Aunor and Dome Deposits, as well as deposits associated with the Bourlamaque pluton of the Val D’Or district, the Kerr–Addison Deposit, the Hollinger McIntyre Deposit, the Holt McDermott Deposit, and the Holloway Deposit. The Fenn–Gib Deposit is best represented by this model.
Mesothermal syntectonic vein deposits are associated with carbonate–albite–tourmaline veins, which crosscut the regional foliation. The deposits are thought to have developed syntectonically, based on structural relationships, with deep crustal fluids that used the active shear zones as conduits, contemporaneous with orogenesis and peak metamorphism. Examples of such deposits include the Camflo Mine and the Sigma Mine.
A fourth, less-common type of deposit occurs as quartz veins with north–south strikes and moderate dips and is thought to be due to a remobilization of gold-bearing fluids along north–south fractures (Berger & Amelin, 1998). These deposits crosscut regional fabrics and formed late in the area’s tectonic history. The Croesus Mine, perhaps the highest-grade deposit in the Abitibi, is thought to be one such deposit. This historical mine is less than 4 km northwest of the Fenn–Gib Deposit, within the volcanic rocks of the Kidd–Munro assemblage.
In the case of synvolcanic and syenite-associated deposits, the fluids were most likely derived from magmatic activity. For the syntectonic mesothermal vein deposits, fluids may have been metamorphic fluids from the deep crust. The literature suggests that there were at least three phases of gold introduction into the Abitibi: synsedimentary and synvolcanic introduction of gold, followed by intrusion-related gold mineralization, and a final metamorphism-related mineralizing event (Dubé & Mercier-Langevin, 2020).
|
|
PAGE | 8-1 October 10, 2025 |
| MAYFAIR GOLD CORP.
|
| |
| National Instrument 43-101 Technical Report—Mineral Resource Estimate Update Fenn–Gib Project, Ontario, Canada |
| 9 | EXPLORATION |
From 1911 through 2019, several operators undertook exploration programs on the Fenn–Gib property, consisting primarily of diamond drill programs, geophysical surveys, and limited shaft sinking and underground drifting, as reported by Satterly (1951) and Talisman (Bath, 1990) prospects. In 1988, Corona Corporation drilled discovery hole FE88-10 near the eastern boundary of the Fenn Property, at the core of what is now the Fenn–Gib Deposit. This hole penetrated a 222.51 m section of altered volcanics that averaged 1.63 g/t Au. Additional information on historical exploration activities prior to 2019 is provided in Section 6.
| 9.1 | Diamond Drilling |
The Company acquired the Fenn–Gib Project on December 31, 2020, and initiated an infill and expansion resource drilling program on the Fenn–Gib Deposit on the North Block in mid-January 2021. The Fenn–Gib Deposit extends over a strike length of more than 1.5 km, with widths exceeding 500 m. In addition to ongoing drilling at the Fenn–Gib Deposit, exploration is continuing on the Footwall Zone, northwest of the main deposit. Gold mineralization in both the Fenn–Gib Deposit and Footwall Zone remain open in all directions. To date the Company has completed 190,138 m of NQ core drilling in 339 drill holes within the Fenn–Gib North Block (Figure 9-1).
| 9.2 | Mayfair Gold—2021–Present |
| 9.2.1 | Geochemistry |
Surface work on the North Block included an orientation soil and vegetation sample mobile-metal-ion (MMI) and soil-gas hydrocarbons (SGH) test sampling program during 2022, which Aurora Geosciences Ltd. (Aurora) carried out under contracted with SGH processing (Brown & Sutherland, 2022) completed at Activation Laboratories Ltd. in Ancaster, Ontario, and MMI processing completed at SGS Laboratories in Burnaby, B.C. (Aurora Geosciences, 2023).
| 9.2.2 | Geophysical Surveys |
Aurora conducted a direct current (DC) resistivity-induced polarization (IP) survey for the Company on the North Block’s Grid A and Grid B of the Fenn–Gib Project (Jelenic, 2023). Grid A consisted of 66 north–south IP lines totalling 102.55 line-km, and Grid B consisted of 27 northwest–southeast IP lines totalling 29.45 line-km. Aurora completed the work on Grid A using two deployments from October 5, 2022, to January 15, 2023, and the work on Grid B was completed in two deployments from April 4 to May 14, 2023. The survey used a pole–dipole electrode array with 50 m dipoles for Grid A and 25 m dipoles for Grid B.
|
|
PAGE | 9-1 October 10, 2025 |
| MAYFAIR GOLD CORP.
|
| |
| National Instrument 43-101 Technical Report—Mineral Resource Estimate Update Fenn–Gib Project, Ontario, Canada |
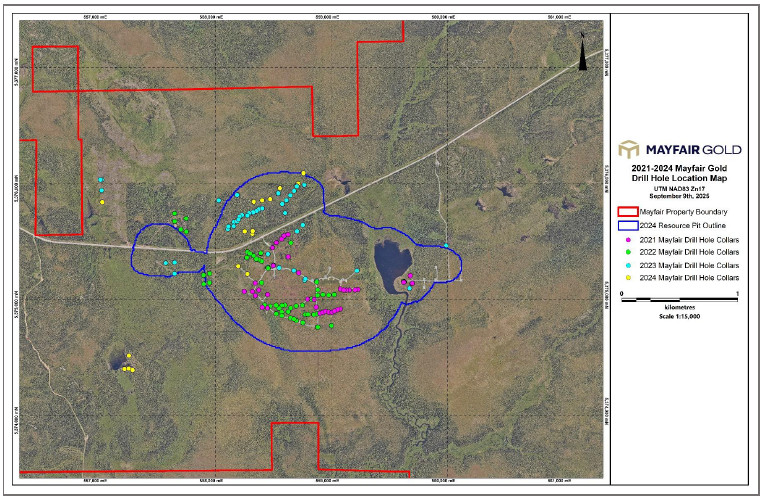
Source: Mayfair (2025)
Figure 9-1: Fenn–Gib North Block Mayfair Gold Drill Hole Locations
|
|
PAGE | 9-2 October 10, 2025 |
| MAYFAIR GOLD CORP.
|
| |
| National Instrument 43-101 Technical Report—Mineral Resource Estimate Update Fenn–Gib Project, Ontario, Canada |
In 2021 the Company contracted SHA Geophysics Ltd. (SHA) to carry out a Heli-GT helicopter-towed, three-axis magnetic gradiometer survey over the North and South property blocks (Munro, 2021). During April 7 to 12, 2021, a total of 1,751 km of data was collected. The two property blocks were each surveyed in two orthogonal directions, for a total of four individual surveys. The North Block was flown at headings of 60° and 330° (N060 and N330); the South Block was flown at headings of 80° and 350° (S080 and S350).
| 9.2.3 | Other |
LiDAR and aerial photography acquisition was contracted to McElhanney of Vancouver, B.C., over both the Fenn–Gib Project North and South Blocks; the survey was flown on June 10, 2022 (McElhanney, 2022).
|
|
PAGE | 9-3 October 10, 2025 |
| MAYFAIR GOLD CORP.
|
| |
| National Instrument 43-101 Technical Report—Mineral Resource Estimate Update Fenn–Gib Project, Ontario, Canada |
| 10 | DRILLING |
| 10.1 | Historical Drilling |
The Fenn-Gib Project benefits from extensive historical exploration, with previous owners and operators completing 586 drill holes totaling 169,702.51 m. The historical drill holes were predominately BQ and NQ diameter drill holes prior to 2011 and then primarily NQ diameter drill holes for the 2011–2012 and 2017 campaigns. Pangea Goldfields Inc. (Pangea) completed drilling on the Fenn–Gib Deposit in the mid to late 1990s and LSG in 2011–2012 and in 2017. Other operators or joint-venture partners included NAR Resources Ltd., Tandem Resources Ltd., Lacana Mining Corp., Corona Gold Corporation, Normina Mineral Development Corporation, and Tahoe Resources Inc. Of the 586 drill holes on the Fenn–Gib Project from historical drill campaigns by several operators, 457 drill holes have been used for the 2024 Mineral Resource estimate.
| 10.2 | Mayfair Gold Drilling |
Table 10-1 summarizes Mayfair Gold’s drilling campaigns completed as of the June 20, 2025. The Company completed an additional 27 drill holes totaling 11,503.6 m after the April 30, 2024, cut-off date used for this Mineral Resource estimate. The drilling program also includes an additional 21 regional drill holes which are part of Mayfair Gold’s property exploration.
Table 10-1: Mayfair Gold Drill-Hole Summary by Year
| Year |
As of April 30, 2024 Cut-off Date |
Total Fenn–Gib Drill Holes | ||||||
| No. of Holes |
Metres |
No. of Holes |
Metres | |||||
| 2021 | 90 | 54,936.70 | 90 | 54,936.70 | ||||
| 2022 | 97 | 54,482.05 | 118 | 61,996.55 | ||||
| 2023 | 89 | 54,975.50 | 89 | 54,975.50 | ||||
| 2024 | 15 | 14,630.10 | 42 | 18,229.30 | ||||
|
|
|
|
| |||||
| Total | 291 | 179,024.35 | 339 | 190,138.05 | ||||
|
|
|
|
| |||||
Source: Maunula (2024)
Note: MRE = Mineral Resource estimate
Figure 10-1 shows the plan view of the drill holes used in the MRE of the Fenn–Gib Project.
|
|
PAGE | 10-1 October 10, 2025 |
| MAYFAIR GOLD CORP.
|
| |
| National Instrument 43-101 Technical Report—Mineral Resource Estimate Update Fenn–Gib Project, Ontario, Canada |
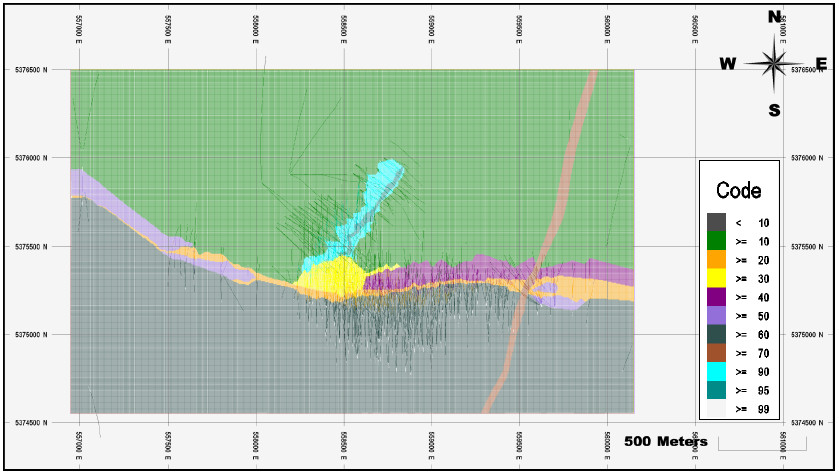
Source: Maunula (2024)
Figure 10-1: Plan of Drill-Hole Locations used for the Fenn–Gib Mineral Resource Estimate
|
|
PAGE | 10-2 October 10, 2025 |
| MAYFAIR GOLD CORP.
|
| |
| National Instrument 43-101 Technical Report—Mineral Resource Estimate Update Fenn–Gib Project, Ontario, Canada |
| 10.3 | Diamond Drilling Procedures |
| 10.3.1 | Spotting Drill Holes |
As of January 2021, Mayfair geologists spot drill-hole collar locations referenced to UTM 17N by using a hand-held Garmin GPS using the NAD 83 geodetic datum. A wooden stake is left in the ground at the collar location and marked with flagging tape labelled with the drill-hole identification, and the planned azimuth, dip, and depth. The location and drill-hole information are reviewed and confirmed with the drilling supervisor.
| 10.3.2 | Drilling |
Since January 2021, drilling on the Fenn–Gib Project has been carried out primarily by Major Drilling Group International (Major Drilling). Northtech Drilling completed a limited number of holes during the summer–winter 2021 period, and Full Force Drilling contributed additional drilling in the summer of 2022.
| • | Drilling was completed with the use of diamond drill rigs. Most of the core was drilled as NQ size. Only a handful of holes drilled on the South Block and part of one hole from the North Block were HQ size. |
| • | Core was placed in core boxes. Wood blocks are placed after each drill run labelled with the corresponding downhole depth in metres. |
| • | Core boxes were labelled with the drill-hole identification name and number in numerical sequence starting from the beginning of the hole to the end. A lid was placed on the core box and sealed at both ends with tape. |
| • | Either the Drilling Foreperson delivered the core to the Mayfair Gold Matheson Exploration office or the Mayfair employees picked up the core at the drill rig location, to take it back to the office. |
| • | Once drilling was completed, the casing was left in the ground (unless instructed otherwise by Mayfair geologists). The casing was capped. Affixed to the cap was roughly a 1 m-long metal flag post. |
| • | Once drilling was completed, and the drill rig moved off the collar location, the Mayfair geologists conduct a post-drill site inspection. |
| 10.3.3 | Collar Surveys |
All drill-hole collar locations drilled from January 2021 to present have been professionally surveyed or surveyed using a hand-held Garmin GPS.
Initially, Mayfair geologists or geo-technicians survey the collar locations with a hand-held Garmin GPS. A final professional survey is completed for each collar location. This professional survey is done periodically throughout the drilling program. To date, Mayfair has used Talbot Survey Inc. to complete the final professional collar location surveys.
|
|
PAGE | 10-3 October 10, 2025 |
| MAYFAIR GOLD CORP.
|
| |
| National Instrument 43-101 Technical Report—Mineral Resource Estimate Update Fenn–Gib Project, Ontario, Canada |
Please note that the final professional survey data replaces the location data collected by the hand-held Garmin GPS. Data regarding the collar survey method is recorded in the drill-hole database.
| 10.3.4 | Downhole Surveys |
As of January 2021, Mayfair Gold is using the following tools: REFLEX TN14 GYROCOMPASS, REFLEX EZ-GYRO, and the REFLEX GYRO SPRINT-IQ. Aurora Geoscience completed a small drilling program on the South Block during summer 2022 using the REFLEX EZ-TRAC for downhole surveys.
The driller and driller’s assistant collect downhole survey data during the drilling process. Imdex Limited provided training on these tools.
| • | The TN14 GYROCOMPASS was used to align the drill to the planned azimuth and dip as specified by Mayfair geologists. |
| • | Rule of thumb for TN14 test approval was less than 1 degree of deviation on the azimuth or dip. |
| • | Exceptions to larger than 1-degree deviations were made; however, this was up to the discretion of Mayfair geologists. |
| • | For the first approximately 150 m of drilling, after casing, the EZ-GYRO tool was used at 50 m intervals to monitor the azimuth and dip. These tests were sent to the Mayfair geologists for approval (via text and by uploading to the ImdexHUB-IQ website). |
| • | The first test was taken after casing. Drillers were instructed to wait for approval from the Mayfair geologists before continuing drilling. |
| • | Rule of thumb for approval was a less-than-2-degree deviation on the azimuth or dip. |
| • | Exceptions to a larger-than-2-degree deviation were made; however, this was at the discretion of Mayfair geologists. |
| • | After about 150 m of drilling past casing, no other downhole tests were taken to monitor the azimuth and dip. |
| • | Once drilling was complete, a finalized downhole survey test was taken. This final test was completed with the GYRO SPRINT-IQ tool. Continuous tests were taken at 3–5 m intervals as the tool was lowered down the hole (IN-Test) and as it was brought back up the hole (OUT-Test). There have been a handful of drill holes where only the EZ-GYRO tool was used at 50 m intervals for the entire length of the drill hole. |
| 10.3.5 | Geotechnical and Hydrological Drilling |
ALS Limited’s GeoticLog 8.2.14 (GeoticLog) is the software that Mayfair uses to record all geotechnical and geological logging data.
| • | Mayfair geologists complete or supervise geotechnical logging at the Matheson Exploration site. |
| • | Core is measured into 1 m intervals between the wooden metre blocks the drillers insert as reference. |
|
|
PAGE | 10-4 October 10, 2025 |
| MAYFAIR GOLD CORP.
|
| |
| National Instrument 43-101 Technical Report—Mineral Resource Estimate Update Fenn–Gib Project, Ontario, Canada |
| • | From and to metreage of intervals with the same or similar rock quality designation (RQD) are broken out and recorded in GeoticLog. Within the given RQD interval, the sum of all pieces of core that are longer than 10 cm is recorded in GeoticLog. GeoticLog will calculate the RQD percentage. |
| • | Photographs are taken of the wet core after it has been measured. Core photographs are stored on Mayfair’s server. |
Mayfair Gold geologists complete geological logging at the Matheson Exploration site.
| • | Major geological intervals are broken out. From and to metreage, and detailed descriptions are recorded in GeoticLog. |
| • | Major Lithology intervals should be 2 m or more long. Intervals that are less than 2 m long are to be broken out in the Minor Lithology section in GeoticLog. |
| • | There are situations where including a Major Lithology interval that is <2 m long is acceptable; this is at the discretion and critical thinking of the geologist. |
| • | Within the boundaries of each Major Lithology interval, the following data are recorded in GeoticLog: alteration present and its intensity; pyrite percentage and the style of pyrite mineralization; any other sulphide minerals present and their percentage; structures present; veining present. |
To ensure data integrity, drill-hole data is automatically locked upon completion of logging. Any subsequent modifications require authorization from the database manager, maintaining a secure chain of custody for all geological data. Summary of Drill Intercepts.
Table 10-2 summarizes the significant drill-hole intersections encountered in the Mayfair Gold drill holes. Subintervals contained within a primary intersection are italicized in Table 10-2.
Table 10-2: Significant Drill-Hole Intersections
| Hole |
From (m) |
To (m) |
Length (m) |
Au (g/t) | ||||||
| FG23-304 |
336.00 | 361.90 | 25.90 | 1.46 | ||||||
| including |
336.00 | 337.00 | 1.00 | 14.32 | ||||||
| and |
345.50 | 349.00 | 3.50 | 3.00 | ||||||
| and |
360.00 | 361.90 | 1.90 | 5.88 | ||||||
| 387.30 | 389.60 | 2.30 | 2.49 | |||||||
| 435.50 | 437.50 | 2.00 | 2.20 | |||||||
| FG23-300 |
334.80 | 351.00 | 16.20 | 2.05 | ||||||
| including |
334.80 | 341.00 | 6.20 | 3.72 | ||||||
| including |
334.80 | 336.00 | 1.20 | 4.10 | ||||||
| 338.00 | 339.00 | 1.00 | 9.61 | |||||||
| 340.10 | 341.00 | 0.90 | 6.76 | |||||||
| and |
349.00 | 351.00 | 2.00 | 2.26 |
|
|
PAGE | 10-5 October 10, 2025 |
| MAYFAIR GOLD CORP.
|
| |
| National Instrument 43-101 Technical Report—Mineral Resource Estimate Update Fenn–Gib Project, Ontario, Canada |
| Hole |
From (m) |
To (m) |
Length (m) |
Au (g/t) | ||||||
| FG23-311 |
58.30 | 61.20 | 2.90 | 0.87 | ||||||
| 145.00 | 163.00 | 18.00 | 1.15 | |||||||
| including |
145.00 | 148.00 | 3.00 | 5.98 | ||||||
| including |
145.00 | 146.00 | 1.00 | 14.57 | ||||||
| FG23-313 |
198.00 | 203.00 | 5.00 | 1.41 | ||||||
| including |
198.00 | 200.00 | 2.00 | 2.48 | ||||||
| including |
199.00 | 200.00 | 1.00 | 3.60 | ||||||
| FG23-314 |
73.00 | 81.00 | 8.00 | 2.19 | ||||||
| including |
80.00 | 81.00 | 1.00 | 13.48 | ||||||
| 174.00 | 191.10 | 17.10 | 2.19 | |||||||
| including |
174.00 | 176.00 | 2.00 | 13.67 | ||||||
| and |
188.40 | 189.30 | 0.90 | 4.66 | ||||||
| 382.00 | 383.00 | 1.00 | 2.32 | |||||||
| FG23-318 |
24.40 | 25.20 | 0.80 | 3.53 | ||||||
| 122.80 | 131.00 | 8.20 | 1.94 | |||||||
| including |
125.00 | 131.00 | 6.00 | 2.47 | ||||||
| including |
125.00 | 128.00 | 3.00 | 4.40 | ||||||
| FG23-323 |
61.50 | 62.90 | 1.40 | 1.93 | ||||||
| 121.00 | 122.00 | 1.00 | 4.21 | |||||||
| 184.50 | 186.00 | 1.50 | 2.86 | |||||||
| 198.10 | 218.00 | 19.90 | 1.34 | |||||||
| including |
198.10 | 206.00 | 7.90 | 2.59 | ||||||
| including |
198.10 | 199.00 | 0.90 | 11.73 | ||||||
| FG23-326 |
48.00 | 49.00 | 1.00 | 1.72 | ||||||
| 149.20 | 151.40 | 2.20 | 1.17 | |||||||
| 180.00 | 188.00 | 8.00 | 3.67 | |||||||
| including |
180.00 | 184.20 | 4.20 | 6.47 | ||||||
| including |
181.30 | 182.20 | 0.90 | 19.89 | ||||||
| 205.30 | 206.40 | 1.10 | 2.81 | |||||||
| FG23-328 |
104.00 | 105.50 | 1.50 | 15.65 | ||||||
| 164.40 | 165.60 | 1.20 | 2.06 | |||||||
| 174.00 | 181.00 | 7.00 | 7.94 | |||||||
| including |
175.80 | 177.00 | 1.20 | 11.99 | ||||||
| and |
178.60 | 181.00 | 2.40 | 16.20 | ||||||
| FG23-330 |
24.00 | 24.50 | 0.50 | 3782.70 | ||||||
| 51.00 | 52.00 | 1.00 | 3.33 | |||||||
| 204.00 | 205.00 | 1.00 | 1.93 |
|
|
PAGE | 10-6 October 10, 2025 |
| MAYFAIR GOLD CORP.
|
| |
| National Instrument 43-101 Technical Report—Mineral Resource Estimate Update Fenn–Gib Project, Ontario, Canada |
| Hole |
From (m) |
To (m) |
Length (m) |
Au (g/t) | ||||||
| FG23-339 |
500.10 | 513.00 | 12.90 | 1.38 | ||||||
| including |
500.10 | 504.00 | 3.90 | 3.00 | ||||||
| 530.80 | 541.00 | 10.20 | 1.09 | |||||||
| 549.20 | 554.50 | 5.30 | 3.11 | |||||||
| 675.90 | 681.00 | 5.10 | 2.79 | |||||||
| including |
677.00 | 678.00 | 1.00 | 7.39 | ||||||
| FG23-343 |
554.40 | 558.00 | 3.60 | *2.08 | ||||||
| including |
554.40 | 555.40 | 1.00 | 4.43 | ||||||
| FG23-344A |
498.00 | 528.00 | 30.00 | 4.72 | ||||||
| including |
502.00 | 521.60 | 19.60 | 6.59 | ||||||
| including |
502.00 | 503.00 | 1.00 | 44.70 | ||||||
| and |
517.00 | 521.00 | 4.00 | 10.05 | ||||||
| FG23-345 |
461.00 | 510.50 | 49.50 | 1.44 | ||||||
| including |
461.00 | 463.50 | 2.50 | 9.20 | ||||||
| and |
488.50 | 491.50 | 3.00 | 2.92 | ||||||
| including |
505.00 | 506.00 | 1.00 | 4.36 | ||||||
| 555.00 | 561.00 | 6.00 | 1.43 | |||||||
| including |
555.00 | 557.00 | 2.00 | 2.25 | ||||||
| 590.40 | 596.00 | 5.60 | 1.18 | |||||||
| including |
590.40 | 592.80 | 2.40 | 2.05 | ||||||
| 694.90 | 700.30 | 5.40 | 2.47 | |||||||
| including |
697.00 | 698.20 | 1.20 | 8.99 | ||||||
| FG23-346 |
428.30 | 443.80 | 15.50 | 2.26 | ||||||
| including |
433.00 | 435.00 | 2.00 | 3.32 | ||||||
| and |
440.00 | 443.00 | 3.00 | 5.03 | ||||||
| 460.00 | 463.30 | 3.30 | 19.84 | |||||||
| including |
461.10 | 462.20 | 1.10 | 54.07 | ||||||
| FG23-347 |
466.00 | 467.00 | 1.00 | 3.83 | ||||||
| 476.80 | 478.00 | 1.20 | 4.80 | |||||||
| 483.00 | 484.50 | 1.50 | 2.59 | |||||||
| 511.00 | 545.00 | 34.00 | 0.83 | |||||||
| including |
529.00 | 531.00 | 2.00 | 1.75 | ||||||
| and |
538.00 | 543.00 | 5.00 | 1.90 | ||||||
| including |
541.50 | 543.00 | 1.50 | 3.76 | ||||||
| 592.50 | 626.00 | 33.50 | 1.28 | |||||||
| including |
592.50 | 595.50 | 3.00 | 4.90 | ||||||
| including |
593.50 | 594.50 | 1.00 | 9.97 | ||||||
| and |
622.00 | 626.00 | 4.00 | 3.34 | ||||||
| including |
622.00 | 623.00 | 1.00 | 7.90 |
|
|
PAGE | 10-7 October 10, 2025 |
| MAYFAIR GOLD CORP.
|
| |
| National Instrument 43-101 Technical Report—Mineral Resource Estimate Update Fenn–Gib Project, Ontario, Canada |
| Hole |
From (m) |
To (m) |
Length (m) |
Au (g/t) | ||||||
| FG23-348 |
514.00 | 517.00 | 3.00 | 1.10 | ||||||
| 622.00 | 624.30 | 2.30 | 6.44 | |||||||
| including |
623.00 | 624.30 | 1.30 | 9.30 | ||||||
| FG23-350A |
12.00 | 508.00 | 496.00 | 1.14 | ||||||
| including |
38.00 | 59.00 | 21.00 | 2.84 | ||||||
| and |
68.00 | 87.00 | 19.00 | 2.06 | ||||||
| and |
115.00 | 146.20 | 31.20 | 2.40 | ||||||
| including |
133.20 | 141.20 | 8.00 | 4.19 | ||||||
| and |
169.70 | 181.00 | 11.30 | 2.31 | ||||||
| and |
209.00 | 228.00 | 19.00 | 5.45 | ||||||
| and |
407.00 | 417.00 | 10.00 | 2.82 | ||||||
| 683.00 | 807.00 | 124.00 | 1.06 | |||||||
| including |
691.40 | 693.20 | 1.80 | 6.46 | ||||||
| and |
738.00 | 746.60 | 8.60 | 2.56 | ||||||
| including |
738.00 | 740.00 | 2.00 | 5.73 | ||||||
| and |
775.00 | 786.00 | 11.00 | 3.22 | ||||||
| including |
776.00 | 778.00 | 2.00 | 9.31 | ||||||
| 846.00 | 848.00 | 2.00 | 2.08 | |||||||
| 899.00 | 940.00 | 41.00 | 0.74 | |||||||
| 978.00 | 997.20 | 19.20 | 0.92 | |||||||
| FG23-351 |
372.50 | 374.50 | 2.00 | 5.92 | ||||||
| 403.20 | 420.00 | 16.80 | 2.19 | |||||||
| including |
404.20 | 411.20 | 7.00 | 3.28 | ||||||
| including |
405.20 | 410.20 | 5.00 | 3.60 | ||||||
| and |
413.20 | 415.20 | 2.00 | 3.21 | ||||||
| 434.00 | 448.50 | 14.50 | 1.29 | |||||||
| including |
434.00 | 435.20 | 1.20 | 3.10 | ||||||
| and |
447.00 | 448.50 | 1.50 | 5.39 | ||||||
| 727.50 | 780.00 | 52.50 | 0.67 | |||||||
| including |
727.50 | 728.00 | 0.50 | 2.90 | ||||||
| and |
734.00 | 736.00 | 2.00 | 3.00 | ||||||
| and |
779.00 | 780.00 | 1.00 | 2.21 | ||||||
| FG23-353 |
359.30 | 362.00 | 2.70 | 2.13 | ||||||
| 457.50 | 459.00 | 1.50 | 2.62 | |||||||
| 528.00 | 544.00 | 16.00 | 2.10 | |||||||
| including |
528.00 | 529.00 | 1.00 | 6.27 | ||||||
| and |
534.70 | 543.00 | 8.30 | 2.82 | ||||||
| including |
536.00 | 537.00 | 1.00 | 6.13 | ||||||
| and |
540.00 | 543.00 | 3.00 | 4.07 | ||||||
| 582.10 | 584.00 | 1.90 | 2.35 |
|
|
PAGE | 10-8 October 10, 2025 |
| MAYFAIR GOLD CORP.
|
| |
| National Instrument 43-101 Technical Report—Mineral Resource Estimate Update Fenn–Gib Project, Ontario, Canada |
| Hole |
From (m) |
To (m) |
Length (m) |
Au (g/t) | ||||||
| FG23-354 |
634.90 | 647.00 | 12.10 | 1.61 | ||||||
| including |
634.90 | 638.00 | 3.10 | 3.63 | ||||||
| and |
646.00 | 647.00 | 1.00 | 4.24 | ||||||
| FG23-356 |
21.20 | 944.00 | 922.80 | 0.75 | ||||||
| including |
145.90 | 184.00 | 38.10 | 1.14 | ||||||
| and |
523.00 | 944.00 | 421.00 | 1.16 | ||||||
| including |
580.00 | 801.00 | 221.00 | 1.69 | ||||||
| including |
612.00 | 635.00 | 23.00 | 2.40 | ||||||
| and |
654.00 | 664.00 | 10.00 | 12.42 | ||||||
| including |
655.00 | 656.50 | 1.50 | 76.12 | ||||||
| and |
709.00 | 710.00 | 1.00 | 26.25 | ||||||
| and |
781.00 | 788.00 | 7.00 | 3.88 | ||||||
| including |
781.00 | 782.00 | 1.00 | 23.24 | ||||||
| and |
795.00 | 801.00 | 6.00 | 2.33 | ||||||
| including |
795.00 | 796.00 | 1.00 | 9.74 | ||||||
| and |
857.00 | 858.00 | 1.00 | 43.61 | ||||||
| FG23-359 |
466.10 | 468.20 | 2.10 | 27.60 | ||||||
| 568.00 | 573.00 | 5.00 | 3.64 | |||||||
| including |
568.00 | 570.00 | 2.00 | 7.26 | ||||||
| 585.00 | 588.20 | 3.20 | 3.70 | |||||||
| including |
586.00 | 587.00 | 1.00 | 6.19 | ||||||
| FG23-361 |
173.00 | 175.70 | 2.70 | 1.96 | ||||||
| including |
173.00 | 173.70 | 0.70 | 6.17 | ||||||
| 461.20 | 463.50 | 2.30 | 16.47 | |||||||
| 469.50 | 470.00 | 0.50 | 4.18 | |||||||
| 484.10 | 489.10 | 5.00 | 2.19 | |||||||
| including |
485.00 | 486.00 | 1.00 | 5.26 | ||||||
| 632.50 | 638.50 | 6.00 | 1.88 | |||||||
| including |
637.00 | 638.50 | 1.50 | 4.56 | ||||||
| FG23-363 |
337.00 | 338.00 | 1.00 | 2.11 | ||||||
| 511.10 | 532.40 | 21.30 | 1.20 | |||||||
| including |
511.10 | 514.00 | 2.90 | 4.33 | ||||||
| FG23-366 |
391.50 | 392.50 | 1.00 | 2.21 | ||||||
| 524.70 | 526.00 | 1.30 | 4.28 | |||||||
| 594.50 | 597.40 | 2.90 | 6.23 | |||||||
| including |
595.70 | 596.60 | 0.90 | 15.80 | ||||||
| FG23-367 |
908.00 | 908.70 | 0.70 | 1.66 | ||||||
| FG23-368 |
505.50 | 507.40 | 1.90 | 2.87 | ||||||
| 558.50 | 568.50 | 10.00 | 3.14 | |||||||
| including |
558.50 | 559.50 | 1.00 | 15.94 |
|
|
PAGE | 10-9 October 10, 2025 |
| MAYFAIR GOLD CORP.
|
| |
| National Instrument 43-101 Technical Report—Mineral Resource Estimate Update Fenn–Gib Project, Ontario, Canada |
| Hole |
From (m) |
To (m) |
Length (m) |
Au (g/t) | ||||||
| FG23-370 |
548.00 | 549.00 | 1.00 | 2.91 | ||||||
| 566.00 | 566.70 | 0.70 | 2.07 | |||||||
| 586.00 | 597.00 | 11.00 | 0.85 | |||||||
| including |
586.00 | 587.00 | 1.00 | 2.91 | ||||||
| and |
595.50 | 597.00 | 1.50 | 2.11 | ||||||
| 658.00 | 692.40 | 34.40 | 0.79 | |||||||
| including |
658.00 | 677.00 | 19.00 | 1.06 | ||||||
| including |
658.00 | 659.00 | 1.00 | 3.23 | ||||||
| and |
667.00 | 667.70 | 0.70 | 3.04 | ||||||
| and |
674.00 | 676.00 | 2.00 | 2.90 | ||||||
| and |
687.00 | 692.40 | 5.40 | 1.00 | ||||||
| FG23-371 |
685.00 | 686.10 | 1.10 | 1.21 | ||||||
| FG23-372 |
334.50 | 336.00 | 1.50 | 7.24 | ||||||
| 506.00 | 515.00 | 9.00 | 1.12 | |||||||
| 560.60 | 572.00 | 11.40 | 2.26 | |||||||
| including |
563.60 | 568.60 | 5.00 | 4.07 | ||||||
| FG23-378 |
441.50 | 442.60 | 1.10 | 3.33 | ||||||
| 496.00 | 517.00 | 21.00 | 0.82 | |||||||
| including |
506.00 | 511.00 | 5.00 | 1.25 | ||||||
| 654.00 | 656.00 | 2.00 | 3.04 | |||||||
| 666.40 | 667.30 | 0.90 | 2.37 | |||||||
| 709.00 | 717.80 | 8.80 | 1.71 | |||||||
| including |
711.00 | 713.00 | 2.00 | 5.13 | ||||||
| FG24-385 |
261.40 | 332.40 | 71.00 | 0.88 | ||||||
| including |
296.70 | 325.00 | 28.30 | 1.40 | ||||||
| including |
296.70 | 298.50 | 1.80 | 19.81 | ||||||
| and |
315.00 | 316.00 | 1.00 | 3.24 | ||||||
| 360.00 | 364.00 | 4.00 | 2.37 | |||||||
| including |
363.00 | 364.00 | 1.00 | 5.95 | ||||||
| 408.10 | 417.00 | 8.90 | 2.01 | |||||||
| FG24-387 |
313.50 | 508.00 | 194.50 | 0.80 | ||||||
| including |
326.00 | 329.00 | 3.00 | 3.02 | ||||||
| and |
379.10 | 380.00 | 0.90 | 4.21 | ||||||
| and |
438.00 | 443.00 | 5.00 | 2.54 | ||||||
| and |
464.70 | 468.00 | 3.30 | 8.56 | ||||||
| including |
467.00 | 468.00 | 1.00 | 23.90 | ||||||
| and |
474.50 | 476.70 | 2.20 | 4.60 |
|
|
PAGE | 10-10 October 10, 2025 |
| MAYFAIR GOLD CORP.
|
| |
| National Instrument 43-101 Technical Report—Mineral Resource Estimate Update Fenn–Gib Project, Ontario, Canada |
| Hole |
From (m) |
To (m) |
Length (m) |
Au (g/t) | ||||||
| FG24-388 |
312.00 | 380.90 | 68.90 | 1.97 | ||||||
| including |
314.00 | 323.40 | 9.40 | 4.82 | ||||||
| including |
318.00 | 320.10 | 2.10 | 11.25 | ||||||
| and |
339.50 | 352.00 | 12.50 | 3.01 | ||||||
| including |
343.50 | 346.50 | 3.00 | 6.91 | ||||||
| and |
350.90 | 352.00 | 1.10 | 6.63 | ||||||
| and |
375.00 | 380.90 | 5.90 | 4.15 | ||||||
| FG24-390 |
209.00 | 210.00 | 1.00 | 10.72 | ||||||
| 221.50 | 250.00 | 28.50 | 0.55 | |||||||
| 244.20 | 245.20 | 1.00 | 2.96 | |||||||
| 280.00 | 294.00 | 14.00 | 6.12 | |||||||
| including |
281.20 | 282.10 | 0.90 | 68.13 | ||||||
| and |
288.00 | 294.00 | 6.00 | 3.24 | ||||||
| including |
291.00 | 292.00 | 1.00 | 9.13 | ||||||
| FG24-410 |
471.00 | 485.00 | 13.90 | 2.90 | ||||||
| FG24-414 |
377.90 | 397.00 | 19.10 | 1.04 | ||||||
| 449.40 | 470.50 | 21.10 | 1.28 | |||||||
| FG24-415 |
345.50 | 362.00 | 16.50 | 1.06 | ||||||
| 443.00 | 451.00 | 8.00 | 2.07 |
| 10.4 | Qualified Person’s Opinion |
In the opinion of the QP, Tim Maunula, P.Geo., the drill-hole logging and survey procedures employed are consistent with generally accepted industry best practices and are therefore considered reliable for the purposes of Mineral Resource estimation.
|
|
PAGE | 10-11 October 10, 2025 |
| MAYFAIR GOLD CORP.
|
| |
| National Instrument 43-101 Technical Report—Mineral Resource Estimate Update Fenn–Gib Project, Ontario, Canada |
| 11 | SAMPLE PREPARATION, ANALYSES, AND SECURITY |
The assay data used for this Technical Report represents a comprehensive compilation from certified laboratories, including both historical data from past owners, and recent diamond drilling by Mayfair Gold. The QP believes that certified laboratories historically employed industry best-practice in sample preparation, analyses, and security methods and procedures when developing the data used for the Mineral Resource estimate presented in this Technical Report.
| 11.1 | Historical Sampling Pre-2011 |
LSG compiled a master assay table from various historical records. The database listed assay intervals accompanied by location, Hole ID, from, to, sample number, lab name, assay certificate number, and date; and for each listed interval, a variety of assay results (e.g., check, repeat, and duplicate assays). Prior to 2011, LSG undertook a program of assay certificates database verifications to ensure that the most-reliable method of analysis was selected given the value of the sample (e.g., gravimetric for samples with >3 g/t Au). This process also served to verify the database. Scans of paper drill logs and assay certificates were available to verify data in the master assay table.
Accurassay, TSL Laboratories Inc., and Bourlamaque assayed samples from the early 1986 holes on the Fenn–Gib Project, then Swastika Laboratories (Swastika) (up to 1994), Spectrolab (up to 1997), and Chimitec (1998 and 1999). Swastika Laboratories performed the assaying for the holes Barrick drilled. Swastika is in Swastika, Ontario; Accurassay is in Thunder Bay, Ontario; Bourlamaque Laboratoire D’Analyse is in Val d’Or, Quebec; Spectrolab is in Geraldton, Ontario; TSL Laboratories Inc. is in Saskatoon, Saskatchewan; and Chimitec is in Val d’Or, Quebec. All laboratories are now (except TSL Laboratories Inc. which closed in 2021) and were accredited at the time of the analyses.
Due to the historical nature of the data, it is exceedingly difficult to analyze the quality assurance and quality control (QA/QC) method used by the various companies that drilled on the property over the years. It appears that the principal method of ensuring data quality was the use of pulp duplicates that were usually sent to other independent laboratories. This is discussed further in Section 12.2. SGS Geostat (SGS, 2011) and LSG undertook a resampling and drill twin program to validate the historical data; the SGS and LSG work continues to be an excellent verification source. This is also discussed in Section 12.1.
It appears that no certified standards or blanks were used to evaluate the accuracy or contamination effects for the data collected. The assay data were almost completely produced from known laboratories in the 1990s, which were certified and had their internal controls, which included standards and blanks. Those laboratories continue to be in operation today. The verification and validation work LSG and SGS Geostat completed did not highlight any issues with bias or errors (discussed in Section 12). The sampling and analysis methods used by the previous exploration companies was adequate for the use in a Mineral Resource estimate.
|
|
PAGE | 11-1 October 10, 2025 |
| MAYFAIR GOLD CORP.
|
| |
| National Instrument 43-101 Technical Report—Mineral Resource Estimate Update Fenn–Gib Project, Ontario, Canada |
| 11.2 | Historical Sampling Post 2011 |
Since 2017, LSG has implemented a comprehensive QA/QC program employing industry standards and best practices for all its drill core. This included regularly inserting blind Certified Reference Materials (CRM) and field blanks randomly into the sample stream. Additionally, pulp and coarse rejects were systematically submitted to ALS in North Vancouver, B.C., for check analysis and additional quality control.
Samples were transported in security-sealed bags to SGS In Timmins, Ontario, and ALS in North Vancouver, for sample preparation by dry crush to 75% mesh to 2 mm, split to 250 g and pulverized to 85% mesh to 75 µm. The samples were then assayed for gold and silver using a 50 g charge with atomic absorption and AAS finish for values exceeding threshold.
A total of 1,356 control samples was assigned for QA/QC purposes and accounted for approximately 20% of total samples taken during the program.
Analyses of blank samples, both pulp and field blanks, consistently yielded gold values near or below the detection limit of the primary laboratory. A single failure was detected; however, the results illustrate no sample contamination.
The performance of the control samples was very good, reflecting the overall high quality of the analysis. Standard OREAS O-250 analyzed by ALS shows two failures; ALS O-210 had three failures, and CDN-GS-3P one failure. SGS had two failures on O-210. Overall, the failure rate of 1.6% for ALS and 1.6% for SGS is very low and illustrates good QC procedures.
ALS performed duplicates check analysis of coarse rejects. Results showed relatively good correlation evident at both low and high gold levels, with a correlation coefficient of 0.995, indicating excellent reproducibility. There appears to be a moderate scatter, which can be interpreted as reflecting the lack of coarse nuggety gold in the Fenn–Gib Deposit.
| 11.3 | Mayfair Gold Sampling |
| 11.3.1 | Sampling Procedure |
| • | Sample intervals are marked directly on the drill core. Sample “from” and “to” points are marked by a vertical line drawn perpendicular to the core axis with arrows pointing towards the sample. |
| • | Sample information is recorded in sample booklets. The sample tag number becomes the drill core sample identification number (sample ID). QC samples are inserted into the same sampling ID sequence as the drill core. The minimum sample length is 0.5 m, and the maximum is 1.5 m. Sampling intervals are not to cross major lithology boundaries. |
| • | The Core Technician marks a cut line on the core prior to cutting. Drill core samples are cut lengthwise, and half of the core is placed into a sample bag. The other half of the core is placed back into the core box in its original location. The second portion of the sample tag is stapled into the core box in its original location (end of the sample). |
|
|
PAGE | 11-2 October 10, 2025 |
| MAYFAIR GOLD CORP.
|
| |
| National Instrument 43-101 Technical Report—Mineral Resource Estimate Update Fenn–Gib Project, Ontario, Canada |
| • | Sample bags are labelled with the sample ID, and the third portion of the sample tag is placed into the sample bag. Sample bags are sealed with a zip tie or staples. |
| • | Core is stored within a locked core yard (Figure 11-1) adjacent to the core-shack at 489 MacDougall Street in Matheson, Ontario. |
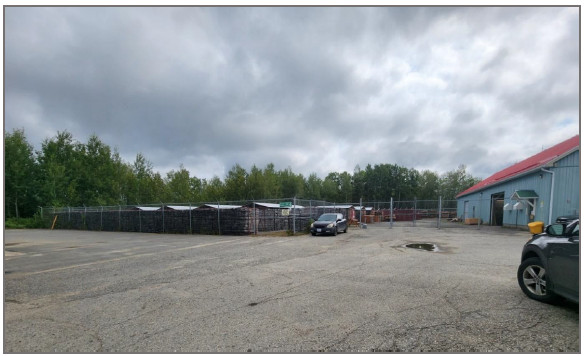
Source: Maunula (2023)
Figure 11-1: Core Storage Yard, Matheson, Ontario
| 11.3.2 | Sample Preparation and Analysis |
Mayfair Gold has used four laboratories: Activation Laboratories Ltd. (ActLabs), Swastika, AGAT Laboratories (AGAT), and MSALABS. Mayfair’s primary lab has been Swastika (>50%) followed by ActLabs (5.3%), and AGAT (2.3%). No photon assays from MSALABS have been used in this Mineral Resource estimate.
|
|
PAGE | 11-3 October 10, 2025 |
| MAYFAIR GOLD CORP.
|
| |
| National Instrument 43-101 Technical Report—Mineral Resource Estimate Update Fenn–Gib Project, Ontario, Canada |
ActLabs
ActLabs is an analytical company with global locations. Fenn–Gib Project samples are prepared and analyzed at their ISO 17025:2005-accredited Timmins location at 1752 Riverside Drive.
| • | Drill Core Sample Preparation Package (RX1) |
| • | Samples are crushed to 80% passing 2 mm. Samples are then split via a riffle to obtain a 250 g sample. 250 g samples are pulverized to 95% passing 105 µm. Cleaner sand is used. |
| • | Gold Fire Assays Package (1A2b-30) |
| • | Gold fire assay with AA finish of a 30 g sample |
| • | Under limit of 5 ppb (0.005 g/t) |
| • | Over limit of 10,000 ppb (10 g/t). |
| • | Gold Fire Assays Package (1A2-Timmins) |
| • | Gold fire assays with AA finish of a 10 g sample. |
| • | Overlimit Assay Package (1A3-30) |
| • | Gold fire assay with gravimetric finish. When assays from 1A2b-30 return with values >10 g/t they are sent for this package. |
| • | Under limit of 0.03 g/t |
| • | Over limit of 10,000 g/t. |
| • | Specific Gravity (SG) Core-Timmins |
| • | A 20–50 g dry core piece is weighed (a). |
| • | The same piece of core is then weighed while submerged completely in water (b). |
| • | SG is calculated using following formula SG = a / (a-b). |
| • | Two pieces per SG sample are measured to show variance and to identify samples to be rechecked. |
| • | Multi-element Packages |
| • | 1F2 QOP Total (Total Digestion ICPOES) |
| • | Code 8-4 Acid Total Digestion-ICPMS. |
Swastika Laboratories
Swastika is an ISO 17025:2017-accredited assay lab. Fenn–Gib Project samples are prepared and analyzed at their Swastika location 6 km southwest of Kirkland Lake, Ontario.
| • | Drill Core Sample Preparation Package |
| • | Samples are crushed to minimum 80% passing 1,700 µm. Samples are then split to obtain a 300–500 g sample using a rotary divider. 300–500 g samples are pulverized to minimum 85% passing 74 µm. Cleaner sand is utilized. |
|
|
PAGE | 11-4 October 10, 2025 |
| MAYFAIR GOLD CORP.
|
| |
| National Instrument 43-101 Technical Report—Mineral Resource Estimate Update Fenn–Gib Project, Ontario, Canada |
| • | Gold Fire Assays Package |
| • | Gold fire assay with AA finish of a 30 g sample |
| • | Under limit of 10 ppb (0.01 g/t). |
| • | Overlimit Assay Package |
| • | Gold fire assay with gravimetric finish. When assays return with values >10 g/t they are sent for this package. |
| • | Under limit of 0.3 g/t. |
| • | Specific Gravity |
| • | A dry and room temperature core piece is weighed (Wa) |
| • | The same piece of core is then weighed while submerged completely in water (Ww) |
| • | SG is calculated using following formula SG = Wa / (Wa-Ww). |
AGAT Laboratories
AGAT is an analytical company that operates across Canada; it is ISO 17025:2017 accredited and certified to the ISO 9001: 2015 standard. Fenn–Gib Project samples are prepared at AGAT Timmins. Samples are shipped for analysis to their lab at 5623 McAdam Rd., Mississauga, Ontario.
| • | Drill Core Sample Preparation Package (200001 Code) |
| • | Samples are crushed to 75% passing 2 mm. Samples are then split to obtain a 250 g sample. 250 g samples are pulverized to 85% passing 75 µm. |
| • | Gold Fire Assays Package (202051 Code) |
| • | Gold fire assay with AAS finish of a 30 g sample |
| • | Under limit of 2 ppb (0.002 g/t). |
| • | Overlimit Assay Package (202064) |
| • | Gold fire assay with gravimetric finish. When assays return with values >10 g/t then are sent for this package. |
| • | Multi-Element Package—(201070) |
| • | Select samples may be sent for multi element suite |
| • | 4 acid digestion with ICP-OES finish for 43 elements. |
MSALABS Timmins
MSALABS is global provider of geochemical laboratory services for the exploration and mining industries. Fenn–Gib Project samples are submitted to the lab at 757 Algonquin Blvd East, Timmins, Ontario. MSALABS follows the guidelines of ISO17025 accreditation and ISO9001, ISO14001, and ISO45001 certification:
|
|
PAGE | 11-5 October 10, 2025 |
| MAYFAIR GOLD CORP.
|
| |
| National Instrument 43-101 Technical Report—Mineral Resource Estimate Update Fenn–Gib Project, Ontario, Canada |
| • | Sample Preparation (CRU-CPA) |
| • | Dry entire sample, crushed up to 1 kg to 70% 02 mm, split 500 g. |
| • | Photon Assay (CPA-Au1) |
| • | Gamma ray analysis of sample for gold by photon assay instrument. |
| 11.3.3 | Quality Control Samples |
To ensure data quality and integrity, the Fenn–Gib Project maintains a rigorous quality control program. The program systematically inserts three QC samples in every 25 samples: one CRM, one blank, and one duplicate. CRMs, sourced from certified commercial retailers, consist of homogeneous fine pulp material with known certified grades and expected variability. These selected CRMs enable assessment of the accuracy of the assay data and monitor for potential bias:
| • | The Project uses three different CRMs, at three different grade points during the sampling process. The three different grade ranges reflect the Fenn–Gib Project’s mineralization, and consist of a low grade (<1 g/t), a mid grade (1–3 g/t), and a high grade (5–9 g/t). |
| • | As of January 2021, the Fenn–Gib Project has used CRMs from OREAS and CDN Resource Laboratories. |
Blank samples consist of material that has negligible grade concentrations. These samples are used to monitor for sample contamination during the preparation or analysis process. As of January 2021, the Fenn–Gib Project is using sand blasting material for its blank samples. The silica sand is sourced from an auto parts store.
Duplicate samples are used to assess the precision of the assay data. A duplicate sample is split from the original sample and given its own sample identification number. As of January 2021, duplicate samples used in the Fenn–Gib Project drill program consist of “coarse” and “pulp” preparation duplicate samples. These samples are prepared at the assay lab during the sampling process. As of April 25, 2022, Mayfair uses only coarse duplicate samples in their sampling program.
Check assay samples consist of the pulp portion of drill core samples from previously assayed samples. Check assay samples are sent to a secondary lab to assess the accuracy of the assay results. Check assays are submitted on a quarterly to biannual basis, or upon completion of a drill program. Approximately 2% of drill core samples are selected for check assay samples:
| • | Approximately half of the samples will be randomly selected from the entire core sample population. |
| • | The other half of the samples will be randomly selected from samples that returned values >0.34 g/t Au. |
|
|
PAGE | 11-6 October 10, 2025 |
| MAYFAIR GOLD CORP.
|
| |
| National Instrument 43-101 Technical Report—Mineral Resource Estimate Update Fenn–Gib Project, Ontario, Canada |
| 11.3.4 | QA/QC Control Charts |
Assay certificates are imported into the GeoticLog program using the “import certificate” function. This function will match the sample ID in the certificate to the correct sample ID and drill hole in GeoticLog. An access database, “Fenn–Gib database,” was created as the working drill hole, assay, and QC monitoring program. The database is linked to the GeoticLog program and pulls the information from there. Query functions have been created to filter QC data by each sub type. In each query, expressions have been built to flag assay results that lie outside of the accepted control limits. The database is password protected.
The QA/QC review and control charts are based on work completed between April 2023 and May 2024.
Blanks
Mayfair Gold inserted 1,595 blank control samples. There were two samples reporting >0.5 g/t Au (Figure 11-2) with the remaining failures below that limit (0.13% failure rate). No batches were repeated.
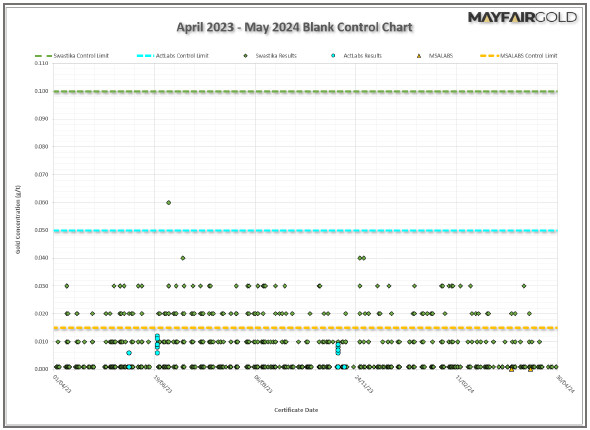
Source: Mayfair Gold (2024)
Figure 11-2: Control Chart—Blank Material
|
|
PAGE | 11-7 October 10, 2025 |
| MAYFAIR GOLD CORP.
|
| |
| National Instrument 43-101 Technical Report—Mineral Resource Estimate Update Fenn–Gib Project, Ontario, Canada |
Certified Reference Materials
The CRM sample certificates indicate the accepted values and ranges or control limits. The reported standard deviation in the CRM certificate is used to define the warning and failure limits:
| • | ±2 times standard deviation is considered a warning limit. |
| • | ±3 times standard deviation is considered the failure limit. |
The Fenn–Gib Project uses the following parameters to identify CRM failures that require repeat assays:
| • | Any single CRM result that falls outside of 3 standard deviations. |
| • | Two or more CRMs that fall outside of 2 standard deviations in a single reported assay certificate. The CRMs do not need to be from the same type. |
| • | A single CRM result that falls outside of 2 standard deviations with a blank or duplicate failure in the same certificate. |
| • | In some cases, the database manager may consider a single CRM that is outside of 2 standard deviations as a failure if there is an increased amount of CRM samples from multiple certificates from the same lab in the warning zone within a given time period. |
The current CRMs in use by Mayfair Gold are: OREAS-256b, OREAS-251b, and OREAS-254b. Failures were less than 1%, with no repeat assays conducted, as no significant assays were in sequence. Control charts for these three CRMs are shown in Figure 11-3 to Figure 11-5. In general, the three current CRMs perform well within two standard deviations. For the photon assay conducted by MSALABS, there is not sufficient pulp material for analysis, so the samples are marked as IS (for “Insufficient Sample”) and plotted at 0 g/t Au on the CRM Control Charts.
|
|
PAGE | 11-8 October 10, 2025 |
| MAYFAIR GOLD CORP.
|
| |
| National Instrument 43-101 Technical Report—Mineral Resource Estimate Update Fenn–Gib Project, Ontario, Canada |
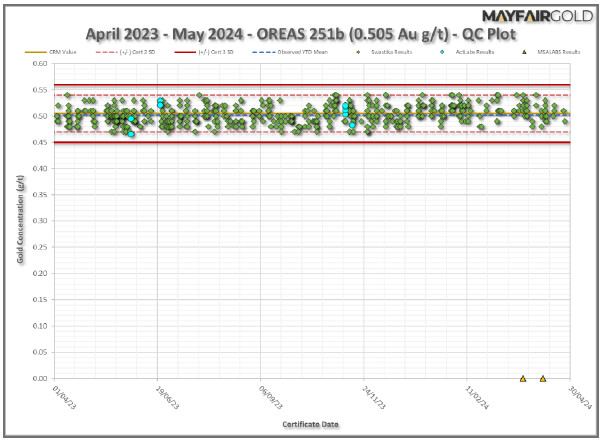
Source: Mayfair Gold (2024)
Figure 11-3: Control Chart—CRM OREAS 251b
|
|
PAGE | 11-9 October 10, 2025 |
| MAYFAIR GOLD CORP.
|
| |
| National Instrument 43-101 Technical Report—Mineral Resource Estimate Update Fenn–Gib Project, Ontario, Canada |
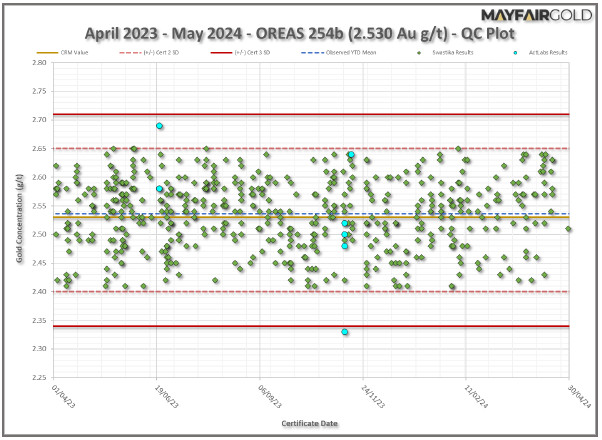
Source: Mayfair Gold (2024)
Figure 11-4: Control Chart—CRM OREAS 254b
|
|
PAGE | 11-10 October 10, 2025 |
| MAYFAIR GOLD CORP.
|
| |
| National Instrument 43-101 Technical Report—Mineral Resource Estimate Update Fenn–Gib Project, Ontario, Canada |
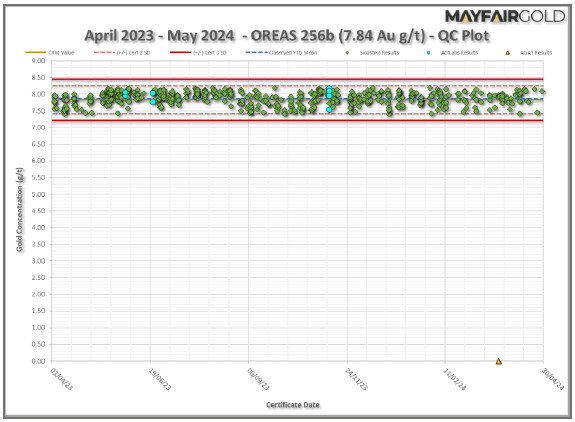
Source: Mayfair Gold (2024)
Figure 11-5: Control Chart—CRM OREAS 256b
Duplicates
Coarse duplicate samples were collected after the original sample had been crushed for Swastika (1,568 samples), ActLabs (27 samples), and MSALABS (2 samples). It is expected that duplicate results will return an assay value that is in line with its original sample:
| • | Acceptable range for coarse duplicate samples is ±25% of the original assays. |
| • | If the gold difference between the original and check assay is less than 0.1 g/t, a percent difference outside of 25% it is not considered to be an outlier. |
The check assays were evaluated using quartile–quartile (Q–Q) plots and relative difference statistics. For Swastika, less than 3% did not meet the QC criteria, and for ActLabs all samples passed. Figure 11-6 compares the various labs using a Q–Q plot to confirm the repeatability.
The Project’s QC program identified and addressed quality control issues in 2023. Of the four QC failures, one resulted from a result of a sample mix-up with the CRM which was resolved. The remaining three samples initially showed values outside acceptable limits but were confirmed to be within specifications upon re-analysis. Additionally, twenty-three sampling errors, primarily from submitting the incorrect CRM, were identified and resolved; no re-assays were submitted.
|
|
PAGE | 11-11 October 10, 2025 |
| MAYFAIR GOLD CORP.
|
| |
| National Instrument 43-101 Technical Report—Mineral Resource Estimate Update Fenn–Gib Project, Ontario, Canada |
The 2024 quality control program identified one QC assay failure resulted from a lab mix-up in samples and resolved through re-analysis. Six QC errors, primarily due to insertion of a different CRM than recorded, were identified and resolved; no additional re-assays were required.
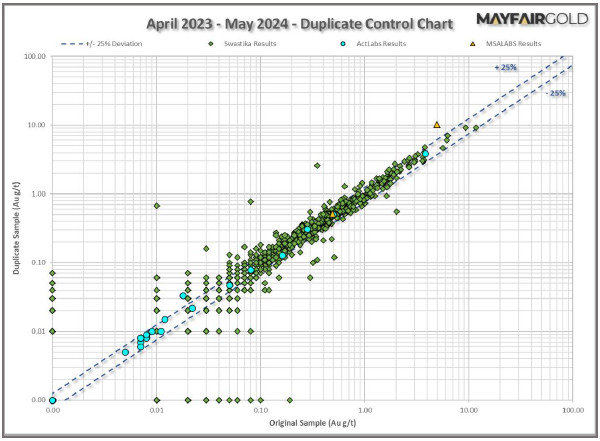
Source: Mayfair Gold (2024)
Figure 11-6: Control Chart—Duplicate Samples
Check assays consisting of the pulp portion of drill core samples previously assayed by Swastika (625 samples) and AGAT (137 samples) were submitted to ActLabs. Check assay samples assess the accuracy and precision of the assay data. It is expected that check assay results will return an assay value that is in line with its original sample:
| • | Acceptable range for pulp duplicate samples is ±15% of the original assays. |
| • | If the gold difference between the original and check assay is less than 0.1 g/t, a percent difference outside of 15% it is not considered to be an outlier. |
|
|
PAGE | 11-12 October 10, 2025 |
| MAYFAIR GOLD CORP.
|
| |
| National Instrument 43-101 Technical Report—Mineral Resource Estimate Update Fenn–Gib Project, Ontario, Canada |
The check assays were evaluated using Q–Q plots and relative difference statistics. The results demonstrate repeatability between labs if samples near the detection limit are removed from the analysis; about 6% of the check assays did not meet the criteria. Figure 11-7 and Figure 11-8 are the Q-Q plots comparing the Swastika and AGAT samples with ActLabs, and confirming the repeatability.
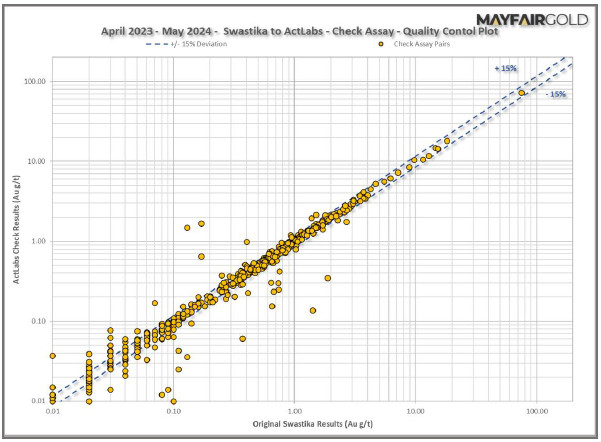
Source: Mayfair Gold (2024)
Figure 11-7: Control Chart—Check Assays, Swastika vs. ActLabs
|
|
PAGE | 11-13 October 10, 2025 |
| MAYFAIR GOLD CORP.
|
| |
| National Instrument 43-101 Technical Report—Mineral Resource Estimate Update Fenn–Gib Project, Ontario, Canada |
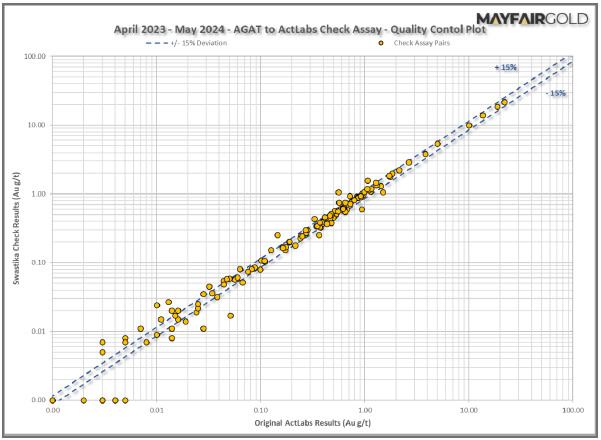
Source: Mayfair Gold (2024)
Figure 11-8: Control Chart—Check Assays, AGAT vs. ActLabs
| 11.4 | Density Determinations |
Density determinations were performed on split core, primarily by Swastika, with some determinations by ActLabs. Density determinations were calculated using the formula SG = Wa / (Wa-Ww), where Wa is the weight of the dry sample, and Ww is the weight of the sample while submerged completely in water. Since 2023, density determinations have been conducted for every tenth sample submitted. In 2023, there were 1,948 density determinations, and 4,360 in 2024.
| 11.5 | Adequacy Statement |
The QP, Tim Maunula, P.Geo., believes that the historical and present-day sampling preparation, security, analytical procedures, and quality control protocols conform to generally accepted industry best practices at the time they were performed, and are therefore reliable for the purpose of Mineral Resource estimation.
|
|
PAGE | 11-14 October 10, 2025 |
| MAYFAIR GOLD CORP.
|
| |
| National Instrument 43-101 Technical Report—Mineral Resource Estimate Update Fenn–Gib Project, Ontario, Canada |
| 12 | DATA VERIFICATION |
Data verification has been conducted historically and is ongoing; all of which adequately supports the Mineral Resource estimate.
| 12.1 | Historical Verification |
As the historical data are a large component of the database, validation and verification of the data have been part of the ongoing work. A variety of validation and verification techniques have been conducted:
| • | LSG and Dagbert & Desharnais (2011) conducted a 10% data check compared with scanned laboratory certificates. No discrepancies were identified. |
| • | Dagbert & Desharnais (2011) compared the pulp duplicate data with the original assays. With the exception of a limited dataset (0.6% of the 2011 database), there appeared to be no significant bias. |
| • | LSG resampled 223 assay intervals (277.1 m) of remaining half cores from the 1986 to 1998 drilling. No significant bias was identified (Dagbert & Desharnais, 2011). |
| • | LSG conducted an eight-hole twin drilling program in 2011. The results showed good correlation between the original and the twinned holes (Dagbert & Desharnais, 2011). |
| • | A block model was estimated using pre-2017 data versus 2017 data. In general, there was good correlation, except in areas of lower data density. No systematic bias was identified (Kirkham et al., 2021). |
Additional details are available in the Dagbert & Desharnais (2011) and Kirkham et al. (2021) technical reports.
| 12.2 | TMAC Verification |
| 12.2.1 | Site Visits |
QP Tim Maunula conducted his original site visit on February 6 and 7, 2023, including an inspection of the property, review of diamond drilling and logging, sampling, and core-storage facilities in Matheson.
A site visit, in support of the 2024 Mineral Resource estimate was conducted on April 16 and 17, 2024, including inspecting the property and reviewing diamond drilling and logging, sampling, and core storage facilities in Matheson, Ontario. Mr. Howard Bird, former Vice-President Exploration for Mayfair Gold accompanied Mr. Maunula on both site visits.
|
|
PAGE | 12-1 October 10, 2025 |
| MAYFAIR GOLD CORP.
|
| |
| National Instrument 43-101 Technical Report—Mineral Resource Estimate Update Fenn–Gib Project, Ontario, Canada |
12.2.2 Diamond Drilling
Major Drilling currently conducts diamond drilling. Generally, casing is capped, the drill holes flagged, and the collar identification recorded on a metal strip (Figure 12-1). Mr. Maunula verified the collar locations for FG23-347, FG23-359, FG23-368, and FG24-372 within one metre.
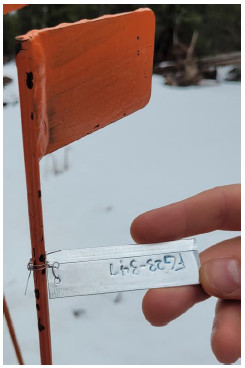
Source: Maunula (2024)
Figure 12-1: Collar Labelling, FG23-347
Drill core from FG23-368, FG24-387, and FG24-390 was reviewed. The QP’s visual inspection of the drill core confirmed there was no material bias or errors noted from comparison with the logging and sampling recorded in the drill logs.
| 12.2.3 | Database Verification |
TMAC conducted data verification during the update of the 2024 Mineral Resource estimate. This included the built-in checks associated with importing data in GEMS and MinePlan, random checks of database assays compared with assay certificates, and reviewing the QA/QC performance (Section 11). As discussed in Section 14, exploratory data analysis to evaluate the grade distribution, as discussed in Section 14, was an additional component of the data verification process.
|
|
PAGE | 12-2 October 10, 2025 |
| MAYFAIR GOLD CORP.
|
| |
| National Instrument 43-101 Technical Report—Mineral Resource Estimate Update Fenn–Gib Project, Ontario, Canada |
TMAC completed data verification of the assay grades for three drill holes compared with the associated digital import file. This was approximately 4% of Mayfair Gold’s new drilling used in the Mineral Resource estimate. TMAC did not identify any material issues and data were found to match the original certificates.
| 12.2.4 | Qualified Persons’ Opinion |
Upon completing the data verification process, the QP believes that the geological data collection, sampling, and QA/QC procedures Mayfair Gold used are consistent with accepted industry practices, and that the database is of suitable quality to support the Mineral Resource estimate, as reported in Section 14.
|
|
PAGE | 12-3 October 10, 2025 |
| MAYFAIR GOLD CORP.
|
| |
| National Instrument 43-101 Technical Report—Mineral Resource Estimate Update Fenn–Gib Project, Ontario, Canada |
| 13 | MINERAL PROCESSING AND METALLURGICAL TESTING |
Metallurgical studies associated with the Fenn–Gib Project include recent efforts of Mayfair Gold (2022–2025), and earlier programs that Lake Shore Gold (2014–2015) and Tahoe Resources (2017–2018) carried out. Section 13 provides an overview of metallurgical definition and development studies covering composite sample selection, rock hardness characterization, physical material properties, and the evaluation of applicable processes methods, including gravity concentration, whole ore cyanidation, flotation, pressure oxidation, and cyanidation of a reground flotation rougher concentrate.
| 13.1 | Conclusion from Metallurgical Testing |
Gold is the primary commodity of interest at the Fenn–Gib deposit, occurring predominantly with pyrite and as fine free gold grains. In the opinion of the metallurgical QP, testwork completed to date has maintained a high-standard, including check assays and quality control, and is well suited for future phases of project engineering and development.
With the understanding gained from the metallurgical test programs, a hybrid process approach has been developed that considers a P80 106 µm flotation feed size with 23% to 25% mass pull yielding 94% to 96% Au recovery to a rougher concentrate. Subsequent regrinding of the concentrate to P80 10 to 13 µm followed by intensive cyanidation achieved 94% to 97% Au extraction for an estimated overall 90% Au extraction at a 1.5 g/t Au feed grade.
| 13.2 | Findings from Metallurgical Testing |
Comprehensive rock hardness characterization was completed on ten composites (GCC-01 to GCC-008, GCC-10, GCC-012), considering crusher work index, JKTech Axb rock competency, SAG Power Index (SPI), Bond ball mill work index, and abrasion index. This work confirmed the mineralized material to be relatively hard and competent. The average crusher work index is 16.0 kWh/t (range: 8.4–21.6 kWh/t), and the Bond ball mill work index averages 17.8 kWh/t (range: 16.2–20.5 kWh/t). The rock demonstrates strong mechanical integrity, with an average JKTech Axb value of 25.7 (range: 22.7–36.4), and moderate abrasiveness, reflected by an average abrasion index of 0.34 g/h (range: 0.10–0.59 g/h). These results further support the robustness of the proposed processing strategy.
Test work to evaluate gravity recoverable gold (GRG) content indicates 0% to 37% of gold values in the feed are present at a grain size coarser than 20 µm and recoverable as GRG to an intermediate product for subsequent on-site cyanidation.
Metallurgical variability testing conducted in 2024–2025 included 50 composite samples representing a range of gold grades, sulphur content, lithologies, and mining phases, with an emphasis on material expected during the first seven years of production. This work established baseline criteria for process design, including flotation feed grind size, mass pull, retention time, reagent selection, regrind parameters, and dewatering requirements.
|
|
PAGE | 13-1 October 10, 2025 |
| MAYFAIR GOLD CORP.
|
| |
| National Instrument 43-101 Technical Report—Mineral Resource Estimate Update Fenn–Gib Project, Ontario, Canada |
The 2024-2025 testing program identified the presence of finely disseminated gold values within pyrite, which resulted in a slight decrease in observed cyanide soluble Au extraction on some samples typically below a feed grade of 1.2 g Au/t. The variability in metal recovery has been accounted for in the metallurgical gold recovery model.
Rougher flotation at 23%–25% mass pull consistently achieved 94%–96% gold recovery. Cleaner flotation at 5% mass pull yielded slightly lower recoveries of 90%–92%, with improved concentrate grade.
Prior to the 2024-2025 metallurgical test programs, previous efforts considered alternative process strategies and are outlined as follows:
Whole ore cyanidation tests conducted at P80 106 µm yielded variable gold extraction ranging from 32%–95%, influenced by head grade and sulphide content. Diagnostic leaching confirmed that residual gold was associated with sulphides, with minor dissemination within silicates.
Pressure oxidation (POX) trials on rougher concentrate yielded a gold extraction between 89% to 99% with 97% to 99% sulphide oxidation. Partial 72% sulphide oxidation also yielded acceptable 92% Au extraction which confirms Au-sulphide mineralization is not entirely refractory.
Gold deportment is broadly characterized as 35% fine free gold and 65% associated with sulphides, either as surface dissemination, inclusions, or solid solution within pyrite.
Notably, flotation followed by concentrate regrinding and cyanidation yielded comparable results to the more complex and higher capital cost approach that involves flotation followed by pressure oxidation.
Heavy liquid separation (HLS) testing identified that the host rock and mineral suite at P80 106 µm exhibit minimal variability in specific gravity, offering limited potential for upgrading or gangue rejection with this method.
The two viable processing options identified for the Fenn-Gib project include: (i) off-site smelting of a flotation concentrate, and (ii) on-site regrinding of a flotation concentrate followed by intensive cyanidation. Both approaches support effective water management and a practical reclamation and closure strategy. Financial analysis favors the on-site processing route, given the cost implications of concentrate transport and smelter/refining charges.
| 13.3 | Metallurgical Testwork |
| 13.3.1 | Composite Sample Selection |
Composite sample selection for 2024–2025 metallurgical testwork is summarized in Table 13-2 and considered diamond drill-hole intercepts with a specific focus on:
| • | A representative distribution of lithology |
|
|
PAGE | 13-2 October 10, 2025 |
| MAYFAIR GOLD CORP.
|
| |
| National Instrument 43-101 Technical Report—Mineral Resource Estimate Update Fenn–Gib Project, Ontario, Canada |
| • | A spatial distribution of samples within the deposit |
| • | Contiguous intervals for Geo-Met modelling |
| • | A representative grade range for g/t Au and % sulphide (S2-) |
| 13.3.2 | Lithology |
As outlined in Table 13-1, thirty-two (32) different deposit lithologies have been grouped into five principal rock types according to a classification matrix that includes:
| • | Felsic rock with >65% SiO2 |
| • | Intermediate rock with 55% < x < 65% SiO2 |
| • | Mafic rock with 45% < x < 55% SiO2 |
| • | Ultramafic rock with <45% SiO2 |
| • | Sedimentary material (from weathering and decomposition of other rock types). |
For each lithology, similar chemical composition may be present as intrusive (below surface) or as volcanic (above surface), with characteristically different mineral grain size and structure. The slower rate of cooling associated with intrusive versus volcanic rock, in addition to variable silicification, hydrothermal activity, and brecciation are among the factors that contribute to observed differences in rock fracture density, material competency, abrasivity, and hardness.
Gold values present within the deposit are associated predominantly with intermediate and mafic rock types, which aligns with the cross-section of composites and lithologies selected.
Table 13-1: Fenn–Gib Project Composite Sample Identification and Lithology
| Description |
Lithology |
Metallurgical |
Hardness |
Intrusive |
Volcanic |
Sedimentary | ||||||
| Felsic |
FV |
— | — | Felsic Volcanic | — | |||||||
| AFI |
Altered Felsic Intrusive |
|||||||||||
| FI |
Felsic Intrusive |
|||||||||||
| QCV |
Quartz-Carbonate Vein |
|||||||||||
| QFP |
Quartz-Feldspar-Porphyry |
|||||||||||
| QV |
Quartz Vein |
|||||||||||
| Intermediate |
IV |
Intermediate Volcanic | — | |||||||||
| II |
2 | 1 | Intermediate Intrusive |
|||||||||
| AII |
Altered Intermediate Intrusive |
|||||||||||
| AFP |
Altered Feldspar Porphyry |
|||||||||||
| FP |
Feldspar Porphyry |
|||||||||||
| BBFP |
Beige-Buff Feldspar Porphyry |
|||||||||||
| CFP |
Oatmeal Feldspar Porphyry |
|||||||||||
| ASYN |
7 | Altered Syenite |
||||||||||
| SYN |
15 | 2 | Syenite |
|||||||||
| DIO |
Diorite |
|
|
PAGE | 13-3 October 10, 2025 |
| MAYFAIR GOLD CORP.
|
| |
| National Instrument 43-101 Technical Report—Mineral Resource Estimate Update Fenn–Gib Project, Ontario, Canada |
| Description |
Lithology |
Metallurgical |
Hardness |
Intrusive |
Volcanic |
Sedimentary | ||||||
| Mafic |
AMV |
9 | 2 | Altered Mafic Volcanic | — | |||||||
| MV |
2 | 2 | Mafic Volcanic | |||||||||
| PMV |
1 | Pillowed Mafic Volcanic | ||||||||||
| VMV |
Variolitic Volcanic | |||||||||||
| MI |
Mafic Intrusive |
|||||||||||
| AMI |
1 | Altered Mafic Intrusive |
||||||||||
| PYX |
10 | 2 | Pyroxenite |
|||||||||
| Ultra-Mafic |
UMV |
Ultramafic Volcanic | — | |||||||||
| UI |
Ultramafic Intrusive |
|||||||||||
| AUV |
Altered Ultramafic |
|||||||||||
| CGR |
Green Carbonate |
|||||||||||
| KIMB |
Kimberlite |
|||||||||||
| LAMP |
3 | Lamprophyre |
||||||||||
| Sedimentary |
OVB |
— | — | — | Overburden | |||||||
| ASED |
Altered Sediments | |||||||||||
| SED |
1 | Sedimentary | ||||||||||
|
|
|
|||||||||||
| Total Samples |
50 | 10 | ||||||||||
|
|
|
Source: Haggarty Technical Services in conjunction with Fenn–Gib Project geologists
| 13.3.3 | Composite Sample Details |
The approach towards Fenn–Gib composite sample selection has evolved over time. Recent testwork conducted between 2023 and 2025 considered variability samples as contiguous mineralized intercepts, with each sample typically derived from a single diamond drill hole.
This contrasts to the approach used prior to 2023 where bulk composites were based on extended interval lengths and potentially included material from multiple drill holes, representing a larger spatial volume.
Both approaches to composite sample preparation are valid. In some cases, a broad-scale bulk sample is necessary to obtain sufficient sample weight from drill core to support metallurgical or pilot-plant testing.
Discrete interval samples are well suited for geological–metallurgical (GeoMet) modelling, with an ability to evaluate a cross-section of gold and sulphide head grades, and varied lithological domains, to establish the expected influence of mineralogical composition on Au extraction and rock hardness.
Additional consideration was given to the mine production schedule in selecting the 50 composite samples for variability testwork. Mining Phase 1 is loosely defined as less than 80 m below surface, Phase 2 less than 130 m from surface, Phase 3 less than 200 m from surface, and future mined material as more than 200 m below surface. Samples selected from Phases 1 to 3 are indicative of process-plant feed in the initial years of the operation.
A summary of previous and more recent composite samples associated with testwork is summarized in Table 13-2, with a range in grade from 0.2 to 19.1 g/t Au and 0.3 to 8.1% S2-.
|
|
PAGE | 13-4 October 10, 2025 |
| MAYFAIR GOLD CORP.
|
| |
| National Instrument 43-101 Technical Report—Mineral Resource Estimate Update Fenn–Gib Project, Ontario, Canada |
Table 13-2: Composite Sample Details
| Composite ID |
Year | Drill Hole |
Interval Depth (m) |
Lithology |
Au g/t | %Fe | %S2- | |||||||||||||||
| FG-11-05 |
2015 | FG-11-05 | 73.5 to 120.0 | MV | 2.38 | 7.48 | 4.02 | |||||||||||||||
| FG-11-08 |
2015 | FG-11-08 | 36.0 to 74.0 | AMI | 1.33 | 7.27 | 2.68 | |||||||||||||||
| FG-12-13 |
2015 | FG-12-13 | 313.0 to 325.1 361.4 to 369.2 387.4 to 395.3 |
SED | 0.94 | 5.13 | 2.58 | |||||||||||||||
| FG-12-29 |
2015 | FG-12-29 | 366.2 to 392.5 | UMV | 1.98 | 6.77 | 1.72 | |||||||||||||||
| M-1 |
2017 | FG-17-49 | 194.8 to 213.0 | DIO | 0.76 | 5.59 | 1.59 | |||||||||||||||
| M-2 |
2017 | FG-17-48 | 235.5 to 254.2 | DIO | 0.56 | 4.12 | 1.70 | |||||||||||||||
| M-3 |
2017 | FG-17-51 | 371.0 to 389.5 | DIO | 0.91 | 7.71 | 3.10 | |||||||||||||||
| M-4 |
2017 | FG-17-57 | 326.9 to 346.0 | MV | 0.46 | 8.54 | 2.56 | |||||||||||||||
| M-5 |
2017 | FG-17-57 | 376.0 to 396.7 | MV | 0.44 | 8.69 | 1.64 | |||||||||||||||
| M-6 |
2017 | FG-17-49 | 439.3 to 461.5 | MV | 0.45 | 6.98 | 1.01 | |||||||||||||||
| M-7 |
2017 | FG-17-48 | 408.3 to 427.0 | MV | 1.55 | 6.29 | 3.86 | |||||||||||||||
| M-8 |
2017 | FG-17-43 | 399.0 to 420.6 | SED | 0.65 | 8.97 | 8.08 | |||||||||||||||
| M-9 |
2017 | FG-17-49 | 291.1 to 313.5 | MIXED | 0.97 | 6.64 | 4.15 | |||||||||||||||
| M-10 |
2017 | FG-17-56 | 313.7 to 331.0 | MIXED | 1.85 | 4.26 | 2.10 | |||||||||||||||
| M-11 |
2017 | FG-17-56 | 268.3 to 289.0 | MIXED | 1.09 | 8.55 | 5.94 | |||||||||||||||
| M-12 |
2017 | FG-17-43 | 443.0 to 461.8 | MIXED | 0.88 | 6.57 | 2.69 | |||||||||||||||
| M-13 |
2017 | FG-17-62 | 280.0 to 298.0 | PYX | 0.80 | 7.53 | 3.41 | |||||||||||||||
| M-14 |
2017 | FG-17-60 | 270.0 to 288.7 | PYX | 0.40 | 4.15 | 0.60 | |||||||||||||||
| M-15 |
2018 | FG-17-72 | 210.0 to 227.3 | SYN | 1.12 | 9.15 | 7.17 | |||||||||||||||
| M-16 |
2018 | FG-17-72 | 296.0 to 313.4 | MV | 0.89 | 5.99 | 3.18 | |||||||||||||||
| M-17 |
2018 | FG-17-88A | 140.5 to 157.6 | MV | 0.75 | 6.38 | 1.83 | |||||||||||||||
| M-18 |
2018 | FG-17-93 | 46.1 to 63.5 | SYN/II | 1.19 | 4.85 | 2.76 | |||||||||||||||
| M-19 |
2018 | FG-17-93 | 208.0 to 226.6 | MV | 0.52 | 6.43 | 1.68 | |||||||||||||||
| M-20 |
2018 | FG-17-97 | 124.4 to 142.1 | SYN | 0.89 | 4.63 | 2.12 | |||||||||||||||
| M-21 |
2018 | FG-17-97 | 182.2 to 200.1 | MV/SYN/II | 1.43 | 5.03 | 1.32 | |||||||||||||||
| M-22 |
2018 | FG-17-105 | 12.0 to 30.0 | MV/SYN | 0.62 | 5.19 | 2.45 | |||||||||||||||
| M-23 |
2018 | FG-17-105 | 166.0 to 183.4 | MV | 0.80 | 7.12 | 2.88 | |||||||||||||||
| M-24 |
2018 | FG-17-67 | 250.0 to 268.0 | PYX | 0.98 | 12.40 | 0.88 | |||||||||||||||
| FW (Footwall) |
2022 | FG21-158 FG21-158 FG21-158 FG21-161 |
30.9 to 35.0 61.0 to 62.0 85.4 to 87.0 37.0 to 56.0 |
AMV | 0.56 | 8.34 | 4.44 | |||||||||||||||
| South Pit |
2022 | FG21-147b | 47.0 to 52.0 83.0 to 85.0 132.0 to 135.0 138.5 to 141.8 158.2 to 165.4 181.0 to 206.5 |
ASED BBFP CGR AMV |
1.56 | 6.66 | 2.42 | |||||||||||||||
|
|
PAGE | 13-5 October 10, 2025 |
| MAYFAIR GOLD CORP.
|
| |
| National Instrument 43-101 Technical Report—Mineral Resource Estimate Update Fenn–Gib Project, Ontario, Canada |
| Composite ID |
Year | Drill Hole |
Interval Depth (m) |
Lithology |
Au g/t | %Fe | %S2- | |||||||||||||||
| Central Pit Upper |
2022 | FG21-155 FG21-155 FG21-155 FG21-155 FG21-155 FG21-155 FG21-152 FG21-152 FG21-152 FG21-152 |
11.5 to 21.3 49.0 to 50.0 52.0 to 53.0 55.0 to 57.0 61.5 to 72.0 81.2 to 82.5 13.2 to 17.0 33.0 to 34.0 63.0 to 69.0 84.0 to 89.0 |
ASYN ASYN ASYN ASYN SYN/AII SYN SYN ASYN ASYN SYN |
1.14 | 6.48 | 3.31 | |||||||||||||||
| Central Pit Mid |
2022 | FG21-152 FG21-152 FG21-152 FG21-152 FG21-152 FG21-152 FG21-152 FG21-155 FG21-155 FG21-155 FG21-155 FG21-155 FG21-155 |
94.0 to 97.0 100.0 to 102.0 112.0 to 116.0 126.7 to 127.7 129.0 to 139.0 142.5 to 143.4 150.0 to 156.0 87.5 to 90.0 95.8 to 97.0 99.9 to 101.7 110.7 to 112.0 130.8 to 140.0 160.5 to 162.0 |
SYN/LAMP SYN AFI LAMP AII/SYN/AMI SYN VMV ASYN SYN AII AII ASYN AMV |
1.33 | 4.96 | 2.11 | |||||||||||||||
| Central Pit Lower |
2022 | FG21-152 FG21-152 FG21-152 FG21-155 FG21-155 FG21-155 FG21-155 FG21-155 FG21-155 FG21-155 FG21-155 |
178.5 to 189.0 204.0 to 207.0 219.9 to 223.1 165.0 to 166.0 170.0 to 171.0 173.0to 174.0 188.8 to 189.7 192.0 to 195.0 201.0 to 207.2 219.0 to 222.0 234.0 to 239.0 |
VMV VMV UMV AMV AMV AMV AMV AMV AMV AMV AMV |
1.16 | 6.49 | 0.96 | |||||||||||||||
| East Pit |
2022 | FG21-145 FG21-145 FG21-146 FG21-146 FG21-146 FG21-146 FG21-146 FG21-146 FG21-146 |
54.2 to 55.3 63.2 to 64.1 85.0 to 91.5 90.0 to 91.5 98.0 to 111.0 113.0 to 114.5 121.2 to 123.0 130.5 to 133.5 138.0 to 139.5 |
ASYN AII LAMP LAMP PYX PYX PYX PYX PYX |
0.80 | 11.40 | 1.62 | |||||||||||||||
| FW Underground |
2022 | FG21-139 FG21-140 FG21-146 |
552.0 to 562.0 492.5 to 499.0 397.3 to 405.0 |
AMV AMV AMV |
4.15 | 8.28 | 2.53 | |||||||||||||||
| FG-22-254 |
2023 | FG-22-254 | 368.2 to 471.0 | ASYN/LAMP/AII SED/DIO/CGR |
1.28 | 5.95 | 2.41 | |||||||||||||||
|
|
PAGE | 13-6 October 10, 2025 |
| MAYFAIR GOLD CORP.
|
| |
| National Instrument 43-101 Technical Report—Mineral Resource Estimate Update Fenn–Gib Project, Ontario, Canada |
| Composite ID |
Year | Drill Hole |
Interval Depth |
Lithology |
Au g/t | %Fe | %S2- | |||||||||||||||
| Composite 1 |
2024 | FG22-250 | 13.1 to 28.0 | AMV | 0.55 | 7.01 | 2.53 | |||||||||||||||
| Composite 2 |
2024 | FG22-250 | 28.0 to 40.0 | SYN | 0.47 | 4.88 | 2.56 | |||||||||||||||
| Composite 3 |
2024 | FG22-250 | 50.0 to 64.0 | SYN/AMV | 2.22 | 7.30 | 2.86 | |||||||||||||||
| Composite 4 |
2024 | FG22-250 | 65.0 to 81.0 | AMV/SYN/ASYN | 0.91 | 4.93 | 3.52 | |||||||||||||||
| Composite 5 |
2024 | FG22-250 | 86.0 to 101.0 | SYN/AMV | 1.10 | 4.47 | 3.56 | |||||||||||||||
| Composite 6 |
2024 | FG22-250 | 169.0 to 186.0 | AMV | 1.30 | 5.90 | 3.03 | |||||||||||||||
| Composite 7 |
2024 | FG22-250 | 187.0 to 208.0 | SYN/AMV | 1.21 | 4.17 | 1.50 | |||||||||||||||
| Composite 8 |
2024 | FG22-253 | 11.3 to 30.0 | CAS/ASYN/AMV | 0.46 | 3.48 | 1.94 | |||||||||||||||
| Composite 9 |
2024 | FG22-253 | 57.0 to 69.0 | AMV | 2.01 | 5.31 | 3.64 | |||||||||||||||
| Composite 10 |
2024 | FG22-253 | 69.0 to 81.0 | AMV/ASYN | 0.76 | 4.03 | 1.93 | |||||||||||||||
| Composite 11 |
2024 | FG22-253 | 81.0 to 93.2 | AMV/ASYN | 1.58 | 4.49 | 2.96 | |||||||||||||||
| Composite 12 |
2024 | FG22-253 | 95.0 to 111.0 | SYN | 0.93 | 3.45 | 2.29 | |||||||||||||||
| Composite 13 |
2024 | FG22-253 | 112.7 to 129.0 | SYN | 0.80 | 4.88 | 2.36 | |||||||||||||||
| Composite 14 |
2024 | FG22-253 | 153.0 to 169.5 | II/SYN | 1.14 | 6.91 | 1.81 | |||||||||||||||
| Composite 15 |
2024 | FG22-253 | 184.5 to 197.0 | II/AMV | 1.50 | 4.76 | 1.78 | |||||||||||||||
| Composite 16 |
2024 | FG22-253 | 298.2 to 310.0 | AMV | 1.75 | 3.86 | 1.90 | |||||||||||||||
| Composite 17 |
2024 | FG22-253 | 321.0 to 333.0 | AMV/MV | 2.54 | 4.57 | 1.29 | |||||||||||||||
| Composite 18 |
2024 | FG22-253 | 345.0 to 354.9 | AMV/ASYN | 4.67 | 5.60 | 1.89 | |||||||||||||||
| Composite 19 |
2024 | FG23-310 | 42.9 to 56.0 | PYX/LAMP | 0.37 | 6.37 | 0.99 | |||||||||||||||
| Composite 20 |
2024 | FG23-310 | 67.0 to 82.8 | PYX | 0.81 | 10.80 | 1.73 | |||||||||||||||
| Composite 21 |
2024 | FG23-310 | 87.1 to 99.0 | PYX/SYN | 0.42 | 7.10 | 2.05 | |||||||||||||||
| Composite 22 |
2024 | FG23-310 | 146.1 to 152.7 | PYX/PMV | 0.46 | 7.91 | 1.07 | |||||||||||||||
| Composite 23 |
2024 | FG23-312 | 32.5 to 36.9 | PYX | 6.88 | 7.43 | 0.81 | |||||||||||||||
| Composite 24 |
2024 | FG23-312 | 42.0 to 48.0 | PYX | 0.97 | 8.62 | 1.17 | |||||||||||||||
| Composite 25 |
2024 | FG23-312 | 67.0 to 78.1 | PYX | 1.33 | 10.10 | 2.81 | |||||||||||||||
| Composite 26 |
2024 | FG23-312 | 78.1 to 88.5 | PYX/AMI | 2.41 | 8.10 | 2.15 | |||||||||||||||
| Composite 27 |
2024 | FG23-312 | 89.5 to 99.5 | PYX | 19.10 | 7.18 | 0.30 | |||||||||||||||
| Composite 28 |
2024 | FG23-350a | 35.0 to 47.1 | MV | 2.00 | 6.33 | 2.28 | |||||||||||||||
| Composite 29 |
2024 | FG23-350a | 49.5 to 63.0 | SYN | 1.69 | 5.57 | 1.61 | |||||||||||||||
| Composite 30 |
2024 | FG23-350a | 64.0 to 77.0 | ASYN | 1.86 | 4.65 | 3.35 | |||||||||||||||
| Composite 31 |
2024 | FG23-350a | 77.0 to 88.4 | ASYN | 1.62 | 7.16 | 2.15 | |||||||||||||||
| Composite 32 |
2024 | FG23-350a | 96.0 to 108.0 | SYN | 0.56 | 6.78 | 2.55 | |||||||||||||||
| Composite 33 |
2024 | FG23-350a | 108.0 to 117.7 | SYN | 1.76 | 5.69 | 2.72 | |||||||||||||||
| Composite 34 |
2024 | FG23-350a | 119.3 to 131.2 | SYN | 1.51 | 6.45 | 1.51 | |||||||||||||||
| Composite 35 |
2024 | FG23-350a | 131.2 to 146.2 | SYN | 3.10 | 7.09 | 3.27 | |||||||||||||||
| Composite 36 |
2024 | FG23-350a | 147.9 to 162.7 | SYN/ASYN | Spar | — | — | |||||||||||||||
| Composite 37 |
2024 | FG23-350a | 168.7 to 181.0 | ASYN | 2.12 | 4.70 | 2.82 | |||||||||||||||
| Composite 38 |
2024 | FG23-350a | 185.0 to 201.0 | ASYN | 0.68 | 4.17 | 3.15 | |||||||||||||||
| Composite 39 |
2024 | FG23-350a | 207.3 to 218.0 | SYN | 6.32 | 5.48 | 4.94 | |||||||||||||||
| Composite 40 |
2024 | FG23-350a | 218.0 to 228.0 | ASYN/II/SYN | 2.57 | 6.48 | 3.61 | |||||||||||||||
| Composite 41 |
2024 | FG23-350a | 337.5 to 350.0 | ASYN | Spare | — | — | |||||||||||||||
| Composite 42 |
2024 | FG23-356 | 31.0 to 43.1 | SYN | 0.59 | 4.02 | 1.80 | |||||||||||||||
| Composite 43 |
2024 | FG23-356 | 52.0 to 83.0 | ASYN/II/SYN/PYX | 0.49 | 5.86 | 1.09 | |||||||||||||||
|
|
PAGE | 13-7 October 10, 2025 |
| MAYFAIR GOLD CORP.
|
| |
| National Instrument 43-101 Technical Report—Mineral Resource Estimate Update Fenn–Gib Project, Ontario, Canada |
| Composite ID |
Year | Drill Hole |
Interval Depth |
Lithology |
Au g/t | %Fe | %S2- | |||||||||||||||
| Composite 44 |
2024 | FG23-356 | 115.5 to 131.0 | PYX | 0.78 | 9.29 | 2.33 | |||||||||||||||
| Composite 45 |
2024 | FG23-356 | 147.0 to 162.2 | AMV | 1.44 | 7.41 | 3.95 | |||||||||||||||
| Composite 46 |
2024 | FG22-253 | 34.0 to 50.0 | AFI/AMV | 0.25 | 6.61 | 1.64 | |||||||||||||||
| Composite 47 |
2024 | FG23-307 | 43.0 to 61.0 | PYX/LAMP | 0.18 | 8.61 | 1.05 | |||||||||||||||
| Composite 48 |
2024 | FG23-307 | 96.0 to 115.6 | FP/PYX | 0.22 | 6.95 | 1.40 | |||||||||||||||
| Composite 49 |
2024 | FG23-310 | 24.0 to 42.9 | AII/PYX/LAMP | 0.59 | 7.55 | 0.52 | |||||||||||||||
| Composite 50 |
2024 | FG23-312 | 100.5 to 113.0 | PYX/LAMP | 0.23 | 8.26 | 0.29 | |||||||||||||||
| Rock Hardness Characterization Samples |
| |||||||||||||||||||||
| GCC-01 |
2024 | FG21-137 FG21-137 FG21-137 FG21-142 |
15.0 to 16.3 18.3 to 21.4 23.0 to 33.8 25.6 to 29.2 |
MV MV MV MV |
||||||||||||||||||
| GCC-02 |
2024 | GT23-03 GT23-03 |
14.0 to 18.0 54.0 to 59.0 |
AMV AMV |
||||||||||||||||||
| GCC-03 |
2024 | FG23-312 | 50.2 to 66.0 | PYX | ||||||||||||||||||
| GCC-04 |
2024 | FG22-250 FG23-356 |
40.0 to 50.0 43.1 to 49.0 |
SYN SYN |
||||||||||||||||||
| GCC-05 |
2024 | FG23-302 | 117.0 to 132.2 | SED | ||||||||||||||||||
| GCC-06 |
2024 | GT23-03 | 87.0 to 91.5 97.5 to 102.0 |
AMV SYN |
||||||||||||||||||
| GCC-07 |
2024 | FG22-265 | 27.0 to 43.0 | SYN | ||||||||||||||||||
| GCC-08 |
2024 | FG22-280 | 59.0 to 75.0 | MV | ||||||||||||||||||
| GCC-09 |
2024 | FG22-265 | 108.0 to 124.0 | AMV | ||||||||||||||||||
| GCC-10 |
2024 | FG23-360 | 175.0 to 185.0 | PYX | ||||||||||||||||||
| GCC-11 |
2024 | FG23-360 | 156.0 to 167.4 | SYN | ||||||||||||||||||
| GCC-12 |
2024 | FG22-294a | 120.0 to 135.0 | II | ||||||||||||||||||
Source: Haggarty Technical Services in conjunction with Fenn–Gib Project geologists.
| 13.3.4 | Rock Hardness Characterization |
The rock hardness characterization data set includes Bond ball mill work index testwork from 2014, 2022, and 2024. Parameters determined in 2024 include JKTech Axb rock competency, abrasion index, crusher work index, SAG Power Index (SPI), SAG Circuit Specific Energy (SCSE), and high-pressure grinding roll (HPGR) Static Pressure Tests (SPT).
The samples evaluated to date, indicate the following (Table 13-3):
| • | The abrasion index is moderate to high, ranging from 0.10 to 0.59, with an average of 0.34 g/h. |
| • | JK Tech Axb rock competency is high, ranging from 22.7 to 36.4, with an average of 25.7. |
| • | Minnovex SPI values range from 134 to 472, with an average of 210. |
| • | The crusher work index is medium, ranging from 8.4 to 21.6 kWh/t, with an average 16.0 kWh/t. |
|
|
PAGE | 13-8 October 10, 2025 |
| MAYFAIR GOLD CORP.
|
| |
| National Instrument 43-101 Technical Report—Mineral Resource Estimate Update Fenn–Gib Project, Ontario, Canada |
| • | HPGR SPT results range from 1.8 to 2.2 kWh/t, with an average 2.0 kWh/t. |
| • | The ball mill-work index ranges from 16.2 to 20.5 kWh/t, with an average 17.8 kWh/t, which is considered hard. The 80% closing size used for ball mill work index determination ranged from 59 to 83 µm with an average of 76 µm. Ball mill Wi values determined at a finer P80 76 µm require modelling and adjustment, as the work index values are expected to be slightly lower (approximately -10%) due to decreased energy required to achieve a coarser product grind size of P80 106 µm. |
Table 13-3: Rock Hardness Characterization Test Data
| Composite |
DDH | Lithology | Abrasion Index |
JK (Axb) |
SPI Index |
Crusher Wi (kWh/t) |
HPGR SPT (kWh/t) |
F80 (µm) |
P80 (µm) |
Ball Mill Wi (kWh/t) |
||||||||||||||||||||||||||||
| FG-11-051 |
FG-11-05 | — | — | — | — | — | — | 2,536 | 67 | 16.9 | ||||||||||||||||||||||||||||
| FG-11-081 |
FG-11-08 | — | — | — | — | — | — | 2,523 | 70 | 16.8 | ||||||||||||||||||||||||||||
| FG-12-131 |
FG-12-13 | — | — | — | — | — | — | 2,499 | 68 | 16.6 | ||||||||||||||||||||||||||||
| FG-12-291 |
FG-12-29 | — | — | — | — | — | — | 2,616 | 69 | 16.2 | ||||||||||||||||||||||||||||
| Central Pit Mid2 |
FG-21-152 FG-21-155 |
Mixed | 0.59 | 36.4 | — | — | — | 2,549 | 59 | 18.2 | ||||||||||||||||||||||||||||
|
GCC-013 |
FG-21-137 | MV | 0.21 | — | 472 | 10.5 | 2.15 | 2,493 | 78 | 18.5 | ||||||||||||||||||||||||||||
|
GCC-023 |
GT-23-03 | AMV | 0.56 | — | 176 | 16.5 | 1.93 | 2,541 | 81 | 16.5 | ||||||||||||||||||||||||||||
|
GCC-033 |
FG-23-312 | PYX | 0.15 | 22.0 | 300 | 8.4 | 1.90 | 2,359 | 83 | 16.7 | ||||||||||||||||||||||||||||
|
GCC-043 |
FG-22-250 FG-22-356 |
SYN | 0.42 | — | 175 | 16.6 | 1.84 | 2,429 | 82 | 17.9 | ||||||||||||||||||||||||||||
|
GCC-053 |
FG-23-302 | SED | 0.10 | 22.7 | 152 | 16.9 | 1.82 | 2,385 | 80 | 19.4 | ||||||||||||||||||||||||||||
|
GCC-063 |
GT-23-03 | AMV | 0.27 | — | 141 | 19.1 | 1.91 | 2,402 | 80 | 18.4 | ||||||||||||||||||||||||||||
|
GCC-073 |
FG-22-265 | SYN | 0.45 | — | 134 | 20.7 | 1.98 | 2,374 | 81 | 17.5 | ||||||||||||||||||||||||||||
|
GCC-083 |
FG-22-280 | MV | 0.25 | 22.7 | 144 | 21.6 | 2.08 | 2,368 | 79 | 20.5 | ||||||||||||||||||||||||||||
|
GCC-103 |
FG -23-360 | PYX | 0.51 | — | 234 | 12.9 | 2.06 | 2,391 | 82 | 19.1 | ||||||||||||||||||||||||||||
|
GCC-123 |
FG-22-294a | II | 0.19 | 24.6 | 172 | 16.5 | 2.03 | 2,369 | 79 | 17.4 | ||||||||||||||||||||||||||||
| Notes: |
1SGS-Lakefield, Project 13640-01, Final Report #2, January 2015 for Lake Shore Gold. | |
| 2SGS-Lakefield, Project 18831-01 Final Report, August 2022 for Mayfair Gold. | ||
| 3SGS-Lakefield, Project 18831-03 Metallurgical Test Results from 2024 for Mayfair Gold (report in progress). |
| 13.3.5 | Mineralogy |
Mineralogy studies at SGS-Lakefield (2022) and PMC-Vancouver (2024–2025) applied TESCAN TIMA automated scanning electron microscopy (SEM) and established that gold mineralization present includes fine free gold, electrum (Au–Ag), petzite (Ag3AuTe2), calaverite (AuTe2), and dissemination of values in association with silicates and iron sulphides.
The gold values present in the feed are surficial and fine-grained dissemination in pyrite (FeS2) and to a lesser extent arsenopyrite (FeAsS). The remainder includes fine free gold, or gold alloys with silver or tellurium. Gold grains observed vary in size from less than 2 to 26 µm.
|
|
PAGE | 13-9 October 10, 2025 |
| MAYFAIR GOLD CORP.
|
| |
| National Instrument 43-101 Technical Report—Mineral Resource Estimate Update Fenn–Gib Project, Ontario, Canada |
Metallurgical variability testing and SEM mineralogical studies revealed that a portion of the gold remaining in the cyanidation residue occur as a solid solution within pyrite. The presence of finely disseminated gold within some iron sulphide grains is accounted for in the Project’s metallurgical gold recovery model. This finely disseminated gold also reflects variability in mineralogical composition and mineralization style consistent with multiple mineralizing events during the deposit genesis.
In some of the cyanidation residues, the presence of 5 to 25 µm-sized gold grains was observed which were recovered with flotation and subsequently reground, yet remained undissolved after cyanidation, even with extended leach time. These occurrences are being further investigated in collaboration with the National Research Council Canada (NRC) to determine whether the gold is present as an alloy with other metals or if gold recovery is hindered due to other forms of passivation.
The sulphide content in the flotation feed composite samples varied between 0.3% and 4.8% sulphide. A variable increase in gold grade is associated with an increase in sulphide content illustrated in Figure 13-1.
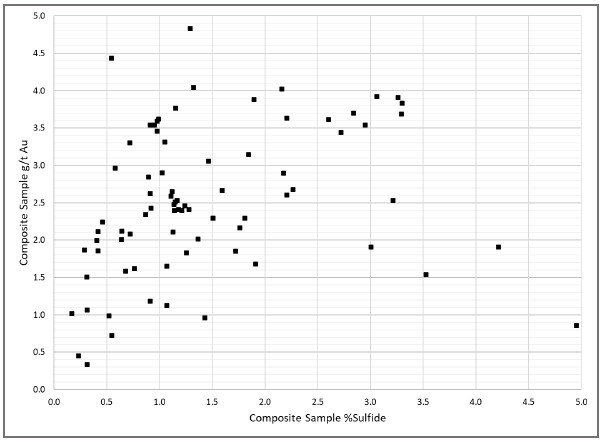
Source: Haggarty Technical Services July 2025—from flotation test data in Table 13-9
Figure 13-1: Composite Sample g/t Au versus Sulphide Content
|
|
PAGE | 13-10 October 10, 2025 |
| MAYFAIR GOLD CORP.
|
| |
| National Instrument 43-101 Technical Report—Mineral Resource Estimate Update Fenn–Gib Project, Ontario, Canada |
| 13.3.6 | Previous 2015–2022 Metallurgical Studies |
Gravity Concentration
Gravity-recoverable gold (GRG) content was evaluated as part of the various test programs, with a comparison between metallic screen fire assays and Mozley or Knelson concentrator gravity recoverable gold content summarized in Table 13-4.
Higher gravity-concentration recoveries are typically achieved from lab-scale centrifugal gravity concentration in comparison to metallic screen fire assays at ±150 mesh. GRG content is variable and independent relative to initial head grade (Figure 13-2). The range in observed gold recovery varies from 0% to 23% from metallic fire screen data, and 0% to 37% from Mozley or Knelson centrifugal gravity concentration over a range in head grade from 0.4 to 4.2 g/t Au.
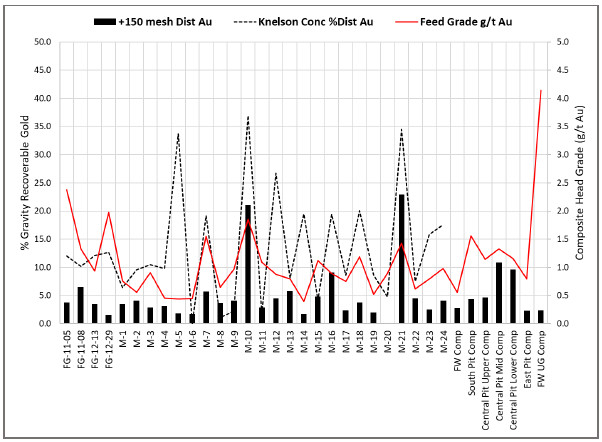
Source: Haggarty Technical Services July 2025—from GRG test data in Table 13-4.
Figure 13-2: Composite Sample, g/t Au versus Gravity Recoverable Gold Content
|
|
PAGE | 13-11 October 10, 2025 |
| MAYFAIR GOLD CORP.
|
| |
| National Instrument 43-101 Technical Report—Mineral Resource Estimate Update Fenn–Gib Project, Ontario, Canada |
Table 13-4: Composite Sample Gravity Recoverable Gold Content
| Composite Sample |
Feed (g/t Au) |
Feed (%S2-) |
+150 Mesh (% Mass) |
+150 Mesh (g/t Au) |
+150 Mesh (% Dist Au) |
Centrifugal Conc. (%Mass) |
Centrifugal Conc. (g/t Au) |
Centrifugal Conc. (% Dist Au) |
||||||||||||||||||||||||
| FG-11-05 1 |
2.38 | 4.02 | 2.87 | 3.18 | 3.8 | 0.08 | 330.00 | 12.0 | ||||||||||||||||||||||||
| FG-11-08 1 |
1.33 | 2.68 | 3.04 | 2.85 | 6.5 | 0.12 | 118.00 | 10.2 | ||||||||||||||||||||||||
| FG-12-13 1 |
0.94 | 2.58 | 2.88 | 1.16 | 3.5 | 0.12 | 101.00 | 12.1 | ||||||||||||||||||||||||
| FG-12-29 1 |
1.98 | 1.72 | 1.62 | 1.9 | 1.6 | 0.08 | 317.00 | 12.7 | ||||||||||||||||||||||||
| M-1 2 |
0.76 | 1.59 | 2.60 | 1.03 | 3.5 | 0.09 | 45.70 | 6.4 | ||||||||||||||||||||||||
| M-2 2 |
0.56 | 1.70 | 3.00 | 0.76 | 4.1 | 0.07 | 83.80 | 9.6 | ||||||||||||||||||||||||
| M-3 2 |
0.91 | 3.10 | 2.08 | 1.27 | 2.9 | 0.07 | 118.00 | 10.5 | ||||||||||||||||||||||||
| M-4 2 |
0.46 | 2.56 | 2.75 | 0.52 | 3.1 | 0.07 | 60.70 | 9.8 | ||||||||||||||||||||||||
| M-5 2 |
0.44 | 1.64 | 1.90 | 0.44 | 1.9 | 0.09 | 225.00 | 33.7 | ||||||||||||||||||||||||
| M-6 2 |
0.45 | 1.01 | 2.76 | 0.27 | 1.7 | 0.07 | 0.15 | 0.0 | ||||||||||||||||||||||||
| M-7 2 |
1.55 | 3.86 | 3.17 | 2.80 | 5.7 | 0.07 | 394.00 | 19.2 | ||||||||||||||||||||||||
| M-8 2 |
0.65 | 8.08 | 2.41 | 1.01 | 3.7 | 0.11 | 6.57 | 1.1 | ||||||||||||||||||||||||
| M-9 2 |
0.97 | 4.15 | 2.78 | 1.44 | 4.1 | 0.12 | 19.80 | 2.3 | ||||||||||||||||||||||||
| M-10 2 |
1.85 | 2.10 | 1.60 | 24.34 | 21.1 | 0.10 | 557.00 | 36.9 | ||||||||||||||||||||||||
| M-11 2 |
1.09 | 5.94 | 1.43 | 2.21 | 2.9 | 0.10 | 24.10 | 2.0 | ||||||||||||||||||||||||
| M-12 2 |
0.88 | 2.69 | 2.77 | 1.44 | 4.5 | 0.21 | 115.00 | 26.7 | ||||||||||||||||||||||||
| M-13 2 |
0.80 | 3.41 | 1.71 | 2.72 | 5.8 | 0.19 | 34.90 | 8.1 | ||||||||||||||||||||||||
| M-14 2 |
0.40 | 0.60 | 1.94 | 0.36 | 1.7 | 0.19 | 47.00 | 19.5 | ||||||||||||||||||||||||
| M-15 3 |
1.12 | 7.17 | 2.54 | 2.22 | 4.8 | 0.10 | 46.30 | 4.2 | ||||||||||||||||||||||||
| M-16 3 |
0.89 | 3.18 | 2.32 | 3.46 | 9.1 | 0.11 | 156.00 | 19.4 | ||||||||||||||||||||||||
| M-17 3 |
0.75 | 1.83 | 2.65 | 0.69 | 2.4 | 0.07 | 97.40 | 8.6 | ||||||||||||||||||||||||
| M-18 3 |
1.19 | 2.76 | 2.60 | 1.75 | 3.8 | 0.10 | 233.00 | 20.1 | ||||||||||||||||||||||||
| M-19 3 |
0.52 | 1.68 | 1.73 | 0.59 | 2.0 | 0.12 | 41.10 | 8.6 | ||||||||||||||||||||||||
| M-20 3 |
0.89 | 2.12 | 0.07 | 0.94 | 0.1 | 0.06 | 73.80 | 4.8 | ||||||||||||||||||||||||
| M-21 3 |
1.43 | 1.32 | 2.55 | 12.83 | 22.9 | 0.08 | 460.00 | 34.5 | ||||||||||||||||||||||||
| M-22 3 |
0.62 | 2.45 | 2.89 | 0.96 | 4.5 | 0.11 | 43.00 | 7.5 | ||||||||||||||||||||||||
| M-23 3 |
0.80 | 2.88 | 3.05 | 0.65 | 2.5 | 0.08 | 164.00 | 15.9 | ||||||||||||||||||||||||
| M-24 3 |
0.98 | 0.88 | 2.85 | 1.42 | 4.1 | 0.08 | 212.00 | 17.6 | ||||||||||||||||||||||||
| FW Comp. 4 |
0.56 | 4.44 | 2.60 | 0.60 | 2.8 | — | — | — | ||||||||||||||||||||||||
| South Pit Comp. 4 |
1.56 | 2.42 | 2.70 | 1.59 | 4.4 | — | — | — | ||||||||||||||||||||||||
| Central Pit Upper Comp. 4 |
1.14 | 3.31 | 2.60 | 1.79 | 4.7 | — | — | — | ||||||||||||||||||||||||
| Central Pit Mid Comp. 4 |
1.33 | 2.11 | 2.10 | 6.51 | 10.9 | — | — | — | ||||||||||||||||||||||||
| Central Pit Lower Comp. 4 |
1.16 | 0.96 | 3.00 | 9.21 | 9.6 | — | — | — | ||||||||||||||||||||||||
| East Pit Comp. 4 |
0.80 | 1.62 | 1.70 | 1.04 | 2.3 | — | — | — | ||||||||||||||||||||||||
| FW UG Comp. 4 |
4.15 | 2.53 | 3.00 | 2.70 | 2.4 | — | — | — | ||||||||||||||||||||||||
| Notes: |
1SGS-Lakefield, Project 13640-01, Final Report #2, January 2015 for Lake Shore Gold. | |
| 2SGS-Lakefield, Project 16116-001, Final Report, December 2017 for Tahoe Resources. | ||
| 3SGS-Lakefield, Project 16116-001, Batch #2 Samples, July 2018 for Tahoe Resources. | ||
| 4SGS-Lakefield, Project 18831-01 Metallurgical Test Results, August 2022 for Mayfair Gold. |
|
|
PAGE | 13-12 October 10, 2025 |
| MAYFAIR GOLD CORP.
|
| |
| National Instrument 43-101 Technical Report—Mineral Resource Estimate Update Fenn–Gib Project, Ontario, Canada |
Direct Cyanidation
Direct (whole ore) cyanidation performance indicated in Figure 13-3 and Table 13-5 confirm that at a grind size of P80 106 µm, gold extraction decreases proportionately with feed sulphide content, with a matching increase in cyanidation residue gold grade. Recovery trends are variable and decrease from approximately 84% Ext Au at 1.0% S2- to less than 70% Ext Au at greater than 3.0% S2-.
Although gold recovery is hindered by an association with sulphides, Fenn–Gib mineralization is not fully refractory. Improved gold extraction has been observed from rougher concentrates when the iron sulphide mineralization is reground to less than 15 µm.
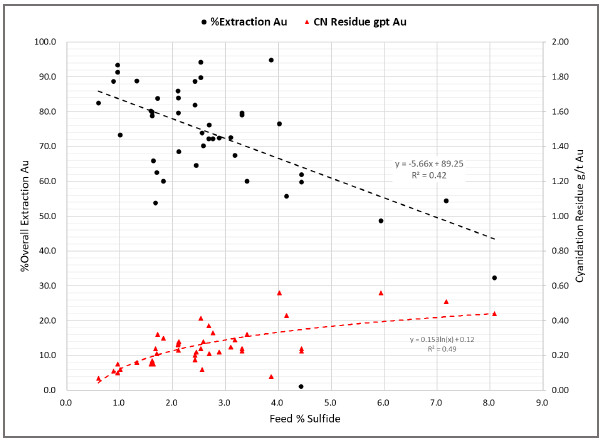
Source: Haggarty Technical Services July 2025—from Gravit–Cyanidation test data in Table 13-5.
Figure 13-3: Direct Cyanidation—Feed Sulphide Content versus Overall Gold Extraction
|
|
PAGE | 13-13 October 10, 2025 |
| MAYFAIR GOLD CORP.
|
| |
| National Instrument 43-101 Technical Report—Mineral Resource Estimate Update Fenn–Gib Project, Ontario, Canada |
Table 13-5: Direct Cyanidation Gold Extraction versus Feed Sulphide Content
| Composite Sample |
Grind Size (µm) |
Feed | CN Residue (g/t Au) |
Overall (%Ext Au) |
||||||||||||||||
| g/t Au | %S2- | |||||||||||||||||||
| FG-11-051 |
100 | 2.38 | 4.02 | 0.56 | 76.47 | |||||||||||||||
| FG-11-081 |
99 | 1.33 | 2.68 | 0.37 | 72.18 | |||||||||||||||
| FG-12-131 |
101 | 0.94 | 2.58 | 0.28 | 70.21 | |||||||||||||||
| FG-12-291 |
95 | 1.98 | 1.72 | 0.32 | 83.84 | |||||||||||||||
|
M-12 |
106 | 0.76 | 1.59 | 0.15 | 80.26 | |||||||||||||||
|
M-22 |
86 | 0.56 | 1.70 | 0.21 | 62.50 | |||||||||||||||
|
M-32 |
99 | 0.91 | 3.10 | 0.25 | 72.53 | |||||||||||||||
|
M-42 |
95 | 0.46 | 2.56 | 0.12 | 73.91 | |||||||||||||||
|
M-52 |
95 | 0.44 | 1.64 | 0.15 | 65.91 | |||||||||||||||
|
M-62 |
90 | 0.45 | 1.01 | 0.12 | 73.33 | |||||||||||||||
|
M-72 |
88 | 1.55 | 3.86 | 0.08 | 94.84 | |||||||||||||||
|
M-82 |
105 | 0.65 | 8.08 | 0.44 | 32.31 | |||||||||||||||
|
M-92 |
101 | 0.97 | 4.15 | 0.43 | 55.67 | |||||||||||||||
|
M-102 |
102 | 1.85 | 2.10 | 0.26 | 85.95 | |||||||||||||||
|
M-112 |
101 | 1.09 | 5.94 | 0.56 | 48.62 | |||||||||||||||
|
M-122 |
102 | 0.88 | 2.69 | 0.21 | 76.14 | |||||||||||||||
|
M-132 |
99 | 0.80 | 3.41 | 0.32 | 60.00 | |||||||||||||||
|
M-142 |
96 | 0.40 | 0.60 | 0.07 | 82.50 | |||||||||||||||
|
M-153 |
106 | 1.12 | 7.17 | 0.51 | 54.46 | |||||||||||||||
|
M-163 |
93 | 0.89 | 3.18 | 0.29 | 67.42 | |||||||||||||||
|
M-173 |
97 | 0.75 | 1.83 | 0.30 | 60.00 | |||||||||||||||
|
M-183 |
104 | 1.19 | 2.76 | 0.33 | 72.27 | |||||||||||||||
|
M-193 |
97 | 0.52 | 1.68 | 0.24 | 53.85 | |||||||||||||||
|
M-203 |
100 | 0.89 | 2.12 | 0.28 | 68.54 | |||||||||||||||
|
M-213 |
103 | 1.43 | 1.32 | 0.16 | 88.81 | |||||||||||||||
|
M-223 |
84 | 0.62 | 2.45 | 0.22 | 64.52 | |||||||||||||||
|
M-233 |
95 | 0.80 | 2.88 | 0.22 | 72.50 | |||||||||||||||
|
M-243 |
93 | 0.98 | 0.88 | 0.11 | 88.78 | |||||||||||||||
| FW Comp.4 |
59 | 0.56 | 4.44 | 0.23 | 59.76 | |||||||||||||||
| South Pit Comp.4 |
63 | 1.56 | 2.42 | 0.18 | 88.77 | |||||||||||||||
| Central Pit Upper Comp.4 |
59 | 1.14 | 3.31 | 0.24 | 79.02 | |||||||||||||||
| Central Pit Mid Comp.4 |
62 | 1.33 | 2.11 | 0.27 | 79.68 | |||||||||||||||
| Central Pit Lower Comp.4 |
55 | 1.16 | 0.96 | 0.10 | 91.36 | |||||||||||||||
| East Pit Comp.4 |
59 | 0.80 | 1.62 | 0.17 | 78.75 | |||||||||||||||
| FW UG Comp.4 |
59 | 4.15 | 2.53 | 0.24 | 94.21 | |||||||||||||||
| FW Comp.4 |
59 | 0.63 | 4.44 | 0.24 | 61.93 | |||||||||||||||
| South Pit Comp.4 |
63 | 1.11 | 2.42 | 0.20 | 81.97 | |||||||||||||||
| Central Pit Upper Comp.4 |
59 | 1.11 | 3.31 | 0.23 | 79.67 | |||||||||||||||
| Central Pit Mid Comp.4 |
62 | 1.43 | 2.11 | 0.23 | 83.90 | |||||||||||||||
|
|
PAGE | 13-14 October 10, 2025 |
| MAYFAIR GOLD CORP.
|
| |
| National Instrument 43-101 Technical Report—Mineral Resource Estimate Update Fenn–Gib Project, Ontario, Canada |
| Composite Sample |
Grind Size (µm) |
Feed | CN Residue (g/t Au) |
Overall (%Ext Au) |
||||||||||||||||
| g/t Au | %S2- | |||||||||||||||||||
| Central Pit Lower Comp.4 |
55 | 2.26 | 0.96 | 0.15 | 93.37 | |||||||||||||||
| East Pit Comp.4 |
59 | 0.80 | 1.62 | 0.16 | 79.87 | |||||||||||||||
| FW UG Comp.4 |
59 | 4.05 | 2.53 | 0.42 | 89.76 | |||||||||||||||
| Source: |
1SGS-Lakefield, Project 13640-01, Final Report #2, January 2015 for Lake Shore Gold. | |
| 2SGS-Lakefield, Project 16116-001, Final Report, December 2017 for Tahoe Resources. | ||
| 3SGS-Lakefield, Project 16116-001, Batch #2 Samples, July 2018 for Tahoe Resources. | ||
| 4SGS-Lakefield, Project 18831-01 Metallurgical Test Results, August 2022 for Mayfair Gold. |
Diagnostic Leaching
Diagnostic leaching of cyanidation residue samples was conducted as part of the 2015, 2017, and 2022 metallurgical test programs to determine gold deportment within various mineral matrices.
The four separate stages of diagnostic leaching provide a qualitative indication of metal deportment from a cyanidation residue as CN soluble gold, with Fe, As or Bi oxides, with carbonates, with sulphides, or with silicates. Diagnostic test methods include:
| • | CIL Cyanidation at 40% solids w/w for 24 hours |
| • | Hot HCl Acid Leach + Fresh Water Rinse + Cyanidation at 20% solids w/w, 80°C for 3 hours |
| • | Hot H2SO4 Acid Leach + Fresh Water Rinse + Cyanidation at 20% solid w/w, 85°C for 3 hours |
| • | Hot (HNO3 + HCl) + Fresh Water Rinse + Cyanidation at 20% solids w/w, 90°C for 6 hours |
| • | Final Residue. |
Summarized in Table 13-6, remnant gold values in cyanidation residues are associated with sulphide mineralization, followed by association with carbonates, or Fe, As, and Bi oxides.
Table 13-6: Diagnostic Leaching Tests Results
| Composite Sample |
Note | Sample | %Au Extraction from Residue | |||||||||||||||||||||||||||||||||
| P80 µm | Direct CN | %S2- | Cyanide Leach |
Hydrochloric Leach |
Sulphuric Leach |
Aqua-Regia Leach |
Au with silicates |
|||||||||||||||||||||||||||||
| FG-11-05 |
1 | 83 | 79.5 | 4.02 | 5.1 | — | 21.5 | 70.7 | 2.7 | |||||||||||||||||||||||||||
| FG-11-08 |
1 | 67 | 81.7 | 2.68 | 8.0 | — | 21.7 | 66.1 | 4.2 | |||||||||||||||||||||||||||
| FG-12-13 |
1 | 78 | 75.9 | 2.58 | 11.2 | — | 25.2 | 57.1 | 6.5 | |||||||||||||||||||||||||||
| FG-12-29 |
1 | 77 | 90.1 | 1.72 | 10.1 | — | 44.2 | 38.8 | 6.9 | |||||||||||||||||||||||||||
| M-7 |
2 | 30 | 84.2 | 3.86 | 6.8 | 38.5 | 20.3 | 31.9 | 2.5 | |||||||||||||||||||||||||||
| M-8 |
2 | 28 | 50.1 | 8.08 | 6.3 | 29.0 | 15.5 | 11.9 | 37.3 | |||||||||||||||||||||||||||
| M-9 |
2 | 33 | 70.3 | 4.15 | 4.0 | 26.5 | 20.0 | 46.9 | 2.6 | |||||||||||||||||||||||||||
| M-11 |
2 | 27 | 64.2 | 5.94 | 3.1 | 25.7 | 21.2 | 30.2 | 19.8 | |||||||||||||||||||||||||||
| M-13 |
2 | 25 | 74.7 | 3.41 | 3.8 | 32.6 | 27.1 | 34.1 | 2.4 | |||||||||||||||||||||||||||
|
|
PAGE | 13-15 October 10, 2025 |
| MAYFAIR GOLD CORP.
|
| |
| National Instrument 43-101 Technical Report—Mineral Resource Estimate Update Fenn–Gib Project, Ontario, Canada |
| Composite Sample |
Note | Sample | %Au Extraction from Residue | |||||||||||||||||||||||||||||||||
| P80 µm | Direct CN | %S2- | Cyanide Leach |
Hydrochloric Leach |
Sulphuric Leach |
Aqua-Regia Leach |
Au with silicates |
|||||||||||||||||||||||||||||
| Central Pit Upper |
3 | 59 | 79.0 | 3.31 | 5.8 | 29.4 | 17.4 | 43.4 | 4.0 | |||||||||||||||||||||||||||
| Central Pit Mid |
3 | 62 | 83.9 | 2.11 | 5.6 | 17.1 | 20.1 | 52.9 | 4.3 | |||||||||||||||||||||||||||
| East Pit |
3 | 59 | 79.9 | 1.62 | 6.4 | 27.5 | 21.2 | 41.4 | 3.5 | |||||||||||||||||||||||||||
| Notes: |
1SGS-Lakefield, Project 13640-01, Final Report #2, January 2015 for Lake Shore Gold. | |
| 2SGS-Lakefield, Project 16116-001, Final Report, December 2017 for Tahoe Resources. | ||
| 3SGS-Lakefield, Project 18831-01, Final Report, August 2022 for Mayfair Gold. |
Acid Pressure Oxidation
The amenability of the mineralization to flotation followed by acid pressure oxidation was evaluated through bench scale testwork on five different flotation concentrates. Summarized in Table 13-7, a CN gold extraction of 89% to 99% was achieved from a flotation concentrate with 72% to 100% sulphide oxidation, yielding an overall gold recovery that varied from 73% to 91% Ext Au. The results obtained from flotation followed by pressure oxidation (POX) were essentially comparable to those achieved from flotation, regrinding, and cyanidation.
The performance from high-temperature and high-pressure oxidation must be compared to other viable alternatives. With pressure oxidation applied on a flotation concentrate, the incremental increase in gold recovery from cyanidation of flotation tailings was excluded from the analysis of overall % Au extraction due to sub-economic flotation tailings grades of 0.02 to 0.07 g/t Au. There is no apparent benefit associated with the higher capital cost (CapEx) and operating cost (OpEx) pressure oxidation chemistry relative to results achieved through fine grinding and cyanidation of a flotation concentrate.
Table 13-7: Pressure Oxidation Amenability Testwork
| Composite |
Product |
Flotation (%Rec Au) |
POX (°C) |
POX Time (min) |
Oxidation (%S2) |
POX Residue CN (%Ext Au) |
Overall (%Ext Au) |
|||||||||||||||||||
| FG-11-051 |
Rougher Conc. | 90.0 | 200 | 60 | 99.5 | 97.1 | 87.4 | |||||||||||||||||||
| FG-11-051 |
Rougher Conc. | 90.0 | 200 | 90 | 99.5 | 96.7 | 87.0 | |||||||||||||||||||
| FG-11-081 |
Rougher Conc. | 82.9 | 200 | 60 | 92.5 | 94.9 | 78.7 | |||||||||||||||||||
| FG-11-081 |
Rougher Conc. | 82.9 | 200 | 90 | 92.5 | 97.6 | 80.9 | |||||||||||||||||||
| FG-12-131 |
Rougher Conc. | 90.8 | 200 | 60 | 98.3 | 88.7 | 80.5 | |||||||||||||||||||
| FG-12-131 |
Rougher Conc. | 90.8 | 200 | 90 | 97.8 | 97.9 | 88.9 | |||||||||||||||||||
| FG-12-291 |
Rougher Conc. | 80.0 | 200 | 60 | 71.8 | 92.6 | 74.1 | |||||||||||||||||||
| FG-12-291 |
Rougher Conc. | 80.0 | 200 | 90 | 72.0 | 91.8 | 73.4 | |||||||||||||||||||
| Bulk Composite2 |
3rd Cleaner Conc. | 92.0 | 230 | 75 | 97.6 | 99.3 | 91.4 | |||||||||||||||||||
| Notes: |
1SGS-Lakefield, Project 13640-01, Final Report #2, January 2015 for Lake Shore Gold. | |
| 2SGS-Lakefield, Project 18831-01, Final Report, August 2022 for Mayfair Gold. |
|
|
PAGE | 13-16 October 10, 2025 |
| MAYFAIR GOLD CORP.
|
| |
| National Instrument 43-101 Technical Report—Mineral Resource Estimate Update Fenn–Gib Project, Ontario, Canada |
| 13.3.2 | Metallurgical Studies—2023–2024 |
Heavy Liquid Separation
HLS amenability testwork was completed in 2024 to evaluate the potential to reject a lower-grade fraction and decrease the initial tonnage to be processed at higher grade.
For the single Composite #16 selected for testwork, there was no demonstrable benefit derived from HLS with proportional capture and rejection of values relative to the host rock over the range in specific gravity from 2.7 to 3.1 g/mL.
Testwork at SGS applied methylene iodide as the organic medium, with the specific gravity of the liquid phase adjusted using acetone. The prepared sample at P64 20 mesh (0.84 mm), was first introduced into the organic medium adjusted to SG 3.1 g/mL. The float fraction was removed and the sink fraction recovered. The organic medium was then adjusted to the next-lowest specific gravity, and the previous sink fraction reintroduced to recover a second-stage float fraction. The testwork was conducted at 0.10 g/mL increments to evaluate a range of specific gravities from 2.7 to 3.1 g/mL, with results summarized in Table 13-8 and in Figure 13-4.
The applicability of HLS was not demonstrated on the 1.75 g/t Au composite sample considered. No additional HLS testwork was pursued.
Table 13-8: Heavy Liquid Separation Test Results
| Specific Gravity |
Fraction | Cum % Mass | g/t Au | %Fe | %S | %Dist Au | %Dist Fe | %Dist S | ||||||||||||||||||||||
| 2.7 |
Float | 33.1 | 33.1 | 2.61 | 0.59 | 20.5 | 22.3 | 18.0 | ||||||||||||||||||||||
| 2.8 |
Float | 92.4 | 92.4 | 3.51 | 0.89 | 87.0 | 83.9 | 75.3 | ||||||||||||||||||||||
| 2.9 |
Float | 98.8 | 98.8 | 3.76 | 1.02 | 95.7 | 96.3 | 93.1 | ||||||||||||||||||||||
| 3.0 |
Float | 99.6 | 99.6 | 3.82 | 1.06 | 98.1 | 98.5 | 97.1 | ||||||||||||||||||||||
| 3.1 |
Float | 99.8 | 99.8 | 3.85 | 1.07 | 99.0 | 99.4 | 98.4 | ||||||||||||||||||||||
| HLS Test Feed |
100.0 | 1.75 | 3.86 | 1.09 | 100.0 | 100.0 | 100.0 | |||||||||||||||||||||||
| Note: |
SGS-Lakefield, Project 18831-03 Metallurgical Test Results for 2025 for Mayfair Gold. |
|
|
PAGE | 13-17 October 10, 2025 |
| MAYFAIR GOLD CORP.
|
| |
| National Instrument 43-101 Technical Report—Mineral Resource Estimate Update Fenn–Gib Project, Ontario, Canada |
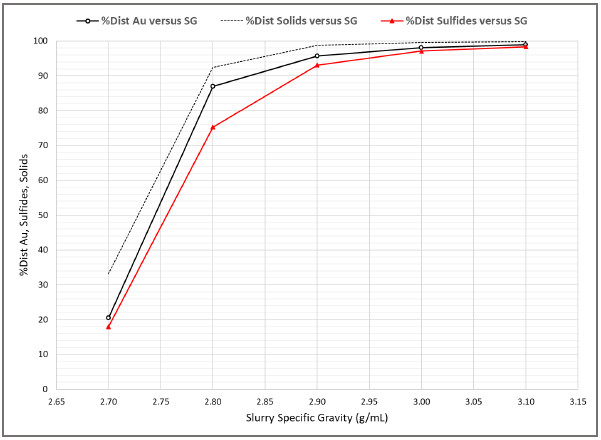
Source: Haggarty Technical Services July 2025—from HLS test data in Table 13-8.
Figure 13-4: Heavy Liquid Separation—Au Distribution versus Slurry Specific Gravity
Rougher Flotation Optimization
The optimization of iron sulphide and fine free gold flotation continued from 2023 into 2025 with metallurgical test results summarized in Table 13-9.
The impact of flotation feed grind size on gold and iron sulphide recovery to rougher concentrate is illustrated in Figure 13-5. A slight decrease of approximately 1% in gold recovery is observed at P80 106 µm compared to P80 75 µm, with a similar reduction in sulphide recovery over the same particle-size range.
Testwork completed to date is adequate to support the consideration of a slightly coarser grind size of P80 106 µm. Additional testwork is required to confirm the sensitivity of gold recovery, and selectivity in rougher flotation at coarser grind sizes approaching 125 and 150 µm.
Mass pull is a significant and controllable variable which influences sulphide recovery, and the capture of slower, floating free-gold values to rougher concentrate that is summarized in Table 13-9 and Figure 13-6.
|
|
PAGE | 13-18 October 10, 2025 |
| MAYFAIR GOLD CORP.
|
| |
| National Instrument 43-101 Technical Report—Mineral Resource Estimate Update Fenn–Gib Project, Ontario, Canada |
As indicated in Table 13-7, sulphide mineralization is more responsive and exhibits faster flotation-rate kinetics when compared to fine free gold. A mass pull of 23% to 25% relative to feed weight was established from testwork as a target to achieve 94% to 96% gold recovery and 94% to 98% sulphide recovery to rougher concentrate over a range in feed grade from 0.17 to 13.55 g/t Au and 0.33% to 4.83% S2-.
Batch lab-scale flotation time to achieve 25% mass pull was determined as 20 minutes, which would be multiplied by a scale-up factor of 2.5 to define full-scale flotation equipment requirements.
Variability testing on the 46 composite samples targeted a mass pull of 23% to rougher concentrate to achieve near-optimal metal and sulphide recovery from samples tested.
Flotation testwork completed in 2015 considered potassium amyl xanthate (PAX) as the primary collector, and methyl isobutyl carbinol (MIBC) as the frother, at natural pH. Subsequent testwork during 2023–2025 involved the use of secondary collectors that included isobutyl dithiophosphate (Aero-3477) and isoamyl dithiophosphate (Aero-3501) to improve the stability of the froth and to pursue incremental gold recovery. Alternative collectors including MaxGold and Aerophine 3418A were evaluated and confirmed as comparable; however, a more brittle froth was noted in rougher flotation.
Rougher flotation rate kinetics were evaluated as a component of baseline testing indicated in Figure 13-7, with 96% Rec S2- achieved after 15 minutes, and approximately 98% Rec S2- after 20 minutes of bench-scale flotation. Gold deportment is estimated at approximately 65% with iron sulphides and 35% as fine free gold, which exhibits slightly slower rate kinetics. A nominal 93% gold recovery was achieved after 15 minutes and 95% after 20 minutes of bench-scale flotation. A target mass pull of 23% and adequate flotation retention time are equally important and supported by a bench-scale flotation time of 20 minutes, which would be subjected to a 2.5-times factor for full-scale design.
|
|
PAGE | 13-19 October 10, 2025 |
| MAYFAIR GOLD CORP.
|
| |
| National Instrument 43-101 Technical Report—Mineral Resource Estimate Update Fenn–Gib Project, Ontario, Canada |
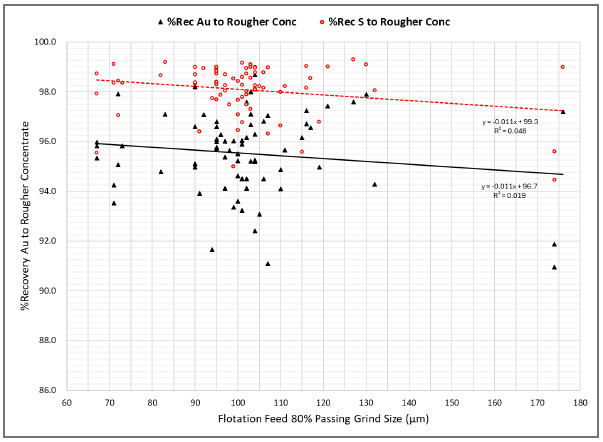
Source: Haggarty Technical Services July 2025—from flotation test data in Table 13-9.
Figure 13-5: Flotation Feed Grind Size versus %Recovery Gold and S2- to Rougher Concentrate
|
|
PAGE | 13-20 October 10, 2025 |
| MAYFAIR GOLD CORP.
|
| |
| National Instrument 43-101 Technical Report—Mineral Resource Estimate Update Fenn–Gib Project, Ontario, Canada |
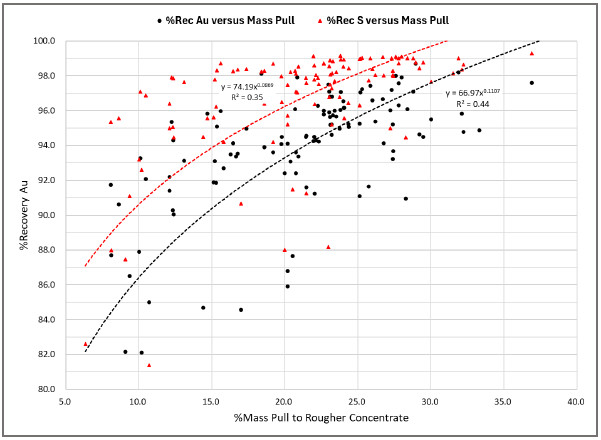
Source: Haggarty Technical Services July 2025—from flotation test data in Table 13-9.
Figure 13-6: Mass Pull versus %Recovery Gold and S2- to Rougher Concentrate
|
|
PAGE | 13-21 October 10, 2025 |
| MAYFAIR GOLD CORP.
|
| |
| National Instrument 43-101 Technical Report—Mineral Resource Estimate Update Fenn–Gib Project, Ontario, Canada |
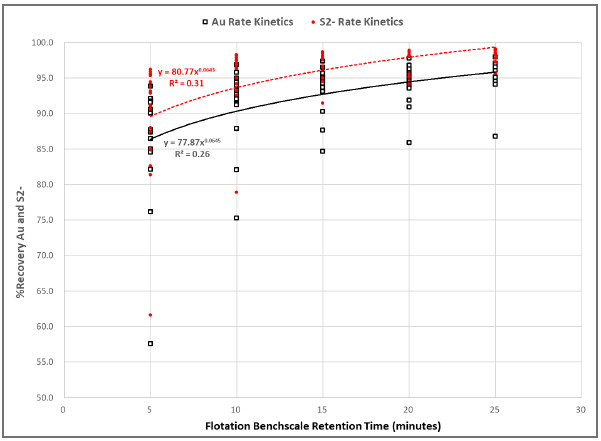
Source: Haggarty Technical Services July 2025—from flotation test data in Table 13-9.
Figure 13-7: Rougher Flotation Gold and S2- Rate Kinetics
|
|
PAGE | 13-22 October 10, 2025 |
| MAYFAIR GOLD CORP.
|
| |
| National Instrument 43-101 Technical Report—Mineral Resource Estimate Update Fenn–Gib Project, Ontario, Canada |
Table 13-9: Rougher Flotation Test Data
| Composite |
Flotation Feed | Rougher Conc. #1 | Rougher Conc. #2 | Rougher Conc. #3 | Rougher Conc. #4 | |||||||||||||||||||||||||||||||||||||||||||||||||||||||
| P80 µm | g/t Au | %S2- | %Weight | %Rec Au | %Rec S2- | %Weight | %Rec Au | %Rec S2- | %Weight | %Rec Au | %Rec S2- | %Weight | %Rec Au | %Rec S2- | ||||||||||||||||||||||||||||||||||||||||||||||
|
FG11-051 |
101 | 2.2 | 4.0 | 9.4 | 86.5 | 91.1 | 12.1 | 91.4 | 96.4 | 15.2 | 93.1 | 97.8 | 22.0 | 94.5 | 98.6 | |||||||||||||||||||||||||||||||||||||||||||||
|
FG11-081 |
101 | 1.2 | 2.5 | 8.1 | 87.7 | 88.0 | 12.1 | 92.2 | 95.0 | 16.3 | 93.5 | 96.7 | 22.0 | 94.5 | 97.8 | |||||||||||||||||||||||||||||||||||||||||||||
|
FG12-131 |
103 | 0.9 | 2.6 | 10.7 | 85.0 | 81.4 | 15.8 | 92.7 | 94.2 | 19.8 | 94.5 | 96.5 | 23.2 | 95.2 | 97.3 | |||||||||||||||||||||||||||||||||||||||||||||
|
FG12-291 |
100 | 1.7 | 1.9 | 6.3 | 76.2 | 82.6 | 10.2 | 82.1 | 92.6 | 14.4 | 84.7 | 94.5 | 20.2 | 86.8 | 95.7 | |||||||||||||||||||||||||||||||||||||||||||||
| FW2 |
71 | 0.5 | 4.4 | — | — | — | — | — | — | — | — | — | 22.0 | 94.3 | 99.1 | |||||||||||||||||||||||||||||||||||||||||||||
| South Pit2 |
72 | 0.9 | 2.4 | — | — | — | — | — | — | — | — | — | 24.4 | 95.1 | 98.4 | |||||||||||||||||||||||||||||||||||||||||||||
| Central Pit Upper2 |
67 | 1.1 | 3.3 | — | — | — | — | — | — | — | — | — | 15.6 | 96.0 | 98.7 | |||||||||||||||||||||||||||||||||||||||||||||
| Central Pit Mid2 |
67 | 1.1 | 2.1 | — | — | — | — | — | — | — | — | — | 12.2 | 95.3 | 97.9 | |||||||||||||||||||||||||||||||||||||||||||||
| Central Pit Lower2 |
67 | 1.4 | 1.0 | — | — | — | — | — | — | — | — | — | 14.7 | 95.8 | 95.6 | |||||||||||||||||||||||||||||||||||||||||||||
| East Pit2 |
72 | 0.8 | 1.6 | — | — | — | — | — | — | — | — | — | 20.8 | 97.9 | 97.1 | |||||||||||||||||||||||||||||||||||||||||||||
| FW UG2 |
71 | 3.2 | 2.5 | — | — | — | — | — | — | — | — | — | 16.8 | 93.5 | 98.4 | |||||||||||||||||||||||||||||||||||||||||||||
|
FG22-2543 |
73 | 1.1 | 2.5 | 15.3 | 91.9 | 96.2 | 22.3 | 94.2 | 97.5 | 27.4 | 95.2 | 98.1 | — | — | — | |||||||||||||||||||||||||||||||||||||||||||||
|
FG22-2543 |
82 | 1.2 | 2.5 | 17.0 | 84.6 | 90.7 | 22.0 | 91.2 | 96.4 | 27.4 | 93.7 | 98.0 | — | — | — | |||||||||||||||||||||||||||||||||||||||||||||
|
FG22-2543 |
97 | 1.1 | 2.7 | 12.4 | 90.0 | 94.5 | 16.7 | 93.4 | 96.9 | 21.5 | 94.6 | 97.6 | — | — | — | |||||||||||||||||||||||||||||||||||||||||||||
|
FG22-2543 |
102 | 1.2 | 2.4 | — | — | — | — | — | — | — | — | — | 26.8 | 94.1 | 98.0 | |||||||||||||||||||||||||||||||||||||||||||||
|
FG22-2543 |
174 | 1.1 | 2.6 | 6.8 | 57.6 | 61.6 | 9.7 | 75.3 | 78.9 | 20.5 | 87.7 | 91.5 | — | — | — | |||||||||||||||||||||||||||||||||||||||||||||
|
FG22-2543 |
174 | 1.2 | 2.5 | 9.1 | 82.2 | 87.5 | 10.0 | 87.9 | 93.2 | 12.3 | 90.3 | 95.1 | — | — | — | |||||||||||||||||||||||||||||||||||||||||||||
|
FG22-2543 |
90 | 1.2 | 2.4 | 8.1 | 91.7 | 95.4 | 10.1 | 93.3 | 97.1 | 12.4 | 94.3 | 97.9 | 15.4 | 95.1 | 98.3 | |||||||||||||||||||||||||||||||||||||||||||||
|
FG22-2543 |
97 | 1.1 | 2.4 | 8.6 | 90.6 | 95.6 | 10.5 | 92.1 | 96.9 | 13.1 | 93.1 | 97.7 | 16.5 | 94.1 | 98.3 | |||||||||||||||||||||||||||||||||||||||||||||
|
FG22-2543 |
90 | 1.3 | 2.4 | — | — | — | — | — | — | — | — | — | 17.4 | 95.0 | 98.4 | |||||||||||||||||||||||||||||||||||||||||||||
| Comp. 44 |
83 | 1.0 | 3.5 | — | — | — | — | — | — | — | — | — | 42.4 | 97.1 | 99.2 | |||||||||||||||||||||||||||||||||||||||||||||
| Comp. 44 |
104 | 1.0 | 3.6 | — | — | — | — | — | — | — | — | — | 27.8 | 96.3 | 99.0 | |||||||||||||||||||||||||||||||||||||||||||||
| Comp. 44 |
127 | 1.3 | 4.8 | — | — | — | — | — | — | — | — | — | 36.9 | 97.6 | 99.3 | |||||||||||||||||||||||||||||||||||||||||||||
| Comp. 354 |
90 | 3.0 | 3.5 | — | — | — | — | — | — | — | — | — | 31.9 | 98.2 | 99.0 | |||||||||||||||||||||||||||||||||||||||||||||
| Comp. 354 |
130 | 3.1 | 3.9 | — | — | — | — | — | — | — | — | — | 28.0 | 97.9 | 99.1 | |||||||||||||||||||||||||||||||||||||||||||||
| Comp. 354 |
176 | 2.8 | 3.7 | — | — | — | — | — | — | — | — | — | 27.3 | 97.2 | 99.0 | |||||||||||||||||||||||||||||||||||||||||||||
| Comp. 354 |
90 | 3.3 | 3.8 | — | — | — | — | — | — | — | — | — | 19.2 | 96.6 | 98.7 | |||||||||||||||||||||||||||||||||||||||||||||
|
|
PAGE | 13-23 October 10, 2025 |
| MAYFAIR GOLD CORP.
|
| |
| National Instrument 43-101 Technical Report—Mineral Resource Estimate Update Fenn–Gib Project, Ontario, Canada |
| Composite |
Flotation Feed | Rougher Conc. #1 | Rougher Conc. #2 | Rougher Conc. #3 | Rougher Conc. #4 | |||||||||||||||||||||||||||||||||||||||||||||||||||||||
| P80 µm | g/t Au | %S2- | %Weight | %Rec Au | %Rec S2- | %Weight | %Rec Au | %Rec S2- | %Weight | %Rec Au | %Rec S2- | %Weight | %Rec Au | %Rec S2- | ||||||||||||||||||||||||||||||||||||||||||||||
| Comp. 44 |
95 | 1.0 | 3.5 | 9.2 | 87.4 | 84.9 | 12.6 | 94.0 | 97.1 | 15.2 | 95.4 | 98.2 | 19.4 | 96.3 | 98.7 | |||||||||||||||||||||||||||||||||||||||||||||
| Comp. 44 |
95 | 0.9 | 3.5 | 13.7 | 92.1 | 95.9 | 18.8 | 94.4 | 98.3 | 21.3 | 95.0 | 98.7 | 23.4 | 95.5 | 98.8 | |||||||||||||||||||||||||||||||||||||||||||||
| Comp. 354 |
103 | 2.7 | 3.4 | 10.4 | 91.8 | 93.8 | 19.1 | 95.8 | 97.9 | 23.1 | 96.5 | 98.5 | 26.3 | 96.8 | 98.8 | |||||||||||||||||||||||||||||||||||||||||||||
| Comp. 354 |
103 | 3.3 | 3.9 | 10.6 | 93.9 | 92.9 | 17.9 | 96.9 | 98.2 | 21.3 | 97.4 | 98.6 | 25.3 | 97.8 | 98.9 | |||||||||||||||||||||||||||||||||||||||||||||
| Comp. 354 |
95 | 1.9 | 1.7 | — | — | — | — | — | — | — | — | — | 23.4 | 96.0 | 97.7 | |||||||||||||||||||||||||||||||||||||||||||||
| Comp. 314 |
95 | 1.5 | 2.3 | 9.2 | 91.6 | 93.2 | 14.5 | 95.0 | 97.5 | 18.3 | 95.7 | 98.0 | 22.3 | 96.3 | 98.2 | |||||||||||||||||||||||||||||||||||||||||||||
| Comp. 314 |
95 | 1.8 | 2.3 | — | — | — | — | — | — | — | — | — | 20.7 | 96.1 | 98.3 | |||||||||||||||||||||||||||||||||||||||||||||
| Comp. 314 |
95 | 1.5 | 2.3 | — | — | — | — | — | — | — | — | — | 26.0 | 96.6 | 98.4 | |||||||||||||||||||||||||||||||||||||||||||||
| Comp. 15 |
104 | 0.4 | 2.1 | — | — | — | — | — | — | — | — | — | 20.8 | 92.4 | 98.1 | |||||||||||||||||||||||||||||||||||||||||||||
| Comp. 25 |
105 | 0.5 | 2.2 | — | — | — | — | — | — | — | — | — | 20.4 | 93.1 | 98.2 | |||||||||||||||||||||||||||||||||||||||||||||
| Comp. 35 |
99 | 2.3 | 2.7 | — | — | — | — | — | — | — | — | — | 20.9 | 93.4 | 98.5 | |||||||||||||||||||||||||||||||||||||||||||||
| Comp. 45 |
102 | 1.0 | 3.6 | — | — | — | — | — | — | — | — | — | 24.0 | 96.2 | 99.0 | |||||||||||||||||||||||||||||||||||||||||||||
| Comp. 55 |
121 | 1.2 | 3.8 | — | — | — | — | — | — | — | — | — | 25.9 | 97.4 | 99.0 | |||||||||||||||||||||||||||||||||||||||||||||
| Comp. 65 |
106 | 1.0 | 2.9 | — | — | — | — | — | — | — | — | — | 29.5 | 94.5 | 98.8 | |||||||||||||||||||||||||||||||||||||||||||||
| Comp. 75 |
96 | 1.3 | 1.8 | — | — | — | — | — | — | — | — | — | 22.3 | 96.3 | 97.9 | |||||||||||||||||||||||||||||||||||||||||||||
| Comp. 85 |
110 | 0.4 | 2.0 | — | — | — | — | — | — | — | — | — | 19.8 | 94.1 | 98.0 | |||||||||||||||||||||||||||||||||||||||||||||
| Comp. 95 |
104 | 2.2 | 3.6 | — | — | — | — | — | — | — | — | — | 25.1 | 95.3 | 99.0 | |||||||||||||||||||||||||||||||||||||||||||||
| Comp. 105 |
104 | 0.6 | 2.0 | — | — | — | — | — | — | — | — | — | 23.1 | 95.2 | 98.1 | |||||||||||||||||||||||||||||||||||||||||||||
| Comp. 115 |
95 | 1.5 | 3.1 | — | — | — | — | — | — | — | — | — | 22.7 | 95.8 | 98.7 | |||||||||||||||||||||||||||||||||||||||||||||
| Comp. 125 |
104 | 0.9 | 2.3 | — | — | — | — | — | — | — | — | — | 18.4 | 98.1 | 98.3 | |||||||||||||||||||||||||||||||||||||||||||||
| Comp. 135 |
106 | 0.7 | 2.1 | — | — | — | — | — | — | — | — | — | 23.2 | 96.8 | 98.2 | |||||||||||||||||||||||||||||||||||||||||||||
| Comp. 145 |
132 | 1.4 | 2.0 | — | — | — | — | — | — | — | — | — | 22.1 | 94.3 | 98.1 | |||||||||||||||||||||||||||||||||||||||||||||
| Comp. 155 |
94 | 1.1 | 1.7 | — | — | — | — | — | — | — | — | — | 25.8 | 91.7 | 97.8 | |||||||||||||||||||||||||||||||||||||||||||||
| Comp. 175 |
98 | 3.5 | 1.5 | — | — | — | — | — | — | — | — | — | 23.1 | 95.6 | 97.5 | |||||||||||||||||||||||||||||||||||||||||||||
| Comp. 185 |
100 | 4.2 | 1.9 | — | — | — | — | — | — | — | — | — | 20.8 | 93.6 | 97.1 | |||||||||||||||||||||||||||||||||||||||||||||
| Comp. 195 |
100 | 0.3 | 1.1 | — | — | — | — | — | — | — | — | — | 24.4 | 95.2 | 96.4 | |||||||||||||||||||||||||||||||||||||||||||||
| Comp. 205 |
102 | 0.7 | 1.6 | — | — | — | — | — | — | — | — | — | 20.2 | 94.1 | 97.5 | |||||||||||||||||||||||||||||||||||||||||||||
| Comp. 215 |
116 | 0.4 | 1.9 | — | — | — | — | — | — | — | — | — | 31.5 | 96.7 | 98.2 | |||||||||||||||||||||||||||||||||||||||||||||
| Comp. 225 |
99 | 0.6 | 0.8 | — | — | — | — | — | — | — | — | — | 27.2 | 96.0 | 95.0 | |||||||||||||||||||||||||||||||||||||||||||||
| Comp. 235 |
115 | 5.0 | 0.9 | — | — | — | — | — | — | — | — | — | 24.1 | 96.2 | 95.6 | |||||||||||||||||||||||||||||||||||||||||||||
|
|
PAGE | 13-24 October 10, 2025 |
| MAYFAIR GOLD CORP.
|
| |
| National Instrument 43-101 Technical Report—Mineral Resource Estimate Update Fenn–Gib Project, Ontario, Canada |
| Composite |
Flotation Feed | Rougher Conc. #1 | Rougher Conc. #2 | Rougher Conc. #3 | Rougher Conc. #4 | |||||||||||||||||||||||||||||||||||||||||||||||||||||||
| P80 µm | g/t Au | %S2- | %Weight | %Rec Au | %Rec S2- | %Weight | %Rec Au | %Rec S2- | %Weight | %Rec Au | %Rec S2- | %Weight | %Rec Au | %Rec S2- | ||||||||||||||||||||||||||||||||||||||||||||||
| Comp. 245 |
119 | 0.9 | 1.2 | — | — | — | — | — | — | — | — | — | 23.8 | 95.0 | 96.8 | |||||||||||||||||||||||||||||||||||||||||||||
| Comp. 255 |
100 | 1.8 | 3.2 | — | — | — | — | — | — | — | — | — | 29.2 | 94.6 | 98.4 | |||||||||||||||||||||||||||||||||||||||||||||
| Comp. 265 |
101 | 3.0 | 1.9 | — | — | — | — | — | — | — | — | — | 23.1 | 95.9 | 96.8 | |||||||||||||||||||||||||||||||||||||||||||||
| Comp. 275 |
113 | 13.6 | 0.3 | — | — | — | — | — | — | — | — | — | 23.0 | 97.5 | 88.2 | |||||||||||||||||||||||||||||||||||||||||||||
| Comp. 285 |
117 | 2.2 | 2.6 | — | — | — | — | — | — | — | — | — | 24.0 | 96.6 | 98.5 | |||||||||||||||||||||||||||||||||||||||||||||
| Comp. 305 |
116 | 1.9 | 3.9 | — | — | — | — | — | — | — | — | — | 25.3 | 97.2 | 99.0 | |||||||||||||||||||||||||||||||||||||||||||||
| Comp. 315 |
111 | 1.8 | 2.2 | — | — | — | — | — | — | — | — | — | 23.5 | 95.7 | 98.2 | |||||||||||||||||||||||||||||||||||||||||||||
| Comp. 325 |
97 | 0.6 | 3.0 | — | — | — | — | — | — | — | — | — | 22.7 | 96.0 | 98.7 | |||||||||||||||||||||||||||||||||||||||||||||
| Comp. 335 |
103 | 1.6 | 2.7 | — | — | — | — | — | — | — | — | — | 23.0 | 97.1 | 98.6 | |||||||||||||||||||||||||||||||||||||||||||||
| Comp. 345 |
91 | 1.1 | 1.1 | — | — | — | — | — | — | — | — | — | 18.6 | 93.9 | 96.4 | |||||||||||||||||||||||||||||||||||||||||||||
| Comp. 355 |
107 | 3.3 | 3.7 | — | — | — | — | — | — | — | — | — | 25.2 | 97.1 | 99.0 | |||||||||||||||||||||||||||||||||||||||||||||
| Comp. 375 |
104 | 2.2 | 2.9 | — | — | — | — | — | — | — | — | — | 29.0 | 98.7 | 98.8 | |||||||||||||||||||||||||||||||||||||||||||||
| Comp. 385 |
95 | 0.7 | 3.3 | — | — | — | — | — | — | — | — | — | 23.3 | 95.7 | 98.8 | |||||||||||||||||||||||||||||||||||||||||||||
| Comp. 395 |
101 | 6.0 | 4.6 | — | — | — | — | — | — | — | — | — | 23.8 | 96.1 | 99.2 | |||||||||||||||||||||||||||||||||||||||||||||
| Comp. 405 |
92 | 2.6 | 3.6 | — | — | — | — | — | — | — | — | — | 23.9 | 97.1 | 99.0 | |||||||||||||||||||||||||||||||||||||||||||||
| Comp. 425 |
101 | 0.6 | 2.1 | — | — | — | — | — | — | — | — | — | 27.4 | 93.2 | 98.3 | |||||||||||||||||||||||||||||||||||||||||||||
| Comp. 435 |
110 | 0.5 | 1.0 | — | — | — | — | — | — | — | — | — | 33.3 | 94.9 | 96.6 | |||||||||||||||||||||||||||||||||||||||||||||
| Comp. 445 |
102 | 0.9 | 2.8 | — | — | — | — | — | — | — | — | — | 27.8 | 97.6 | 98.7 | |||||||||||||||||||||||||||||||||||||||||||||
| Comp. 455 |
103 | 1.3 | 4.0 | — | — | — | — | — | — | — | — | — | 26.7 | 96.7 | 99.1 | |||||||||||||||||||||||||||||||||||||||||||||
| Comp. 465 |
102 | 0.3 | 1.9 | — | — | — | — | — | — | — | — | — | 21.4 | 94.5 | 97.9 | |||||||||||||||||||||||||||||||||||||||||||||
| Comp. 475 |
107 | 0.2 | 1.0 | — | — | — | — | — | — | — | — | — | 25.1 | 91.1 | 96.3 | |||||||||||||||||||||||||||||||||||||||||||||
| Comp. 485 |
100 | 0.3 | 1.5 | — | — | — | — | — | — | — | — | — | 30.0 | 95.5 | 97.7 | |||||||||||||||||||||||||||||||||||||||||||||
| Comp. 495 |
112 | 0.3 | 0.3 | — | — | — | — | — | — | — | — | — | 20.0 | 92.4 | 88.0 | |||||||||||||||||||||||||||||||||||||||||||||
| Comp. 505 |
105 | 0.2 | 0.5 | — | — | — | — | — | — | — | — | — | 21.5 | 91.6 | 91.3 | |||||||||||||||||||||||||||||||||||||||||||||
| Notes: |
1SGS-Lakefield, Project 13640-01, Final Report #2, January 2015 for Lake Shore Gold. | |
| 2SGS-Lakefield, Project 18331-01, Final Report, August 2022 for Mayfair Gold. | ||
| 3SGS-Lakefield, Project 18331-02, Final Report, September 2023 for Mayfair Gold. | ||
| 4SGS-Lakefield, Project 18831-03 Metallurgical Test Results from 2024 for Mayfair Gold. | ||
| 5SGS-Lakefield, Project 18831-03 Metallurgical Variability Test Results from 2025 for Mayfair Gold. |
|
|
PAGE | 13-25 October 10, 2025 |
| MAYFAIR GOLD CORP.
|
| |
| National Instrument 43-101 Technical Report—Mineral Resource Estimate Update Fenn–Gib Project, Ontario, Canada |
Rougher Concentrate Regrinding and Cyanidation
A hybrid process configuration was considered as part of the metallurgical test program during 2023–2025 which includes Grinding + Gravity Concentration + Rougher Flotation + Concentrate Regrind + Intensive Cyanidation.
Intensive cyanidation of the reground concentrate included a slurry density of 42% solids w/w, and pH 10.5, with dissolved oxygen levels maintained at greater than 5 ppm with sparge air, and cyanide concentration maintained at 1.0 g/L NaCN.
Results from 2025 variability testwork are summarized in Table 13-10 and Figure 13-8 with a range in sample feed grade from 0.2 to 9.9 g/t Au and 0.3 to 4.6% S2- and a flotation rougher concentrate grade after regrinding to cyanidation from 0.7 to 41.7 g/t Au and 1.3 to 21.0% S2-.
Variability test results from 2025 compare favorably with data previously generated in 2023–2024. The goal of variability testwork is to validate performance over a wider range in material head grade, sample lithology, and the matrix of mineralization present.
From the 2025 variability test results, a cluster of data with a range of 75% to 90% gold extraction at P80 13 µm regrind size is evident in Figure 13-8. Approximately 25% of the lower CN %Ext Au data is associated with low sample head-grade. The remainder, which represents 15% of all samples tested suggests that a fraction of contained gold values are not necessarily amenable to cyanidation, with gold disseminated at sub-micron grain-size within iron sulphides, or alloyed with other metals (Ag, Te, Bi) causing them to be less soluble. The updated gold recovery model includes the 2025 variability test data, which confirms a continued favourable response of gold mineralization to flotation, with the majority of rougher concentrate from test samples responding well to cyanidation after regrinding.
The determination of cyanide concentration in slurry was accomplished by silver nitrate titration and automated cyanide analysis of free cyanide (CNfree) and weak acid-dissociable cyanide (CNwad). CNwad is typically not indicative of CNfree levels, since CNwad includes soluble copper and zinc metal complexes. A recheck on selected tests where CNfree was found to be less than 200 ppm at the end of cyanidation was followed up with a sub-sample of the cyanidation residue subjected to an additional 24 to 48 hours of leaching at 1 g/L NaCN. Minimal to no additional gold dissolution was observed, which implies lab-scale cyanidation test results were not constrained by residual cyanide concentration, dissolved oxygen, grind size, or retention time.
|
|
PAGE | 13-26 October 10, 2025 |
| MAYFAIR GOLD CORP.
|
| |
| National Instrument 43-101 Technical Report—Mineral Resource Estimate Update Fenn–Gib Project, Ontario, Canada |
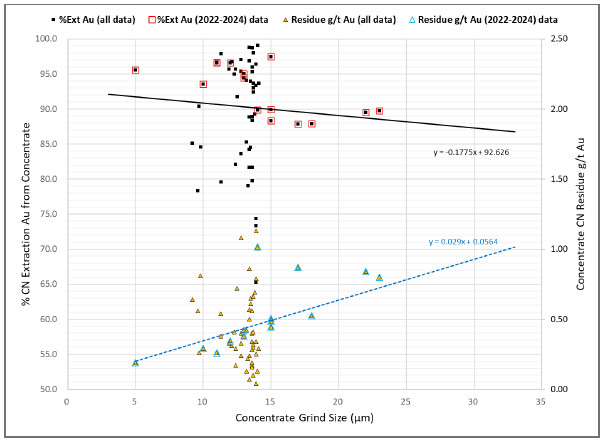
Source: Haggarty Technical Services July 2025—from test data in Table 13-10.
Figure 13-8: Concentrate Regrind Size versus %Extraction and CN Residue g/t Au
The variability testwork completed in 2025 included 46 composites listed in Table 13-10. Each sample was subjected to identical baseline conditions including a flotation feed grind size of P80 106 µm, 23% to 25% mass pull to a rougher concentrate, with flotation reagents including PAX (45 g/t), Aero 3501 (20 g/t), Aero 3477 (20 g/t), and MIBC (50 g/t). The respective rougher concentrates were reground to P80 10–13 µm, followed by cyanidation for 48 hours with 1,000 ppm NaCN to establish the expected variability in overall gold recovery.
Table 13-10: Concentrate Regrind and Cyanidation Test Data
| Composite |
Flotation Feed | Concentrate | Tailings (Au g/t) |
Cyanidation | ||||||||||||||||||||||||||
| Feed (P80 µm) |
Au (g/t) |
S2- (%) |
%Mass Pull |
%Rec Au |
%Rec S2- |
Conc. (P80 µm) |
CN Feed (g/t Au) |
CN Feed (%S2-) |
CN Residue (g/t Au) |
%Ext (Au) |
NaCN (kg/t) |
CaO (kg/t) |
CNfree (g/L) | |||||||||||||||||
| South Pit1 |
72 | 0.92 | 2.4 | 24.4 | 95.1 | 98.4 | 0.06 | 18 | 4.3 | 9.8 | 0.53 | 87.9 | 0.9 | 2.5 | 426 | |||||||||||||||
| Central Pit Upper1 |
67 | 1.05 | 3.3 | 15.6 | 96.0 | 98.7 | 0.05 | 17 | 7.2 | 20.9 | 0.87 | 87.9 | 1.9 | 4.6 | 330 | |||||||||||||||
| Central Pit Mid1 |
67 | 1.13 | 2.1 | 12.2 | 95.3 | 97.9 | 0.06 | 14 | 10.0 | 16.9 | 1.02 | 89.9 | 1.8 | 5.0 | 277 | |||||||||||||||
| Central Pit Lower1 |
67 | 1.43 | 1.0 | 14.7 | 95.8 | 95.6 | 0.07 | 12 | 10.1 | 6.2 | 0.35 | 96.6 | 1.6 | 4.0 | 291 | |||||||||||||||
|
|
PAGE | 13-27 October 10, 2025 |
| MAYFAIR GOLD CORP.
|
| |
| National Instrument 43-101 Technical Report—Mineral Resource Estimate Update Fenn–Gib Project, Ontario, Canada |
| Composite |
Flotation Feed | Concentrate | Tailings (Au g/t) |
Cyanidation | ||||||||||||||||||||||||||
| Feed (P80 µm) |
Au (g/t) |
S2- (%) |
%Mass Pull |
%Rec Au |
%Rec S2- |
Conc. (P80 µm) |
CN Feed (g/t Au) |
CN Feed (%S2-) |
CN Residue (g/t Au) |
%Ext (Au) |
NaCN (kg/t) |
CaO (kg/t) |
CNfree (g/L) | |||||||||||||||||
| East Pit1 |
72 | 0.76 | 1.6 | 20.8 | 97.9 | 97.1 | 0.05 | 15 | 4.2 | 7.6 | 0.49 | 88.3 | 1.4 | 2.4 | 356 | |||||||||||||||
| FW UG1 |
71 | 3.22 | 2.5 | 16.8 | 93.5 | 98.4 | 0.25 | 15 | 20.3 | 14.8 | 0.51 | 97.5 | 1.4 | 3.7 | 356 | |||||||||||||||
| FG-22-2542 |
102 | 1.18 | 2.4 | 26.8 | 94.1 | 98.0 | 0.10 | 15 | 4.4 | 8.8 | 0.45 | 89.9 | 2.4 | 2.4 | 301 | |||||||||||||||
| FG-22-2542 |
102 | 1.18 | 2.4 | 26.8 | 94.1 | 98.0 | 0.10 | 10 | 4.5 | 8.8 | 0.29 | 93.6 | 2.8 | 2.8 | 297 | |||||||||||||||
| FG-22-2542 |
102 | 1.18 | 2.4 | 26.8 | 94.1 | 98.0 | 0.10 | 5 | 4.3 | 8.8 | 0.19 | 95.6 | 3.5 | 4.0 | 279 | |||||||||||||||
| FG-23-350a3 |
109 | 1.91 | 1.7 | 23.4 | 96.0 | 97.7 | 0.10 | 11 | 7.8 | 7.0 | 0.26 | 96.7 | 2.2 | 1.4 | 398 | |||||||||||||||
| FG-23-350a3 |
109 | 1.91 | 1.7 | 23.4 | 96.0 | 97.7 | 0.10 | 11 | 7.7 | 7.0 | 0.26 | 96.6 | 2.1 | 1.5 | 408 | |||||||||||||||
| FG-23-350a3 |
109 | 1.91 | 1.7 | 23.4 | 96.0 | 97.7 | 0.10 | 13 | 7.6 | 7.0 | 0.42 | 94.4 | 1.8 | 1.5 | 391 | |||||||||||||||
| FG-23-350a3 |
109 | 1.91 | 1.7 | 23.4 | 96.0 | 97.7 | 0.10 | 13 | 7.7 | 7.0 | 0.38 | 95.1 | 1.9 | 1.5 | 368 | |||||||||||||||
| FG-23-350a3 |
109 | 1.91 | 1.7 | 23.4 | 96.0 | 97.7 | 0.10 | 22 | 8.0 | 7.0 | 0.84 | 89.5 | 1.7 | 1.3 | 374 | |||||||||||||||
| FG-23-350a3 |
109 | 1.91 | 1.7 | 23.4 | 96.0 | 97.7 | 0.10 | 23 | 7.8 | 7.0 | 0.80 | 89.7 | 1.7 | 1.5 | 347 | |||||||||||||||
| Comp. 14 |
104 | 0.57 | 2.1 | 20.8 | 94.5 | 98.1 | 0.04 | 11 | 2.6 | 10.0 | 0.54 | 79.6 | 0.4 | 0.6 | 354 | |||||||||||||||
| Comp. 24 |
105 | 0.47 | 2.2 | 20.4 | 93.2 | 98.2 | 0.04 | 14 | 2.1 | 10.8 | 0.40 | 81.7 | 0.6 | 0.7 | 154 | |||||||||||||||
| Comp. 34 |
99 | 2.35 | 2.7 | 20.9 | 93.6 | 98.5 | 0.19 | 14 | 10.5 | 12.6 | 0.61 | 94.0 | 0.7 | 0.6 | 124 | |||||||||||||||
| Comp. 44 |
102 | 1.17 | 3.6 | 24.0 | 96.7 | 99.0 | 0.05 | 13 | 4.7 | 14.9 | 0.86 | 81.7 | 0.6 | 0.6 | 159 | |||||||||||||||
| Comp. 54 |
121 | 1.12 | 3.8 | 25.9 | 97.3 | 99.0 | 0.04 | 14 | 4.2 | 14.4 | 0.65 | 84.5 | 0.6 | 0.5 | 202 | |||||||||||||||
| Comp. 64 |
106 | 1.12 | 2.9 | 29.5 | 95.0 | 98.8 | 0.08 | 13 | 3.6 | 9.7 | 0.57 | 84.2 | 0.2 | 0.4 | 485 | |||||||||||||||
| Comp. 74 |
96 | 1.01 | 1.8 | 22.3 | 95.4 | 97.9 | 0.06 | 14 | 4.3 | 8.0 | 0.30 | 93.0 | 0.5 | 0.4 | 130 | |||||||||||||||
| Comp. 84 |
110 | 0.42 | 2.0 | 19.8 | 94.3 | 98.0 | 0.03 | 13 | 2.0 | 9.9 | 0.33 | 83.7 | 0.6 | 0.5 | 102 | |||||||||||||||
| Comp. 94 |
104 | 2.30 | 3.6 | 25.1 | 95.4 | 99.0 | 0.14 | 13 | 8.8 | 14.3 | 0.72 | 91.8 | 0.9 | 0.9 | 111 | |||||||||||||||
| Comp. 104 |
104 | 0.74 | 2.0 | 23.1 | 95.9 | 98.1 | 0.04 | 14 | 3.1 | 8.5 | 0.79 | 74.4 | 0.6 | 0.5 | 116 | |||||||||||||||
| Comp. 114 |
95 | 1.52 | 3.1 | 22.7 | 95.9 | 98.7 | 0.08 | 14 | 6.4 | 13.3 | 0.69 | 89.3 | 0.6 | 0.6 | 109 | |||||||||||||||
| Comp. 124 |
104 | 0.91 | 2.6 | 20.8 | 98.3 | 98.5 | 0.02 | 9 | 4.3 | 12.4 | 0.64 | 85.2 | 1.2 | 0.8 | 716 | |||||||||||||||
| Comp. 134 |
106 | 1.00 | 2.1 | 23.2 | 97.7 | 98.2 | 0.03 | 14 | 4.2 | 8.8 | 1.13 | 73.3 | 0.6 | 0.5 | 139 | |||||||||||||||
| Comp. 144 |
132 | 1.28 | 2.0 | 22.1 | 93.9 | 98.1 | 0.10 | 14 | 5.4 | 8.9 | 0.41 | 92.4 | 0.6 | 0.4 | 153 | |||||||||||||||
| Comp. 154 |
94 | 1.39 | 1.6 | 25.8 | 93.6 | 97.7 | 0.12 | 14 | 5.1 | 6.3 | 0.56 | 89.0 | 0.6 | 0.4 | 206 | |||||||||||||||
| Comp. 174 |
98 | 3.18 | 1.5 | 23.1 | 95.2 | 97.5 | 0.20 | 14 | 13.1 | 6.5 | 0.17 | 98.7 | 0.5 | 0.3 | 135 | |||||||||||||||
| Comp. 184 |
100 | 4.07 | 1.9 | 20.8 | 93.4 | 97.1 | 0.34 | 11 | 18.3 | 8.9 | 0.38 | 97.9 | 0.5 | 0.4 | 129 | |||||||||||||||
| Comp. 194 |
100 | 0.35 | 1.1 | 24.4 | 95.7 | 96.5 | 0.02 | 14 | 1.4 | 4.2 | 0.16 | 88.4 | 0.6 | 0.5 | 221 | |||||||||||||||
| Comp. 204 |
102 | 0.87 | 1.6 | 20.2 | 95.4 | 97.5 | 0.05 | 14 | 4.1 | 7.7 | 0.29 | 93.7 | 0.6 | 0.4 | 161 | |||||||||||||||
| Comp. 214 |
116 | 0.51 | 1.9 | 31.5 | 97.3 | 98.2 | 0.02 | 14 | 1.6 | 5.8 | 0.34 | 79.7 | 0.7 | 0.5 | 163 | |||||||||||||||
| Comp. 224 |
99 | 0.62 | 0.7 | 27.2 | 96.5 | 95.0 | 0.03 | 13 | 2.2 | 2.5 | 0.13 | 94.1 | 0.5 | 0.4 | 273 | |||||||||||||||
| Comp. 234 |
115 | 3.65 | 0.9 | 24.1 | 94.8 | 95.6 | 0.25 | 14 | 14.4 | 3.4 | 0.13 | 99.1 | 0.6 | 0.3 | 142 | |||||||||||||||
| Comp. 244 |
119 | 1.01 | 1.2 | 23.8 | 95.5 | 96.8 | 0.06 | 14 | 4.1 | 4.8 | 0.19 | 95.3 | 0.7 | 0.4 | 141 | |||||||||||||||
| Comp. 254 |
100 | 1.52 | 3.1 | 29.2 | 93.5 | 98.4 | 0.14 | 14 | 4.9 | 10.6 | 0.34 | 93.4 | 0.8 | 0.7 | 257 | |||||||||||||||
| Comp. 264 |
101 | 3.70 | 1.9 | 23.0 | 96.7 | 96.8 | 0.16 | 14 | 15.5 | 8.0 | 0.32 | 98.0 | 0.8 | 0.6 | 156 | |||||||||||||||
| Comp. 274 |
113 | 9.92 | 0.3 | 23.0 | 96.6 | 88.2 | 0.44 | 13 | 41.7 | 1.3 | 0.50 | 98.8 | 0.6 | 0.2 | 164 | |||||||||||||||
| Comp. 284 |
117 | 2.32 | 2.6 | 24.0 | 96.7 | 98.5 | 0.10 | 12 | 9.4 | 10.7 | 0.31 | 96.8 | 0.7 | 0.6 | 202 | |||||||||||||||
| Comp. 304 |
116 | 1.77 | 3.9 | 25.3 | 97.0 | 99.0 | 0.07 | 14 | 6.8 | 15.2 | 0.28 | 96.0 | 0.5 | 0.4 | 177 | |||||||||||||||
| Comp. 314 |
111 | 1.82 | 2.2 | 23.5 | 95.8 | 98.2 | 0.10 | 12 | 7.4 | 9.0 | 0.33 | 95.7 | 0.6 | 0.9 | 85 | |||||||||||||||
| Comp. 324 |
94 | 0.60 | 3.2 | 22.3 | 96.1 | 98.8 | 0.03 | 10 | 2.6 | 14.2 | 0.56 | 78.4 | 1.3 | 1.0 | 721 | |||||||||||||||
| Comp. 334 |
103 | 1.61 | 2.7 | 23.0 | 97.1 | 98.6 | 0.06 | 12 | 6.8 | 11.4 | 0.29 | 95.7 | 0.6 | 0.5 | 193 | |||||||||||||||
| Comp. 344 |
91 | 1.59 | 1.1 | 18.6 | 95.9 | 96.4 | 0.08 | 12 | 8.2 | 5.9 | 0.41 | 95.0 | 0.7 | 0.4 | 284 | |||||||||||||||
|
|
PAGE | 13-28 October 10, 2025 |
| MAYFAIR GOLD CORP.
|
| |
| National Instrument 43-101 Technical Report—Mineral Resource Estimate Update Fenn–Gib Project, Ontario, Canada |
| Composite |
Flotation Feed | Concentrate | Tailings (Au g/t) |
Cyanidation | ||||||||||||||||||||||||||
| Feed (P80 µm) |
Au (g/t) |
S2- (%) |
%Mass Pull |
%Rec Au |
%Rec S2- |
Conc. (P80 µm) |
CN Feed (g/t Au) |
CN Feed (%S2-) |
CN Residue (g/t Au) |
%Ext (Au) |
NaCN (kg/t) |
CaO (kg/t) |
CNfree (g/L) | |||||||||||||||||
| Comp. 354 |
107 | 3.17 | 3.7 | 25.2 | 96.9 | 99.0 | 0.13 | 13 | 12.2 | 14.5 | 0.40 | 97.0 | 0.6 | 0.5 | 127 | |||||||||||||||
| Comp. 374 |
104 | 2.21 | 2.9 | 29.0 | 98.7 | 98.8 | 0.04 | 13 | 7.5 | 9.9 | 0.24 | 97.1 | 0.6 | 0.6 | 143 | |||||||||||||||
| Comp. 384 |
95 | 0.70 | 3.3 | 23.3 | 95.6 | 98.8 | 0.04 | 13 | 2.9 | 14.0 | 0.42 | 85.3 | 0.7 | 0.4 | 290 | |||||||||||||||
| Comp. 394 |
101 | 5.81 | 4.6 | 23.8 | 95.9 | 99.2 | 0.31 | 13 | 23.4 | 19.0 | 1.08 | 95.4 | 0.5 | 0.6 | 319 | |||||||||||||||
| Comp. 404 |
92 | 2.56 | 3.6 | 23.8 | 97.0 | 98.9 | 0.10 | 14 | 10.4 | 15.0 | 0.66 | 93.7 | 0.8 | 0.5 | 334 | |||||||||||||||
| Comp. 424 |
101 | 0.63 | 2.1 | 27.4 | 93.1 | 98.3 | 0.06 | 13 | 2.2 | 7.6 | 0.24 | 88.8 | 0.6 | 0.4 | 355 | |||||||||||||||
| Comp. 434 |
110 | 0.50 | 1.0 | 33.3 | 94.7 | 96.6 | 0.04 | 14 | 1.4 | 2.9 | 0.10 | 93.0 | 0.6 | 0.7 | 429 | |||||||||||||||
| Comp. 444 |
96 | 0.74 | 2.4 | 26.6 | 97.0 | 98.5 | 0.03 | 10 | 2.7 | 9.0 | 0.26 | 90.4 | 1.3 | 0.6 | 747 | |||||||||||||||
| Comp. 454 |
103 | 1.39 | 4.1 | 25.6 | 96.8 | 99.1 | 0.06 | 10 | 5.3 | 15.9 | 0.81 | 84.6 | 1.9 | 0.9 | 746 | |||||||||||||||
| Comp. 464 |
102 | 0.22 | 1.9 | 21.4 | 92.8 | 97.9 | 0.02 | 12 | 1.0 | 8.5 | 0.17 | 82.1 | 0.5 | 0.5 | 369 | |||||||||||||||
| Comp. 474 |
107 | 0.20 | 1.0 | 25.1 | 92.4 | 96.3 | 0.02 | 14 | 0.7 | 3.9 | 0.25 | 65.3 | 0.7 | 0.5 | 318 | |||||||||||||||
| Comp. 484 |
100 | 0.33 | 1.5 | 30.0 | 95.8 | 97.7 | 0.02 | 13 | 1.1 | 4.9 | 0.22 | 79.0 | 1.0 | 0.6 | 373 | |||||||||||||||
| Comp. 494 |
112 | 0.47 | 0.3 | 20.0 | 94.9 | 88.0 | 0.03 | 13 | 2.2 | 1.5 | 0.07 | 96.9 | 0.6 | 0.3 | 253 | |||||||||||||||
| Comp. 504 |
105 | 0.26 | 0.4 | 21.5 | 92.4 | 91.3 | 0.03 | 14 | 1.1 | 1.9 | 0.04 | 96.4 | 0.8 | 0.2 | 350 | |||||||||||||||
| Notes: |
1SGS-Lakefield, Project 18831-01, Final Report, August 2022 for Mayfair Gold. | |
| 2SGS-Lakefield, Project 18831-02, Final Report, September 2023 for Mayfair Gold. | ||
| 3SGS-Lakefield, Project 18831-03 Metallurgical Test Results from 2024 for Mayfair Gold. | ||
| 4SGS-Lakefield, Project 18831-03 Metallurgical Test Results from 2025 for Mayfair Gold. |
Cyanidation Circuit Retention Time
As a component of the variability test program, flotation concentrate gold dissolution rate kinetics were monitored during cyanidation for each composite with a solution sample withdrawn at 4, 8, 12, 24, and 48-hour time intervals.
Residual solution CNfree concentrations were adjusted as required at matching time intervals to maintain a target 1.0 g/L NaCN, equivalent to 530 ppm CNwad.
Direct cyanidation only was applied for all variability composites to determine gold dissolution rate kinetics summarized in Figure 13-9 and Table 13-11. Test results indicate that after 4 hours an average 85% of ultimate gold extraction is realized, after 8 hours 97%, after 12 hours 98%, and after 24 hours approaching 100% of ultimate extractive gold recovery.
The Fenn–Gib gold recovery circuit will include pre-aeration followed by CIL cyanidation with an approximate 24-hour retention time.
|
|
PAGE | 13-29 October 10, 2025 |
| MAYFAIR GOLD CORP.
|
| |
| National Instrument 43-101 Technical Report—Mineral Resource Estimate Update Fenn–Gib Project, Ontario, Canada |
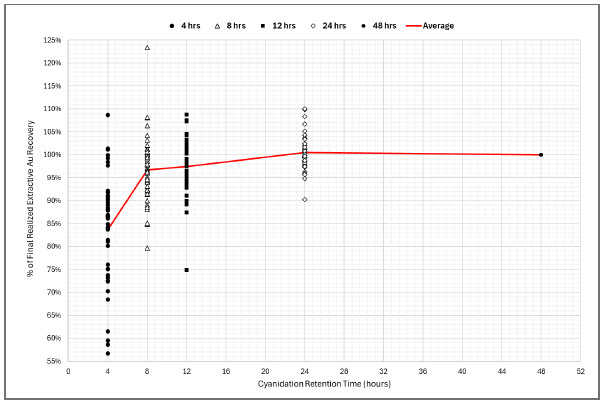
Source: Haggarty Technical Services July 2025—from SGS 18831-03 Mayfair Cyanidation Testwork.xls
Figure 13-9: Gold Extraction Rate Kinetics Relative to Cyanidation Retention Time
Table 13-11: Cyanidation Gold Dissolution Rate Kinetics
| Sample |
Feed Grade | Conc. (P80 µm) |
Cyanidation Au Dissolution Rate Kinetics |
Tailings (g/t Au) |
CNfree (ppm) |
Cyanidation % of Ultimate Au Extraction | ||||||||||||||||||||||||
| g/t Au | %S2- | 4 h | 8 h | 12 h | 24 h | 48 h | 4 h | 8 h | 12 h | 24 h | 48 h | |||||||||||||||||||
| Comp. 1 |
2.6 | 10.0 | 11.3 | 69.0 | 74.8 | 75.8 | 80.0 | 79.2 | 0.54 | 354 | 0.87 | 0.94 | 0.95 | 1.01 | 1.00 | |||||||||||||||
| Comp. 2 |
2.1 | 10.8 | 13.6 | 70.2 | 81.9 | 82.3 | 82.5 | 81.2 | 0.40 | 154 | 0.86 | 1.00 | 1.01 | 1.01 | 1.00 | |||||||||||||||
| Comp. 3 |
10.5 | 12.6 | 13.5 | 64.5 | 86.1 | 89.5 | 99.0 | 94.2 | 0.61 | 124 | 0.68 | 0.91 | 0.95 | 1.05 | 1.00 | |||||||||||||||
| Comp. 4 |
4.7 | 14.9 | 13.4 | 57.4 | 69.3 | 74.4 | 81.2 | 81.7 | 0.86 | 159 | 0.70 | 0.85 | 0.91 | 0.99 | 1.00 | |||||||||||||||
| Comp. 5 |
4.2 | 14.4 | 13.5 | 77.9 | 83.3 | 82.4 | 84.1 | 84.5 | 0.65 | 202 | 0.92 | 0.99 | 0.98 | 1.00 | 1.00 | |||||||||||||||
| Comp. 6 |
3.6 | 9.7 | 13.4 | 67.5 | 79.1 | 82.5 | 83.7 | 84.2 | 0.57 | 485 | 0.80 | 0.94 | 0.98 | 0.99 | 1.00 | |||||||||||||||
| Comp. 7 |
4.3 | 8.0 | 13.7 | 80.8 | 90.5 | 93.4 | 91.1 | 93.0 | 0.30 | 130 | 0.87 | 0.97 | 1.00 | 0.98 | 1.00 | |||||||||||||||
| Comp. 8 |
2.0 | 9.9 | 12.8 | 70.4 | 81.7 | 82.4 | 84.5 | 83.7 | 0.33 | 102 | 0.84 | 0.98 | 0.99 | 1.01 | 1.00 | |||||||||||||||
| Comp. 9 |
8.8 | 14.3 | 12.5 | 53.8 | 81.8 | 86.6 | 90.6 | 91.8 | 0.72 | 111 | 0.59 | 0.89 | 0.94 | 0.99 | 1.00 | |||||||||||||||
| Comp. 10 |
3.1 | 8.5 | 13.9 | 67.6 | 80.3 | 75.7 | 73.2 | 74.4 | 0.79 | 116 | 0.91 | 1.08 | 1.02 | 0.99 | 1.00 | |||||||||||||||
| Comp. 11 |
6.4 | 13.3 | 13.8 | 81.3 | 90.5 | 86.0 | 89.6 | 89.3 | 0.69 | 109 | 0.91 | 1.01 | 0.96 | 1.00 | 1.00 | |||||||||||||||
| Comp. 12 |
4.8 | 12.5 | 13.6 | 75.2 | 80.3 | 80.4 | 81.8 | 81.9 | 0.86 | 115 | 0.92 | 0.98 | 0.98 | 1.00 | 1.00 | |||||||||||||||
| Comp. 13 |
4.2 | 8.8 | 13.9 | 54.9 | 67.3 | 63.9 | 69.3 | 73.1 | 1.13 | 139 | 0.75 | 0.92 | 0.87 | 0.95 | 1.00 | |||||||||||||||
| Comp. 14 |
5.4 | 8.9 | 13.7 | 70.3 | 88.0 | 88.0 | 91.8 | 92.4 | 0.41 | 153 | 0.76 | 0.95 | 0.95 | 0.99 | 1.00 | |||||||||||||||
|
|
PAGE | 13-30 October 10, 2025 |
| MAYFAIR GOLD CORP.
|
| |
| National Instrument 43-101 Technical Report—Mineral Resource Estimate Update Fenn–Gib Project, Ontario, Canada |
| Sample |
Feed Grade | Conc. (P80 µm) |
Cyanidation Au Dissolution Rate Kinetics |
Tailings (g/t Au) |
CNfree (ppm) |
Cyanidation % of Ultimate Au Extraction |
||||||||||||||||||||||||||||||||||||||||||||||||||||||
| g/t Au | %S2- | 4 h | 8 h | 12 h | 24 h | 48 h | 4 h | 8 h | 12 h | 24 h | 48 h | |||||||||||||||||||||||||||||||||||||||||||||||||
| Comp. 15 |
5.1 | 6.3 | 13.6 | 64.5 | 84.1 | 84.8 | 88.3 | 89.0 | 0.56 | 206 | 0.72 | 0.94 | 0.95 | 0.99 | 1.00 | |||||||||||||||||||||||||||||||||||||||||||||
| Comp. 17 |
13.1 | 6.5 | 13.6 | 98.0 | 99.0 | 99.0 | 99.0 | 98.7 | 0.17 | 135 | 0.99 | 1.00 | 1.00 | 1.00 | 1.00 | |||||||||||||||||||||||||||||||||||||||||||||
| Comp. 18 |
18.3 | 8.9 | 11.3 | 99.0 | 99.0 | 98.4 | 99.2 | 97.9 | 0.38 | 129 | 1.01 | 1.01 | 1.01 | 1.01 | 1.00 | |||||||||||||||||||||||||||||||||||||||||||||
| Comp. 19 |
1.4 | 4.2 | 13.6 | 80.1 | 88.2 | 86.5 | 88.7 | 88.4 | 0.16 | 221 | 0.91 | 1.00 | 0.98 | 1.00 | 1.00 | |||||||||||||||||||||||||||||||||||||||||||||
| Comp. 20 |
4.1 | 7.7 | 14.1 | 67.4 | 82.0 | 86.5 | 91.9 | 93.0 | 0.29 | 161 | 0.72 | 0.88 | 0.93 | 0.99 | 1.00 | |||||||||||||||||||||||||||||||||||||||||||||
| Comp. 21 |
1.6 | 5.8 | 13.6 | 63.8 | 69.7 | 58.9 | 71.0 | 78.5 | 0.34 | 163 | 0.81 | 0.89 | 0.75 | 0.90 | 1.00 | |||||||||||||||||||||||||||||||||||||||||||||
| Comp. 22 |
2.2 | 2.5 | 13.2 | 81.6 | 87.3 | 93.3 | 92.4 | 94.1 | 0.13 | 273 | 0.86 | 0.92 | 0.99 | 0.98 | 1.00 | |||||||||||||||||||||||||||||||||||||||||||||
| Comp. 23 |
14.4 | 3.4 | 14.0 | 71.9 | 84.1 | 88.4 | 95.4 | 99.1 | 0.13 | 142 | 0.73 | 0.85 | 0.89 | 0.96 | 1.00 | |||||||||||||||||||||||||||||||||||||||||||||
| Comp. 24 |
4.1 | 4.8 | 13.6 | 77.7 | 88.1 | 90.3 | 93.7 | 95.3 | 0.19 | 141 | 0.81 | 0.92 | 0.95 | 0.98 | 1.00 | |||||||||||||||||||||||||||||||||||||||||||||
| Comp. 25 |
4.9 | 10.6 | 13.9 | 69.8 | 86.6 | 91.2 | 90.7 | 93.0 | 0.34 | 257 | 0.75 | 0.93 | 0.98 | 0.98 | 1.00 | |||||||||||||||||||||||||||||||||||||||||||||
| Comp. 26 |
15.5 | 8.0 | 13.7 | 55.5 | 89.6 | 90.9 | 96.7 | 97.9 | 0.32 | 156 | 0.57 | 0.92 | 0.93 | 0.99 | 1.00 | |||||||||||||||||||||||||||||||||||||||||||||
| Comp. 27 |
41.7 | 1.3 | 13.4 | 58.8 | 84.1 | 97.8 | 99.0 | 98.8 | 0.50 | 164 | 0.60 | 0.85 | 0.99 | 1.00 | 1.00 | |||||||||||||||||||||||||||||||||||||||||||||
| Comp. 28 |
9.4 | 10.7 | 12.1 | 87.3 | 95.9 | 99.6 | 99.0 | 96.7 | 0.31 | 202 | 0.90 | 0.99 | 1.03 | 1.02 | 1.00 | |||||||||||||||||||||||||||||||||||||||||||||
| Comp. 30 |
6.8 | 15.2 | 13.6 | 84.5 | 93.0 | 89.4 | 93.3 | 95.9 | 0.28 | 177 | 0.88 | 0.97 | 0.93 | 0.97 | 1.00 | |||||||||||||||||||||||||||||||||||||||||||||
| Comp. 31 |
7.4 | 9.0 | 11.9 | 96.9 | 95.7 | 94.4 | 99.0 | 95.5 | 0.33 | 85 | 1.01 | 1.00 | 0.99 | 1.04 | 1.00 | |||||||||||||||||||||||||||||||||||||||||||||
| Comp. 32 |
2.3 | 12.9 | 13.3 | 64.4 | 77.1 | 80.0 | 79.9 | 76.5 | 0.54 | 383 | 0.84 | 1.01 | 1.04 | 1.04 | 1.00 | |||||||||||||||||||||||||||||||||||||||||||||
| Comp. 33 |
6.8 | 11.4 | 12.4 | 93.6 | 93.7 | 92.5 | 97.7 | 95.7 | 0.29 | 193 | 0.98 | 0.98 | 0.97 | 1.02 | 1.00 | |||||||||||||||||||||||||||||||||||||||||||||
| Comp. 34 |
8.2 | 5.9 | 12.3 | 82.0 | 95.6 | 96.9 | 95.8 | 95.0 | 0.41 | 284 | 0.86 | 1.01 | 1.02 | 1.01 | 1.00 | |||||||||||||||||||||||||||||||||||||||||||||
| Comp. 35 |
12.2 | 14.5 | 12.8 | 83.7 | 91.6 | 90.9 | 99.0 | 96.7 | 0.40 | 127 | 0.87 | 0.95 | 0.94 | 1.02 | 1.00 | |||||||||||||||||||||||||||||||||||||||||||||
| Comp. 37 |
7.5 | 9.9 | 12.8 | 86.8 | 93.4 | 93.4 | 98.7 | 96.8 | 0.24 | 143 | 0.90 | 0.96 | 0.96 | 1.02 | 1.00 | |||||||||||||||||||||||||||||||||||||||||||||
| Comp. 38 |
2.9 | 14.0 | 13.2 | 75.7 | 89.1 | 76.9 | 86.9 | 85.3 | 0.42 | 290 | 0.89 | 1.04 | 0.90 | 1.02 | 1.00 | |||||||||||||||||||||||||||||||||||||||||||||
| Comp. 39 |
23.4 | 19.0 | 12.8 | 69.9 | 91.6 | 96.5 | 91.5 | 95.4 | 1.08 | 319 | 0.73 | 0.96 | 1.01 | 0.96 | 1.00 | |||||||||||||||||||||||||||||||||||||||||||||
| Comp. 40 |
10.4 | 15.0 | 13.7 | 69.1 | 84.3 | 90.2 | 93.4 | 93.7 | 0.66 | 334 | 0.74 | 0.90 | 0.96 | 1.00 | 1.00 | |||||||||||||||||||||||||||||||||||||||||||||
| Comp. 42 |
2.2 | 7.6 | 13.4 | 88.7 | 88.3 | 88.0 | 85.0 | 88.8 | 0.24 | 355 | 1.00 | 0.99 | 0.99 | 0.96 | 1.00 | |||||||||||||||||||||||||||||||||||||||||||||
| Comp. 43 |
1.4 | 2.9 | 13.7 | 91.5 | 96.0 | 96.1 | 95.2 | 93.0 | 0.10 | 429 | 0.98 | 1.03 | 1.03 | 1.02 | 1.00 | |||||||||||||||||||||||||||||||||||||||||||||
| Comp. 44 |
2.7 | 10.1 | 13.2 | 71.7 | 83.9 | 81.8 | 89.3 | 85.4 | 0.39 | 376 | 0.84 | 0.98 | 0.96 | 1.04 | 1.00 | |||||||||||||||||||||||||||||||||||||||||||||
| Comp. 45 |
5.5 | 15.0 | 14.0 | 75.5 | 87.4 | 88.4 | 87.7 | 82.1 | 0.98 | 352 | 0.92 | 1.06 | 1.08 | 1.07 | 1.00 | |||||||||||||||||||||||||||||||||||||||||||||
| Comp. 46 |
1.0 | 8.5 | 12.4 | 89.2 | 101.3 | 88.1 | 90.2 | 82.1 | 0.17 | 369 | 1.09 | 1.23 | 1.07 | 1.10 | 1.00 | |||||||||||||||||||||||||||||||||||||||||||||
| Comp. 47 |
0.7 | 3.9 | 13.9 | 57.2 | 62.7 | 70.8 | 71.6 | 65.3 | 0.25 | 318 | 0.88 | 0.96 | 1.09 | 1.10 | 1.00 | |||||||||||||||||||||||||||||||||||||||||||||
| Comp. 48 |
1.01 | 4.9 | 13.3 | 70.8 | 86.0 | 83.1 | 82.2 | 79.0 | 0.22 | 373 | 0.89 | 1.08 | 1.05 | 1.03 | 1.00 | |||||||||||||||||||||||||||||||||||||||||||||
| Comp. 49 |
2.2 | 1.5 | 13.4 | 82.4 | 99.1 | 99.8 | 105.2 | 96.9 | 0.07 | 253 | 0.85 | 1.02 | 1.03 | 1.08 | 1.00 | |||||||||||||||||||||||||||||||||||||||||||||
| Comp. 50 |
1.1 | 1.9 | 13.9 | 59.6 | 77.2 | 90.8 | 94.4 | 96.4 | 0.04 | 350 | 0.62 | 0.80 | 0.94 | 0.97 | 1.00 | |||||||||||||||||||||||||||||||||||||||||||||
Source: Haggarty Technical Services July 2025—from SGS 18831-03 Mayfair Cyanidation Testwork.xls
Rougher Concentrate—Regrind-Specific Energy Testwork
As part of the variability test program, a bulk rougher-concentrate sample was prepared from Composite 17 to determine highly-intensity grinding (HIG) mill specific grinding energy (kWh/t) required to regrind the concentrate to a series of target product sizes that included P80 10, 13, 15, and 20 µm.
As shown in Figure 13-10 and summarized in Table 13-12 to Table 13-17, an average specific grinding energy (SGE) of 15.8 kWh/t is associated with a design grind size of P80 13 µm. The SGE increases to 27.6 kWh/t at P80 10 µm, decreasing to 11.7 kWh/t at P80 15 µm, and 6.4 kWh/t at P80 20 µm. Testwork considered ceramic grinding media (3 mm and 4 mm) at 45% solids and 47 % solids w/w for SGE definition.
|
|
PAGE | 13-31 October 10, 2025 |
| MAYFAIR GOLD CORP.
|
| |
| National Instrument 43-101 Technical Report—Mineral Resource Estimate Update Fenn–Gib Project, Ontario, Canada |
Slurry viscosity measurements summarized in Table 13-15 confirmed a dynamic viscosity of 9.1 mPa-sec and constant shear viscosity 11.9 mPa-sec at a slurry temperature of 29°C, 42% solids w/w, and pH 10.5. No viscosity-related issues are anticipated within the regrind mill operating range of 42% to 47% solids w/w.
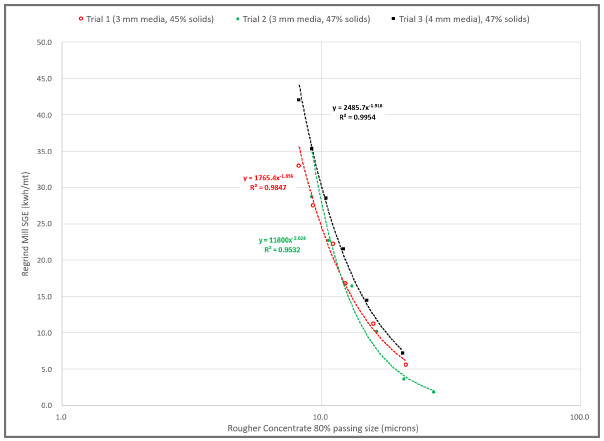
Source: Haggarty Technical Services July 2025—from SGS 18831-03 Mayfair Cyanidation Testwork.xls
Figure 13-10: Concentrate Regrind—HIG Mill Specific Grinding Energy kWh/t Data
|
|
PAGE | 13-32 October 10, 2025 |
| MAYFAIR GOLD CORP.
|
| |
| National Instrument 43-101 Technical Report—Mineral Resource Estimate Update Fenn–Gib Project, Ontario, Canada |
Table 13-12: Concentrate Regrinding—HIG Mill SGE Testwork (3 mm media at 45% solids)
| Trial#1 |
Feed | Stage 1 | Stage 2 | Stage 3 | Stage 4 | Stage 5 | Stage 6 | |||||||||||||||||||||
| %Solids (w/w) |
45.4 | 45.8 | 45.9 | 45.5 | 45.7 | 45.8 | 45.8 | |||||||||||||||||||||
| Grinding Media (mm) |
3 | 3 | 3 | 3 | 3 | 3 | 3 | |||||||||||||||||||||
| SGE (kWh/t) |
— | 5.6 | 11.2 | 16.8 | 22.2 | 27.5 | 33.0 | |||||||||||||||||||||
| P80 (µm) |
33.6 | 21.2 | 15.9 | 12.4 | 11.1 | 9.3 | 8.2 | |||||||||||||||||||||
| P98 (µm) |
149.0 | 80.0 | 69.9 | 32.6 | 39.5 | 22.2 | 18.8 | |||||||||||||||||||||
| SGE (kWh/t) at P80 10 µm |
24.6 | — | — | — | — | — | — | |||||||||||||||||||||
| SGE (kWh/t) at P80 13 µm |
15.1 | — | — | — | — | — | — | |||||||||||||||||||||
| SGE (kWh/t) at P80 15 µm |
11.6 | — | — | — | — | — | — | |||||||||||||||||||||
| SGE (kWh/t) at P80 20 µm |
6.8 | — | — | — | — | — | — | |||||||||||||||||||||
| Source: 188831-03 SST-001 Composite 17 Ro Conc.—22 Jan 2025. |
|
|||||||||||||||||||||||||||
| Table 13-13: Concentrate Regrinding—HIG Mill SGE Testwork (3 mm media at 47% solids) |
||||||||||||||||||||||||||||
| Trial#2 |
Feed | Stage 1 | Stage 2 | Stage 3 | Stage 4 | Stage 5 | Stage 6 | |||||||||||||||||||||
| %Solids (w/w) |
47.8 | 46.9 | 47.2 | 47.7 | 47.8 | 47.9 | 47.9 | |||||||||||||||||||||
| Grinding Media (mm) |
3 | 3 | 3 | 3 | 3 | 3 | 3 | |||||||||||||||||||||
| SGE (kWh/t) |
— | 1.8 | 3.6 | 10.1 | 16.4 | 22.6 | 28.6 | |||||||||||||||||||||
| P80 (µm) |
33.6 | 27.2 | 20.9 | 16.4 | 13.2 | 10.7 | 9.2 | |||||||||||||||||||||
| P98 (µm) |
149.0 | 123.0 | 91.5 | 70.2 | 48.1 | 30.4 | 23.5 | |||||||||||||||||||||
| SGE (kWh/t) at P80 10 µm |
28.0 | — | — | — | — | — | — | |||||||||||||||||||||
| SGE (kWh/t) at P80 13 µm |
14.1 | — | — | — | — | — | — | |||||||||||||||||||||
| SGE (kWh/t) at P80 15 µm |
9.7 | — | — | — | — | — | — | |||||||||||||||||||||
| SGE (kWh/t) at P80 20 µm |
4.5 | — | — | — | — | — | — | |||||||||||||||||||||
| Source: 188831-03 SST-002 Composite 17 Ro Conc.—22 Jan 2025. |
|
|||||||||||||||||||||||||||
| Table 13-14: Concentrate Regrinding—HIG Mill SGE Testwork (4 mm media at 47% solids) |
||||||||||||||||||||||||||||
| Trial#3 |
Feed | Stage 1 | Stage 2 | Stage 3 | Stage 4 | Stage 5 | Stage 6 | |||||||||||||||||||||
| %Solids (w/w) |
47.8 | 47.3 | 47.4 | 47.4 | 47.5 | 47.6 | 47.5 | |||||||||||||||||||||
| Grinding Media (mm) |
4 | 4 | 4 | 4 | 4 | 4 | 4 | |||||||||||||||||||||
| SGE (kWh/t) |
— | 7.2 | 14.4 | 21.5 | 28.5 | 35.3 | 42.0 | |||||||||||||||||||||
| P80 (µm) |
33.6 | 20.6 | 15.0 | 12.2 | 10.4 | 9.2 | 8.2 | |||||||||||||||||||||
| P98 (µm) |
149.0 | 72.6 | 41.3 | 29.2 | 24.3 | 21.0 | 19.1 | |||||||||||||||||||||
| SGE (kWh/t) at P80 10 µm |
30.2 | — | — | — | — | — | — | |||||||||||||||||||||
| SGE (kWh/t) at P80 13 µm |
18.2 | — | — | — | — | — | — | |||||||||||||||||||||
| SGE (kWh/t) at P80 15 µm |
13.9 | — | — | — | — | — | — | |||||||||||||||||||||
| SGE (kWh/t) at P80 20 µm |
8.0 | — | — | — | — | — | — | |||||||||||||||||||||
Source: 188831-03 SST-003 Composite 17 Ro Conc.—3 Feb 2025.
|
|
PAGE | 13-33 October 10, 2025 |
| MAYFAIR GOLD CORP.
|
| |
| National Instrument 43-101 Technical Report—Mineral Resource Estimate Update Fenn–Gib Project, Ontario, Canada |
Table 13-15: Concentrate Regrinding—HIG Mill Slurry Viscosity Measurements
| Sample |
%Solids (w/w) |
pH | Temp (°C) |
Dynamic Viscosity (mPa-sec) |
Constant Shear Viscosity (mPas-sec) |
|||||||||||||||
| RG Feed |
42 | 7.3 | 21 | 6.2 | 7.0 | |||||||||||||||
| RG Discharge—Natural pH |
42 | 7.3 | 29 | 7.5 | 9.7 | |||||||||||||||
| RG Discharge—pH 10.3 |
42 | 10.5 | 29 | 9.1 | 11.9 | |||||||||||||||
Source: 188831-03 SST-003 Slurry Viscosity—28 November 2024.
Environmental Acid-Base Accounting Testwork
Modified Sobek acid-base accounting (ABA) was conducted in 2022 on Central Pit Upper, Central Pit Lower rougher flotation tailings, and rougher-concentrate cyanidation residue samples. Similar testwork was completed in 2024 on Composite #29 (DDH FG23-350a) rougher-flotation tailings, and rougher concentrate prior to cyanidation, with results summarized in Table 13-16.
Table 13-16: Acid-Base Accounting Test Results
| Sample |
Description |
pH | Neutralizing Potential (NP) |
Acid Generating Potential (AP) |
Ratio NP/AP |
Classification | ||||||
| Central Pit Upper1 |
Rougher Tailings | 9.2 | 132.0 | 1.3 | 105.6 | non-PAG | ||||||
| Conc CN Residue | 9.0 | 132.0 | 90.6 | 1.5 | PAG | |||||||
| Central Pit Lower1 |
Rougher Tailings | 9.2 | 62.9 | 1.3 | 50.3 | non-PAG | ||||||
| Conc CN Residue | 9.1 | 65.3 | 24.7 | 2.6 | PAG | |||||||
| Composite 292 |
Rougher Tailings | 9.2 | 142.0 | 0.3 | 456 | non-PAG | ||||||
| Rougher Conc. | 8.3 | 154.0 | 290.0 | 0.53 | PAG |
| Notes: |
1SGS-Lakefield, Project 18831-01 Metallurgical Test Results, August 2022 for Mayfair Gold. | |
| 2SGS-Lakefield, Project 18831-03 Metallurgical Test Results from 2024 for Mayfair Gold. | ||
| PAG = potentially acid-generating. |
ABA test results quantify the acid generation potential (AP) relative to the oxidation of sulphide sulphur. The method also defines the neutralization potential (NP) by initiating a reaction with excess acid, then titrating to pH 8.3 with sodium hydroxide to determine how much acid was consumed during the reaction. The ratio between NP and AP is an indicator as to the potential of the sample to generate acid rock drainage (ARD).
Modified ABA tests identified rougher flotation tailings as non-potentially acid generating (non-PAG or NAG) with abundant neutralization potential. For rougher tailings, neutralizing potential ranged from 63 to 142 tonnes CaCO3 per 1,000 tonnes, while the AP ranged from 0.3 to 1.3 tonnes CaCO3 per 1,000 tonnes. The NP/AP ratio varied from 50 to 456, confirming that the low-sulphide rougher tailings are expected to be non-PAG.
|
|
PAGE | 13-34 October 10, 2025 |
| MAYFAIR GOLD CORP.
|
| |
| National Instrument 43-101 Technical Report—Mineral Resource Estimate Update Fenn–Gib Project, Ontario, Canada |
Modified ABA tests on sulphide concentrate and concentrate cyanidation residue samples identified this material as PAG, with sulphide content ranging from 0.8% to 9.3% S2-. The neutralizing potential varied from 65 to 154 tonnes CaCO3 per 1,000 tonnes, while the acid generation potential ranged from 25 to 290 tonnes CaCO3 per 1,000 tonnes. The ratio of NP/AP was low, between 0.5 to 2.6, indicating that the sulphide concentrate is only marginally buffered.
The hybrid process approach allows for the co-disposal of non-PAG rougher tailings with the sub-aqueous deposition of PAG cyanidation residue after cyanide removal. Successfully implemented elsewhere in the mining industry, this method ensures the PAG material, comprising 20% to 25% of process feed tonnage, is consistently submerged beneath a cap of well buffered non-PAG rougher tailings in the tailings impoundment.
| 13.4 | Recovery Estimates |
Flotation testwork achieved a rougher-flotation tailings grade that was typically less than 0.10 g/t Au at a feed grind size of P80 106 µm and mass pull of 23% to 25% to concentrate as indicated in Table 13-17.
Since flotation feed-grade is an independent variable, and 23% mass pull is assumed to rougher concentrate, with a constant rougher-flotation tailings grade of 0.10 g/t Au, the resulting rougher -concentrate grade at varying feed grade can be determined. This approach provides an opportunity to model expected overall flotation -circuit gold recovery, over a range in gold head-grade.
Table 13-17: Overall Gold Recovery from Flotation, Concentrate Regrind, and Cyanidation Test Data
| Composite Sample |
Feed (P80 µm) |
Feed (Au g/t) |
Conc. %Mass Pull |
Conc. %Rec Au |
Tailings (Au g/t) |
Conc. (P80 µm) |
CN Feed (g/t Au) |
CN Residue (g/t Au) |
CN%Ext Au |
Overall %Ext Au | ||||||||||
| South Pit1 |
72 | 0.92 | 24.4 | 95.1 | 0.06 | 18 | 4.3 | 0.53 | 87.9 | 83.6 | ||||||||||
| Central Pit Upper1 |
67 | 1.05 | 15.6 | 96.0 | 0.05 | 17 | 7.2 | 0.87 | 87.9 | 84.4 | ||||||||||
| Central Pit Mid1 |
67 | 1.13 | 12.2 | 95.3 | 0.06 | 14 | 10.0 | 1.02 | 89.9 | 85.7 | ||||||||||
| Central Pit Lower1 |
67 | 1.43 | 14.7 | 95.8 | 0.07 | 12 | 10.1 | 0.35 | 96.6 | 92.5 | ||||||||||
| East Pit1 |
72 | 0.76 | 20.8 | 97.9 | 0.05 | 15 | 4.2 | 0.49 | 88.3 | 86.5 | ||||||||||
| FW UG1 |
71 | 3.22 | 16.8 | 93.5 | 0.25 | 15 | 20.3 | 0.51 | 97.5 | 91.2 | ||||||||||
| FG-22-2542 |
102 | 1.18 | 26.8 | 94.1 | 0.10 | 15 | 4.4 | 0.45 | 89.9 | 84.6 | ||||||||||
| FG-22-2542 |
102 | 1.18 | 26.8 | 94.1 | 0.10 | 10 | 4.5 | 0.29 | 93.6 | 88.0 | ||||||||||
| FG-22-2542 |
102 | 1.18 | 26.8 | 94.1 | 0.10 | 5 | 4.3 | 0.19 | 95.6 | 90.0 | ||||||||||
| FG23-350a2 |
109 | 1.91 | 23.4 | 96.0 | 0.10 | 11 | 7.8 | 0.26 | 96.7 | 92.8 | ||||||||||
| FG23-350a2 |
109 | 1.91 | 23.4 | 96.0 | 0.10 | 11 | 7.7 | 0.26 | 96.6 | 92.8 | ||||||||||
| FG23-350a2 |
109 | 1.91 | 23.4 | 96.0 | 0.10 | 13 | 7.6 | 0.42 | 94.4 | 90.7 | ||||||||||
| FG23-350a2 |
109 | 1.91 | 23.4 | 96.0 | 0.10 | 13 | 7.7 | 0.38 | 95.1 | 91.3 | ||||||||||
| FG23-350a2 |
109 | 1.91 | 23.4 | 96.0 | 0.10 | 22 | 8.0 | 0.84 | 89.5 | 85.9 | ||||||||||
| FG23-350a2 |
109 | 1.91 | 23.4 | 96.0 | 0.10 | 23 | 7.8 | 0.80 | 89.7 | 86.1 | ||||||||||
| Comp. 13 |
104 | 0.57 | 20.8 | 94.5 | 0.04 | 11 | 2.6 | 0.54 | 79.6 | 75.2 | ||||||||||
| Comp. 23 |
105 | 0.47 | 20.4 | 93.2 | 0.04 | 14 | 2.1 | 0.40 | 81.7 | 76.1 | ||||||||||
| Comp. 33 |
99 | 2.35 | 20.9 | 93.6 | 0.19 | 14 | 10.5 | 0.61 | 94.0 | 88.0 | ||||||||||
| Comp. 43 |
102 | 1.17 | 24.0 | 96.7 | 0.05 | 13 | 4.7 | 0.86 | 81.7 | 79.0 | ||||||||||
| Comp. 53 |
121 | 1.12 | 25.9 | 97.3 | 0.04 | 14 | 4.2 | 0.65 | 84.5 | 82.3 | ||||||||||
| Comp. 63 |
106 | 1.12 | 29.5 | 95.0 | 0.08 | 13 | 3.6 | 0.57 | 84.2 | 80.0 | ||||||||||
| Comp. 73 |
96 | 1.01 | 22.3 | 95.4 | 0.06 | 14 | 4.3 | 0.30 | 93.0 | 88.7 | ||||||||||
| Comp. 83 |
110 | 0.42 | 19.8 | 94.3 | 0.03 | 13 | 2.0 | 0.33 | 83.7 | 78.9 |
|
|
PAGE | 13-35 October 10, 2025 |
| MAYFAIR GOLD CORP.
|
| |
| National Instrument 43-101 Technical Report—Mineral Resource Estimate Update Fenn–Gib Project, Ontario, Canada |
| Composite Sample |
Feed (P80 µm) |
Feed (Au g/t) |
Conc. %Mass Pull |
Conc. %Rec Au |
Tailings (Au g/t) |
Conc. (P80 µm) |
CN Feed (g/t Au) |
CN Residue (g/t Au) |
CN%Ext Au |
Overall %Ext Au | ||||||||||
| Comp. 93 |
104 | 2.30 | 25.1 | 95.4 | 0.14 | 13 | 8.8 | 0.72 | 91.8 | 87.6 | ||||||||||
| Comp. 103 |
104 | 0.74 | 23.1 | 95.9 | 0.04 | 14 | 3.1 | 0.79 | 74.4 | 71.3 | ||||||||||
| Comp. 113 |
95 | 1.52 | 22.7 | 95.9 | 0.08 | 14 | 6.4 | 0.69 | 89.3 | 85.6 | ||||||||||
| Comp. 123 |
104 | 0.91 | 20.8 | 98.3 | 0.02 | 9 | 4.3 | 0.64 | 85.2 | 83.7 | ||||||||||
| Comp. 133 |
106 | 1.00 | 23.2 | 97.7 | 0.03 | 14 | 4.2 | 1.13 | 73.3 | 71.6 | ||||||||||
| Comp. 143 |
132 | 1.28 | 22.1 | 93.9 | 0.10 | 14 | 5.4 | 0.41 | 92.4 | 86.8 | ||||||||||
| Comp. 153 |
94 | 1.39 | 25.8 | 93.6 | 0.12 | 14 | 5.1 | 0.56 | 89.0 | 83.3 | ||||||||||
| Comp. 173 |
98 | 3.18 | 23.1 | 95.2 | 0.20 | 14 | 13.1 | 0.17 | 98.7 | 93.9 | ||||||||||
| Comp. 183 |
100 | 4.07 | 20.8 | 93.4 | 0.34 | 11 | 18.3 | 0.38 | 97.9 | 91.4 | ||||||||||
| Comp. 193 |
100 | 0.35 | 24.4 | 95.7 | 0.02 | 14 | 1.4 | 0.16 | 88.4 | 84.6 | ||||||||||
| Comp. 203 |
102 | 0.87 | 20.2 | 95.4 | 0.05 | 14 | 4.1 | 0.29 | 93.7 | 89.4 | ||||||||||
| Comp. 213 |
116 | 0.51 | 31.5 | 97.3 | 0.02 | 14 | 1.6 | 0.34 | 79.7 | 77.6 | ||||||||||
| Comp. 223 |
99 | 0.62 | 27.2 | 96.5 | 0.03 | 13 | 2.2 | 0.13 | 94.1 | 90.8 | ||||||||||
| Comp. 233 |
115 | 3.65 | 24.1 | 94.8 | 0.25 | 14 | 14.4 | 0.13 | 99.1 | 93.9 | ||||||||||
| Comp. 243 |
119 | 1.01 | 23.8 | 95.5 | 0.06 | 14 | 4.1 | 0.19 | 95.3 | 91.0 | ||||||||||
| Comp. 253 |
100 | 1.52 | 29.2 | 93.5 | 0.14 | 14 | 4.9 | 0.34 | 93.4 | 87.3 | ||||||||||
| Comp. 263 |
101 | 3.70 | 23.0 | 96.7 | 0.16 | 14 | 15.5 | 0.32 | 98.0 | 94.7 | ||||||||||
| Comp. 273 |
113 | 9.92 | 23.0 | 96.6 | 0.44 | 13 | 41.7 | 0.50 | 98.8 | 95.4 | ||||||||||
| Comp. 283 |
117 | 2.32 | 24.0 | 96.7 | 0.10 | 12 | 9.4 | 0.31 | 96.8 | 93.6 | ||||||||||
| Comp. 303 |
116 | 1.77 | 25.3 | 97.0 | 0.07 | 14 | 6.8 | 0.28 | 96.0 | 93.2 | ||||||||||
| Comp. 313 |
111 | 1.82 | 23.5 | 95.8 | 0.10 | 12 | 7.4 | 0.33 | 95.7 | 91.7 | ||||||||||
| Comp. 323 |
94 | 0.60 | 22.3 | 96.1 | 0.03 | 10 | 2.6 | 0.56 | 78.4 | 75.3 | ||||||||||
| Comp. 333 |
103 | 1.61 | 23.0 | 97.1 | 0.06 | 12 | 6.8 | 0.29 | 95.7 | 93.0 | ||||||||||
| Comp. 343 |
91 | 1.59 | 18.6 | 95.9 | 0.08 | 12 | 8.2 | 0.41 | 95.0 | 91.1 | ||||||||||
| Comp. 353 |
107 | 3.17 | 25.2 | 96.9 | 0.13 | 13 | 12.2 | 0.40 | 97.0 | 94.1 | ||||||||||
| Comp. 373 |
104 | 2.21 | 29.0 | 98.7 | 0.04 | 13 | 7.5 | 0.24 | 97.1 | 95.8 | ||||||||||
| Comp. 383 |
95 | 0.70 | 23.3 | 95.6 | 0.04 | 13 | 2.9 | 0.42 | 85.3 | 81.6 | ||||||||||
| Comp. 393 |
101 | 5.81 | 23.8 | 95.9 | 0.31 | 13 | 23.4 | 1.08 | 95.4 | 91.5 | ||||||||||
| Comp. 403 |
92 | 2.56 | 23.8 | 97.0 | 0.10 | 14 | 10.4 | 0.66 | 93.7 | 90.9 | ||||||||||
| Comp. 423 |
101 | 0.63 | 27.4 | 93.1 | 0.06 | 13 | 2.2 | 0.24 | 88.8 | 82.7 | ||||||||||
| Comp. 433 |
110 | 0.50 | 33.3 | 94.7 | 0.04 | 14 | 1.4 | 0.10 | 93.0 | 88.1 | ||||||||||
| Comp. 443 |
96 | 0.74 | 26.6 | 97.0 | 0.03 | 10 | 2.7 | 0.26 | 90.4 | 87.7 | ||||||||||
| Comp. 453 |
103 | 1.39 | 25.6 | 96.8 | 0.06 | 10 | 5.3 | 0.81 | 84.6 | 81.9 | ||||||||||
| Comp. 463 |
102 | 0.22 | 21.4 | 92.8 | 0.02 | 12 | 1.0 | 0.17 | 82.1 | 76.2 | ||||||||||
| Comp. 473 |
107 | 0.20 | 25.1 | 92.4 | 0.02 | 14 | 0.7 | 0.25 | 65.3 | 60.3 | ||||||||||
| Comp. 483 |
100 | 0.33 | 30.0 | 95.8 | 0.02 | 13 | 1.1 | 0.22 | 79.0 | 75.7 | ||||||||||
| Comp. 493 |
112 | 0.47 | 20.0 | 94.9 | 0.03 | 13 | 2.2 | 0.07 | 96.9 | 91.9 | ||||||||||
| Comp. 503 |
105 | 0.26 | 21.5 | 92.4 | 0.03 | 14 | 1.1 | 0.04 | 96.4 | 89.1 |
| Notes: |
1SGS-Lakefield, Project 18831-01 Metallurgical Test Results, August 2022 for Mayfair Gold. | |
| 2SGS-Lakefield, Project 18831-02 Metallurgical Test Results, September 2023 for Mayfair Gold. | ||
| 3SGS-Lakefield, Project 18831-03 Metallurgical Test Results from 2025 for Mayfair Gold. |
|
|
PAGE | 13-36 October 10, 2025 |
| MAYFAIR GOLD CORP.
|
| |
| National Instrument 43-101 Technical Report—Mineral Resource Estimate Update Fenn–Gib Project, Ontario, Canada |
Rougher concentrate gold recovery determined as a function of feed grade is indicated in Formula 5, with the maximum realized rougher-flotation gold recovery estimated as 97.0 %Rec Au:
| Flotation %Rec Au = ((f – t) + (t x (C/F)) /f |
to a maximum of 97% |
Gold extraction from a reground rougher concentrate also varies proportionately to gold grade and at a concentrate grind size of P80 13 µm varies from 94% Au extraction at lower rougher concentrate gold grades to a maximum 96% Au extraction at higher concentrate gold grade. Completion of variability composite sample testwork defined what is considered as a relatively small cluster of samples (approximately 15 to 20%) which yielded lower than expected CN Au extraction due to finely disseminated gold within pyrite.
Cyanidation as a function of mill feed grade is expressed as Formula 6, with the maximum realized CN extractive gold recovery estimated at 96.0% CN %Ext Au:
| Cyanidation %Ext Au = (f +93) |
to a maximum of 96% |
Overall, gold recovery is the outcome from both unit processes and expressed as Formula 7, with an assumed constant 23% mass pull (F/C), and a flotation tailing grade of 0.10 g/t Au (t). Details are as follows:
| F |
= |
Mill Feed tonnage | ||
| C |
= |
Flotation Rougher Concentrate tonnage | ||
| T |
= |
Flotation Tailing tonnage | ||
| C/F |
= |
Mass Pull to concentrate | ||
| f |
= |
Flotation Feed grade | ||
| c |
= |
Flotation Concentrate grade | ||
| t |
= |
Flotation Tailings grade |
| Formula 1: |
F = C + T |
tonnage in = tonnage out | ||
| Formula 2: |
Ff = Cc + Tt |
metal in = metal out | ||
| Formula 3 : |
Mass Pull = C/F = (f-t) /(c-t) |
|||
| Formula 4 |
Flotation %Rec Au = Cc/Ff x 100 |
|||
| Formula 5 |
Flotation %Rec Au = ((f-t) + (t x C/F)) /f |
|||
| Formula 6 |
Cyanidation %Extraction Au = (f + 93) |
|||
| Formula 7 |
Overall %Rec Au = (f+93) x ((f-t) + (t x (C/F)) /f |
Overall, Au recovery as a function of gold feed grade for Fenn-Gib mineralization, (>0.2 g/t Au), is then:
Overall %Rec Au = (f + 93) x ((f – 0.10) + (0.10 x 0.23)) /f to a maximum 93%Rec Au
%Overall Rec Au at 1.5 g/t Au = (1.5 + 93) x ((1.5 – 0.10) + (0.10 x 0.23)) /1.5 = 89.6 % Rec Au
A comparison of modelled overall gold recovery to all testwork completed during 2022–2025 is indicated in Figure 13-11. The additional variability test data from 2025 introduced a wider range of material head grade and provided an opportunity to adjust the associated Geo-Met model for overall gold recovery.
|
|
PAGE | 13-37 October 10, 2025 |
| MAYFAIR GOLD CORP.
|
| |
| National Instrument 43-101 Technical Report—Mineral Resource Estimate Update Fenn–Gib Project, Ontario, Canada |
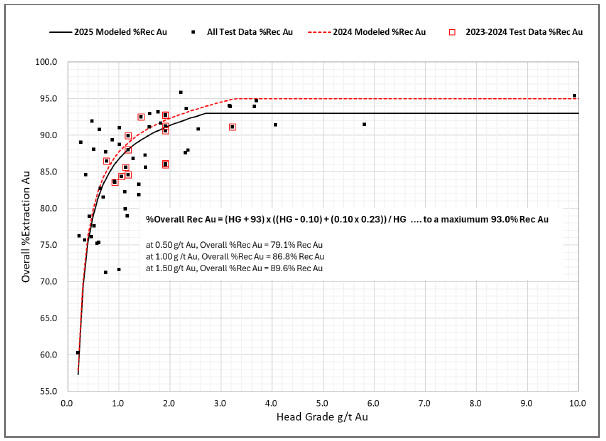
Source: Haggarty Technical Services July 2025—from test data in Table 13-12.
Figure 13-11: Geometallurgical Modelled Gold Head Grade versus Overall Gold Recovery
| 13.5 | Metallurgical Variability |
The composite sample variability test program included 46 composite samples listed in Table 13-2. By subjecting the respective composites to identical baseline conditions including a flotation feed grind size of P80 106 µm, 23% to 25% mass pull to a rougher-concentrate, with flotation reagents including PAX (45 g/t), Aero 3501 (20 g/t), Aero 3477 (20 g/t), MIBC (50 g/t), comparative flotation performance was established, as indicated in Table 13-9 and Figure 13-6.
Subsequent regrinding of rougher concentrates to P80 10 to 13 µm, followed by cyanidation for 48 hours with 1,000 ppm NaCN established the expected variability in overall gold extraction over a range in feed grade from 0.2 to 9.9 g/t Au and 0.3 to 4.6% S2- (Table 13-10 and Figure 13-1).
|
|
PAGE | 13-38 October 10, 2025 |
| MAYFAIR GOLD CORP.
|
| |
| National Instrument 43-101 Technical Report—Mineral Resource Estimate Update Fenn–Gib Project, Ontario, Canada |
| 13.6 | Deleterious Elements |
Since the production and shipment of a final flotation concentrate to a third-party smelter is not considered as a process alternative, there are no deleterious elements present other than sulphide content and tellurides that could influence metallurgical performance with cyanidation.
| 13.7 | Additional Metallurgical Testwork |
To support the potential for future Project definition, engineering studies, and equipment selection, there are some specific parameters and additional testwork that is suggested as required:
| • | Pursue additional cyanidation-carbon-in-pulp versus carbon-in-leach test work to identify any potential upside in gold extraction from the reground pyrite concentrate. |
| • | Complete mineralogical studies with PMC-Vancouver and the NRC to confirm the composition of observed fine and medium-size gold grains in cyanidation residue. |
| • | Define crushed-rock material properties including bulk density and angle of repose. |
| • | Confirm process slurry specific gravity at varying slurry densities. |
| • | Define process slurry and rougher-concentrate viscosity and rheology parameters for final definition and selection of pipe work, agitator specifications, and pump selection. |
| • | Complete concentrate solids/liquid separation testwork for pre-leach and pre-CN Detox thickener design with the potential for vendor involvement. |
| • | Define final settled tailings densities to establish expected tailings placement factors. |
| • | Complete CN Detox testwork on CIL tailings slurry to confirm process design criteria and performance. |
| • | Define secondary water treatment requirements and chemistry to achieve treated-water targets. |
| • | Consider involving and supporting original-equipment manufacturer (OEM) vendors in the final selection of major equipment to obtain a level of performance guarantee or reassurance regarding equipment selection. |
|
|
PAGE | 13-39 October 10, 2025 |
| MAYFAIR GOLD CORP.
|
| |
| National Instrument 43-101 Technical Report—Mineral Resource Estimate Update Fenn–Gib Project, Ontario, Canada |
| 14 | MINERAL RESOURCE ESTIMATE |
This section presents the Mineral Resource estimate for the Fenn–Gib Project, prepared and disclosed in accordance with the CIM Standards and Definitions for Mineral Resources and Mineral Reserves (CIM Definition Standards) (CIM, 2014). The Mineral Resource estimate includes both Indicated and Inferred Resources. TMAC’s Qualified Person, Mr. Tim Maunula, P.Geo., is responsible for the Mineral Resource estimate, which has an effective date of September 3, 2024.
| 14.1 | Key Assumptions |
The Mineral Resource estimate incorporates extensive drill hole data from surface diamond drill programs, combining both historical drilling completed prior to 2017 and Mayfair Gold’s drilling campaign from 2021–2024. The cut-off date for assay data used in the Mineral Resource estimate was April 30, 2024. All data received were recorded in NAD 83 UTM coordinates (Zone 17).
The Mineral Resource estimate was:
| • | Prepared using Hexagon Mining’s HxGN MinePlan 16.2.1 (MinePlan) |
| • | Classified according to the CIM Definition Standards |
| • | Reported within a constraining resource pit shell at a 0.3 g/t Au cut-off grade, which is amenable to open pit extraction. |
| 14.2 | Data |
The Project Mineral Resource estimate is based on drill-hole data consisting of gold assays, geological descriptions, and density measurements. Mayfair Gold provided TMAC the data in CSV and DXF file formats, which were imported into MinePlan. The database was additionally verified using the validation tool in MinePlan to determine errors and overlapping or out-of-sequence intervals. Minor errors were noted, and the database was updated.
The Mineral Resource estimate used 457 historical drill holes (totalling 145,332.81 m) and 291 Mayfair Gold drill holes (totalling 171, 120.25 m), which together yielded 217,354 assayed intervals, and 20,688 unassayed intervals that were assigned an assay value of 0 (Figure 14-1).
| 14.3 | Geological Model |
The primary gold mineralization for the Project was modelled in three domains: Main Zone, Deformation Zone, and Footwall Zone (including a Footwall Zone High Grade). However, gold mineralization is also contained within the other contiguous geological domains: mafic volcanics, pyroxenite, ultramafic volcanics, and sediments (Figure 14-1). Mayfair Gold modelled the rock-type groups using Datamine Studio EM (Datamine). TMAC reviewed and validated these rock-type group wireframes for use in the Mineral Resource estimate. Gold grades were estimated separately by rock type within each domain.
|
|
PAGE | 14-1 October 10, 2025 |
| MAYFAIR GOLD CORP.
|
| |
| National Instrument 43-101 Technical Report—Mineral Resource Estimate Update Fenn–Gib Project, Ontario, Canada |
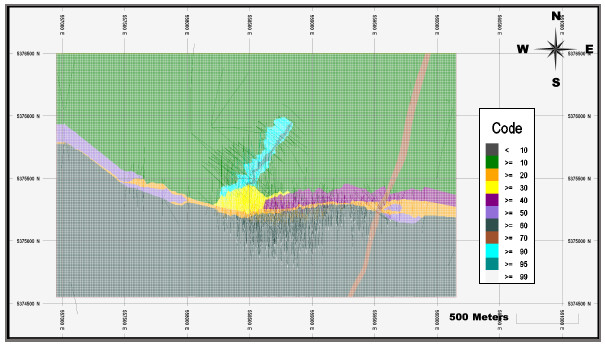
Source: Maunula (2024)
Figure 14-1: Plan View of Drill-Hole Traces and Geological Block Model
The wireframes were used to code the block model and calculate the drill-hole solid intersections to code the assay and composite data. The domain codes assigned are listed in Table 14-1.
Table 14-1: Geology Block Model Codes and Descriptions
| Rock Code |
Domain Code |
Description | ||
| MV |
10 | Mafic Volcanics | ||
| DZ |
20 | Deformation Zone | ||
| MAIN |
30 | Main Zone | ||
| PYX |
40 | Pyroxenite | ||
| UMV |
50 | Ultramafic Volcanics | ||
| SEDS |
60 | Sediments | ||
| DIA |
70 | Diabase | ||
| FWZ |
90 | Footwall Zone | ||
| FWZHG |
95 | Footwall Zone High Grade | ||
| OVB |
99 | Overburden |
|
|
PAGE | 14-2 October 10, 2025 |
| MAYFAIR GOLD CORP.
|
| |
| National Instrument 43-101 Technical Report—Mineral Resource Estimate Update Fenn–Gib Project, Ontario, Canada |
| 14.4 | Exploratory Data Analysis |
| 14.4.1 | Assays |
The Mineral Resource model includes only gold assays from drill holes within or near to the interpreted geological wireframes. Exploratory data analysis was conducted on raw drill-hole data selected by mineralization zone or rock type to determine the nature of the gold grade distribution and correlation of grades with individual domains. The gold grade values were evaluated through a combination of descriptive statistics, histograms, probability plots, and box plots.
Figure 14-2 presents a boxplot which graphically illustrates the uncapped gold grade sorted by the domain codes. The highest mean gold grades are associated with the Main Zone (30) and Deformation Zone (20).
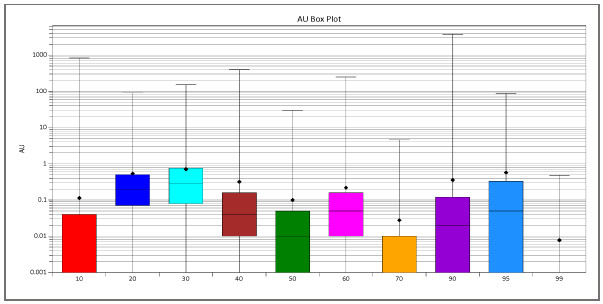
Source: Maunula (2024)
Figure 14-2: Boxplot of Uncapped Gold Grades (g/t) by Domain Code
| 14.4.2 | Grade Capping and Outlier Restrictions |
In mineral deposits with skewed distributions (characterized by a coefficient of variation [CV] greater than 2), a small number of high-grade outliers may account for a significant portion of the contained metal content. These high-grade outliers typically show limited spatial continuity.
Capping analysis by domain (Table 14-2) was carried out on assay values using disintegration analysis and log-probability plots.
|
|
PAGE | 14-3 October 10, 2025 |
| MAYFAIR GOLD CORP.
|
| |
| National Instrument 43-101 Technical Report—Mineral Resource Estimate Update Fenn–Gib Project, Ontario, Canada |
Table 14-2: Capping Analysis Summary
| Domain |
Count | Uncapped Grades | Capped Grades | |||||||||||||||||||||||||||||
| Max (g/t Au) |
Mean (g/t Au) |
CV | Cap Value (g/t Au) |
No. Capped |
Mean (g/t Au) |
CV | ||||||||||||||||||||||||||
| 10 |
49,626 | 835.330 | 0.113 | 47.31 | 15.00 | 11 | 0.075 | 5.09 | ||||||||||||||||||||||||
| 20 |
30,974 | 90.550 | 0.539 | 2.65 | 20.00 | 17 | 0.531 | 2.24 | ||||||||||||||||||||||||
| 30 |
44,635 | 151.690 | 0.708 | 2.94 | 28.50 | 22 | 0.690 | 2.10 | ||||||||||||||||||||||||
| 40 |
22,978 | 392.000 | 0.320 | 12.25 | 24.50 | 23 | 0.230 | 4.63 | ||||||||||||||||||||||||
| 50 |
3,083 | 29.400 | 0.100 | 8.23 | 3.70 | 9 | 0.079 | 3.68 | ||||||||||||||||||||||||
| 60 |
51,020 | 249.810 | 0.218 | 7.37 | 23.60 | 24 | 0.206 | 4.17 | ||||||||||||||||||||||||
| 70 |
581 | 4.580 | 0.028 | 7.35 | 0.70 | 4 | 0.021 | 3.71 | ||||||||||||||||||||||||
| 90 |
25,092 | 3,782.710 | 0.357 | 66.96 | 22.00 | 10 | 0.196 | 4.15 | ||||||||||||||||||||||||
| 95 |
10,818 | 86.940 | 0.572 | 4.04 | 26.00 | 9 | 0.545 | 3.17 | ||||||||||||||||||||||||
| 99 |
3,219 | 0.480 | 0.008 | 5.53 | 0.00 | 0 | 0.001 | 0.00 | ||||||||||||||||||||||||
Source: Maunula (2024)
Disintegration analysis uses a step function (the difference between adjacent samples sorted by grade) to denote the changes in an ordered data set and provides a degree of resolution on the plots to identify the population breaks that can be used for capping. It also provides an overall view of the continuity of the grade data set.
Figure 14-3 and Figure 14-4 illustrate the disintegration analysis for the Deformation Zone and Main Zone, respectively.
|
|
PAGE | 14-4 October 10, 2025 |
| MAYFAIR GOLD CORP.
|
| |
| National Instrument 43-101 Technical Report—Mineral Resource Estimate Update Fenn–Gib Project, Ontario, Canada |
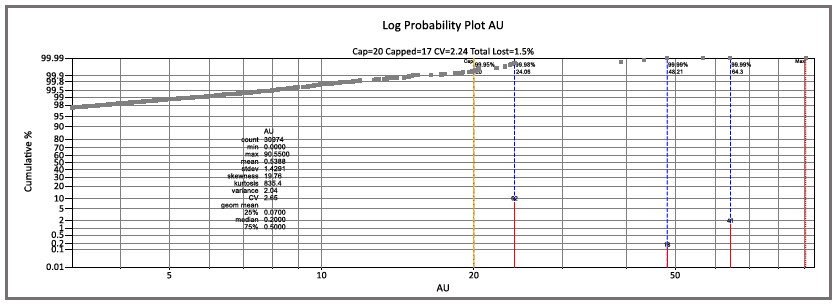
Source: Maunula (2024)
Figure 14-3: Log Probability Plot, Deformation Zone (Au g/t)
|
|
PAGE | 14-5 October 10, 2025 |
| MAYFAIR GOLD CORP.
|
| |
| National Instrument 43-101 Technical Report—Mineral Resource Estimate Update Fenn–Gib Project, Ontario, Canada |
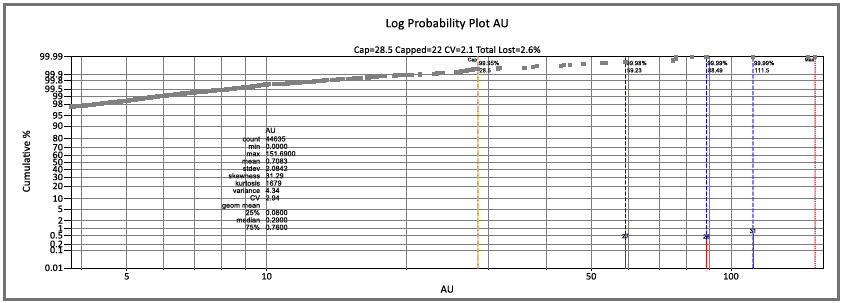
Source: Maunula (2024)
Figure 14-4: Log Probability Plot, Main Zone (Au g/t)
|
|
PAGE | 14-6 October 10, 2025 |
| MAYFAIR GOLD CORP.
|
| |
| National Instrument 43-101 Technical Report—Mineral Resource Estimate Update Fenn–Gib Project, Ontario, Canada |
| 14.4.3 | Composites |
For purposes of normalizing the assay data for further analysis, both raw and capped assay values were composited to 1.5 m intervals starting from the top of each drill hole. Unassayed intervals were assigned a grade of 0.0 g/t Au. The resulting composite values were then categorized using the majority domain code. Figure 14-5 presents a boxplot illustrating the distribution of capped grades-by domain code.
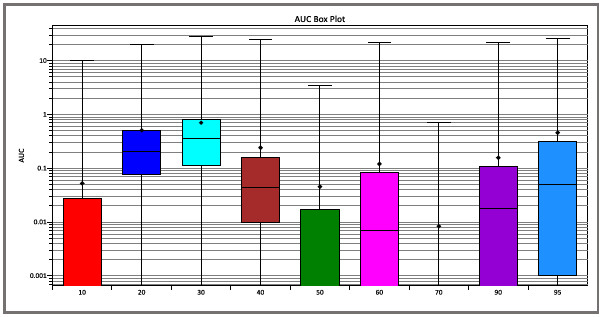
Source: Maunula (2024)
Figure 14-5: 1.5 m Composites Reported by Domain Code, Capped Au (g/t)
To support model validation, 5 m composites were created for use with the nearest-neighbour (NN) grade interpolation. Figure 14-6 illustrates the grade distribution for the 5 m composites.
|
|
PAGE | 14-7 October 10, 2025 |
| MAYFAIR GOLD CORP.
|
| |
| National Instrument 43-101 Technical Report—Mineral Resource Estimate Update Fenn–Gib Project, Ontario, Canada |
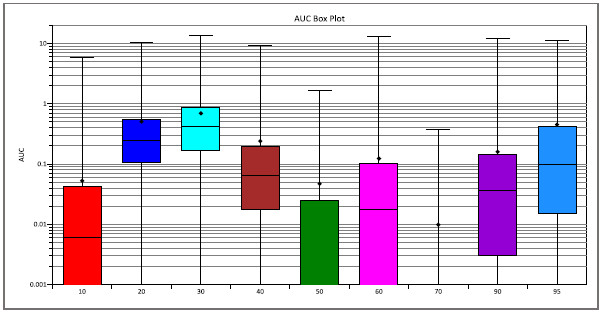
Source: Maunula (2024)
Figure 14-6: 5 m Composites Reported by Domain Code, Capped Au (g/t)
| 14.5 | Density Assignment |
Table 14-3 reports the average density values by domain code based on 4,360 individual measurements using standard water-displacement methods. Overburden density was assigned 1.80 g/cm3 and the default density was 2.81 g/cm3.
Table 14-3: Assigned Density Values
| Domain Code |
Lithology |
Count |
Density (g/cm3) | |||
| 10 |
Mafics |
1,266 | 2.90 | |||
| 20 |
Deformation Zone |
570 | 2.69 | |||
| 30 |
Main Zone |
1,034 | 2.81 | |||
| 40 |
Pyroxenite |
368 | 2.90 | |||
| 50 |
Ultramafics |
94 | 2.83 | |||
| 60 |
Metasediments |
426 | 2.74 | |||
| 90 |
Footwall Zone |
602 | 2.86 | |||
|
|
| |||||
| Average |
4,360 | 2.81 | ||||
|
|
| |||||
Source: Maunula (2024)
|
|
PAGE | 14-8 October 10, 2025 |
| MAYFAIR GOLD CORP.
|
| |
| National Instrument 43-101 Technical Report—Mineral Resource Estimate Update Fenn–Gib Project, Ontario, Canada |
| 14.6 | Variography |
Geostatisticians use a variety of tools to analyze and characterize the spatial relationships between data points, particularly how variables relate to each other across different distances (lags) and directions. One of these is the correlogram, which measures the correlation between data values as a function of their separation distance and direction. If we compare samples that are close together, it is common to observe that their values are quite similar and the correlation coefficient for closely spaced samples is near 1.0. As the separation between samples increases, there is likely to be less similarity in the values, and the correlogram tends to decrease toward 0.0. The distance at which the correlogram reaches zero is called the range of correlation, or simply the range. The range of the correlogram corresponds roughly to the more-qualitative notion of the range of influence of a sample; it is the distance over which sample values show some persistence or correlation. The shape of the correlogram describes the pattern of spatial continuity. A very rapid decrease near the origin is indicative of short-scale variability. A more gradual decrease moving away from the origin suggests more short-scale continuity. A plot of “1-correlation” is made so the result looks like the more-familiar variogram plot.
The approach used to develop the variogram models employed SAGE2001 software. Directional sample correlograms were calculated along horizontal azimuths of 0, 30, 60, 120, 150, 180, 210, 240, 270, 300, and 330 degrees. For each azimuth, sample correlograms were also calculated at dips of 30 and 60 degrees in addition to the horizontal (dip 0 degrees). Lastly, a correlogram was calculated in for the vertical (dip 90 degrees). Using the 37 sample correlograms, an algorithm determined the best-fit model nugget effect and two-nested structure variance contributions. After fitting the variance parameters, the algorithm then fitted an ellipsoid to the 37 ranges from the directional models for each structure. The anisotropy of the correlation was given by the range along the major, semi-major, and minor axes of the ellipsoids, and the orientations of these axes for each structure. TMAC reviewed the fitted variogram and adjusted to reflect the mineralization.
Table 14-4 presents the correlogram parameters for the Fenn–Gib Project by domain codes.
The rotation convention for the search anisotropy is ZXY:
| • | Rotation about Z-axis—left-hand rule (clockwise rotation positive) |
| • | Rotation about new X-axis—right-hand rule (anti-clockwise rotation positive) |
| • | Rotation about new Y-axis—right-hand rule (anti-clockwise rotation positive) |
|
|
PAGE | 14-9 October 10, 2025 |
| MAYFAIR GOLD CORP.
|
| |
| National Instrument 43-101 Technical Report—Mineral Resource Estimate Update Fenn–Gib Project, Ontario, Canada |
Table 14-4: Correlogram Parameters
| Domain |
Type | C0 | Structure 1 (C1): SPHERICAL | Structure 2 (C2): SPHERICAL | ||||||||||||||||||||||||||||||||||||||||||||||||||||||||||||
| C1 | Rot Z (°) |
Rot X (°) |
Rot Y (°) |
Range X (m) |
Range Y (m) |
Range Z (m) |
C2 | Rot Z (°) |
Rot X (°) |
Rot Y (°)’ |
Range X (m) |
Range Y (m) |
Range Z (m) |
|||||||||||||||||||||||||||||||||||||||||||||||||||
| 10 MV |
SPH | 0.45 | 0.45 | 85 | 2 | -22 | 11 | 22 | 11 | 0.10 | -72 | 44 | 32 | 45 | 95 | 150 | ||||||||||||||||||||||||||||||||||||||||||||||||
| 20 DZ |
SPH | 0.35 | 0.45 | 70 | 2 | 10 | 15 | 20 | 15 | 0.20 | -1 | -10 | -115 | 250 | 50 | 150 | ||||||||||||||||||||||||||||||||||||||||||||||||
| 30 MZ |
SPH | 0.45 | 0.45 | -40 | -30 | 40 | 15 | 15 | 15 | 0.10 | -150 | 80 | -105 | 125 | 250 | 160 | ||||||||||||||||||||||||||||||||||||||||||||||||
| 40 PYX |
SPH | 0.10 | 0.85 | -40 | 40 | 40 | 15 | 20 | 10 | 0.05 | 45 | 55 | 35 | 225 | 250 | 100 | ||||||||||||||||||||||||||||||||||||||||||||||||
| 50 UMV |
SPH | 0.35 | 0.40 | -65 | 95 | -15 | 15 | 20 | 20 | 0.25 | -75 | 40 | -30 | 50 | 190 | 90 | ||||||||||||||||||||||||||||||||||||||||||||||||
| 60 SEDS |
SPH | 0.30 | 0.65 | -25 | 30 | -10 | 25 | 25 | 15 | 0.05 | 60 | 35 | -30 | 115 | 160 | 250 | ||||||||||||||||||||||||||||||||||||||||||||||||
| 90 FWZ LG |
SPH | 0.20 | 0.70 | 15 | -50 | 25 | 10 | 10 | 15 | 0.10 | 30 | 0 | 0 | 60 | 150 | 50 | ||||||||||||||||||||||||||||||||||||||||||||||||
| 95 FWZ HG |
SPH | 0.10 | 0.80 | -50 | 55 | 80 | 20 | 20 | 25 | 0.10 | -50 | 120 | 75 | 90 | 105 | 125 | ||||||||||||||||||||||||||||||||||||||||||||||||
Note: Rot = rotation around axis.
Source: Maunula (2024)
|
|
PAGE | 14-10 October 10, 2025 |
| MAYFAIR GOLD CORP.
|
| |
| National Instrument 43-101 Technical Report—Mineral Resource Estimate Update Fenn–Gib Project, Ontario, Canada |
| 14.7 | Block Model Definition |
The block model matrix was designed to capture the geometry of the deposit, characterized by narrow zones of mineralization within the broader lithology, drill data-density, and the selective mining unit (SMU). No rotation was applied to the block models. Table 14-5 summarizes the block model workspace for the Fenn–Gib Project.
Table 14-5: Block Model Workspace
| Description |
Parameter | |||
| Easting (m) |
556,950 | |||
| Northing (m) |
5,374,550 | |||
| Maximum Elevation (m) |
5,400 | |||
| Rotation Angle |
No rotation | |||
| Block Size—X, Y, Z (m) |
5 x 5 x 5 | |||
| Number of Blocks in the X Direction |
640 | |||
| Number of Blocks in the Y Direction |
390 | |||
| Number of Blocks in the Z Direction |
180 | |||
Source: Maunula (2024)
| 14.8 | Estimation and Interpolation Methods |
The Fenn–Gib block model was estimated using three interpolation methods: nearest neighbor (NN), inverse distance weighting squared (IDW2) and ordinary kriging (OK). Uncapped and capped gold grades were estimated for the OK model. Only capped gold grades were estimated for the NN and IDW2 models.
Table 14-6 provides a comprehensive overview of the interpolation parameters and search ellipses used for NN, IDW2, and OK interpolation methods. All blocks were estimated using a single interpolation pass.
|
|
PAGE | 14-11 October 10, 2025 |
| MAYFAIR GOLD CORP.
|
| |
| National Instrument 43-101 Technical Report—Mineral Resource Estimate Update Fenn–Gib Project, Ontario, Canada |
Table 14-6: Interpolation Parameters by Domain Code
| Parameters | ||||||||||||||||||||||||||||||||||||||||||
| Block Model |
Code | Grade | Min # Comp. |
Max # Comp. |
Max #/DH |
Rot Z (°) |
Rot X (°) |
Rot Y (°)’ |
Major (m) |
Minor (m) |
Vertical (m) |
|||||||||||||||||||||||||||||||
| AUCNN |
10 | AUC | 1 | 1 | 1 | 90 | 0 | 0 | 150 | 100 | 100 | |||||||||||||||||||||||||||||||
| 20 | AUC | — | — | — | 95 | 0 | 0 | 250 | 150 | 150 | ||||||||||||||||||||||||||||||||
| 30 | AUC | — | — | — | 90 | 0 | 0 | 250 | 150 | 150 | ||||||||||||||||||||||||||||||||
| 40 | AUC | — | — | — | 90 | 0 | 0 | 250 | 200 | 150 | ||||||||||||||||||||||||||||||||
| 50 | AUC | — | — | — | 110 | 0 | 0 | 200 | 100 | 100 | ||||||||||||||||||||||||||||||||
| 60 | AUC | — | — | — | 90 | 0 | 0 | 250 | 150 | 150 | ||||||||||||||||||||||||||||||||
| 90 | AUC | — | — | — | 35 | 0 | 0 | 150 | 100 | 100 | ||||||||||||||||||||||||||||||||
| 95 | AUC | — | — | — | 35 | 0 | 0 | 125 | 100 | 100 | ||||||||||||||||||||||||||||||||
| AUCID |
10 | AUC | 3 | 12 | 4 | 90 | 0 | 0 | 150 | 100 | 100 | |||||||||||||||||||||||||||||||
| 20 | AUC | — | — | — | 95 | 0 | 0 | 250 | 150 | 150 | ||||||||||||||||||||||||||||||||
| 30 | AUC | — | — | — | 90 | 0 | 0 | 250 | 150 | 150 | ||||||||||||||||||||||||||||||||
| 40 | AUC | — | — | — | 90 | 0 | 0 | 250 | 200 | 150 | ||||||||||||||||||||||||||||||||
| 50 | AUC | — | — | — | 110 | 0 | 0 | 200 | 100 | 100 | ||||||||||||||||||||||||||||||||
| 60 | AUC | — | — | — | 90 | 0 | 0 | 250 | 150 | 150 | ||||||||||||||||||||||||||||||||
| 90 | AUC | — | — | — | 35 | 0 | 0 | 150 | 100 | 100 | ||||||||||||||||||||||||||||||||
| 95 | AUC | — | — | — | 35 | 0 | 0 | 125 | 100 | 100 | ||||||||||||||||||||||||||||||||
| AUCOK |
10 | AUC | 3 | 12 | 4 | 90 | 0 | 0 | 150 | 100 | 100 | |||||||||||||||||||||||||||||||
| 20 | AUC | — | — | — | 95 | 0 | 0 | 250 | 150 | 150 | ||||||||||||||||||||||||||||||||
| 30 | AUC | — | — | — | 90 | 0 | 0 | 250 | 150 | 150 | ||||||||||||||||||||||||||||||||
| 40 | AUC | — | — | — | 90 | 0 | 0 | 250 | 200 | 150 | ||||||||||||||||||||||||||||||||
| 50 | AUC | — | — | — | 110 | 0 | 0 | 200 | 100 | 100 | ||||||||||||||||||||||||||||||||
| 60 | AUC | — | — | — | 90 | 0 | 0 | 250 | 150 | 150 | ||||||||||||||||||||||||||||||||
| 90 | AUC | — | — | — | 35 | 0 | 0 | 150 | 100 | 100 | ||||||||||||||||||||||||||||||||
| 95 | AUC | — | — | — | 35 | 0 | 0 | 125 | 100 | 100 | ||||||||||||||||||||||||||||||||
| AUOK |
10 | AU | 3 | 12 | 4 | 90 | 0 | 0 | 150 | 100 | 100 | |||||||||||||||||||||||||||||||
| 20 | AU | — | — | — | 95 | 0 | 0 | 250 | 150 | 150 | ||||||||||||||||||||||||||||||||
| 30 | AU | — | — | — | 90 | 0 | 0 | 250 | 150 | 150 | ||||||||||||||||||||||||||||||||
| 40 | AU | — | — | — | 90 | 0 | 0 | 250 | 200 | 150 | ||||||||||||||||||||||||||||||||
| 50 | AU | — | — | — | 110 | 0 | 0 | 200 | 100 | 100 | ||||||||||||||||||||||||||||||||
| 60 | AU | — | — | — | 90 | 0 | 0 | 250 | 150 | 150 | ||||||||||||||||||||||||||||||||
| 90 | AU | — | — | — | 35 | 0 | 0 | 150 | 100 | 100 | ||||||||||||||||||||||||||||||||
| 95 | AU | — | — | — | 35 | 0 | 0 | 125 | 100 | 100 | ||||||||||||||||||||||||||||||||
Notes: AU = uncapped Au g/t; AUC = capped Au g/t; Rot = rotation around axis.
Source: Maunula (2024)
Additional interpolation characteristics (Table 14-7) were stored for use in validation and resource classification.
|
|
PAGE | 14-12 October 10, 2025 |
| MAYFAIR GOLD CORP.
|
| |
| National Instrument 43-101 Technical Report—Mineral Resource Estimate Update Fenn–Gib Project, Ontario, Canada |
Table 14-7: Special Models
| Method |
Special Model |
Description |
||||
| NN |
DSTNN | Distance to nearest sample used |
||||
| ID |
DSTID | Distance to nearest sample used |
||||
| OK |
DSTOK | Distance to nearest sample used |
||||
| OK |
NDDH | Number of drill holes used |
||||
| OK |
NSOK | Number of composites used |
||||
| OK |
KV | Kriging variance |
||||
| OK |
NSEC | Number of sectors |
||||
| OK |
DSTAV | Average distance of composites used |
Source: Maunula (2024)
| 14.9 | Block Model Validation |
For quality assurance, TMAC employs both verification and validation of the block model, defined as follows:
| • | Verification is a manual check (i.e., visual inspection) or quasi-manual check (i.e., spreadsheet) of the actual procedure used. |
| • | Validation is a test for reasonableness using a parallel procedure, which may be manual or computer-based (i.e., different interpolation methods). |
| 14.9.1 | Visual Verification |
Visual inspection of the block model results, both in section and plan view, demonstrated correlation with the drill-hole composite data. As shown in Figure 14-7 (plan view) and Figure 14-8 (section view), the interpolated block grades align well with the composite data, confirming the model’s reliability.
|
|
PAGE | 14-13 October 10, 2025 |
| MAYFAIR GOLD CORP.
|
| |
| National Instrument 43-101 Technical Report—Mineral Resource Estimate Update Fenn–Gib Project, Ontario, Canada |
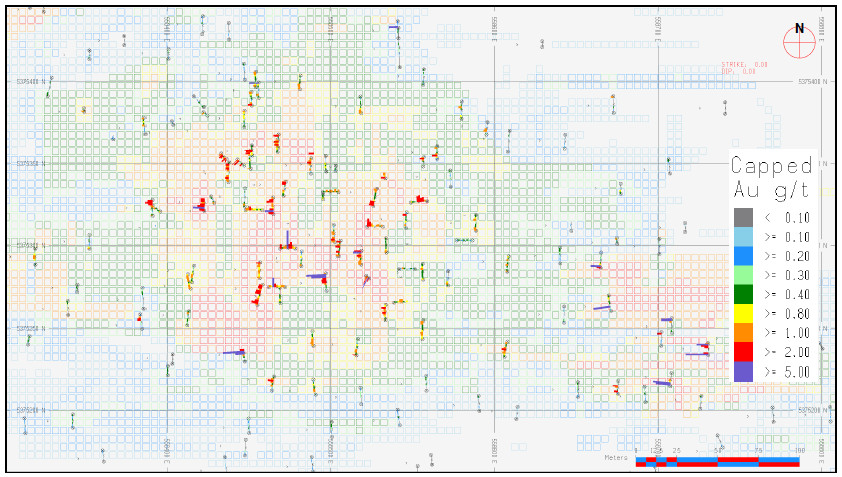
Source: Maunula (2025)
Figure 14-7: 5180 Elevation, Composites versus Block Model (Capped Au g/t)
|
|
PAGE | 14-14 October 10, 2025 |
| MAYFAIR GOLD CORP.
|
| |
| National Instrument 43-101 Technical Report—Mineral Resource Estimate Update Fenn–Gib Project, Ontario, Canada |
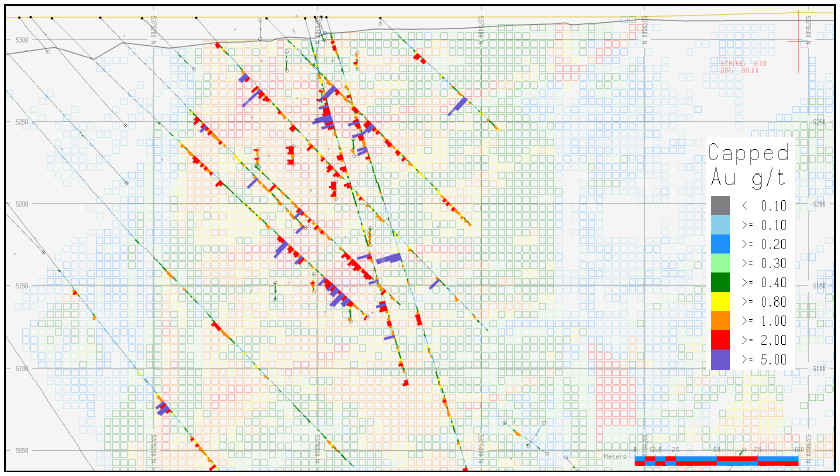
Source: Maunula (2024)
Figure 14-8: East 558500, Composites versus Block Model (Capped Au g/t)
|
|
PAGE | 14-15 October 10, 2025 |
| MAYFAIR GOLD CORP.
|
| |
| National Instrument 43-101 Technical Report—Mineral Resource Estimate Update Fenn–Gib Project, Ontario, Canada |
| 14.9.2 | Statistical Validation |
Statistical review of the block model across all domains demonstrated consistency between the different interpolation methods and the composite grades. Table 14-8 presents the grades for each of the different interpolation methods. While minor variations exist between methods, these are primarily attributed to data density and statistics generated by block count rather than tonnage-weighted calculations—all within expected parameters for this type of interpolation method.
Table 14-8: Grade Comparison by Interpolation Method
| Block Model |
Code | Count | Min | Max | Mean | Variance | SD | CV | ||||||||||||||||||||||
| AUCNN |
10 | 2,240,282 | 0.001 | 5.855 | 0.075 | 0.05 | 0.232 | 3.07 | ||||||||||||||||||||||
| AUCNN |
20 | 632,103 | 0.001 | 10.527 | 0.355 | 0.38 | 0.620 | 1.75 | ||||||||||||||||||||||
| AUCNN |
30 | 300,033 | 0.001 | 26.430 | 0.518 | 0.64 | 0.803 | 1.55 | ||||||||||||||||||||||
| AUCNN |
40 | 546,271 | 0.001 | 9.435 | 0.158 | 0.21 | 0.462 | 2.92 | ||||||||||||||||||||||
| AUCNN |
50 | 132,556 | 0.001 | 1.649 | 0.099 | 0.04 | 0.199 | 2.02 | ||||||||||||||||||||||
| AUCNN |
60 | 2,133,135 | 0.001 | 13.291 | 0.157 | 0.09 | 0.305 | 1.94 | ||||||||||||||||||||||
| AUCNN |
90 | 344,172 | 0.001 | 11.914 | 0.175 | 0.19 | 0.433 | 2.48 | ||||||||||||||||||||||
| AUCNN |
95 | 84,624 | 0.001 | 11.029 | 0.473 | 1.05 | 1.024 | 2.16 | ||||||||||||||||||||||
| AUCID |
10 | 2,946,264 | 0 | 6.500 | 0.100 | 0.02 | 0.100 | 2.41 | ||||||||||||||||||||||
| AUCID |
20 | 658,232 | 0 | 12.200 | 0.300 | 0.22 | 0.500 | 1.38 | ||||||||||||||||||||||
| AUCID |
30 | 305,769 | 0 | 18.700 | 0.500 | 0.37 | 0.600 | 1.20 | ||||||||||||||||||||||
| AUCID |
40 | 638,918 | 0 | 24.100 | 0.100 | 0.12 | 0.300 | 2.38 | ||||||||||||||||||||||
| AUCID |
50 | 160,376 | 0 | 1.900 | 0.100 | 0.02 | 0.100 | 1.65 | ||||||||||||||||||||||
| AUCID |
60 | 2,780,865 | 0 | 14.200 | 0.100 | 0.06 | 0.200 | 1.90 | ||||||||||||||||||||||
| AUCID |
90 | 432,499 | 0 | 10.300 | 0.100 | 0.07 | 0.300 | 1.86 | ||||||||||||||||||||||
| AUCID |
95 | 105,199 | 0 | 11.100 | 0.400 | 0.50 | 0.700 | 1.78 | ||||||||||||||||||||||
| AUCOK |
10 | 3,277,877 | 0.001 | 4.550 | 0.054 | 0.01 | 0.118 | 2.18 | ||||||||||||||||||||||
| AUCOK |
20 | 662,955 | 0.001 | 10.397 | 0.358 | 0.19 | 0.437 | 1.22 | ||||||||||||||||||||||
| AUCOK |
30 | 305,807 | 0.002 | 11.426 | 0.511 | 0.26 | 0.509 | 1.00 | ||||||||||||||||||||||
| AUCOK |
40 | 642,322 | 0.001 | 8.479 | 0.145 | 0.07 | 0.271 | 1.87 | ||||||||||||||||||||||
| AUCOK |
50 | 175,981 | 0.001 | 1.421 | 0.092 | 0.02 | 0.144 | 1.56 | ||||||||||||||||||||||
| AUCOK |
60 | 2,953,290 | 0.001 | 11.783 | 0.128 | 0.05 | 0.233 | 1.81 | ||||||||||||||||||||||
| AUCOK |
90 | 446,574 | 0.001 | 7.089 | 0.140 | 0.05 | 0.214 | 1.52 | ||||||||||||||||||||||
| AUCOK |
95 | 106,186 | 0.001 | 10.218 | 0.396 | 0.36 | 0.604 | 1.52 | ||||||||||||||||||||||
Source: Maunula (2024)
| 14.9.3 | Swath Plots |
Validation of the resource estimation included comprehensive swath plot analysis comparing gold grades across multiple interpolation methods (NN, IDW2, and OK) against composite grades. As shown in Figure 14-9 and Figure 14-10, there is a strong correlation between composite and block model grades for all interpolation methods, demonstrating the robustness of the grade estimation.
|
|
PAGE | 14-16 October 10, 2025 |
| MAYFAIR GOLD CORP.
|
| |
| National Instrument 43-101 Technical Report—Mineral Resource Estimate Update Fenn–Gib Project, Ontario, Canada |
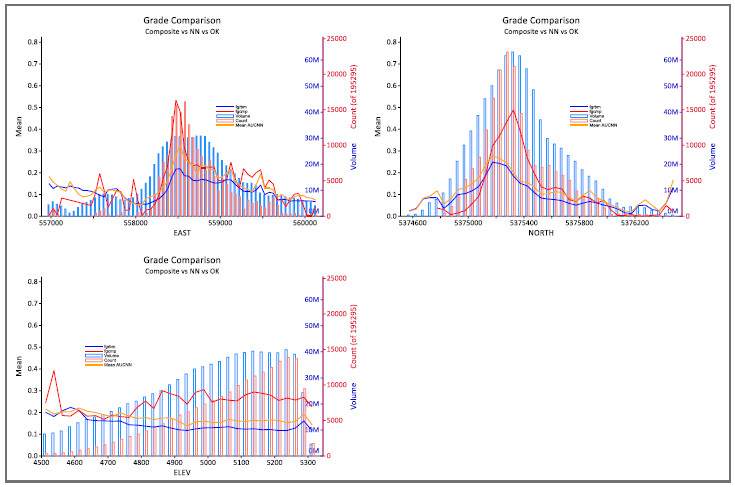
Source: Maunula (2024)
| Figure | 14-9: Swath Plot of NN and OK Mean Block Model Gold Grades with Mean Composite Gold Grade (g/t) |
|
|
PAGE | 14-17 October 10, 2025 |
| MAYFAIR GOLD CORP.
|
| |
| National Instrument 43-101 Technical Report—Mineral Resource Estimate Update Fenn–Gib Project, Ontario, Canada |
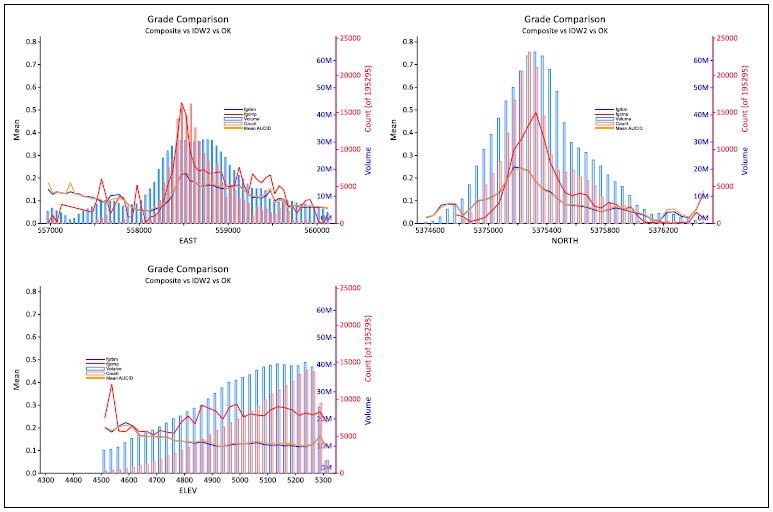
Source: Maunula (2024)
| Figure | 14-10: Swath Plot of NN and IDW2 Mean Block Model Gold Grades with Mean Composite Gold Grade (g/t) |
|
|
PAGE | 14-18 October 10, 2025 |
| MAYFAIR GOLD CORP.
|
| |
| National Instrument 43-101 Technical Report—Mineral Resource Estimate Update Fenn–Gib Project, Ontario, Canada |
| 14.10 | Classification of Mineral Resources |
Mineral Resources were estimated in conformity with generally accepted CIM Estimation of Mineral Resources and Mineral Reserves Best Practice Guidelines (CIM, 2019). Mineral Resources are not Mineral Reserves and do not have demonstrated economic viability.
The Mineral Resource classification method followed a rigorous, multi-step approach. Initial classification was based on data density and mineralization continuity, followed by refinement using interpolation statistics and geological continuity assessment. To ensure classification coherence, a grooming algorithm was applied to address isolated blocks.
The nominal spacing for the Indicated Mineral Resource estimates, based on distance to nearest composite, was 32 m. For Inferred Mineral Resource estimates, the nominal spacing was 108 m, constrained within a maximum distance of 250 m. No Measured Mineral Resource was defined for the Fenn–Gib Project.
Table 14-7 summarizes interpolation characteristics stored in the special models.
| 14.11 | Reasonable Prospects of Economic Extraction |
The cut-off grade used for the Mineral Resource estimates is 0.3 g/t Au based on the assumptions outlined in Table 14-9. Mineral Resource estimates can be sensitive to the reporting cut-off grade used. To satisfy reasonable prospects for eventual economic extraction, a conceptual constraining resource pit shell was defined using a 50° pit slope based on the assumptions listed in Table 14-9.
Table 14-9: Pit Design Criteria
| Parameter |
Unit |
Assumption | ||||
| Gold Price |
US$/oz Au | 2,000 | ||||
| Exchange Rate |
C$:US$ | 0.77 | ||||
| Payable Metal |
% | 100.00 | ||||
| TC/RC/Transport |
C$/oz Au | 6.50 | ||||
| Net Gold Price |
C$/oz Au | 2,590 | ||||
| Net Gold Price |
C$/g | 83.30 | ||||
| OPEX Estimates |
||||||
| OP Mining Cost |
C$/t mined | 3.25 | ||||
| OP Ore Mining Cost |
C$/t ore mined |
3.25 | ||||
| Process Cost |
C$/t processed | 15.50 | ||||
| G&A |
C$/t processed | 2.00 | ||||
|
|
PAGE | 14-19 October 10, 2025 |
| MAYFAIR GOLD CORP.
|
| |
| National Instrument 43-101 Technical Report—Mineral Resource Estimate Update Fenn–Gib Project, Ontario, Canada |
| Recovery and Dilution |
||||||||
| External Mining Dilution |
% | 0 | ||||||
| Mining Recovery |
% | 100 | ||||||
| Process Recovery |
% | 94 | ||||||
| Other |
||||||||
| Pit Slope in Rock |
degrees | 50 | ||||||
| Cut-Off Grade (COG) |
||||||||
| Reporting COG |
g/t | 0.30 | ||||||
| Resource Class |
MII | |||||||
Source: Maunula (2024)
| Notes: |
G&A = general and administrative; OB = overburden; OP = open pit OPEX = operating expenditure; | |
| RC = refining costs; TC = treatment costs |
| 14.12 | Mineral Resource Statement |
The Fenn-Gib Project hosts Mineral Resources at a 0.3 g/t Au cut-off grade comprised of an Indicated Resource of 181.3 Mt grading 0.74 g/t Au for 4.3 million contained gold ounces plus an additional Inferred Resource of 8.9 Mt at 0.49 g/t Au containing 141,000 gold ounces. Table 14-10 presents the Mineral Resource estimate categorized by resource classification, effective date of September 3, 2024, and reported within a constraining resource pit shell.
Table 14-10: Fenn–Gib Project Mineral Resource Estimate
| Resource Category |
Cut-Off (Au g/t) |
Tonnes | Au (g/t) |
Au (oz) |
||||||||||||
| Indicated |
0.3 | 181,302,000 | 0.74 | 4,313,000 | ||||||||||||
| Inferred |
0.3 | 8,921,000 | 0.49 | 141,000 | ||||||||||||
Source: Maunula (2024)
Notes:
| • | Effective date of this updated mineral resource estimate is September 3, 2024. The assay cut-off date for drill holes included in the mineral resource was April 30, 2024. |
| • | All mineral resources have been estimated in accordance with the CIM Definitions Standards (CIM, 2014), as required under National Instrument (NI) 43-101. Mineral Resource statement prepared by Tim Maunula, P.Geo. (T. Maunula & Associates Consulting Inc.) in accordance with NI 43-101. |
| • | Mineral Resources reported demonstrate reasonable prospect of eventual economic extraction, as required under NI 43-101. Mineral Resources are not Mineral Reserves and do not have demonstrated economic viability. The Mineral Resources may be materially affected by environmental, permitting, legal, marketing, and other relevant issues. |
| • | Mineral Resources are reported at a cut-off grade of 0.30 g/t Au for an open-pit mining scenario using a 50° pit slope angle. Cut-off grades are based on a price of US$2,000/oz gold, and an open pit mining cost of $3.25/t, process cost of $15.50/t and G&A $2.00/t. Metallurgical recovery of 94% was used. Densities were assigned based on interpreted lithology. |
| • | Troy ounce = tonnes x grade / 31.10348. All numbers have been rounded to reflect the relative accuracy of the estimate. |
| • | The quantity and grade of reported Inferred Resources are uncertain in nature and there has not been sufficient work to define these Inferred Resources as Indicated or Measured Resources. It is reasonably expected that many of the Inferred Mineral Resources could be upgraded to Indicated Mineral Resources with continued exploration. |
| • | Tonnages and ounces in the tables are rounded to the nearest thousand. Numbers may not total due to rounding. |
|
|
PAGE | 14-20 October 10, 2025 |
| MAYFAIR GOLD CORP.
|
| |
| National Instrument 43-101 Technical Report—Mineral Resource Estimate Update Fenn–Gib Project, Ontario, Canada |
| 14.13 | Factors That May Affect the Mineral Resource Estimate |
Factors that may affect the Mineral Resource estimate include:
| • | Metal price and exchange rate assumptions |
| • | Changes to the assumptions used to generate the gold cut-off grade |
| • | Changes in local interpretations of mineralization geometry and continuity of mineralized zones |
| • | Changes to geological interpretation and geological and grade continuity assumptions |
| • | Density and domain assignments |
| • | Changes to geotechnical, mining, and metallurgical recovery assumptions |
| • | Change to the input and design parameter assumptions that pertain to the conceptual pit constraining the Mineral Resource estimate |
| • | Assumptions as to the continued ability to access the site, retain mineral and surface rights titles, maintain environment and other regulatory permits, and maintain the social license to operate. |
There are no other known environmental, legal, title, taxation, socio-economic, marketing, political, or other relevant factors that would materially affect the estimation of Mineral Resources that are not discussed in this Technical Report.
|
|
PAGE | 14-21 October 10, 2025 |
| MAYFAIR GOLD CORP.
|
| |
| National Instrument 43-101 Technical Report—Mineral Resource Estimate Update Fenn–Gib Project, Ontario, Canada |
| 15 | MINERAL RESERVE ESTIMATES |
There are no Mineral Reserves for the Project.
|
|
PAGE | 15-1 October 10, 2025 |
| MAYFAIR GOLD CORP.
|
| |
| National Instrument 43-101 Technical Report—Mineral Resource Estimate Update Fenn–Gib Project, Ontario, Canada |
| 16 | MINING METHODS |
This section is not applicable to this Technical Report.
|
|
PAGE | 16-1 October 10, 2025 |
| MAYFAIR GOLD CORP.
|
| |
| National Instrument 43-101 Technical Report—Mineral Resource Estimate Update Fenn–Gib Project, Ontario, Canada |
| 17 | RECOVERY METHODS |
This section is not applicable to this Technical Report.
|
|
PAGE | 17-1 October 10, 2025 |
| MAYFAIR GOLD CORP.
|
| |
| National Instrument 43-101 Technical Report—Mineral Resource Estimate Update Fenn–Gib Project, Ontario, Canada |
| 18 | PROJECT INFRASTRUCTURE |
This section is not applicable to this Technical Report.
|
|
PAGE | 18-1 October 10, 2025 |
| MAYFAIR GOLD CORP.
|
| |
| National Instrument 43-101 Technical Report—Mineral Resource Estimate Update Fenn–Gib Project, Ontario, Canada |
| 19 | MARKET STUDIES AND CONTRACTS |
This section is not applicable to this Technical Report.
|
|
PAGE | 19-1 October 10, 2025 |
| MAYFAIR GOLD CORP.
|
| |
| National Instrument 43-101 Technical Report—Mineral Resource Estimate Update Fenn–Gib Project, Ontario, Canada |
| 20 | ENVIRONMENTAL STUDIES, PERMITTING, AND COMMUNITY IMPACTS |
This section is not applicable to this Technical Report.
|
|
PAGE | 20-1 October 10, 2025 |
| MAYFAIR GOLD CORP.
|
| |
| National Instrument 43-101 Technical Report—Mineral Resource Estimate Update Fenn–Gib Project, Ontario, Canada |
| 21 | CAPITAL AND OPERATING COSTS |
This section is not applicable to this Technical Report.
|
|
PAGE | 21-1 October 10, 2025 |
| MAYFAIR GOLD CORP.
|
| |
| National Instrument 43-101 Technical Report—Mineral Resource Estimate Update Fenn–Gib Project, Ontario, Canada |
| 22 | ECONOMIC ANALYSIS |
This section is not applicable to this Technical Report.
|
|
PAGE | 22-1 October 10, 2025 |
| MAYFAIR GOLD CORP.
|
| |
| National Instrument 43-101 Technical Report—Mineral Resource Estimate Update Fenn–Gib Project, Ontario, Canada |
| 23 | ADJACENT PROPERTIES |
The Fenn–Gib property is surrounded by claims or leases held by other exploration companies. The most active of the neighbouring companies are STLLR Gold Inc. (formerly Moneta Gold Inc.) and Onyx Gold.
STLLR Gold’s combined Golden Highway and Garrison areas are collectively called the Tower Gold Project, which currently hosts an NI 43-101 Mineral Resource found primarily within sedimentary host rocks along the Destor–Porcupine fault corridor (Raponi et al., 2022). The Mineral Resource estimate combines nine deposits, which have been classified as structurally controlled orogenic gold deposits in an Archean greenstone belt setting.
InnovExplo, a member of Norda Stelo, updated the Tower Gold Project Mineral Resources with an effective date of May 2, 2025 (STLLR, 2025). The combined Mineral Resource estimate for all nine deposits includes:
| • | A total of 3,656,400 oz of gold in open pit Indicated Mineral Resources contained within 135,230 Kt at 0.84 g/t Au, and 4,133,600 oz of open pit Inferred Mineral Resources contained within 157,837 Kt at 0.81 g/t Au, at a cut-off grade of 0.30 g/t Au. |
| • | 345,800 oz of underground Indicated Mineral Resources contained within 5,194 Kt at 2.07 g/t Au, and 2,827,100 oz of underground Inferred Mineral Resources within 42,456 Kt at 2.07 g/t Au, using variable cut-off grades based on mining method, ranging from 1.3 to 2.09 g/t Au. |
The QP was not able to independently verify the information STLLR Gold (2025) provided. The mineralization for the Tower Gold Project is not necessarily indicative of the mineralization present at the Fenn–Gib property.
Onyx Gold is an exploration-stage company that is exploring the Munro-Croesus Gold Project is located approximately 75 km east of Timmins, Ontario along Highway 101. Their land package includes the past-producing Croesus Mine, which yielded some of the highest-grade gold ever mined in Ontario. The geology is proximal to the Porcupine-Destor Deformation Fault Zone and Pipestone Fault and located approximately 3 km northwest and along trend of the Fenn-Gib gold deposit. The mineralization for the Munro-Croesus Gold Project is not necessarily indicative of the mineralization present at the Fenn–Gib property.
|
|
PAGE | 23-1 October 10, 2025 |
| MAYFAIR GOLD CORP.
|
| |
| National Instrument 43-101 Technical Report—Mineral Resource Estimate Update Fenn–Gib Project, Ontario, Canada |
| 24 | OTHER RELEVANT DATA AND INFORMATION |
To the best of the QPs’ knowledge there are no other relevant data, additional information, or explanations necessary to make this Technical Report understandable and not misleading.
|
|
PAGE | 24-1 October 10, 2025 |
| MAYFAIR GOLD CORP.
|
| |
| National Instrument 43-101 Technical Report—Mineral Resource Estimate Update Fenn–Gib Project, Ontario, Canada |
| 25 | INTERPRETATIONS AND CONCLUSIONS |
| 25.1 | Interpretations |
Table 25-1 presents the Mineral Resource estimate reported within a constraining resource pit shell and categorized by resource classification. The Mineral resource estimate has an effective date of September 3, 2024, and was prepared by TMAC.
Table 25-1: Fenn–Gib Project Mineral Resource Estimate
| Resource Category |
Cut-Off (Au g/t) |
Tonnes | Au (g/t) |
Au (oz) |
||||||||||||
| Indicated |
0.3 | 181,302,000 | 0.74 | 4,313,000 | ||||||||||||
| Inferred |
0.3 | 8,921,000 | 0.49 | 141,000 | ||||||||||||
Source: Maunula (2024)
Notes:
| • | Effective date of this updated mineral resource estimate is September 3, 2024. The assay cut-off date for drill holes included in the mineral resource was April 30, 2024. |
| • | All mineral resources have been estimated in accordance with the CIM Definitions Standards, as required under NI 43-101. Mineral Resource Statement prepared by Tim Maunula, P.Geo. (T. Maunula & Associates Consulting Inc.) in accordance with NI 43-101. |
| • | Mineral Resources reported demonstrate reasonable prospect of eventual economic extraction, as required under NI 43-101. Mineral Resources are not Mineral Reserves and do not have demonstrated economic viability. The Mineral Resources may be materially affected by environmental, permitting, legal, marketing, and other relevant issues. |
| • | Mineral Resources are reported at a cut-off grade of 0.30 g/t Au for an open-pit mining scenario using a 50° pit slope angle. Cut-off grades are based on a price of US$2,000/oz gold, and an open pit mining cost of $3.25/t, process cost of $15.50/t and G&A $2.00/t. Metallurgical recovery of 94% was used. Densities were assigned based on interpreted lithology. |
| • | Troy ounce = tonnes x grade / 31.10348. All numbers have been rounded to reflect the relative accuracy of the estimate. |
| • | The quantity and grade of reported Inferred Resources are uncertain in nature and there has not been sufficient work to define these Inferred Resources as Indicated or Measured Resources. It is reasonably expected that many of the Inferred Mineral Resources could be upgraded to Indicated Mineral Resources with continued exploration. |
| • | Tonnages and ounces in the tables are rounded to the nearest thousand. Numbers may not total due to rounding. |
The Fenn-Gib Project demonstrates amenability to open pit extraction methods, with a single commodity focus on gold recovery.
| 25.2 | Factors That May Affect the Mineral Resource Estimate |
Factors that may affect the Mineral Resource estimate include:
| • | Metal price and exchange rate assumptions |
| • | Changes to the assumptions used to generate the gold grade cut-off |
| • | Changes in local interpretations of mineralization geometry and continuity of mineralized zones |
| • | Changes to geological and mineralization shape and geological and grade continuity assumptions |
|
|
PAGE | 25-1 October 10, 2025 |
| MAYFAIR GOLD CORP.
|
| |
| National Instrument 43-101 Technical Report—Mineral Resource Estimate Update Fenn–Gib Project, Ontario, Canada |
| • | Density and domain assignments |
| • | Changes to geotechnical, mining, and metallurgical recovery assumptions |
| • | Changes to the input and design parameter assumptions that pertain to the conceptual pit and stope designs constraining the estimates |
| • | Assumptions as to the continued ability to access the site, retain mineral and surface rights titles, maintain environmental, and other regulatory permits, and maintain the social license to operate. |
There are no other known environmental, legal, title, taxation, socioeconomic, marketing, political or other relevant factors that would materially affect the estimation of Mineral Resources that are not discussed in this Technical Report.
| 25.3 | Conclusions |
The Fenn–Gib Project is an advanced-stage exploration project that hosts substantial gold mineralization. The current Mineral Resource estimate demonstrates a robust deposit containing 4.3 million ounces of gold in the Indicated classification category. TMAC concludes that the opportunity exists to expand the mineral resource for the Fenn–Gib Deposit, including the Footwall Zone as the mineralized zones remain open at depth and along strike to both the east and west. Additionally, further diamond drilling at the Fenn–Gib Deposit has strong potential to upgrade the present Inferred Mineral Resources to Indicated Mineral Resources, potentially adding to the project’s resource base.
|
|
PAGE | 25-2 October 10, 2025 |
| MAYFAIR GOLD CORP.
|
| |
| National Instrument 43-101 Technical Report—Mineral Resource Estimate Update Fenn–Gib Project, Ontario, Canada |
| 26 | RECOMMENDATIONS |
The Fenn–Gib Project represents an advanced-stage-of-exploration project with a substantial gold resource base of over 4.3 million ounces of gold in the Indicated classification category. Based on the positive results to date, TMAC recommends advancing the project through targeted work programs designed to both grow and expand the current Mineral Resource and evaluate the economic potential of both the Fenn–Gib Project and the broader property area.
The next phases of work are recommended to evaluate the economic potential of the Fenn–Gib Project are:
| • | Environmental studies and the continued collection of baseline environmental data to support the pre-development of the Project |
| • | Process engineering and site infrastructure design work to support a pre-feasibility study for the development of a 4,800 t/d operation. |
A summary of the proposed work program, including a budget estimate, is given in Table 26-1.
Table 26-1: Recommended Work Programs and Cost Estimate
| Activity |
Description |
Estimate Cost ($) |
||||
| Phase 1—Environmental Studies |
| |||||
| Environmental studies including baseline data collection |
Advance work and studies to understand the site study area environmental baseline conditions to support a 4,800 t/d operation | 4,000,000 | ||||
|
|
|
|||||
| Phase 1 Total |
4,000,000 | |||||
|
|
|
|||||
| Phase 2—Engineering and Design Work |
| |||||
| Engineering and design to advance an economic evaluation of the Project |
Advance the Project designs and engineering to complete a pre-feasibility study to define a 4,800 t/d operation | 6,000,000 | ||||
|
|
|
|||||
| Phase 2 Total |
6,000,000 | |||||
|
|
|
|||||
| Phases 1 and 2 Total |
10,000,000 | |||||
|
|
|
|||||
| 10.0% Contingency |
1,000,000 | |||||
|
|
|
|||||
| Grand Total |
11,000,000 | |||||
|
|
|
|||||
TMAC also recommends additional infill drilling to upgrade the Inferred Mineral Resources to Indicated Mineral Resources. This program may also allow for the upgrade to Measured Mineral Resources. The mineralized zones encountered at the Fenn–Gib Deposit remain open at depth and along strike east and west, additional targeted expansion drilling is therefore warranted.
A Pre-Feasibility study is currently underway to evaluate the economic potential of developing a 4,800 t/d operation, with completion expected in Q4 2025. Future drilling programs will be planned strategically to further expand and upgrade the resource base.
|
|
PAGE | 26-1 October 10, 2025 |
| MAYFAIR GOLD CORP.
|
| |
| National Instrument 43-101 Technical Report—Mineral Resource Estimate Update Fenn–Gib Project, Ontario, Canada |
| 27 | REFERENCES |
Aurora Geosciences Ltd. (2023). Fenn–Gib North Block Soil Sampling MMI Results, Au ppb. SGS Laboratories, Burnaby, B.C.
Bath, A. C. (1990). Mineral occurrences, deposits, and mines of the Black River-Matheson area. Open File Report 5735. Ontario Geological Survey.
Berger, B. (2002). Geological Synthesis of the Highway 101 Area, East of Matheson, Ontario. Open File Report 6091, 149 p.6. Ontario Geological Survey
Berger, B., & Amelin, Y. (1998). Project Unit 97-024. Geological investigations along Highway 101; Guibord, Michaud and Garrison townships. In J. A. Ayer, C. L. Baker, J. C. Ireland, R. I. Kelly, & P. C. Thurston (Eds.), Summary of field work and other activities 1998 (Miscellaneous Paper 169, pp. 25–32). Ontario Geological Survey.
Brace, T., Campbell, I., Koch, R., & Mancini, L. (2017, October 17). 2017 Summary Report on 2017 Work Activities Fenn–Gib Project. MPH Consulting Ltd.
Brown, J., & Sutherland, D. (2022, December 1). Mayfair Gold Corp. Fenn–Gib SGH Surveys. Activation Laboratories Ltd.
Brown, P. (2001, June). Report on Geological Potential, Fenn–Gib property. Pangea Goldfields Inc.
Brown, P. (2002). Fenn Gib Drilling Report. March/April 2002. Assessment report. Pangea Goldfields Inc.
CIM Standing Committee on Reserve Definitions. (2014). CIM Definition Standards for Mineral Resources and Mineral Reserves. Canadian Institute of Mining, Metallurgy and Petroleum.
Crary, T., & Jackman, R. (2015). An Investigation into Gold Recovery from the Fenn–Gib Deposit. SGS Lakefield Inc.
Cregheur, P. (1996, August). In House Prefeasibility Study, Fenn–Gib Project. Pangea Goldfield Inc.
Daezali, A., Dietrich, J., Elfen, S., & Meintjes, T. (2020, May 28). Pan American Silver Fenn–Gib Due Diligence. Ausenco on behalf of Henney Capital.
Dagbert, M., & Desharnais, G. (2011, November 17). Fenn–Gib Resource Estimate Technical Report, Timmins Ontario. SGS Lakefield Inc.
Dubé, B., & Mercier-Langevin, P. (2020). Gold Deposits of the Archean Abitibi Greenstone Belt, Canada. In R. H. Sillitoe, R. J. Goldfarb, F. Robert, & S. F. Simmons (Eds.), Geology of the World’s Major Gold Deposits and Provinces (pp. 669-708). Society of Economic Geologists.
|
|
PAGE | 27-1 October 10, 2025 |
| MAYFAIR GOLD CORP.
|
| |
| National Instrument 43-101 Technical Report—Mineral Resource Estimate Update Fenn–Gib Project, Ontario, Canada |
Dyck, D., & Sparling, J. (1997, April). Environmental studies Report Barton Creek and Little Pike River Watersheds. Agra Earth & Environmental Ltd.
G Mining Services Inc. (2025, June). Preliminary Economic Assessment NI 43-101 Technical Report, Tower Gold Project, Ontario, Canada. Prepared for STLLR Gold Inc.
Hennessey, B., & Gowans, R. (2019, February). A Mineral Resource Estimate for the Golden Highway Project, Michaud and Garrison Townships, Black River–Matheson Area, Northeastern Ontario. Micon International Limited prepared for Moneta Porcupine Mines Inc.
Hobbs, L. G. (1986, February). A Report on the 1978 Exploration project on the Wood–Croesus gold mines property. Wood-Croesus Gold Mines.
Jelenic, A. (2023). Fenn–Gib Project 2022-2023 Geophysics—North Block IP Surveys Field Report. Aurora Geosciences Ltd.
Kirkham, G., Makarenko, M., & Crowie, T. (2021, February). NI 43-101 Technical Report Fenn–Gib Project, Ontario, Canada. JDS Energy & Mining Inc. Prepared for Mayfair Gold Corp.
Live, P. (2005, January). Fenn–Gib Gold Project Open Pit Economics Evaluation Briefing Report (Report Nº 5686001-001). Breton, Blainville & Associates.
Mancini, L., & Conquer, S. (2012, May). Summary of Work Report for the Diamond Drill Program on the Fenn–Gib property, Guibord Township. Lake Shore Gold Corp.
Mancini, L. (2014, June). Spring 2014 Assessment Report for Fenn–Gib property Claims 4272132 and 4258968. Lake Shore Gold Corp.
Mancini, L. (2018, October). Diamond Drilling on the Fenn–Gib property 2017. Prepared for the Ministry of Northern Development and Mines Ladner Lake Mining Division, Northeastern Ontario. Lake Shore Gold Corp.
Marchand, K. (1996, August). Summary of Exploration work 1993 to 1996, Fenn–Gib property, Munro and Guibord Townships. Pangea Goldfields Inc.
Maunula, T. (2023, July). Mayfair Gold National Instrument 43-101 Technical Report, Fenn–Gib Project, Ontario, Canada. Prepared by T. Maunula & Associates Consulting Inc.
Mayfair Gold Corp. (2021, February). Fenn–Gib Core Logging Procedures. Internal document.
Mayfair Gold Corp. (2022, May). Fenn–Gib QAQC Protocol. Internal document.
Mayfair Gold Corp. (2022, October 18). Mayfair Gold Increases Fenn–Gib Open Pit Indicated Resource by 47% to 3.06 M Ounces and Inferred Resource by 315% to 0.31 M Ounces [Press release]. https://financialpost.com/globe-newswire/mayfair-gold-increases-fenn-gib-open-pit-indicated-resource-by-47-to-3-06m-ounces-and-inferred- resource-by-315-to-0-31m-ounces
|
|
PAGE | 27-2 October 10, 2025 |
| MAYFAIR GOLD CORP.
|
| |
| National Instrument 43-101 Technical Report—Mineral Resource Estimate Update Fenn–Gib Project, Ontario, Canada |
Mayfair Gold Corp. (2023, July). Fenn–Gib Drillhole Related Protocols. Internal document.
McElhanney Ltd. (2022, October). Fenn–Gib LiDAR and Orthophoto.
MPH Consulting Limited. (1994, June). Assessment Report on the Fenn and Gib Projects, Guibord and Munro Townships, Larder Lake Mining Division, Ontario for Pangea Goldfields Inc. Volume VII. Prepared for Pangea Goldfields Inc.
Munro, S. (2021, April 28). Heli-GT Three-Axis Magnetometer Gradiometer Survey, Fenn–Gib Project, Matheson, Ontario. SHA Geophysics Ltd.
Poehlman, T. (2024): Mayfair Gold Land Report, 23 April 2024. Report Generated on Mining Lands Administration System by In Good Standing Corporation.
Province of Ontario. (1990). Mining Act. R.S.O. 1990, Chapter M.14. June 5, 2025, Version. https://www.ontario.ca/laws/statute/90m14.
Raponi, T. R., Elfen, S., Weston, S, Hasanloo, D., Dufresne, M., Lill, J., & Farmer, N. (2022, September 7). NI 43-101 Report & Preliminary Economic Assessment of the Tower Gold Project, Northeastern Ontario. Prepared by Ausenco Engineering Canada Inc. for Moneta Gold Inc. https://minedocs.com/23/Moneta_Gold_Tower_Gold_Project_PEA_09072022.pdf
Rennick, M. W. (2004, May). Report on the Tandem Resources Ltd., Highway 101 Property, Guibord Township, District of Cochrane, Larder Lake Mining District.
Robert, F., & Poulsen, K. H. (1997). World-class Archean gold deposits in Canada: an overview. Australian Journal of Earth Sciences, 44, 329–351.
Rollwagen, D. W., Salter, R. S., & Furey, J. T. (1989). Investigation of the Recovery of Gold from Fenn Project Samples. Submitted to Corona Corporation. Lakefield Research Inc.
Satterly, J. (1951). Geology of Munro Township. Sixtieth Annual Report of the Ontario Department of Mines [Volume LX, Part VII], p. 45. Legislative Assembly of Ontario.
Scobie, B. J. (1995). An Investigation of the Recovery of Gold from Fenn–Gib Bulk Samples. Progress Report No. 2. L.R. 4758. Submitted by Pangea Goldfields Inc. Lakefield Research Inc.
Scobie, B. J. (1996). An Investigation of the Recovery of Gold from Fenn–Gib Bulk Samples. Progress Report No. 3. L.R. 4758. Submitted by Pangea Goldfields Inc. Lakefield Research Inc.
Scobie, B. J. (1997). An Investigation of the Recovery of Gold from Fenn–Gib Bulk Samples. Progress Report No. 4. L.R. 4758. Submitted by Pangea Goldfields Inc. Lakefield Research Inc.
SGS Canada Inc. (2014, August). Gold Recovery from the Fenn–Gib Deposit. Project 13640-01. Prepared by SGS-Lakefield for Lake Shore Gold Corp.
|
|
PAGE | 27-3 October 10, 2025 |
| MAYFAIR GOLD CORP.
|
| |
| National Instrument 43-101 Technical Report—Mineral Resource Estimate Update Fenn–Gib Project, Ontario, Canada |
SGS Canada Inc. (2015, January). Gold Recovery from the Fenn–Gib Deposit. Project 13640-01. Prepared by SGS-Lakefield for Lake Shore Gold Corp.
SGS Canada Inc. (2017, December). Gold Recovery for Fenn–Gib Deposit Samples. Project 16116-01. Prepared by SGS-Lakefield for Lake Shore Gold Corp.
SGS Canada Inc. (2018, July). Gold Recovery for Fenn–Gib Deposit Samples. Project 16116-01. Prepared by SGS-Lakefield for Lake Shore Gold Corp.
SGS Canada Inc. (2022, August). The Recovery of Gold from Fenn–Gib Project Samples. Project 18831-01. Prepared by SGS-Lakefield for Lake Shore Gold Corp.
SGS Canada Inc. (2023, March). Recovery of Gold from a Fenn–Gib Project Sample. Project 18831-02. Prepared by SGS-Lakefield for Lake Shore Gold Corp.
Sparling, J. (1997, May). Geotechnical investigation North of Highway 101. Prepared by Agra Earth & Environmental Ltd.
Stalker, M. (2003, September). Report of Work Geological Survey Wood–Croesus Property. Prepared by Croesus Gold Inc.
STLLR Gold Inc. (2025). STLLR Gold Delivers Updated Mineral Resource Estimate and PEA Demonstrating US$1.0 Billion After-Tax NPV5% for the Large-Scale Tower Gold Project in Ontario, Canada. May 15, 2025 [Press release]. https://stllrgold.com/news/stllr-gold-delivers-updated-mineral-resource-estimate-and-pea-demonstrating-us-1-0-billion-after-tax-npv5-for-the-large- scale-tower-gold-project-in-ontario-canada
|
|
PAGE | 27-4 October 10, 2025 |
| MAYFAIR GOLD CORP.
|
| |
| National Instrument 43-101 Technical Report—Mineral Resource Estimate Update Fenn–Gib Project, Ontario, Canada |
| 28 | CERTIFICATE OF AUTHORS |
| 28.1 | Tim Maunula, P.Geo. |
I, Tim Maunula, P.Geo., of Chatham, Ontario, a QP of this Technical Report titled National Instrument43-101 Technical Report—Mineral Resource Estimate Update, Fenn–Gib Project, Ontario, Canada, dated October 10, 2025, do hereby certify that:
| • | I am Principal Geologist of T. Maunula & Associates Consulting Inc., 15 Valencia Drive, Chatham, Ontario, N7L 0A9, Canada. |
| • | I am a graduate of Lakehead University with an Honours Bachelor of Science in Geology (1979). In addition, I graduated from the Citation in Applied Geostatistics at the University of Alberta in 2004. |
| • | I am a member in good standing of the Association of Professional Geoscientists of Ontario (Registration Number 1115). |
| • | I have worked as a Geologist for over 40 years since my graduation from university. This experience comprised 15 years in exploration (including airborne and ground geophysical surveys and data processing) and over 25 years in Mineral Resource estimation and associated activities. |
| • | I have read the definition of Qualified Person set out in NI 43-101 and certify that by reason of education, affiliation with a professional association, and past relevant work experience, I fulfill the requirements to be a Qualified Person for NI 43-101. |
| • | I am responsible for Sections 3, 4, 5, 6, 7, 8, 9, 10, 11, 12, 14 to 16, 18 to 24, and portions of Sections 1, 2, 25, 26, and 27. |
| • | I completed a site visit on April 15–17, 2024. |
| • | I have no prior involvement with property that is the subject of this Technical Report. |
| • | I am independent of the Issuer, applying all of the tests in Section 1.5 of the Instrument. |
| • | I have read NI 43-101 and Form 43-101F1, and this Technical Report has been prepared in compliance with that instrument and form. |
| • | As of the effective date of this Technical Report, to the best of my knowledge, information, and belief, the portions of this Technical Report for which I am responsible contain all scientific and technical information required to be disclosed to make this Technical Report not misleading. |
Dated this 10th day of October 2025 in Chatham, Ontario.
| Original Signed and Sealed |
| Tim Maunula, P.Geo. |
|
|
PAGE | 28-1 October 10, 2025 |
| MAYFAIR GOLD CORP.
|
| |
| National Instrument 43-101 Technical Report—Mineral Resource Estimate Update Fenn–Gib Project, Ontario, Canada |
| 28.2 | Steven C. Haggarty, P.Eng. |
I, Steven C. Haggarty, P.Eng., of Burlington, Ontario, a QP of this Technical Report titled National Instrument 43-101 Technical Report—Mineral Resource Estimate Update, Fenn–Gib Project, Ontario, Canada, dated October 10, 2025, do hereby certify that:
| • | I am the Managing Director of Haggarty Technical Services Corporation, 2083 Country Club Drive, Burlington, Ontario, L7M 3V3, Canada. |
| • | I am a graduate of McGill University with a Bachelor’s degree in Metallurgical Engineering (1980). |
| • | I am a member in good standing of the Professional Engineers of Ontario (PEO #100177647) and am a member of the Ontario Society of Professional Engineers. |
| • | I have worked as a metallurgical engineer in the mining industry for over 40 years since graduation. This experience includes 28 years in direct site management as General Manager, Process Manager, Mine Superintendent, and Metallurgist, with an additional 10 years at a corporate Senior Director level supporting operating sites globally. Experience includes direct involvement in multiple feasibility studies associated with seven greenfield EPCM projects through project definition, engineering, construction, and start-up as part of the Owner’s team. |
| • | I have read the definition of Qualified Person set out in NI 43-101 and certify that by reason of education, affiliation with a professional association, and past relevant work experience, I fulfill the requirements to be a Qualified Person for NI 43101. |
| • | I am responsible for Section 13 and 17 and portions of Sections 1, 2, and 25 to 27. |
| • | I have not yet had the opportunity to visit the property. |
| • | I have no prior involvement with the property that is the subject of this Technical Report. |
| • | I am independent of the Issuer, applying all of the tests in Section 1.5 of the Instrument. |
| • | I have read NI 43-101 and Form 43-101F1, and this Technical Report has been prepared in compliance with that instrument and form. |
| • | As of the effective date of this Technical Report, to the best of my knowledge, information, and belief, the portions of this Technical Report for which I am responsible contain all scientific and technical information required to be disclosed to make this Technical Report not misleading. |
Dated this 10th day of October 2025 in Burlington, Ontario.
| Original Signed and Sealed |
| Steven C. Haggarty, P.Eng. |
|
|
PAGE | 28-2 October 10, 2025 |