Exhibit 99.53

FORM 51-102F3

MATERIAL CHANGE REPORT


ITEM 1

NAME AND ADDRESS

Mayfair Gold Corp. (the “Company” or “Mayfair”)

489 McDougall Street

Matheson, Ontario, P0K 1N0


ITEM 2

DATE OF MATERIAL CHANGE

January 8, 2026


ITEM 3

NEWS RELEASE

The Company issued a news release on January 8, 2026 relating to the material change, which was disseminated through newswire distribution and subsequently filed on SEDAR+ at www.sedarplus.ca.


ITEM 4

SUMMARY OF MATERIAL CHANGE

On January 8, 2026, the Company announced a Pre-Feasibility Study (the “PFS”) and a maiden Mineral Reserve estimate for the Company’s Fenn-Gib gold project in the Timmins Gold District of Ontario, Canada (the “Project”).


ITEM 5

FULL DESCRIPTION OF MATERIAL CHANGE


5.1

Full Description of Material Change

On January 8, 2026, the Company announced the PFS and a maiden Mineral Reserve estimate for the Project, both with an effective date of December 19, 2025; the Mineral Resource estimate has an effective date of September 3, 2024.

Fenn-Gib PFS Highlights and Mayfair’s Strategic Approach to Fenn-Gib Development

The PFS outlines Mayfair’s strategy to reduce execution risk and prioritizing high-margin material early in the mine plan, supported by a realistic and financeable initial capital outlay. This approach enables rapid value generation from Fenn-Gib while preserving long-term flexibility to deploy free cash flow toward regional growth opportunities or advancing secondary assets to diversify and expand production.

Economic results are presented on an unlevered basis to highlight the strong standalone project returns. Mayfair intends to prudently utilize project-level debt and other financing options to minimize overall cost of capital and maximize per-share economic returns.

Initial capital expenditures are estimated at $450 million, including a 26% contingency on direct costs. The PFS considers a conventional open-pit mining operation and incorporates modular processing plant designs, allowing for a simplified construction schedule of less than 24 months, reducing inflationary and execution risks.


The Project will proceed under the Provincial Class Environmental Assessment (“EA”) process and does not trigger a Comprehensive EA or federal Impact Assessment (“IA”) under current regulations.

Social and community engagement has focused primarily on the Apitipi Anicinapek Nation (“AAN”) due to its proximity to the Fenn-Gib site. The Company and AAN have an active Exploration Agreement in place and will continue to advance consultation collaboratively, with the intention of developing a Community Benefit Agreement for the Project.

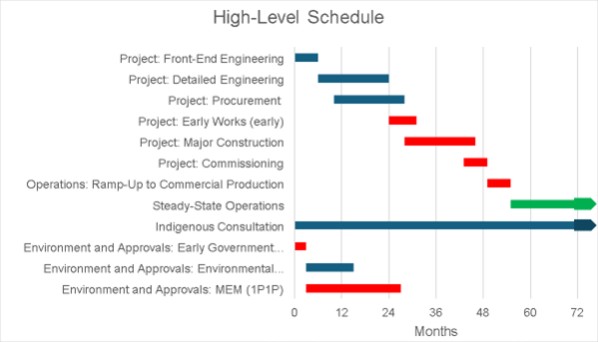
The Project plans to advance three key strategies in parallel: Ontario-led environmental approvals, Indigenous agreements, and engineering-design-procurement. These initiatives aim to enable major construction within 24–36 months, with commercial operations targeted within five years.

The 2026 PFS assumes an average annual gold production of 71.3 koz over the first 6-years of operation and a total life of mine (“LOM”) production of 920 koz over 14.3 years of operation. All amounts are in Canadian dollars unless otherwise noted.

Table 1: Fenn-Gib - Economic Model PFS Highlights


Description


Unit

   Base Case      Spot Price  

General Assumptions


Mine Life

   yrs      14.3  

Gold Price

   US$/oz      $3,100        $4,450  

Exchange Rate

   C$/US$      1.350        1.376  

Canadian Dollar Gold Price

   $/oz      $4,185        $6,123  

Daily Throughput

   t/d      4,800  

Annual Throughput

   k t/a      1,750  

Years 1-6


Strip Ratio

   w:o      7.7  

Average Gold Grade

   g/t      1.47  

Average Gold Recovery

   %      88.7  

Average Annual Gold Production

   k ozs Au      71.3  

All-in Sustaining Cost (AISC)

   US$/oz      1,171        1,173  

Average Annual Free Cash Flow (FCF)1

   $ M      $149        $239  

Cumulative FCF

   $ M      $896        $1,432  


- 2 -


Life of Mine


Strip Ratio

   w:o      6.0  

Average Gold Grade

   g/t      1.29  

Average Gold Recovery

   %      88.3  

Average Annual Gold Production

   k ozs Au      64.1  

AISC

   US$/oz      $1,292        $1,291  

Average Annual FCF

   $ M      $114        $192  

Cumulative FCF

   $ M      $1,707        $2,880  

Initial Capital Costs

   $ M      $450  

Sustaining Capital Costs

   $ M      $61  

Closure Costs

   $ M      $49  

Payback Period (after tax)

   Years      2.7        1.7  

NPV (5%) (after-tax)

   $ M      $652        $1,373  

IRR (after tax)

   %      24.1        38.0  

Note:

Assumes site royalty as per agreements with no buy-back; key consumables of $1.13/l diesel and $0.11/kWh electricity

1 FCF is modeled post-initial capital and excluding closure

Source: Mayfair, 2025

The base case economics have been calculated on an unlevered basis, based on a gold price of US$3,100 and flat exchange rate of C$1.35 per US$ 1. The economics include an effective royalty rate averaging 1.7%, based on all current royalties and encumbrances associated with the reserve at Fenn-Gib.

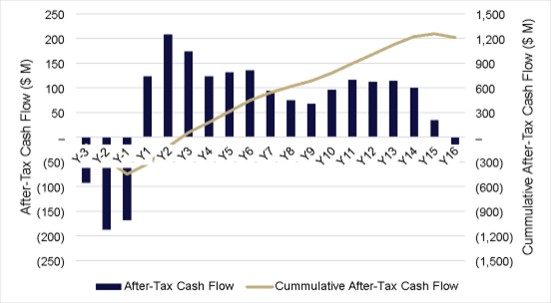
Free cash flow (“FCF”) after working capital changes is expected to amount to $896M in the first six years of operation. Using a spot gold price of US$4,450/oz (equivalent to $6,123/oz at 1.376 C$/US$ rate) FCF for the first six years of operation is expected to be $1.43 B.


- 3 -


Figure 1: After-Tax Cash Flow (FCF)


LOGO

The mine plan and associated economics reflect total gold processing of 1.04 Moz with 88.3% recovery. This represents only 24% of the September 3, 2024 Indicated Mineral Resource estimate of 4.3 Moz.

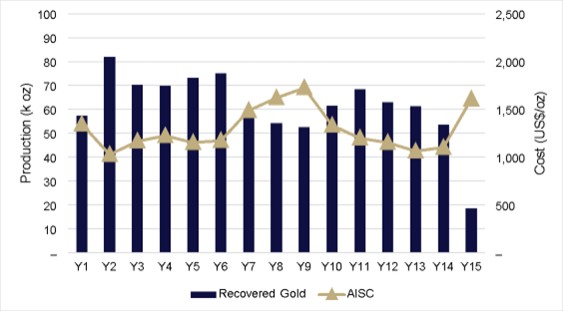
Figure 2: Annual gold production and AISC


LOGO

The tables below highlight NPV, IRR and payback sensitivity to operating expenses, capital expenditures, foreign exchange rates and the gold price. On average, every US$100 change in the gold price assumption results in an approximate $50M change in NPV.


- 4 -


Table 2: Sensitivity Analysis


After-Tax Results

   OPEX Sensitivity  
   -30%     -15%     0%     15%     30%  

NPV 5% (M$)

     826       739       652       564       476  

IRR (%)

     27.7 %      25.9 %      24.1 %      22.1 %      20.0 % 

Payback (yrs)

     2.4       2.5       2.7       2.9       3.2  

After-Tax Results

   CAPEX Sensitivity  
   -30%     -15%     0%     15%     30%  

NPV 5% (M$)

     773       713       652       591       530  

IRR (%)

     34.2 %      28.4 %      24.1 %      20.7 %      17.8 % 

Payback (yrs)

     1.9       2.3       2.7       3.1       3.6  

After-Tax Results

   FX Sensitivity  
   1.25     1.30     1.35     1.40     1.45  

NPV 5% (M$)

     536       594       652       710       767  

IRR (%)

     21.4 %      22.7 %      24.1 %      25.4 %      26.6 % 

Payback (yrs)

     3.0       2.8       2.7       2.6       2.5  


After-Tax Results

   Gold Price Sensitivity (US$/oz)  
   1,600      2,100     2,600     3,100     3,600     4,100     4,600  

NPV 5% (M $)

     -141        144       399       652       903       1,155       1,405  

IRR (%)

     N/A        10.3 %      17.9 %      24.1 %      29.4 %      34.3 %      38.6 % 

Payback (yrs)

     N/A        5.2       3.5       2.7       2.2       1.9       1.7  

Mineral Resource Estimate

Table 3: Fenn-Gib Mineral Resource Table


Resource Category

   Cut-Off
(Au g/t)
     Tonnes
(Mt)
     Gold Grade
(g/t)
     Contained Gold
(M oz)
 

Indicated

     0.3        181.3        0.74        4.3  

Inferred

     0.3        8.9        0.49        0.1  


- 5 -


Notes:


  1.

Effective date of this updated mineral resource estimate is September 3, 2024. The assay cut-off date for drill holes included in the mineral resource was April 30, 2024.

  2.

All mineral resources have been estimated in accordance with the CIM Definitions Standards, as required under National Instrument (NI) 43-101. Mineral Resource Statement prepared by Tim Maunula, P.Geo. (TMAC) in accordance with NI 43-101.

  3.

Mineral Resources reported demonstrate reasonable prospect of eventual economic extraction, as required under NI 43-101. Mineral Resources are not Mineral Reserves and do not have demonstrated economic viability. The Mineral Resources may be materially affected by environmental, permitting, legal, marketing, and other relevant issues.

  4.

Mineral Resources are reported at a cut-off grade of 0.30 g/t Au for an open-pit mining scenario using a 50° pit slope angle. Cut-off grades are based on a price of US$2,000/oz gold, and an open pit mining cost of $3.25/t, process cost of $15.50/t and G&A $2.00/t. Metallurgical recovery of 94% was used. Densities were assigned based on interpreted lithology.

  5.

Troy ounce = tonnes x grade / 31.10348. All numbers have been rounded to reflect the relative accuracy of the estimate.

  6.

The quantity and grade of reported Inferred Resources are uncertain in nature and there has not been sufficient work to define these Inferred Resources as Indicated or Measured Resources. It is reasonably expected that many of the Inferred Mineral Resources could be upgraded to Indicated Mineral Resources with continued exploration.

  7.

Tonnages and ounces in the tables are rounded to the nearest thousand. Numbers may not total due to rounding.

Source: TMAC, 2025


- 6 -


Maiden Mineral Reserve Estimate

The Fenn-Gib Mineral Reserves estimate is based on a design metal price of US$1,750/oz gold and is approximately 25.1 Mt of ore with a gold grade of 1.29 g/t for a contained 1.04 Moz of gold.

Table 4: Fenn-Gib Mineral Reserve Estimate


Reserve Class

   Process Feed
(Mt)
     Gold Grade
(g/t)
     Contained Gold
(M oz)
 

Proven

     —         —         —   

Probable

     25.13        1.29        1.04  

Total Reserves

     25.13        1.29        1.04  

Notes:


  1.

This mineral reserve estimate has an effective date of December 19, 2025.

  2.

The Mineral Reserve estimation was completed under the supervision of Gordon Zurowski, P.Eng. of AGP Mining Consultants Inc., who is a Qualified Person as defined under NI 43-101.

  3.

Mineral Reserves are stated within the ultimate design pit based on:


  a.

US$1750/oz gold price.


  b.

Pit Limit corresponds to a pit shell with a revenue factor of 0.55, corresponding to a price of US$962/oz Au.


  c.

An elevated cut-off grade of 0.80 g/t Au for all pit phases.


  d.

Preliminary mining cost assumptions of $3.24/t mined of waste, $3.23/t mined of ore, with an incremental mining cost of $0.02/t/5m bench mined below the 5310m elevation.


  e.

Preliminary processing cost assumptions of $14.50/t processed, general & administration assumption of $2.10/t processed, and stockpile rehandle cost assumption of $1.00/t processed.


  f.

Preliminary process recovery assumptions of 92.6% for gold.


  g.

An exchange rate of C$1.35 equal to US$1.00.


  h.

The preliminary economic, cost and recovery assumptions used at the time of mine planning and reserve estimation may not necessarily conform to those stated in the economic model.


  4.

Pit slope inter-ramp slope angle assumptions ranged from 49 - 65° and overall slope angles ranging from 40 - 51° in rock.

Source: AGP, 2025


- 7 -


Fenn-Gib Capital and Operating Cost Estimates

The initial capital cost (Capex) is estimated at $450 million including $66 million of contingency representing approximately 26% of the direct costs. The main construction period, excluding early works is estimated at 18 to 24 months.

Sustaining Capital includes mining fleet additions and replacement, highway relocation and future TSF dam raises and associated construction. No provision has been made for potential plant expansion capital.

Table 5: Capital Costs


WBS Description

   Initial Capital
($M)
   Sustaining Capital
($M)
   Total Capital
($M)

Mining

   31.4    24.4    55.8

Crushing

   21.6    1.1    22.7

Process Plant

   114.7    1.4    116.1

On-Site Infrastructure

   72.4    14.6    87.0

Off-Site Infrastructure

   15.6    13.3    28.9

Total Direct Costs

   255.8    54.7    310.5

Project Preliminaries

   35.9    0.0    35.9

Project Delivery

   30.7    2.5    33.3

Owner’s Costs

   61.7    3.7    65.3

Total Indirect Costs

   128.3    6.2    134.5

Total Direct + Indirect Costs

   384.1    60.9    444.9

Contingency

   65.9    0.0    65.9

Total Capital Cost

   450.0    60.9    510.9

Note:

Capex period ends at completion of commissioning with no allowance for pre-production cost and revenue

LOM unit operating costs are estimated at $59.43/tonne of ore processed. Average LOM cash costs and all-in sustaining costs (“AISC”) are estimated at US$1,203 and US$1,292 showing a margin to the base case gold price of US$1,897 and US$1,808/oz Au respectively and a margin on spot gold price of US$3,246 and US$3,159/oz Au.


- 8 -


Table 6: Operating Costs


Description


Unit

   Life-of-Mine
Average
 

Operating Costs


Mining Cost

   $/t mined      4.53  
   $/t processed      30.66  

Processing Cost

   $/t processed      19.22  

G&A Cost

   $/t processed      6.82  

Royalties and Refining Cost

   $/t processed      2.73  

Total Operating Cost

   $/t processed      59.43  

Cash Costs and All-In Sustaining Costs1


Cash Costs1

   US$/oz Au      1,203  

All-In Sustaining Cost (AISC)1

   US$/oz Au      1,292  


  1 

See on non-GAAP terms contained at the end of this material change report

Fenn-Gib Production Profile

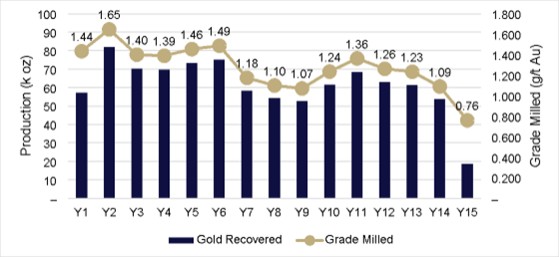
The PFS outlines a production profile based on a high-grade open pit with a projected operating mine life of 14.3 years, averaging 1.29 g/t Au and an anticipated metallurgical recovery averaging 88.3%. During the first 6 years of operations (years 1-6), annual gold production is expected to average 71,336 oz at a feed grade of 1.47 g/t, with peak output of over 82,000 oz in year 2. The mined Reserves represent only 24% of the overall 4.3 Moz Indicated Mineral Resource.


- 9 -


Figure 3: Gold Production Profile


LOGO

Fenn-Gib Project Design Details

Mining

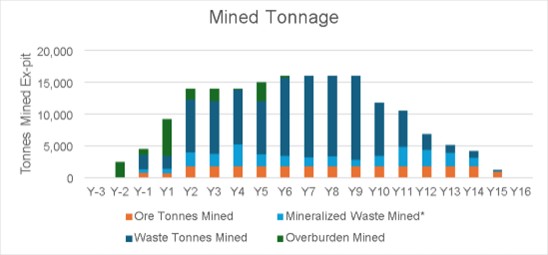
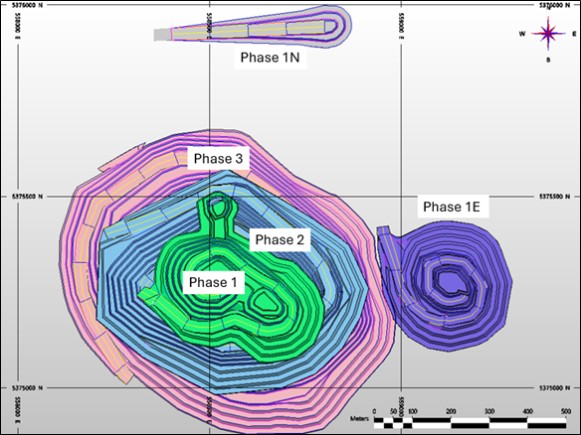
The Fenn-Gib mine design is based on a conventional truck-and-shovel open-pit operation. The mine plan incorporates an elevated, operating cut-off grade of 0.8 g/t Au and is structured into three primary mining phases with two smaller satellite pits. Total mined tonnes peak at 16 Mt per year or approximately 44 kt per day.

Figure 4: Mined Tonnage by Material Type1


LOGO

 
1 

*Mineralized waste is not processed in the PFS mine plan. This material falls below the elevated cut-off grade used for plant feed but remains above the economic cut-off grade. At the end of the mine life, approximately 27 Mt of this material is stockpiled at an average grade of 0.51 g/t.


- 10 -


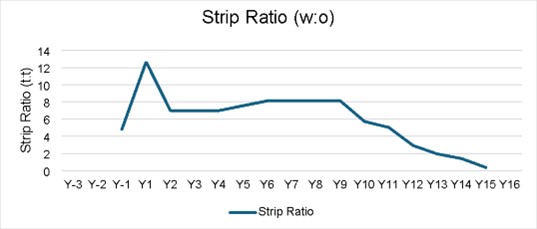
Figure 5: Strip Ratio


LOGO

In total, waste material mined over the LOM is estimated at 152 Mt and will be placed in overburden stockpiles, mine rock storage areas, and utilized in the construction of the tailings storage facility (“TSF”) embankments.

Figure 6: Fenn-Gib Ultimate Pit Design with Phases


LOGO

Source: AGP, 2025.


- 11 -


Processing and Recovery

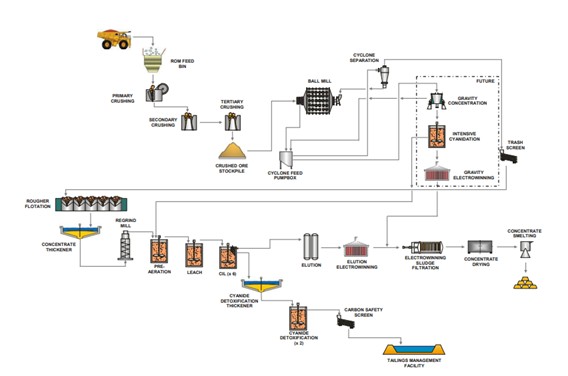
The PFS process plant design for Fenn-Gib is based on metallurgical testwork completed to date and is considered a conventional metallurgical flowsheet to treat gold ore to produce doré bars. The circuit consists of crushing and grinding targeting 80% passing grind size (P80) of 106 µm, sulphide flotation at a mass pull of between 23 to 29%, rougher concentrate regrinding targeting P80 of 13 µm and cyanidation, carbon-in-leach (“CIL”) adsorption, desorption and regeneration, with cyanide detoxification of the CIL tailings. The design also considers the addition of a gravity concentration circuit in the future. The overall metallurgical recovery of 89.6% Au is expected for a head grade of 1.5 g/t Au.

Figure 7: Process flow diagram


LOGO

Source: Ausenco, 2025

The PFS plant design incorporates modularization concepts for key equipment and infrastructure. Modularization offers several potential benefits, including reduced construction timelines, improved cost predictability, and enhanced quality control through off-site fabrication. This approach also minimizes on-site labour requirements and mitigates weather-related delays, supporting a more efficient and streamlined project execution.

Infrastructure

The Fenn-Gib Project infrastructure plan includes all major facilities required for mine development, processing, and support operations. Key components include a process plant with crushing facilities, covered stockpile, and a reagent warehouse, as well as mine maintenance facilities such as a truck shop, wash bay, and warehouses. Essential buildings will be constructed on-site, while non-essential services are anticipated to be located in Matheson.


- 12 -


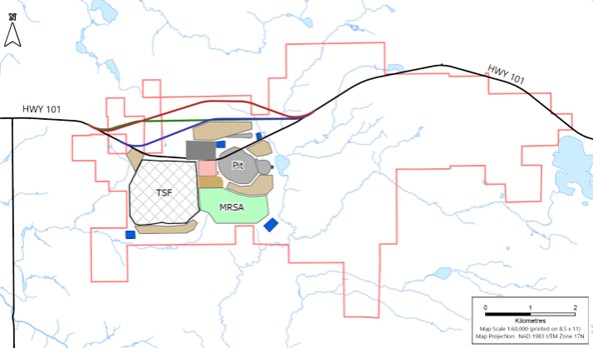
Site access will be via Highway 101, which connects to the Trans-Canada Highway with regional air service provided by the Timmins Airport. A 5 km segment of Highway 101 will be realigned to ensure a safe clearance from the ultimate pit design. The PFS considers the highway realignment construction following the initial construction phase. This timing will be reassessed in the next phase depending on the timing related to the Ministry of Transport, Ontario approvals.

Tailings and waste management will utilize a paddock-style TSF constructed using a downstream design, which is widely regarded as the preferred approach for long-term stability. The TSF design incorporates extensive site investigations completed as part of the PFS work, ensuring that geotechnical, hydrological, and environmental conditions are fully considered. The facility is engineered for co-disposal of tailings and Potentially Acid Generating mine rock, with staged construction and integrated water reclaim systems.

The site layout includes designated mine rock storage areas and overburden stockpiles, along with water management systems designed to capture runoff and seepage. These systems will incorporate water management ponds and a treatment plant.

Construction power requirements of approximately 3 MW will be supplied via a grid connection early in the construction phase, with provisions for emergency backup power to ensure continuity. For operations, the site will require approximately 16 MW of power, with the preferred solution being a Hydro One grid connection through a 27.6 kV line from the Ramore Transformer Station. To mitigate risk in the event of delays to the Hydro One distribution connection or approvals process, the Project has conceptualized an alternate power source as a contingency. The operations power supply includes emergency backup systems as may be needed.

A construction camp (owned and operated by a third-party) is anticipated to be located off-site in Matheson, and no operations camp is planned at this time.


- 13 -


Figure 8: Conceptual PFS Infrastructure and Site Layout


LOGO

Source: Mayfair, 2025

Environmental and Permitting

Extensive baseline environmental studies have been underway since 2021, covering terrestrial and aquatic ecosystems, including Species at Risk, groundwater, air quality, noise, geochemical characterization, and cultural heritage resources. Follow-up studies continued through 2025 and are planned to extend into 2026. Results indicate environmental conditions typical of northeastern Ontario, with no critical constraints identified that would prevent mine development. Studies are considered suitably advanced to initiate the environmental approvals process.

The Project is anticipated to proceed through the Provincial Class EA process and not trigger an Individual EA under provincial requirements or a federal IA under the Impact Assessment Act.

Early engagement with regulators has commenced, and the Company is in discussions with the Ontario government to advance the EA and permitting processes in parallel. It is expected that the Company will submit the required application to the Ministry of Energy and Mines (MEM) regarding participation in the ‘One Project, One Process’ (1P1P) initiative, which facilitates provincial approvals through a dedicated Mine Authorization and Permitting Delivery Team early in 2026.

The Fenn-Gib Project will require permits and approvals typical of mine developments, primarily under provincial jurisdiction. An authorization under the federal Fisheries Act may be required to address potential impacts to fish and fish habitat. A conceptual closure strategy, forming the basis of the Closure Plan, has been developed in alignment with the Mine Rehabilitation Code of Ontario.


- 14 -


Community and Indigenous Affairs

Social and community engagement has focused primarily on the AAN due to its proximity to the Fenn-Gib site. The Project is situated within Treaty 9 territory, approximately 20 km from the AAN community and within their traditional lands. The Company and AAN have an active Exploration Agreement in place and will continue to advance consultation collaboratively, with the intention of developing a Community Benefit Agreement for the Project. In addition, the Project is approximately 17 km from the Town of Black River-Matheson and anticipates utilizing and contributing to the services and infrastructure of the Town. A ‘good neighbour’ agreement with the Town of Black River-Matheson is anticipated.

Engagement with the identified regional Indigenous communities and local stakeholders will commence upon submission of the Environmental Assessment documentation. The Company is committed to transparent communication regarding the Fenn-Gib Project and its environmental design and impacts. The Project is expected to deliver regional benefits through employment, procurement opportunities, and community investment.

Project Timelines and Next Steps

Figure 9: High-Level Schedule


LOGO

Source: Mayfair, 2025

The Project plans to advance three key strategies in parallel: Ontario-led environmental approvals, Indigenous agreements, and the engineering-design-procurement phase. These elements will progress concurrently to enable the start of major construction within an estimated 24 to 36 months.

Beginning in early 2026, the Project will move into front-end engineering, followed by detailed engineering and long-lead, critical-path procurement activities. It is anticipated that the Project control estimate will be finalized with 70% to 100% engineering completion and critical construction and supply contracts in place.


- 15 -


Project designs related to environmental aspects of the Project and the permitting tasks are expected to be the critical path for construction commencement.

The Project is envisioned to achieve commercial production within a five-year timeframe.

Technical Report Preparation and Qualified Persons

The PFS and Mineral Reserves have an effective date of December 19, 2025 with the Mineral Resource estimate having an effective date of September 3, 2024. The PFS was prepared by independent Qualified Persons (“QPs”) in accordance with National Instrument 43-101 – Standards of Disclosure for Mineral Projects. The report covers all key aspects of the Project, including property description and location, geology, mineral resource and reserve estimates, mining methods, metallurgical testing and recovery processes, project infrastructure, capital and operating cost estimates, economic analysis, and execution planning.

For readers to fully understand the information in this material change report, they should review the technical report (that will be filed within 45 days of the material change) in its entirety, including all qualifications, assumptions, exclusions, and risks. The report is intended to be read as a whole, and individual sections should not be relied upon out of context.

The QPs responsible for the PFS include:


  •  

Tommaso Roberto Raponi, P.Eng., (Ausenco) – process plant design, process infrastructure, metallurgy, recovery methods, and operating (plant and G&A) cost estimates, financial analysis


  •  

Gordon Zurowski, P.Eng., (AGP) – mineral reserves, mining methods, mine design, and capital and operating costs related to the mine, as well as contribution to the economic analysis


  •  

Craig Hall, P.Eng. and Richard Cook, P.Geo. (Ltd.) (KP) – tailings and water management design, geotechnical aspects, environmental and permitting considerations and closure cost estimates


  •  

Sarah Barabash, P.Geo. (Ltd.) (Ecometrix) – geochemistry


  •  

Tim Maunula, P.Geo. (TMAC) – mineral resource estimation and geological interpretation

Full detail of areas of responsibility of the QPs can be found in the technical report.

The content of this material change report from the PFS has been reviewed and approved by the QPs who authored the PFS. In addition, Drew Anwyll, P.Eng., Chief Operating Officer of Mayfair, a QP as defined in NI 43-101, has reviewed the PFS on behalf of the Company and has approved the technical disclosure contained in this material change report. The full technical report, titled “National Instrument 43-101 Technical Report – Pre-Feasibility Study for the Fenn-Gib Project, Ontario, Canada”, will be filed on SEDAR+ under Mayfair Gold’s profile and will also be available on the Company’s website at www.mayfairgold.ca.


- 16 -


Engaging Investor Relations and Communication Advisory Services

As part of its strategy to enhance communication and engagement with investors and other stakeholders following its transition year in 2025, Mayfair has engaged several investor relations and capital markets consultants.

Mayfair has entered into an agreement with Adelaide Capital (“Adelaide”) a full-service investor relations and social media firm that specializes in small-cap growth companies. Adelaide will help with investor marketing and communication, creation and design of materials, co-ordination of North America focused non-deal roadshows, virtual campaigns and social media awareness building. As per the agreement with Adelaide, the Company has agreed to pay a monthly fee of C$10,000 for a 3-month term. Adelaide is principally owned by Deborah Honig and is an arm’s length company based in Toronto, Ontario. To the best of the company’s knowledge Adelaide does not have any interest, directly or indirectly, in the securities of the Company.

In addition, Mayfair has entered into an agreement with Swiss Resource Capital AG (“SRC”) a Switzerland-based investor relations firm specializing in the resource space. Focusing its efforts in Europe, SRC will assist in messaging, communication, creation and design of materials, non-deal roadshows, virtual campaigns, targeted investor outreach and affiliated media awareness programs. Pursuant to the agreement, the company has agreed to pay a monthly fee of 6,000 CHF per month for a 12-month term. SRC is an arms-length private company based in Herisau, Switzerland and led by CEO Marc Ollinger. To the best of the company’s knowledge SRC does not have any interest, directly or indirectly, in the securities of the Company.

Lastly, Mayfair has entered into an agreement with Triomphe Holdings Ltd., doing business as Capital Analytica, a marketing and public awareness company in the mining sector. Capital Analytica will provide digital awareness, monitoring and engagement reporting services. Pursuant to the agreement, the company has agreed to pay $150,000 payable in two tranches for a 6-month term with an option to renew for additional 6-month terms at a rate of $75,000. Capital Analytica is an arms-length company based in Nanaimo, B.C. and led by its Founder Jeff French. To the best of the company’s knowledge Capital Analytica does not have any interest, directly or indirectly, in the securities of the Company.


5.2

Disclosure for Restructuring Transactions

Not applicable


ITEM 6

RELIANCE ON SUBSECTION 7.1(2) OF NATIONAL INSTRUMENT 51-102

Not applicable. This report is not being filed on a confidential basis.


ITEM 7

OMITTED INFORMATION

None.


- 17 -


ITEM 8

EXECUTIVE OFFICER

Darren Prins

Interim Chief Financial Officer

Telephone: (855) 350-5600


ITEM 9

DATE OF REPORT

January 13, 2026

Cautionary Notes to U.S. Investors Concerning Resource Estimates

This material change report has been prepared in accordance with the requirements of the securities laws in effect in Canada, which differ from the requirements of the U.S. Securities and Exchange Commission applicable to domestic United States issuers. Accordingly, the information concerning the Company’s mineral properties contained in this material change report is not comparable to the disclosure of United States issuers subject to the SEC’s mining disclosure requirements, and the Company’s disclosure of mineralization and other technical information may differ significantly from the information that would be disclosed had the Company prepared the information under the standards applicable to United States issuers.

Use of Non-GAAP Measures

Certain financial measures referred to in this material change report are not measures recognized under IFRS (as defined below) and are referred to as non-GAAP financial measures or ratios. These measures have no standardized meaning under IFRS and may not be comparable to similar measures presented by other companies. The definitions established and calculations performed by Mayfair are based on management’s reasonable judgement and are consistently applied. These measures are intended to provide additional information and should not be considered in isolation or as a substitute for measures prepared in accordance with IFRS.

The non-GAAP financial measures used in this material change report and common to the gold mining industry are “free cash flow”, “Cumulative Net FCF”, “Average Annual FCF”, “ASIC” and “all-in sustaining cost per ounce of gold sold”. These measures are non-GAAP financial measures and have no standardized meaning under IFRS Accounting Standards (“IFRS”) and may not be comparable to similar measures used by other issuers.

Operating Costs include the direct costs of mining, processing, and site administration. Cash Costs include Operating Costs plus royalties and production taxes. AISC includes mining, processing and administrative costs, royalties, production taxes, sustaining capital expenditures, closure allowance, and other costs necessary to maintain planned production. Free Cash Flow is calculated as cash flows from operating activities less capital expenditures and is intended to provide an indication of the cash generated by the project.

As the Company is not in production, it does not have historical non-GAAP financial measures nor historical comparable measures under IFRS, and therefore the foregoing prospective non-GAAP financial measures or ratios may not be reconciled to the nearest comparable measures under IFRS.


- 18 -


Cautionary Note Regarding Forward Looking Information

This material change report contains forward-looking information which reflects management’s expectations regarding the Company’s growth, results of operations, performance and business prospects and opportunities. Forward-looking information in this material change report includes, but is not limited to, statements regarding the design, development and execution of the Project, the PFS demonstrating the strong economics and free cash flow potential associated with developing the Project as a targeted, high-grade operation that can be advanced through the Ontario permitting process, the belief that the permitting process can be advanced quickly, positioning the Project for timely development within the current gold cycle, the Project having exceptional value potential, with strong free cash flow and robust economics that further enhance its attractiveness to investors, finalizing engineering and design work, advancing environmental approvals in preparation for a construction decision within the Company’s target goal of two to three years, advancing permitting activities, detailed engineering and stakeholder engagement with the goal of starting construction in 2028 with initial production in 2030, and all economics set out in the PFS.

Forward-looking information is based on various reasonable assumptions including, without limitation, the expectations and beliefs of management; the assumed long-term price of gold; that the Company can access financing, appropriate equipment and sufficient labour; and that the political environment where the Company operates will continue to support the development and operation of mining projects. Should underlying assumptions prove incorrect, or one or more of the risks and uncertainties described below materialize, actual results may vary materially from those described in forward-looking statements.

Forward-looking information is subject to a variety of risks and uncertainties which could cause actual events or results to differ from those reflected in the forward-looking information, including, without limitation, risks and uncertainties relating to foreign currency fluctuations; risks inherent in mining including environmental hazards, industrial accidents, unusual or unexpected geological formations, ground control problems and flooding; delays or the inability to obtain necessary governmental permits or financing; risks associated with the estimation of mineral resources and reserves and the geology, grade and continuity of mineral deposits; the possibility that future exploration, development or mining results will not be consistent with the Company’s expectations; the potential for and effects of labor disputes or other unanticipated difficulties with or shortages of labor; failure of plant, equipment or processes to operate as anticipated; actual ore mined varying from estimates of grade, tonnage, dilution and metallurgical and other characteristics; the inherent uncertainty of production and cost estimates and the potential for unexpected costs and expenses, gold price fluctuations; uncertain political and economic environments; and changes in laws or policies.

The Company undertakes no obligation to publicly update or review the forward-looking information whether as a result of new information, future events or otherwise, other than as required under applicable securities laws. The forward-looking information reflect management’s beliefs, opinions and projections as of the date of this material change report.


- 19 -