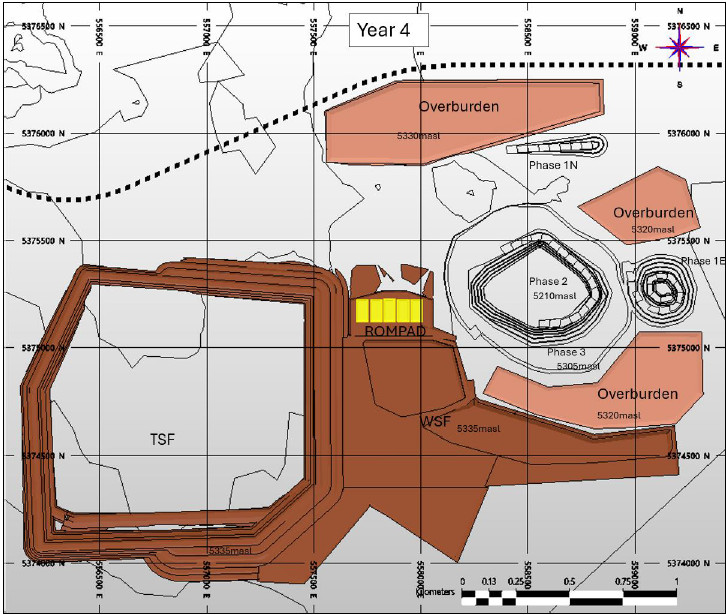
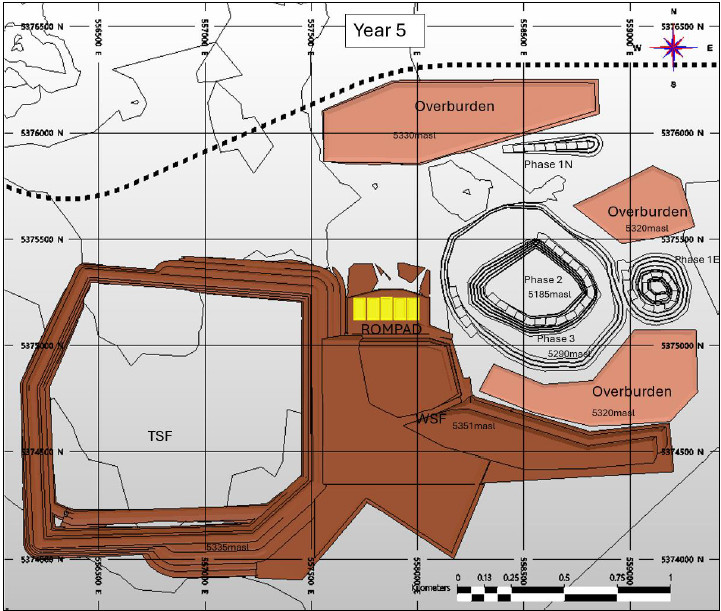
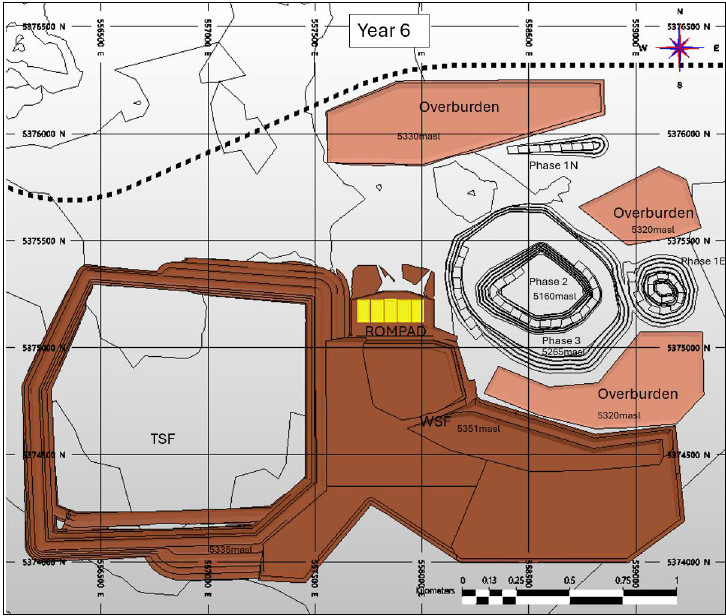
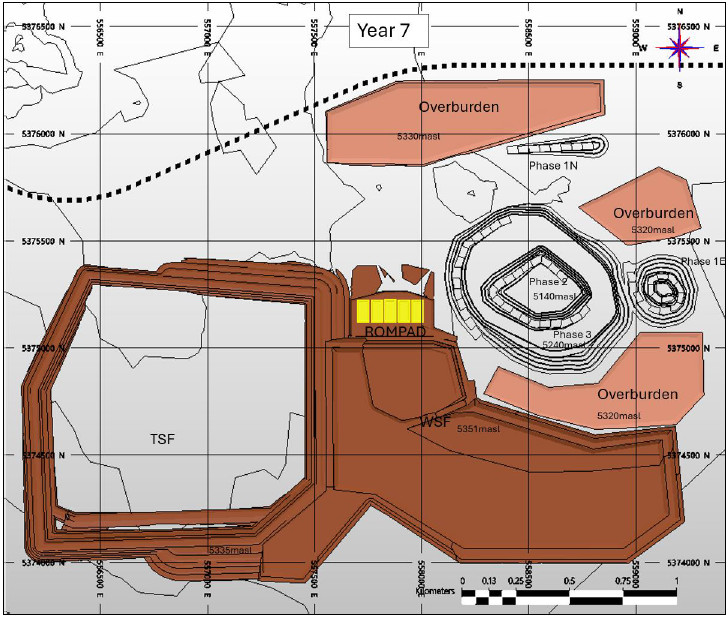
Exhibit 99.54
Fenn-Gib Gold Project NI 43-101 Technical Report and Pre-Feasibility Study Ontario, Canada Effective Date: December 19, 2025 Report Date: January 14, 2026 Prepared for: Mayfair Gold Corp. 489 McDougall Street, Matheson, ON, Canada P0K 1N0 Prepared by: Ausenco Engineering Canada ULC 15th Floor, 11 King Street West Toronto, Ontario, M5H 4C7 List of Qualified Persons: Tommaso Roberto Raponi, P.Eng., Ausenco Engineering Canada ULC Tim Maunula, P.Geo., T. Maunula & Associates Consulting Inc. Gordon Zurowski, P.Eng., AGP Mining Consultants Inc. Craig Hall, P.Eng., Knight Piésold Ltd. Richard Cook, P.Geo (Ltd.), Knight Piesold Ltd. Sarah Barabash, PhD, P.Geo (Ltd.), Ecometrix Inc. an Egis Group Company.
CERTIFICATE OF QUALIFIED PERSON
Tommaso Roberto Raponi, P.Eng.
I, Tommaso Roberto Raponi, P.Eng., certify that:
| 1. | I am employed as a Principal Metallurgist with Ausenco Engineering Canada ULC (Ausenco), with an office address of Suite 1550 - 11 King St West, Toronto, Ontario M5H 4C7. |
| 2. | This certificate applies to the technical report titled “Fenn-Gib Gold Project NI 43-101 Technical Report and Pre-Feasibility Study, Ontario, Canada” that has an effective date of 19 December 2025 and a report date of 14 January 2026 (“Technical Report”). |
| 3. | I graduated from University of Toronto with a Bachelor of Applied Science in Geological Engineering, with specialization in Mineral Processing in 1984 |
| 4. | I am a professional engineer registered with the Professional Engineers Ontario (No. 90225970), Engineers and Geoscientists British Columbia (No. 23536) and NWT and Nunavut Association of Professional Engineers and Geoscientists (No. L4508) and with Professional Engineers and Geoscientists Newfoundland and Labrador (No. 10968). |
| 5. | I have practiced my profession continuously for over 40 years with experience in the development, design, operation and commissioning of mineral processing plants, focusing on gold projects, both domestic and internationally. Examples of projects I have worked on include: Treasury Metals Goliath Gold Complex PFS, Canagold New Polaris Project FS, Generation Mining Marathon Project FS, Tiger Gold Quinchia PEA, Paramount Gold Nevada Grassy Mountain Project FS and the First Mining Springpole Project FS. |
| 6. | I have read the definition of “Qualified Person” set out in the National Instrument 43-101 Standards of Disclosure for Mineral Projects (“NI 43-101”) and certify that by virtue of my education, affiliation to a professional association and past relevant work experience, I fulfill the requirements to be a “Qualified Person” for those sections of the Technical Report that I am responsible for preparing. |
| 7. | I visited the project site on May 22, 2025. |
| 8. | I am responsible for Sections 1.1, 1.2, 1.10, 1.14-1.16, 1.18-1.19, 1.21.1, 1.22, 2.1-2.3, 2.4.2, 3.1, 3.3, 12.3, 13, 17, 18.1-18.3, 18.8-18.12, 19, 21.1-21.2.3, 21.2.5-21.2.8, 21.2.10-21.3.2, 21.3.4-21.4, 22.1-22.3.2, 22.3.4-22.5, 24.1- 24.4, 25.1, 25.5, 25.10, 25.12, 25.14-25.16, 25.17.1.2, 25.17.1.5, 25.17.2.2, 26.1, 26.4-26.5, 26.8, 26.10-26.11, and 27 of the Technical Report. |
| 9. | I am independent of Mayfair Gold Corp. as independence is defined in Section 1.5 of NI 43-101. |
| 10. | I have not been previously involved with the Fenn-Gib Gold Project. |
Page 1 of 2
| 11. | I have read NI 43-101 and the sections of the Technical Report for which I am responsible have been prepared in compliance with that Instrument. As of the effective date of the Technical Report, to the best of my knowledge, information and belief, the sections of the Technical Report for which I am responsible contain all scientific and technical information that is required to be disclosed to make those sections of the Technical Report not misleading. |
Dated: January 14, 2026
“Signed and Sealed”
Tommaso Roberto Raponi, P.Eng.
Page 2 of 2
CERTIFICATE OF QUALIFIED PERSON
Tim Maunula, P.Geo.
I, Tim Maunula, P.Geo. certify that:
| 1. | I am employed as a Principal Geologist with T. Maunula & Associates Consulting Inc., (TMAC), with an office address of 15 Valencia Drive, Chatham, ON N7L 0A9. |
| 2. | This certificate applies to the technical report titled “Fenn-Gib Gold Project NI 43-101 Technical Report and Pre-Feasibility Study, Ontario, Canada” that has an effective date of December 19, 2025, and a report date of January 14, 2026 (“Technical Report”). |
| 3. | I graduated from Lakehead University with a Bachelor of Science (Honors) in Geology in 1979 and from the University of Alberta with a Citation in Applied Geostatistics in 2004. |
| 4. | I am a professional geoscientist registered with the Professional Geoscientist Ontario (No. 1115). |
| 5. | I have practiced my profession continuously for over 40 years with 15 years in exploration (including airborne and ground geophysical surveys and data processing) and over 25 years in Mineral Resource estimation and associated activities. |
| 6. | I have read the definition of “Qualified Person” set out in the National Instrument 43-101 Standards of Disclosure for Mineral Projects (“NI 43-101”) and certify that by virtue of my education, affiliation to a professional association and past relevant work experience, I fulfill the requirements to be a “Qualified Person” for those sections of the Technical Report that I am responsible for preparing. |
| 7. | I visited the project site from February 6 to 7, 2023 and April 15 to 17, 2024. |
| | I am responsible for Sections 1.3-1.9, 1.11, 1.20, 2.4.1, 3.2, 4-11, 12.1-12.2, 14, 23, 25.2-25.4, 25.6-25.7, 25.17.1.1, 25.17.2.1, 26.2, and 27 of the Technical Report. |
| 8. | I am independent of Mayfair Gold Corp. as independence is defined in Section 1.5 of NI 43-101. |
| 9. | I have been previously involved with the Fenn-Gib Gold Project. I was a QP on a NI 43-101 Technical Report issued on October 10, 2025. |
| 10. | I have read NI 43-101 and the sections of the Technical Report for which I am responsible have been prepared in compliance with that Instrument. As of the effective date of the Technical Report, to the best of my knowledge, information and belief, the sections of the Technical Report for which I am responsible contain all scientific and technical information that is required to be disclosed to make those sections of the Technical Report not misleading. |
Dated: January 14, 2026
“Signed and Sealed”
Tim Maunula, P.Geo.
Page 1 of 1
CERTIFICATE OF QUALIFIED PERSON
Gordon Zurowski, P.Eng.
I, Gordon Zurowski, P.Eng., certify that:
| 1. | I am employed as a Principal Mining Engineer with AGP Mining Consultants Inc. (AGP), with an office address of #246-132K Commerce Park Dr., Barrie, Ontario L4N 0Z7. |
| 2. | This certificate applies to the technical report titled “Fenn-Gib Gold Project NI 43-101 Technical Report and Pre-Feasibility Study, Ontario, Canada” that has an effective date of 19 December 2025 and a report date of 14 January 2026 (“Technical Report”). |
| 3. | I graduated from the University of Saskatchewan with a Bachelor of Science in Geological Engineering in 1989. |
| 4. | I am a professional engineer registered with the Professional Engineers Ontario (No. 100077750). |
| 5. | I have practiced my profession continuously for over 30 years with experience in mineral reserve estimations and PEA, Pre-Feasibility and Feasibility studies in Canada, the United States, Central and South America, Europe, Asia, Africa, and Australia. As a result of my experience and qualifications, I am a Qualified Person as defined in NI 43-101. |
| 6. | I have read the definition of “Qualified Person” set out in the National Instrument 43-101 Standards of Disclosure for Mineral Projects (“NI 43-101”) and certify that by virtue of my education, affiliation to a professional association and past relevant work experience, I fulfill the requirements to be a “Qualified Person” for those sections of the Technical Report that I am responsible for preparing. |
| 7. | I visited the project site with my last visit July 26, 2024. |
| 8. | I am responsible for Sections 1.12, 1.13, 1.21.2, 2.4.3, 15, 16, 18.4, 21.2.4, 21.3.3, 24.5, 25.8-25.9, 25.17.1.3, 25.17.2.3, 26.3, 26.7, and 27 of the Technical Report. |
| 9. | I am independent of Mayfair Gold Corp. as independence is defined in Section 1.5 of NI 43-101. |
| 10. | I have not been previously involved with the Fenn-Gib Gold Project. |
| 11. | I have read NI 43-101 and the sections of the Technical Report for which I am responsible have been prepared in compliance with that Instrument. As of the effective date of the Technical Report, to the best of my knowledge, information and belief, the sections of the Technical Report for which I am responsible contain all scientific and technical information that is required to be disclosed to make those sections of the Technical Report not misleading. |
Dated: January 14, 2026
“Signed and Sealed”
Gordon Zurowski, P.Eng.
Page 1 of 1
CERTIFICATE OF QUALIFIED PERSON
Craig Norman Hall, P.Eng.
I, Craig Norman Hall, P.Eng., certify that:
| 1. | I am employed as a Managing Principal with Knight Piésold Ltd. (KP), with an office address of 200 - 1164 Devonshire Ave, North Bay, Ontario P1B 6X7. |
| 2. | This certificate applies to the technical report titled “Fenn-Gib Gold Project NI 43-101 Technical Report and Pre-Feasibility Study, Ontario, Canada” that has an effective date of 19 December 2025 and a report date of 14 January 2026 (“Technical Report”). |
| 3. | I graduated from the University of Waterloo with a Bachelor of Applied Science in Geological Engineer in 2003. |
| 4. | I am a professional engineer registered with the Professional Engineers Ontario (No. 100075047). |
| 5. | I have practiced my profession continuously for over 22 years with experience in mining operations, engineering and financial evaluations, including tailings, mine waste, water management facilities and other mining related surface infrastructure. |
| 6. | I have read the definition of “Qualified Person” set out in the National Instrument 43-101 Standards of Disclosure for Mineral Projects (“NI 43-101”) and certify that by virtue of my education, affiliation to a professional association and past relevant work experience, I fulfill the requirements to be a “Qualified Person” for those sections of the Technical Report that I am responsible for preparing. |
| 7. | I visited the project site on May 22, 2025. |
| 8. | I am responsible for Sections 1.17.2, 2.4.4, 18.5-18.7, 20.2, 20.5, 21.2.9, 22.3.3, 25.11, 25.17.2.5, 26.6, and 27 of the Technical Report. |
| 9. | I am independent of Mayfair Gold Corp. as independence is defined in Section 1.5 of NI 43-101. |
| 10. | I have not been previously involved with the Fenn-Gib Gold Project. |
| 11. | I have read NI 43-101 and the sections of the Technical Report for which I am responsible have been prepared in compliance with that Instrument. As of the effective date of the Technical Report, to the best of my knowledge, information and belief, the sections of the Technical Report for which I am responsible contain all scientific and technical information that is required to be disclosed to make those sections of the Technical Report not misleading. |
Dated: January 14, 2026
“Signed and Sealed”
Craig Norman Hall, P.Eng.
Page 1 of 1
CERTIFICATE OF QUALIFIED PERSON
Richard Alonzo Cook, P.Geo. (Limited)
I, Richard Alonzo Cook, P.Geo. (Limited), certify that:
| 1. | I am employed as a Specialist Environmental Scientist with Knight Piésold Ltd. (KP), with an office address of #200 - 1164 Devonshire Ave, North Bay, Ontario, P1B 6X7. |
| 2. | This certificate applies to the technical report titled “Fenn-Gib Gold Project NI 43-101 Technical Report and Pre-Feasibility Study, Ontario, Canada” that has an effective date of 19 December 2025 and a report date of 14 January 2026 (“Technical Report”). |
| 3. | I graduated from Queen’s University with a Bachelor of Science (Honours) in Environmental Science (Chemistry) in 1996 and subsequently completed additional geoscience coursework at the University of Waterloo and Athabasca University. |
| 4. | I am a professional geoscientist registered with the Professional Geoscientist Ontario (No. 2199). |
| 5. | I have practiced my profession continuously for over 29 years with experience in environmental management in the mining industry. This includes conducting and managing environmental assessments, water management planning, and closure planning for mining projects. |
| 6. | I have read the definition of “Qualified Person” set out in the National Instrument 43-101 Standards of Disclosure for Mineral Projects (“NI 43-101”) and certify that by virtue of my education, affiliation to a professional association and past relevant work experience, I fulfill the requirements to be a “Qualified Person” for those sections of the Technical Report that I am responsible for preparing. |
| 7. | I have not visited the project site. |
| 8. | I am responsible for Sections 1.17.1, 1.17.3, 1.17.4, 20.1.1, 20.3, 20.4, 20.6, 25.13, 25.17.1.4, 25.17.2.4, 26.9, and 27 of the Technical Report. |
| 9. | I am independent of Mayfair Gold Corp. as independence is defined in Section 1.5 of NI 43-101. |
| 10. | I have not been previously involved with the Fenn-Gib Gold Project. |
| 11. | I have read NI 43-101 and the sections of the Technical Report for which I am responsible have been prepared in compliance with that Instrument. As of the effective date of the Technical Report, to the best of my knowledge, information and belief, the sections of the Technical Report for which I am responsible contain all scientific and technical information that is required to be disclosed to make those sections of the Technical Report not misleading. |
Dated: January 14, 2026
“Signed and Sealed”
Richard Alonzo Cook, P.Geo. (Limited)
Page 1 of 1
CERTIFICATE OF QUALIFIED PERSON
Sarah Barabash, PhD., P.Geo. (Limited)
I, Sarah Barabash, PhD., P.Geo. (Limited), certify that:
| 1. | I am employed as the Director of Mining Services with Ecometrix Inc. (Ecometrix), with an office address of 6800 Campobello Road, Mississauga, ON, L5N 2L8. |
| 2. | This certificate applies to the technical report titled “Fenn-Gib Gold Project NI 43-101 Technical Report and Pre-Feasibility Study, Ontario, Canada” that has an effective date of 19 December 2025 and a report date of 14 January 2026 (“Technical Report”). |
| 3. | I graduated from University of Guelph with a Bachelor of Environmental Science in 2004 and a Doctor of Philosophy in Geochemistry in 2010. |
| 4. | I am a professional geoscientist registered with the Professional Geoscientist Ontario (No. 3995) and Engineers and Geoscientists British Columbia (No. 62524). |
| 5. | I have practiced my profession continuously for 15 years with experience in environmental consulting, primarily with respect to: mine development, operations and closure including assessment and selection of mine closure strategies; development of mine closure plans; and assessment and management of Metal Leaching / Acid Rock Drainage (ML/ARD). |
| 6. | I have read the definition of “Qualified Person” set out in the National Instrument 43-101 Standards of Disclosure for Mineral Projects (“NI 43-101”) and certify that by virtue of my education, affiliation to a professional association and past relevant work experience, I fulfill the requirements to be a “Qualified Person” for those sections of the Technical Report that I am responsible for preparing. |
| 7. | I have not visited the project site. |
| 8. | I am responsible for Sections 20.1.2 of the Technical Report. |
| 9. | I am independent of Mayfair Gold Corp. as independence is defined in Section 1.5 and 27 of NI 43-101. |
| 10. | I have not been previously involved with the Fenn-Gib Gold Project. |
| 11. | I have read NI 43-101 and the sections of the Technical Report for which I am responsible have been prepared in compliance with that Instrument. As of the effective date of the Technical Report, to the best of my knowledge, information and belief, the sections of the Technical Report for which I am responsible contain all scientific and technical information that is required to be disclosed to make those sections of the Technical Report not misleading. |
Dated: January 14, 2026
“Signed and Sealed”
Sarah Barabash, PhD., P.Geo. (Limited)
Page 1 of 1
|
|
Important Notice
This report was prepared as National Instrument 43-101 Technical Report for Mayfair Gold Corp. (Mayfair Gold) by Ausenco Engineering Canada ULC (Ausenco), T. Maunula & Associates Consulting Inc., (TMAC), Knight Piésold Ltd. (KP), AGP Mining Consultants Inc. (AGP) and Ecometrix Inc. an Egis Group Company (Ecometrix), collectively the Report Authors. The quality of information, conclusions, and estimates contained herein is consistent with the level of effort involved in the Report Authors’ services, based on i) information available at the time of preparation, ii) data supplied by outside sources, and iii) the assumptions, conditions, and qualifications set forth in this report. This report is intended for use by Mayfair Gold subject to terms and conditions of its contracts with each of the Report Authors. Except for the purposed legislated under Canadian provincial and territorial securities law, any other uses of this report by any third party are at that party’s sole risk.
| Fenn-Gib Gold Project |
Page 1 | |
| NI 43-101 Technical Report and Pre-Feasibility Study |
December 19, 2025 | |
|
|
Table of Contents
| 1 |
Summary |
1 | ||||||
| 1.1 | Introduction | 1 | ||||||
| 1.2 | Terms of Reference | 1 | ||||||
| 1.3 | Property Description and Location | 2 | ||||||
| 1.4 | Mineral Tenure, Royalties and Agreements | 2 | ||||||
| 1.5 | History | 2 | ||||||
| 1.6 | Geology and Mineralization | 3 | ||||||
| 1.7 | Deposit Types | 5 | ||||||
| 1.8 | Exploration | 5 | ||||||
| 1.9 | Drilling | 5 | ||||||
| 1.10 | Mineral Processing and Metallurgical Testwork | 6 | ||||||
| 1.11 | Mineral Resource Estimate | 6 | ||||||
| 1.12 | Mineral Reserve Estimate | 8 | ||||||
| 1.13 | Mining Methods | 9 | ||||||
| 1.14 | Recovery Methods | 9 | ||||||
| 1.15 | Project Infrastructure | 10 | ||||||
| 1.16 | Market Studies and Contracts | 11 | ||||||
| 1.17 | Environmental, Permitting and Social Considerations | 11 | ||||||
| 1.17.1 Environmental Considerations | 11 | |||||||
| 1.17.2 Closure and Reclamation Considerations | 11 | |||||||
| 1.17.3 Permitting Considerations | 12 | |||||||
| 1.17.4 Social Considerations | 12 | |||||||
| 1.18 | Capital and Operating Cost | 12 | ||||||
| 1.18.1 Capital Cost Estimate | 12 | |||||||
| 1.18.2 Operating Cost Estimate | 13 | |||||||
| 1.19 | Economic Analysis | 14 | ||||||
| 1.19.1 Economic Summary | 14 | |||||||
| 1.19.2 Sensitivity Analysis | 18 | |||||||
| 1.20 | Adjacent Properties | 19 | ||||||
| 1.21 | Other Relevant Data and Information | 19 | ||||||
| 1.21.1 Project Execution Plan and Schedule | 19 | |||||||
| 1.21.2 Potential Upside Opportunities | 20 | |||||||
| 1.22 | Conclusions & Recommendations | 21 | ||||||
| Fenn-Gib Gold Project |
Page i | |
| NI 43-101 Technical Report and Pre-Feasibility Study |
December 19, 2025 | |
|
|
| 2 |
Introduction |
22 | ||||||
| 2.1 | Introduction | 22 | ||||||
| 2.2 | Terms of Reference | 22 | ||||||
| 2.3 | Qualified Persons | 23 | ||||||
| 2.4 | Site Visits and Scope of Personal Inspection | 23 | ||||||
| 2.4.1 Site Inspection for Tim Maunula | 23 | |||||||
| 2.4.2 Site inspection for Tommaso Roberto Raponi | 24 | |||||||
| 2.4.3 Site inspection for Gordon Zurowski | 24 | |||||||
| 2.4.4 Site inspection for Craig Hall | 24 | |||||||
| 2.5 | Effective Dates | 24 | ||||||
| 2.6 | Information Sources and References | 24 | ||||||
| 2.6.1 Previous technical reports: | 24 | |||||||
| 2.7 | Currency, Units, Abbreviations and Definitions | 24 | ||||||
| 3 |
Reliance on Other Experts |
29 | ||||||
| 3.1 | Introduction | 29 | ||||||
| 3.2 | Property Agreements, Mineral Tenure, Surface Rights and Royalties | 29 | ||||||
| 3.3 | Taxation | 29 | ||||||
| 4 |
Property Description and Location |
30 | ||||||
| 4.1 | Property Location | 30 | ||||||
| 4.2 | Property and Title in Ontario | 31 | ||||||
| 4.3 | Project Ownership | 31 | ||||||
| 4.4 | Mineral Tenure | 31 | ||||||
| 4.5 | Property Agreements | 40 | ||||||
| 4.6 | Surface Rights | 41 | ||||||
| 4.7 | Water Rights | 42 | ||||||
| 4.8 | Royalties and Encumbrances | 42 | ||||||
| 4.9 | Environmental Considerations | 43 | ||||||
| 4.10 | Permitting Considerations | 43 | ||||||
| 4.11 | Social License Considerations | 44 | ||||||
| 4.12 | Project risks and Uncertainties | 44 | ||||||
| 5 |
Accessibility, Climate, Local Resources, Infrastructure and Physiography |
45 | ||||||
| 5.1 | Accessibility | 45 | ||||||
| 5.2 | Climate | 45 | ||||||
| 5.3 | Local Resources and Infrastructure | 45 | ||||||
| 5.4 | Physiography | 46 | ||||||
| 5.5 | Seismicity | 46 | ||||||
| Fenn-Gib Gold Project |
Page ii | |
| NI 43-101 Technical Report and Pre-Feasibility Study |
December 19, 2025 | |
|
|
| 6 |
History |
47 | ||||||
| 6.1 | Regional History | 47 | ||||||
| 6.2 | Property Exploration History | 47 | ||||||
| 6.2.1 Pangea Goldfields Inc. (1990s - 2012) | 50 | |||||||
| 6.2.2 Lake Shore Gold Corp. and Tahoe Resources Inc. (2011 - 2019) | 50 | |||||||
| 6.3 | Historical Resource Estimates | 50 | ||||||
| 6.4 | Production | 51 | ||||||
| 7 |
Geological Setting and Mineralization | 52 | ||||||
| 7.1 | Regional Geology | 52 | ||||||
| 7.2 | Project Geology | 54 | ||||||
| 7.3 | Mineralization | 54 | ||||||
| 8 |
Deposit Types | 56 | ||||||
| 8.1 | Deposit Model | 56 | ||||||
| 8.2 | Comments on Deposit Type | 57 | ||||||
| 9 |
Exploration | 58 | ||||||
| 9.1 | Introduction | 58 | ||||||
| 9.2 | Grids and Surveys | 58 | ||||||
| 9.3 | Geological Mapping | 58 | ||||||
| 9.4 | Geochemistry | 58 | ||||||
| 9.5 | Geophysics | 59 | ||||||
| 9.6 | Petrology, Mineralogy, and Research Studies | 59 | ||||||
| 9.7 | Exploration Potential | 59 | ||||||
| 9.8 | Targets for Further Exploration | 59 | ||||||
| 10 |
Drilling | 61 | ||||||
| 10.1 | Historical Drilling | 61 | ||||||
| 10.2 | Mayfair Gold Drilling | 61 | ||||||
| 10.3 | Mayfair Diamond Drilling Procedures | 63 | ||||||
| 10.3.1 Spotting Drill Holes | 63 | |||||||
| 10.3.2 Drilling | 63 | |||||||
| 10.3.3 Collar Surveys | 63 | |||||||
| 10.3.4 Downhole Surveys | 64 | |||||||
| 10.4 | Significant Results and Interpretation | 65 | ||||||
| 10.5 | Qualified Person’s Opinion | 72 | ||||||
| 11 |
Sample Preparation, Analyses, and Security | 73 | ||||||
| 11.1 | Introduction | 73 | ||||||
| 11.2 | Historical Sampling Pre-2011 | 73 | ||||||
| Fenn-Gib Gold Project |
Page iii | |
| NI 43-101 Technical Report and Pre-Feasibility Study |
December 19, 2025 | |
|
|
| 11.3 | Historical Sampling Post 2011 | 74 | ||||||
| 11.4 | Mayfair Gold Sampling | 74 | ||||||
| 11.4.1 Sampling Procedure | 74 | |||||||
| 11.5 | Analytical and Test Laboratories | 75 | ||||||
| 11.5.1 ActLabs | 76 | |||||||
| 11.5.2 Swastika Laboratories | 76 | |||||||
| 11.5.3 AGAT Laboratories | 77 | |||||||
| 11.5.4 MSALABS Timmins | 78 | |||||||
| 11.6 | Sample Preparation and Analysis | 78 | ||||||
| 11.7 | Quality Assurance and Quality Control | 78 | ||||||
| 11.7.1 Quality Control Samples | 78 | |||||||
| 11.7.2 QA/QC Control Charts | 79 | |||||||
| 11.7.3 Blanks | 79 | |||||||
| 11.7.4 Duplicates | 84 | |||||||
| 11.8 | Density Determinations | 88 | ||||||
| 11.9 | Comment on Sample Preparation, Analyses and Security | 89 | ||||||
| 11.10 | Adequacy Statement | 89 | ||||||
| 12 |
Data Verification | 90 | ||||||
| 12.1 | Legacy data | 90 | ||||||
| 12.2 | Verification by Tim Maunula | 90 | ||||||
| 12.2.1 Site Inspection | 90 | |||||||
| 12.2.2 Diamond Drilling | 90 | |||||||
| 12.2.3 Databases Verification | 91 | |||||||
| 12.2.4 Quality Assurance and Quality Control | 91 | |||||||
| 12.2.5 Comments on Data Verification | 92 | |||||||
| 12.3 | Verification by Tommaso Roberto Raponi | 92 | ||||||
| 13 |
Mineral Processing and Metallurgical Testing | 93 | ||||||
| 13.1 | Introduction | 93 | ||||||
| 13.2 | Metallurgical Testwork | 93 | ||||||
| 13.2.1 Legacy Testwork Programs (2014 - 2022) | 94 | |||||||
| 13.2.2 Pre-Feasibility Study Testwork Program (2023 - 2025) | 96 | |||||||
| 13.2.3 Mineralogical Studies | 97 | |||||||
| 13.3 | Metallurgical Variability | 106 | ||||||
| 13.4 | Deleterious Elements | 108 | ||||||
| 13.5 | Recovery Estimates | 108 | ||||||
| 14 |
Mineral Resource Estimates | 111 | ||||||
| 14.1 | Introduction | 111 | ||||||
| Fenn-Gib Gold Project |
Page iv | |
| NI 43-101 Technical Report and Pre-Feasibility Study |
December 19, 2025 | |
|
|
| 14.2 | Key Assumptions | 111 | ||||||
| 14.3 | Data | 111 | ||||||
| 14.4 | Geological Models | 112 | ||||||
| 14.5 | Density Assignment | 113 | ||||||
| 14.6 | Exploratory Data Analysis | 113 | ||||||
| 14.6.1 Assays | 113 | |||||||
| 14.7 | Grade Capping/Outlier Restrictions | 114 | ||||||
| 14.8 | Composites | 118 | ||||||
| 14.9 | Variography | 119 | ||||||
| 14.10 | Block Model Definition | 122 | ||||||
| 14.11 | Estimation and Interpolation Methods | 122 | ||||||
| 14.12 | Block Model Validation | 124 | ||||||
| 14.12.1 Visual Verification | 124 | |||||||
| 14.12.2 Statistical Validation | 126 | |||||||
| 14.12.3 Swath Plots | 127 | |||||||
| 14.13 | Classification of Mineral Resources | 129 | ||||||
| 14.14 | Reasonable Prospects for Eventual Economic Extraction | 130 | ||||||
| 14.15 | Mineral Resource Statement | 131 | ||||||
| 14.16 | Factors That May Affect the Mineral Resource Estimate | 131 | ||||||
| 15 |
Mineral Reserve Estimates | 133 | ||||||
| 15.1 | Summary | 133 | ||||||
| 15.2 | Key Assumptions/Basis of Estimate | 134 | ||||||
| 15.3 | Pit Slopes | 135 | ||||||
| 15.4 | Pit Optimization | 135 | ||||||
| 15.5 | Mine Dilution | 136 | ||||||
| 15.6 | Pit Design | 136 | ||||||
| 15.7 | Mine Plan | 138 | ||||||
| 15.8 | Mineral Reserves Statement | 141 | ||||||
| 15.9 | Factors that May Affect the Mineral Reserves | 142 | ||||||
| 16 |
Mining Methods | 143 | ||||||
| 16.1 | Summary | 143 | ||||||
| 16.2 | Geotechnical and Hydrogeological Considerations used in Mine Planning | 144 | ||||||
| 16.2.1 Geotechnical Considerations | 144 | |||||||
| 16.2.2 Hydrogeological Considerations | 149 | |||||||
| 16.2.3 Geotechnical and Hydrogeological PFS Application | 149 | |||||||
| 16.3 | Geologic Model Importation | 150 | ||||||
| 16.4 | Dilution Calculation | 152 | ||||||
| Fenn-Gib Gold Project |
Page v | |
| NI 43-101 Technical Report and Pre-Feasibility Study |
December 19, 2025 | |
|
|
| 16.5 | Pit Limit Analysis | 153 | ||||||
| 16.5.1 Methodology | 153 | |||||||
| 16.5.2 Pit Limit Analysis Inputs and Parameters | 154 | |||||||
| 16.5.3 Pit Limit Analysis Results | 155 | |||||||
| 16.6 | Pit Design Parameters | 157 | ||||||
| 16.6.1 Bench Design | 157 | |||||||
| 16.6.2 Haul Ramp Design | 158 | |||||||
| 16.6.3 Pit and Phase Selection | 160 | |||||||
| 16.6.4 Pit Designs | 160 | |||||||
| 16.6.5 Phases | 163 | |||||||
| 16.7 | Mine Rock Storage Areas | 169 | ||||||
| 16.8 | Life-of-Mine (LOM) Schedule | 170 | ||||||
| 16.9 | LOM Plan Sequence | 174 | ||||||
| 16.10 | Blasting and Explosives | 186 | ||||||
| 16.11 | Mining Equipment | 187 | ||||||
| 16.12 | Grade Control | 187 | ||||||
| 17 |
Recovery Methods | 189 | ||||||
| 17.1 | Overview | 189 | ||||||
| 17.2 | Process Design Criteria | 189 | ||||||
| 17.3 | Process Plant Description | 190 | ||||||
| 17.3.1 Process Flowsheet | 191 | |||||||
| 17.3.2 Plant Design | 192 | |||||||
| 17.4 | Reagent Handling and Storage | 196 | ||||||
| 17.5 | Plant Services | 197 | ||||||
| 17.5.1 Water requirements | 197 | |||||||
| 17.5.2 Power requirements | 198 | |||||||
| 17.5.3 Compressed Air | 199 | |||||||
| 18 |
Project Infrastructure | 200 | ||||||
| 18.1 | Introduction | 200 | ||||||
| 18.2 | Site Access | 203 | ||||||
| 18.3 | Built Infrastructure | 203 | ||||||
| 18.3.1 Process Plant Earthworks | 203 | |||||||
| 18.3.2 Buildings | 204 | |||||||
| 18.3.3 Accommodation | 204 | |||||||
| 18.4 | Waste Rock and Other Mine Stockpiles | 205 | ||||||
| 18.4.1 Run-of-Mine and Mine Rock Storage | 205 | |||||||
| 18.4.2 Overburden | 205 | |||||||
| Fenn-Gib Gold Project |
Page vi | |
| NI 43-101 Technical Report and Pre-Feasibility Study |
December 19, 2025 | |
|
|
| 18.5 | Tailings and Storage Facilities | 205 | ||||||
| 18.5.1 Tailings Storage Facility | 205 | |||||||
| 18.6 | Water Management and Diversion Structures | 209 | ||||||
| 18.6.1 Water Management | 213 | |||||||
| 18.6.2 Groundwater | 213 | |||||||
| 18.6.3 Surface Water Takings | 213 | |||||||
| 18.6.4 Water Treatment and Disposal Requirements | 213 | |||||||
| 18.7 | Waste Disposal and Management Systems | 214 | ||||||
| 18.7.1 Solid Waste | 214 | |||||||
| 18.7.2 Recyclable Materials | 214 | |||||||
| 18.7.3 Liquid Waste | 214 | |||||||
| 18.7.4 Hazardous Waste | 215 | |||||||
| 18.7.5 Sanitary Waste | 215 | |||||||
| 18.8 | Power and Electrical | 215 | ||||||
| 18.8.1 Facility Power Supply | 215 | |||||||
| 18.8.2 Site Power Reticulation | 217 | |||||||
| 18.8.3 Power and Electrical Contingency Planning | 220 | |||||||
| 18.9 | Highway 101 Relocation | 220 | ||||||
| 18.10 | Fuel | 222 | ||||||
| 18.11 | Hazard Considerations | 222 | ||||||
| 18.12 | Comments on Project Infrastructure | 222 | ||||||
| 19 |
Market Studies and Contracts | 223 | ||||||
| 19.1 | Market Studies | 223 | ||||||
| 19.2 | Gold Price Projections | 223 | ||||||
| 19.3 | Foreign Exchange Assumptions | 224 | ||||||
| 19.4 | Contracts | 224 | ||||||
| 19.5 | Comments on Market Studies and Contracts | 225 | ||||||
| 20 |
Environmental Studies, Permitting, and Social or Community Impact | 226 | ||||||
| 20.1 | Environmental Studies | 226 | ||||||
| 20.1.1 Baseline Environmental Studies | 226 | |||||||
| 20.1.2 Geochemical Characterization Studies | 227 | |||||||
| 20.2 | Environmental Management Considerations | 228 | ||||||
| 20.2.1 Tailings, Mine Rock and Overburden Disposal and Monitoring | 228 | |||||||
| 20.2.2 Water Management | 229 | |||||||
| 20.2.3 Monitoring during Operations and Closure | 231 | |||||||
| 20.3 | Permitting Considerations and Regulatory Framework | 233 | ||||||
| 20.3.1 Provincial EA Requirements | 234 | |||||||
| Fenn-Gib Gold Project |
Page vii | |
| NI 43-101 Technical Report and Pre-Feasibility Study |
December 19, 2025 | |
|
|
| 20.3.2 Federal Impact Assessment Requirements | 235 | |||||||
| 20.3.3 Other Approval Requirements | 235 | |||||||
| 20.4 | Social and Community Considerations | 236 | ||||||
| 20.5 | Closure and Reclamation Plans | 236 | ||||||
| 20.5.1 Closure Cost Estimates | 239 | |||||||
| 20.6 | Comments on Environmental Studies, Permitting and Social and Community Considerations | 239 | ||||||
| 21 |
Capital and Operating Costs | 241 | ||||||
| 21.1 | Introduction | 241 | ||||||
| 21.2 | Capital Costs | 241 | ||||||
| 21.2.1 Overview | 241 | |||||||
| 21.2.2 Basis of Estimate | 242 | |||||||
| 21.2.3 Estimate Methodology | 242 | |||||||
| 21.2.4 Area 1000 - Mine Capital Costs | 246 | |||||||
| 21.2.5 Area 2000 and 3000 - Process Plant Capital Costs | 249 | |||||||
| 21.2.6 Area 4000 - On-Site Infrastructure Capital Costs | 250 | |||||||
| 21.2.7 Area 5000 - Off-Site Infrastructure Capital Costs | 251 | |||||||
| 21.2.8 Areas 6000, 7000, 8000 & 9000 - Indirect Capital Costs | 251 | |||||||
| 21.2.9 Closure Costs | 255 | |||||||
| 21.2.10 Exclusions | 256 | |||||||
| 21.3 | Operating Costs | 256 | ||||||
| 21.3.1 Overview | 256 | |||||||
| 21.3.2 Basis of Estimate | 257 | |||||||
| 21.3.3 Mine Operating Costs | 257 | |||||||
| 21.3.4 Process Operating Costs | 266 | |||||||
| 21.3.5 General and Administrative Operating Costs | 270 | |||||||
| 21.4 | Comments on Capital and Operating Costs | 272 | ||||||
| 22 |
Economic Analysis | 273 | ||||||
| 22.1 | Forward-Looking Information | 273 | ||||||
| 22.2 | Methodologies Used | 275 | ||||||
| 22.3 | Financial Model Parameters | 275 | ||||||
| 22.3.1 Taxes | 276 | |||||||
| 22.3.2 Working Capital | 276 | |||||||
| 22.3.3 Closure Costs | 276 | |||||||
| 22.3.4 Royalties | 276 | |||||||
| 22.4 | Economic Analysis | 276 | ||||||
| 22.5 | Sensitivity Analysis | 280 | ||||||
| Fenn-Gib Gold Project |
Page viii | |
| NI 43-101 Technical Report and Pre-Feasibility Study |
December 19, 2025 | |
|
|
| 23 |
Adjacent Properties | 281 | ||||||
| 24 |
Other Relevant Data and Information | 282 | ||||||
| 24.1 | Overview | 282 | ||||||
| 24.2 | Project Execution Plan (PEP) | 282 | ||||||
| 24.3 | Project Schedule Overview | 283 | ||||||
| 24.3.1 Integrated Project Schedule | 284 | |||||||
| 24.4 | Operational Readiness Planning | 287 | ||||||
| 24.5 | Potential Upside Opportunities Outside of the PFS | 287 | ||||||
| 24.5.1 Processing Plant and Mine Plan Concepts | 287 | |||||||
| 24.5.2 Potential Future Toll Milling Agreements at the Fenn-Gib Mill | 288 | |||||||
| 24.5.3 South Block Exploration Potential | 289 | |||||||
| 24.5.4 Regional Growth Opportunities | 289 | |||||||
| 25 |
Interpretation and Conclusions | 291 | ||||||
| 25.1 | Introduction | 291 | ||||||
| 25.2 | Mineral Tenure, Surface Rights, Water Rights, Royalties and Agreements | 291 | ||||||
| 25.3 | Geology and Mineralization | 291 | ||||||
| 25.4 | Exploration and Drilling | 292 | ||||||
| 25.5 | Metallurgical Testwork | 292 | ||||||
| 25.6 | Mineral Resource Estimate | 292 | ||||||
| 25.7 | Factors That May Affect the Mineral Resource Estimate | 293 | ||||||
| 25.8 | Mineral Reserve Estimate | 293 | ||||||
| 25.9 | Mining Methods | 294 | ||||||
| 25.10 | Process Plant | 295 | ||||||
| 25.11 | Infrastructure | 296 | ||||||
| 25.12 | Markets and Contracts | 297 | ||||||
| 25.13 | Environmental, Permitting and Social Considerations | 297 | ||||||
| 25.13.1 Environmental, Permitting and Social Considerations Conclusion | 298 | |||||||
| 25.14 | Capital Cost Estimate | 298 | ||||||
| 25.15 | Operating Cost Estimate | 298 | ||||||
| 25.16 | Economic Analysis | 299 | ||||||
| 25.17 | Risks and Opportunities | 299 | ||||||
| 25.17.1 Risks | 299 | |||||||
| 25.17.2 Opportunities | 301 | |||||||
| 26 |
Recommendations | 303 | ||||||
| 26.1 | Introduction | 303 | ||||||
| 26.2 | Drilling | 303 | ||||||
| 26.3 | Mining and Geology | 303 | ||||||
| Fenn-Gib Gold Project |
Page ix | |
| NI 43-101 Technical Report and Pre-Feasibility Study |
December 19, 2025 | |
|
|
| 26.4 | Plant Design | 304 | ||||||
| 26.5 | Metallurgical Testwork | 304 | ||||||
| 26.6 | Tailings Storage Facility and Water Management | 304 | ||||||
| 26.7 | Geotechnical and Site Investigations | 305 | ||||||
| 26.8 | Infrastructure Design | 305 | ||||||
| 26.9 | Environmental Studies, Project Approvals and Community Engagement | 305 | ||||||
| 26.10 | Construction Control Estimate | 305 | ||||||
| 26.11 | Estimated Total Cost | 305 | ||||||
| 27 |
References | 306 | ||||||
List of Tables
| Table 1-1: |
Mineral Resource Estimate | 7 | ||||
| Table 1-2: |
Fenn-Gib Proven and Probable Mineral Reserves - December 19, 2025 | 8 | ||||
| Table 1-3: |
Capital Cost Estimate | 13 | ||||
| Table 1-4: |
Operating Cost Summary | 14 | ||||
| Table 1-5: |
Economic Analysis Summary Table | 16 | ||||
| Table 1-6: |
After-Tax Sensitivity Analysis | 18 | ||||
| Table 1-7: |
Recommended Work Program | 21 | ||||
| Table 2-1: |
Report Contributors | 23 | ||||
| Table 2-2: |
Abbreviations and Acronyms | 25 | ||||
| Table 2-3: |
Units of Measurement | 27 | ||||
| Table 4-1: |
Mineral Tenure Table | 32 | ||||
| Table 4-2: |
Summary of Mining Patents | 39 | ||||
| Table 6-1: |
Exploration History | 49 | ||||
| Table 6-2: |
LSG and Tahoe Exploration Activities | 50 | ||||
| Table 10-1: |
Drill Summary Table | 61 | ||||
| Table 10-2: |
Significant Drill Hole Intersections | 66 | ||||
| Table 13-1: |
Metallurgical Testwork Summary Table | 93 | ||||
| Table 13-2: |
Gravity Separation Testwork Summary | 94 | ||||
| Table 13-3: |
Comminution Test Results | 97 | ||||
| Table 13-4: |
Concentrate Regrinding-Regrind Mill Slurry Viscosity Measurements | 105 | ||||
| Table 13-5: |
Acid-Base Accounting Test | 106 | ||||
| Table 13-6: |
Metallurgical Sample Details | 107 | ||||
| Table 13-7: |
Comminution Testing Sample Details | 108 | ||||
| Table 14-1: |
Geology Black Model Codes and Descriptions | 113 | ||||
| Table 14-2: |
Assigned Density Values | 113 | ||||
| Fenn-Gib Gold Project |
Page x | |
| NI 43-101 Technical Report and Pre-Feasibility Study |
December 19, 2025 | |
|
|
| Table 14-3: |
Capping Analysis Summary | 115 | ||||
| Table 14-4: |
Correlogram Parameters | 121 | ||||
| Table 14-5: |
Block Model Workspace | 122 | ||||
| Table 14-6: |
Interpolation Parameters by Domain Code | 122 | ||||
| Table 14-7: |
Special Models | 123 | ||||
| Table 14-8: |
Grade Comparison by Interpolation Method | 126 | ||||
| Table 14-9: |
Pit Design Criteria | 130 | ||||
| Table 14-10: |
Mineral Resource Table | 131 | ||||
| Table 15-1: |
Fenn-Gib Proven and Probable Mineral Reserves — December 19, 2025 | 133 | ||||
| Table 15-2: |
Pit Optimization — General Parameters | 134 | ||||
| Table 15-3: |
Production Schedule — Proven and Probable Mineral Reserves | 140 | ||||
| Table 15-4: |
Fenn-Gib Proven and Probable Mineral Reserves - December 19th, 2025 | 141 | ||||
| Table 16-1: |
Overall Slope Angle Estimation | 147 | ||||
| Table 16-2: |
Pit Slope Parameters | 149 | ||||
| Table 16-3: |
Open Pit Model Framework | 151 | ||||
| Table 16-4: |
Open Pit Model Item Descriptions | 151 | ||||
| Table 16-5: |
Pit Limit Analysis Parameters | 154 | ||||
| Table 16-6: |
Nested Pit Shell Results | 156 | ||||
| Table 16-7: |
Haul Ramp Width Calculation | 160 | ||||
| Table 16-8: |
Fenn-Gib Pit Inventory (By Phase) | 162 | ||||
| Table 16-9: |
Waste Material Storage Locations and Designed Volumes | 169 | ||||
| Table 16-10: |
LOM Production Schedule | 171 | ||||
| Table 17-1: |
Process Design Criteria | 189 | ||||
| Table 17-2: |
Reagent Requirements, Purpose and Consumption | 197 | ||||
| Table 17-3: |
Power Requirement by Plant Area | 198 | ||||
| Table 18-1: |
Project Building List | 204 | ||||
| Table 19-1: |
November 2025 Consensus Commodity Price | 223 | ||||
| Table 19-2: |
November 2025 Consensus Foreign Exchange Assumptions | 224 | ||||
| Table 20-1: |
List of Permits/Approvals (Initial Draft) Anticipated for the Project | 233 | ||||
| Table 21-1: |
Capital Cost Estimate | 241 | ||||
| Table 21-2: |
Estimate Exchange Rates | 242 | ||||
| Table 21-3: |
WBS Level 2 | 244 | ||||
| Table 21-4: |
Mining Capital Costs | 246 | ||||
| Table 21-5: |
Mine Equipment on Site | 247 | ||||
| Table 21-6: |
Capital Cost Estimate Summary - Process Plant | 249 | ||||
| Table 21-7: |
On-Site Infrastructure Capital Costs | 250 | ||||
| Table 21-8: |
Off-Site Infrastructure Capital Costs | 251 | ||||
| Table 21-9: |
Indirect Capital Costs | 252 | ||||
| Table 21-10: |
Closure Costs | 255 | ||||
| Table 21-11: |
Operating Cost Summary | 256 | ||||
| Fenn-Gib Gold Project |
Page xi | |
| NI 43-101 Technical Report and Pre-Feasibility Study |
December 19, 2025 | |
|
|
| Table 21-12: |
Mine Staffing Requirements included in Labour Cost (Year 4) | 257 | ||||
| Table 21-13: |
Hourly Manpower Requirements included in Labour Cost (Year 4) | 258 | ||||
| Table 21-14: |
Major Equipment Operating Costs-No labour ($/h) | 260 | ||||
| Table 21-15: |
Drill Pattern Specifications | 261 | ||||
| Table 21-16: |
Drill Productivity Criteria | 261 | ||||
| Table 21-17: |
Design Powder Factors | 262 | ||||
| Table 21-18: |
Loading Equipment Parameters | 262 | ||||
| Table 21-19: |
Support Equipment Operating Factors | 263 | ||||
| Table 21-20: |
Total Open Pit Mine Operating Cost Estimate-With Leasing | 265 | ||||
| Table 21-21: |
Process Plant Operating Cost Summary | 266 | ||||
| Table 21-22: |
Reagent and Consumables Cost Summary | 266 | ||||
| Table 21-23: |
Process Plant Maintenance Cost Summary | 267 | ||||
| Table 21-24: |
Process Plant Power Cost Summary | 268 | ||||
| Table 21-25: |
Process Plant Staffing Plan included in Labour Cost | 269 | ||||
| Table 21-26: |
G&A Expenses Summary | 271 | ||||
| Table 21-27: |
G&A Staffing Plan included in Labour Cost | 271 | ||||
| Table 22-1: |
Economic Analysis Summary Table | 276 | ||||
| Table 22-2: |
Cashflow Statement on an Annualized Basis | 279 | ||||
| Table 22-3: |
After-Tax Sensitivity Analysis | 280 | ||||
| Table 25-1: |
Mineral Resource Table | 292 | ||||
| Table 25-2: |
Fenn-Gib Proven and Probable Mineral Reserves | 294 | ||||
| Table 25-3: |
Risks-Environmental, Permitting, and Social Considerations | 300 | ||||
| Table 25-4: |
Opportunities-Environmental, Permitting, and Social Considerations | 301 | ||||
| Table 26-1: |
Recommended Work Program | 303 | ||||
List of Figures
| Figure 1-1: |
Plan View of Mineralized Envelopes | 4 | ||||
| Figure 1-2: |
After-Tax Cash Flow | 18 | ||||
| Figure 1-3: |
High-Level Schedule from FEED through to Commercial Production | 20 | ||||
| Figure 4-1: |
Location Map, Fenn-Gib Property | 30 | ||||
| Figure 4-2: |
Location of Surface Rights | 41 | ||||
| Figure 4-3: |
Fenn-Gib Royalties | 43 | ||||
| Figure 6-1: |
Geological Map Illustrating Mineral Showings (historic claim block outline) | 48 | ||||
| Figure 7-1: |
Regional Geology Plan | 53 | ||||
| Figure 7-2: |
Project Geology Plan | 55 |
| Fenn-Gib Gold Project |
Page xii | |
| NI 43-101 Technical Report and Pre-Feasibility Study |
December 19, 2025 | |
|
|
| Figure 9-1: |
Targets for Further Exploration Location Map | 60 | ||||
| Figure 10-1: |
Drill Collar Location Plan | 62 | ||||
| Figure 11-1: |
Core Storage Yard, Matheson, Ontario | 75 | ||||
| Figure 11-2: |
Control Chart-Blank Material | 80 | ||||
| Figure 11-3: |
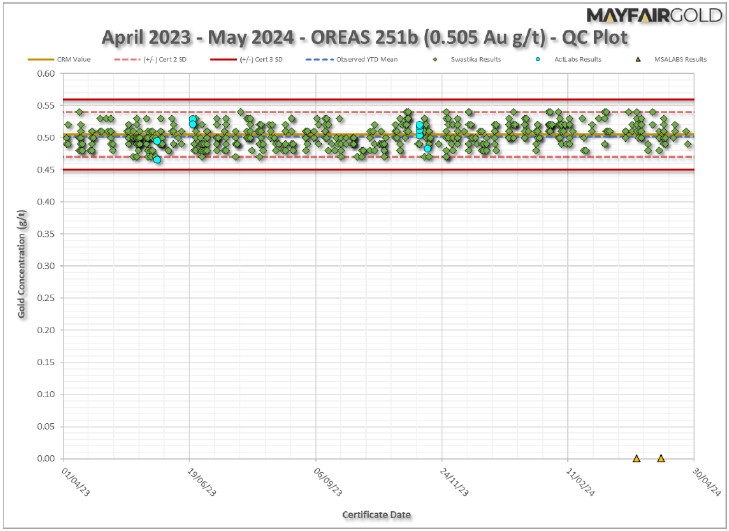
Control Chart-CRM OREAS 251b | 82 | ||||
| Figure 11-4: |
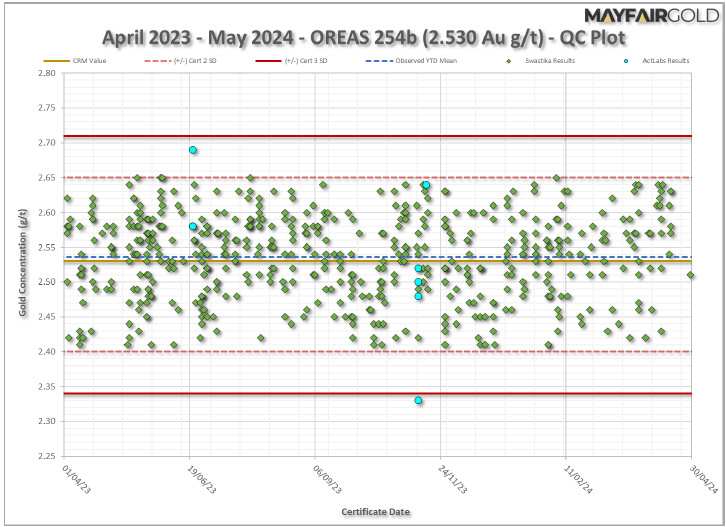
Control Chart-CRM OREAS 254b | 83 | ||||
| Figure 11-5: |
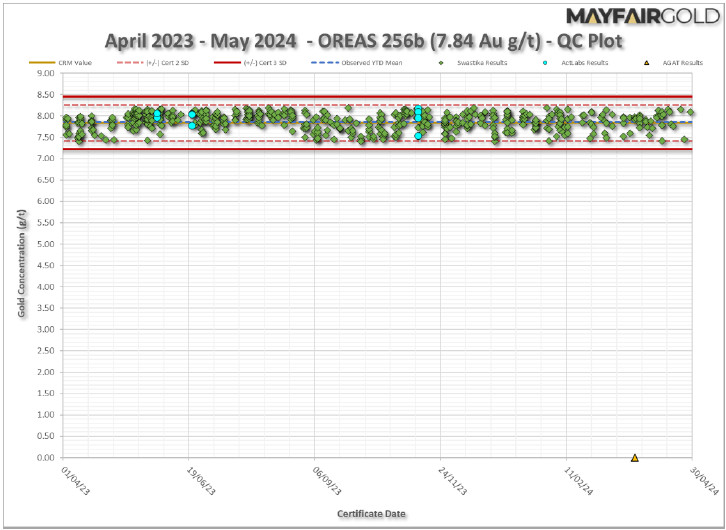
Control Chart-CRM OREAS 256b | 84 | ||||
| Figure 11-6: |
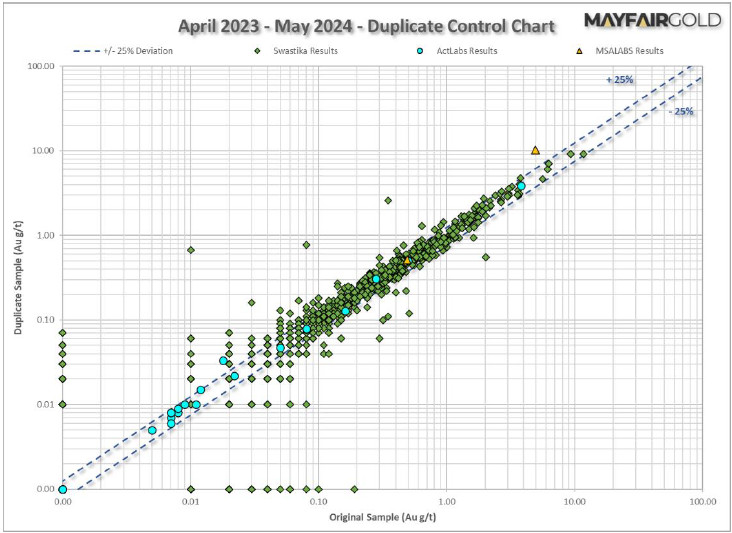
Control Chart-Duplicate Samples | 86 | ||||
| Figure 11-7: |
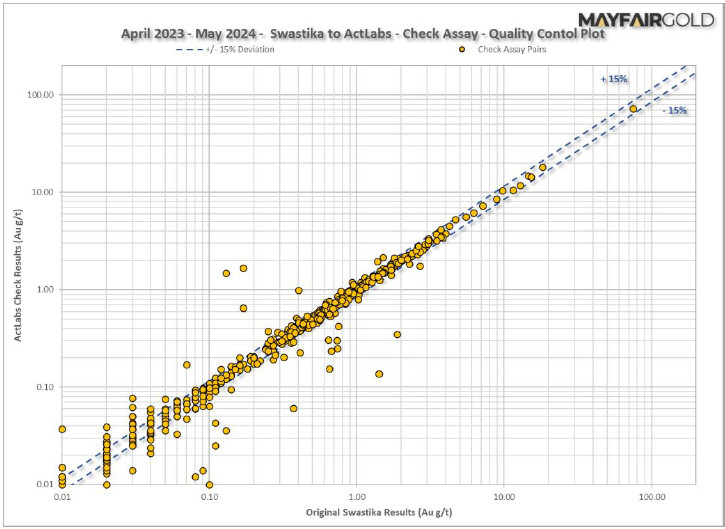
Control Chart-Check Assays, Swastika vs. ActLabs | 87 | ||||
| Figure 11-8: |
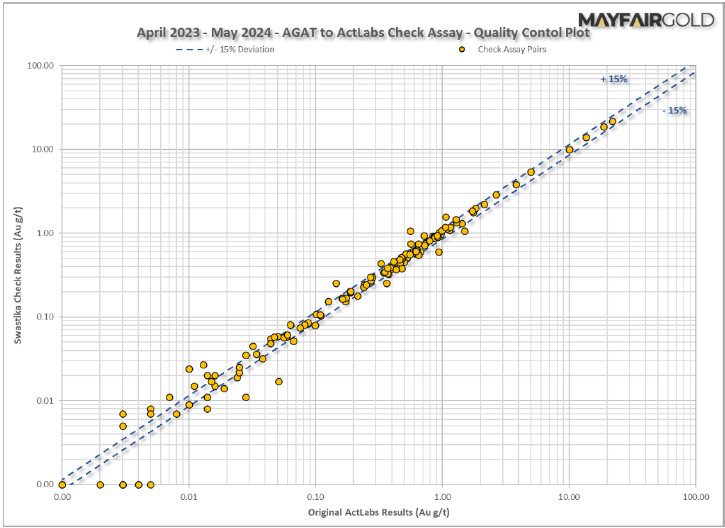
Control Chart-Check Assays, AGAT vs. ActLabs | 88 | ||||
| Figure 12-1: |
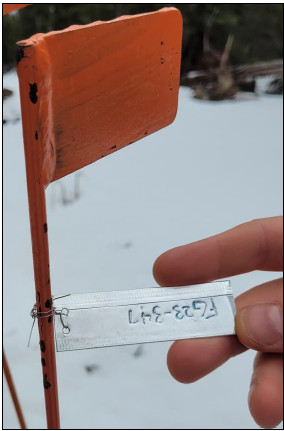
Collar Labelling, FG23-347 | 91 | ||||
| Figure 13-1: |
Spatial Variability of Comminution Samples | 98 | ||||
| Figure 13-2: |
Rougher Concentrate Gold and Sulphide Recovery as a Function of Flotation Feed Grind Size | 99 | ||||
| Figure 13-3: |
Gold and Sulphide Recovery to Rougher Concentrate as a Function Rougher Concentrate Mass Recovery (Pull) | 100 | ||||
| Figure 13-4: |
Rougher Flotation Kinetics | 101 | ||||
| Figure 13-5: |
Gold Leach Extraction and Gold Leach Residue as a Function of Grind Size | 103 | ||||
| Figure 13-6: |
Rougher Concentrate Leach Extraction as a Function of Time | 104 | ||||
| Figure 13-7: |
Concentrate Regrind-HIGmill Specific Grinding Energy kWh/t | 105 | ||||
| Figure 13-8: |
Modelled Gold Recovery as a Function of Gold Head Grade | 110 | ||||
| Figure 14-1: |
Plan View of Drill Hole Traces and Interpreted Geological Block Models | 112 | ||||
| Figure 14-2: |
Boxplot of Uncapped Gold Grades (g/t) by Domain Code | 114 | ||||
| Figure 14-3: |
Log Probability Plot, Deformation Zone (Au g/t) | 116 | ||||
| Figure 14-4: |
Log Probability Plot, Main Zone (Au g/t) | 117 | ||||
| Figure 14-5: |
1.5 m Composites Reported by Domain Code, Capped Au (g/t) | 118 | ||||
| Figure 14-6: |
5 m Composites Reported by Domain Code, Capped Au (g/t) | 119 | ||||
| Figure 14-7: |
5180 Elevation, Composites versus Block Model (Capped Au g/t) | 125 | ||||
| Figure 14-8: |
East 558500, Composites versus Block Model (Capped Au g/t) | 126 | ||||
| Figure 14-9: . |
Swath Plot of NN and OK Mean Block Model Gold Grades with Mean Composite Gold Grade (g/t) | 128 | ||||
| Figure 14-10: |
Swath Plot of IDW2 and OK Mean Block Model Gold Grades with Mean Composite Gold Grade (g/t) | 129 | ||||
| Figure 15-1: |
Fenn-Gib Ultimate Pit Design with Phases | 137 | ||||
| Figure 15-2: |
Ultimate and Intermediate Pit Phase Limits (Representative Cross-section) 7h | 138 | ||||
| Figure 15-3: |
Fenn-Gib Mine Schedule | 139 | ||||
| Figure 16-1: |
Sectors for the Design Recommendations | 146 | ||||
| Figure 16-2: |
Pit-by-Pit Graph | 157 | ||||
| Figure 16-3: |
Pit Slope Design Terminology | 158 | ||||
| Figure 16-4: |
Haul Ramp Design Section, Double Lane | 159 | ||||
| Figure 16-5: |
Haul Ramp Design Section, Single Lane | 159 | ||||
| Fenn-Gib Gold Project |
Page xiii | |
| NI 43-101 Technical Report and Pre-Feasibility Study |
December 19, 2025 | |
|
|
| Figure 16-6: |
Ultimate Pit Design | 161 | ||||
| Figure 16-7: |
Ultimate Pit Design against RF=0.55 Pit Shell (Section View) | 162 | ||||
| Figure 16-8: |
Fenn-Gib Phases | 163 | ||||
| Figure 16-9: |
Phase 1 | 164 | ||||
| Figure 16-10: |
Phase 2 | 165 | ||||
| Figure 16-11: |
Phase 3 | 166 | ||||
| Figure 16-12: |
Phase 1N | 167 | ||||
| Figure 16-13: |
Phase 1E | 168 | ||||
| Figure 16-14: |
Mill Feed, Waste Tonnage and Au Grade by Year Graph | 172 | ||||
| Figure 16-15: |
Material Mined by Year | 173 | ||||
| Figure 16-16: |
Material Mined by Phase by Year Graph | 173 | ||||
| Figure 16-17: |
End-of-Year Progression Plan-Year-1 | 175 | ||||
| Figure 16-18: |
End-of-Year Progression Plan-Year 1 | 176 | ||||
| Figure 16-19: |
End-of-Year Progression Plan, Year 2 | 177 | ||||
| Figure 16-20: |
End-of-Year Progression Plan, Year 3 | 178 | ||||
| Figure 16-21: |
End-of-Year Progression Plan, Year 4 | 179 | ||||
| Figure 16-22: |
End-of-Year Progression Plan, Year 5 | 180 | ||||
| Figure 16-23: |
End-of-Year Progression Plan, Year 6 | 181 | ||||
| Figure 16-24: |
End-of-Year Progression Plan, Year 7 | 182 | ||||
| Figure 16-25: |
End-of-Year Progression Plan, Year 8 | 183 | ||||
| Figure 16-26: |
End-of-Year Progression Plan, Year 9 | 184 | ||||
| Figure 16-27: |
End-of-Year Progression Plan, Year 10 | 185 | ||||
| Figure 16-28: |
End-of-Year Progression Plan, Year 15 (Ultimate Pit) | 186 | ||||
| Figure 17-1: |
Overall Process Flow Diagram | 191 | ||||
| Figure 18-1: |
Preliminary Facilities and Infrastructure Layout | 201 | ||||
| Figure 18-2: |
Infrastructure Plan for the Fenn-Gib Project | 202 | ||||
| Figure 18-3: |
Site General Arrangement | 207 | ||||
| Figure 18-4: |
Typical TSF Embankment Section | 208 | ||||
| Figure 18-5: |
TSF Filling Schedule | 209 | ||||
| Figure 18-6: |
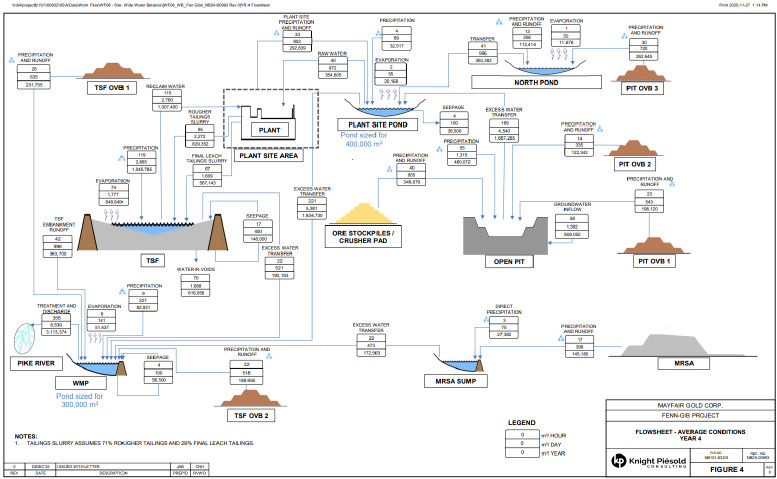
Preliminary Water Balance at Year 4 of Operations | 211 | ||||
| Figure 18-7: |
Preliminary Water Balance at Year 16 of Operations | 212 | ||||
| Figure 18-8: |
Power Supply Alternatives Study Routes to the Fenn-Gib Gold Project Site | 216 | ||||
| Figure 18-9: |
Proposed 27.6kV Power Supply Line from Ramore TS to the Fenn-Gib Gold Project Site | 218 | ||||
| Figure 18-10: |
Fenn-Gib Gold Project Site Single Line Diagram | 219 | ||||
| Figure 18-11: |
Highway 101 Realignment Alternatives | 221 | ||||
| Figure 20-1: |
Closure Arrangement | 231 | ||||
| Figure 20-2: |
Closure Arrangement | 238 | ||||
| Figure 22-1: |
After-Tax Cash Flow | 278 | ||||
| Figure 24-1: |
High-Level Schedule from FEED through to Commercial Production | 286 | ||||
| Fenn-Gib Gold Project |
Page xiv | |
| NI 43-101 Technical Report and Pre-Feasibility Study |
December 19, 2025 | |
|
|
| 1 | SUMMARY |
| 1.1 | Introduction |
Mayfair Gold Corp. (“Mayfair”) commissioned Ausenco Engineering Canada ULC (“Ausenco”) to compile a Pre-Feasibility Study (“PFS”) for the Fenn-Gib Gold project.
The responsibilities of the engineering companies who were contracted by Mayfair to prepare this report are as follows:
| | Ausenco managed and coordinated the report preparation, developed the PFS-level design and cost estimate for the process plant and general site infrastructure, and completed the economic analysis. |
| | T. Maunula & Associates Consulting Inc. (“TMAC”) completed the work related to property description, accessibility, local resources, geological setting, deposit type, exploration works, drilling and developed the mineral resource estimate for the project. |
| | AGP Mining Consultants Inc. (“AGP”) designed the open pit mine, ore stockpiles, mine rock storage areas (“MRSA”), mine production schedule, and mine capital and operating costs. |
| | Knight Piésold Ltd. (“KP”) completed geotechnical studies, site wide water balancing, and developed the PFS-level design and cost estimate of the tailings storage facility (“TSF”) and water management infrastructure, environment and permitting considerations and closure cost estimate. |
| | Ecometrix Inc. an Egis Group Company (“Ecometrix”) completed work related to geochemistry. |
This technical report summarizes the results of the PFS and presents the latest mineral resource and mineral reserve estimates for the Fenn-Gib property. The technical report outlines the development of an open pit mine, processing facilities and related infrastructure both on site and off site.
This technical report was prepared pursuant to the requirements of Canadian National Instrument 43-101 (“NI 43-101”). The reported mineral resource and mineral reserve estimates in this technical report were prepared in accordance with the guidelines of the Canadian Institute of Mining, Metallurgy and Petroleum (CIM) Standards (2014) on Mineral Resources and Reserves, Definitions and Guidelines (2019).
| 1.2 | Terms of Reference |
This report supports the disclosure in Mayfair’s news release title “Mayfair Delivers Robust Pre-Feasibility Study for the Fenn-Gib Gold Project” dated January 8, 2026.
All measurement units used in this report are metric. All costs are in Canadian dollars and stated on a 100% project ownership basis unless otherwise noted.
| Fenn-Gib Gold Project |
Page 1 | |
| NI 43-101 Technical Report and Pre-Feasibility Study |
December 19, 2025 | |
|
|
As of the effective date of this report, the authors of this report are not aware of any known litigation potentially affecting the project. The qualified persons (“QPs”), as defined in NI 43-101, did not verify the legality or terms of any underlying agreement(s) that may exist concerning the project ownership, permits, off-take agreements, license agreements, royalties or other agreement(s) between Mayfair and any third parties.
The opinions in this report are based on information collected during investigations by the QPs, which in turn reflects various technical and economic conditions at the time of writing. Given the nature of the mining business, these conditions can change significantly over relatively short periods of time. Consequently, actual results can be significantly more or less favourable.
| 1.3 | Property Description and Location |
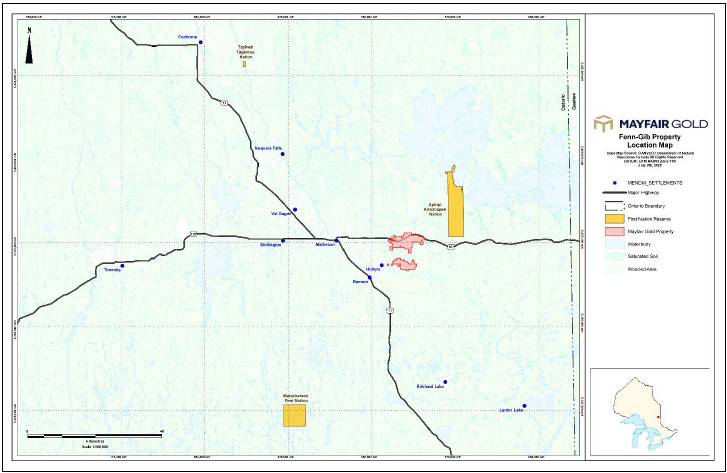
The Fenn-Gib Gold project is in Guibord and Munro Townships in northeast Ontario. The Project is 43 kilometers (“km”) northwest of Kirkland Lake and 17 km east of Matheson, south of Abitibi Lake. The property center is at UTM 17N 559078 5374037 (NAD 83) or 48°31’ N 80°12’ W. The Project is accessible year-round by Highway 101, which passes through the Project. Highway 101 connects with the Trans-Canada Highway at Matheson. The nearest airport is located 20 km north of Timmins, which itself is 80 km from the property. The Project is in a very mining-friendly jurisdiction amongst dozens of historical mines and several active mines between Rouyn and Timmins gold-mining camps.
| 1.4 | Mineral Tenure, Royalties and Agreements |
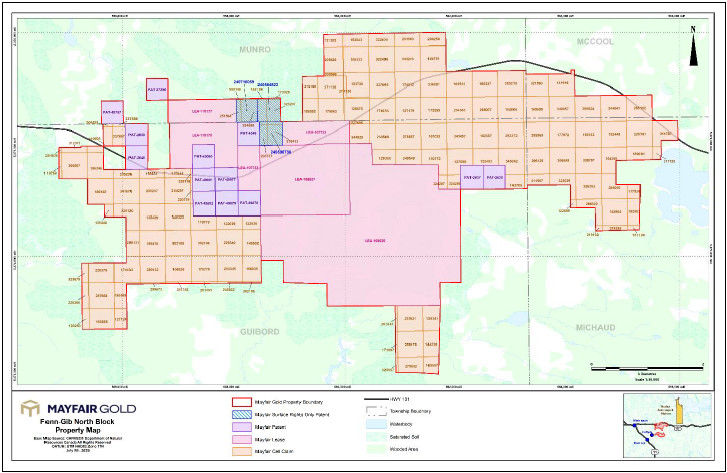
Mayfair Gold owns a 100% interest in 21 fee simple patented properties, 145 unpatented mining claims, and six mining lease properties in the Guibord, Munro, Michaud, and McCool Townships in northeast Ontario, Canada (collectively, the Fenn-Gib Project) that cover 1,877.8 hectares (“ha”). Lake Shore Gold Corp. (“LSG”) agreed to sell the Project to Mayfair Gold pursuant to an asset purchase agreement dated June 8, 2020.
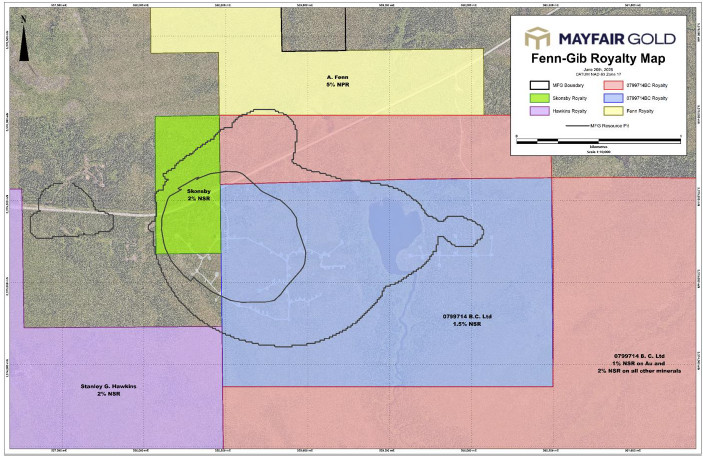
Upon closing the acquisition of the Fenn-Gib Project, Mayfair Gold granted LSG a 1% net smelter return (“NSR”) royalty. This royalty was later sold to Metalla Royalty and Streaming Ltd. Additionally Barrick Gold Corporation retains a back-in right to acquire a 51% interest in certain claims by reimbursing Mayfair Gold for twice its expenditures on the property. This right becomes effective if a NI 43-101 technical report confirms a mineral resource of at least 5 million ounces (“Moz”) of gold on the specified claims and will expire on August 18, 2032.
| 1.5 | History |
From its initial discovery and work in 1911 the Fenn-Gib Property has been explored and developed by various operators, including Pangea Goldfields Incorporated, LSG, and Tahoe Resources Inc. (“Tahoe”).
In 2011, LSG completed a program of eight drill holes, three of which were twins used for verification purposes. In addition, SGS Canada Inc. (SGS) (2011) authored an NI 43-101 technical report and mineral resource estimate (MRE).
During 2012, exploration activities conducted on the Fenn-Gib Property in the southwest half of Lot 5 Concession VI consisted of LSG’s drilling contractors, Norex Drilling Ltd., completing 34 diamond drill holes (“DDH”) totalling 15,802 meters (“m”). Reconnaissance mapping and prospecting were also carried out on both the North and South claim blocks during 2012.
| Fenn-Gib Gold Project |
Page 2 | |
| NI 43-101 Technical Report and Pre-Feasibility Study |
December 19, 2025 | |
|
|
During 2014, LSG carried out outcrop investigations and prospecting consisting of 14 samples.
During 2017, Tahoe conducted a surface-definition diamond drilling program on the Fenn-Gib deposit, which included 98 holes for a total of 40,235 m. After 2017, Tahoe completed no further exploration activities or drilling at Fenn-Gib.
| 1.6 | Geology and Mineralization |
The Project is in the southern portion of the Abitibi Subprovince, which is part of the Superior Province of the Canadian Shield. The Abitibi Subprovince is principally composed of volcanic and sedimentary assemblages that have generally been metamorphosed to greenschist facies and intruded by late tectonic plutons of tonalite and trondhjemite affinity.
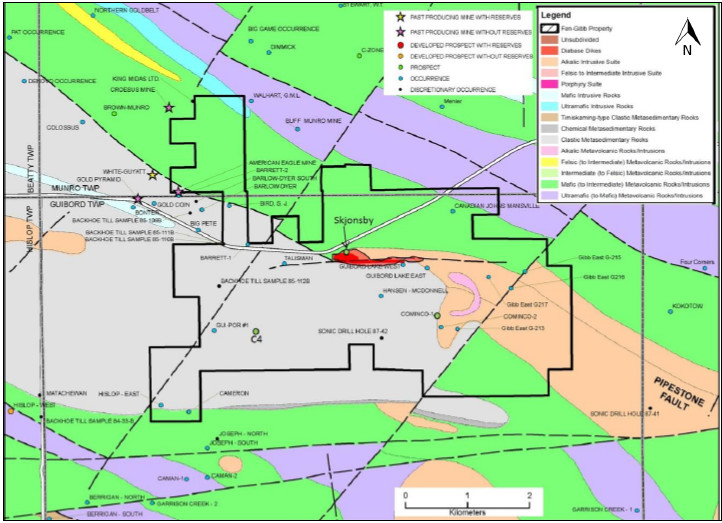
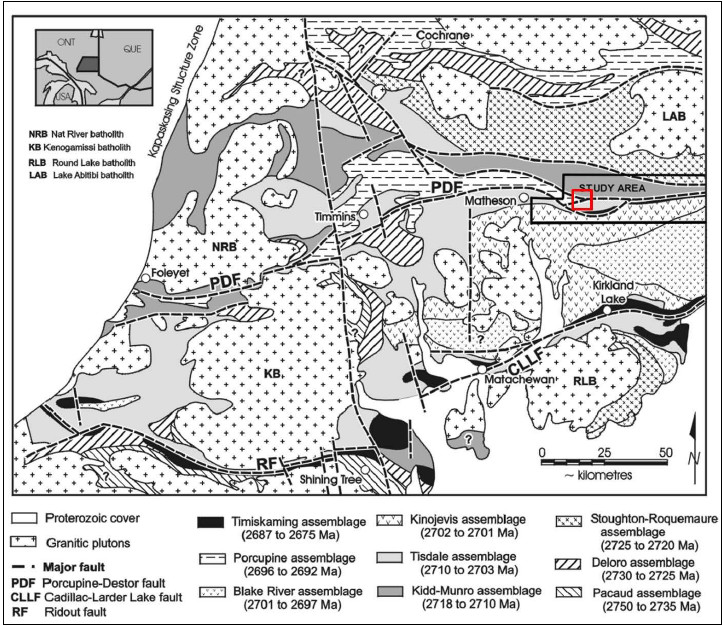
The Project is underlain by the dominantly volcanic Kidd-Munro assemblage to the north and the dominantly sedimentary Hoyle assemblage to the south. Within the vicinity of the Project, the Porcupine-Destor Fault Zone occurs as a Z-shaped sigmoidal structure that splits into three branches. Both extremities of the Z-shaped structure are east-west trending, while the central portion is more southeasterly trending.
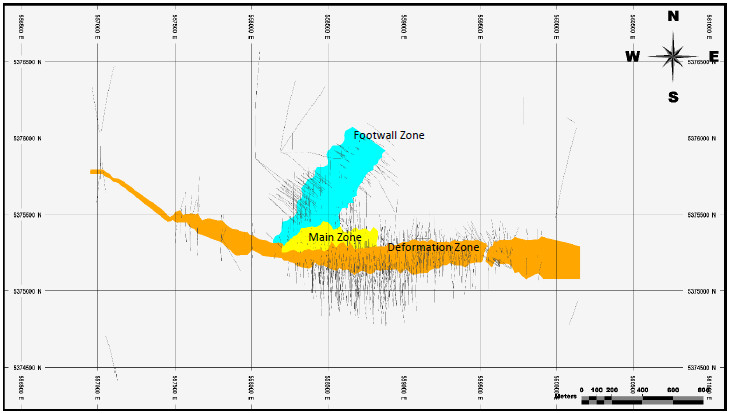
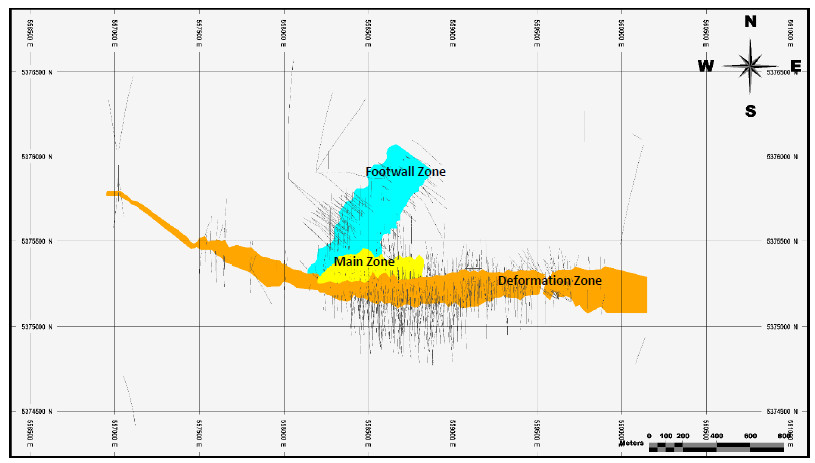
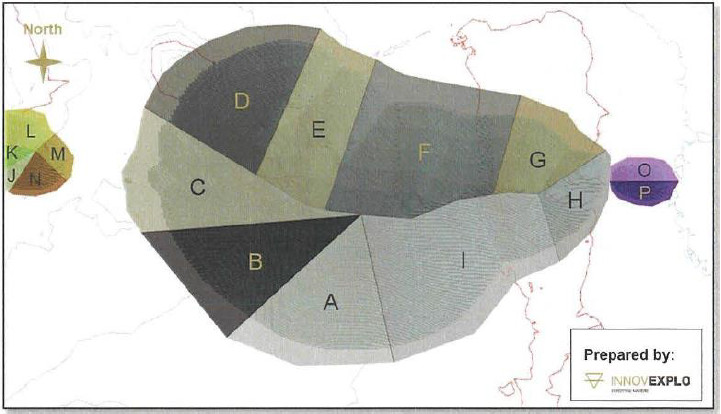
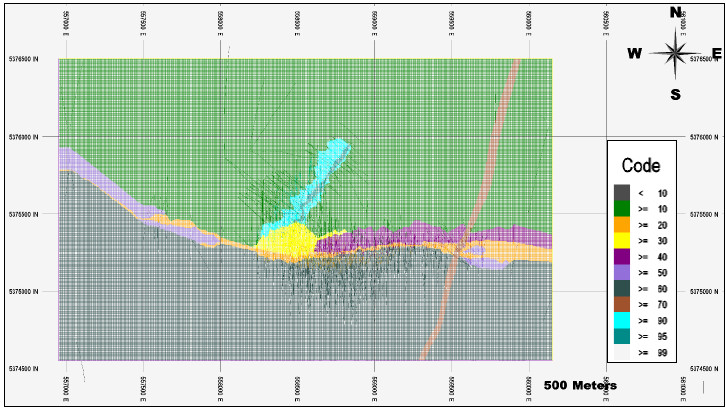
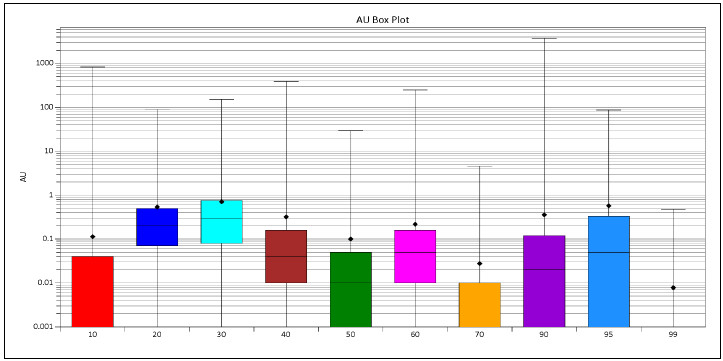
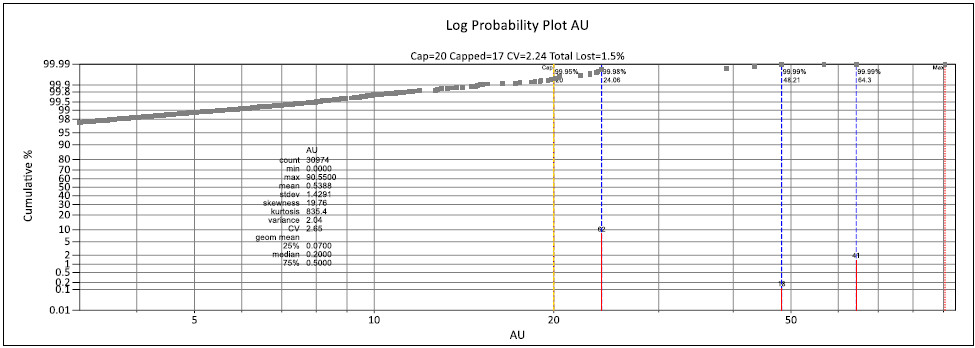
Significant concentrations of gold mineralization on the Project primarily occur within two zones: (1) the Main Zone, and (2) the Deformation Zone. These two zones overlap and are shown in Figure 1-1. The third zone, Footwall Zone, also contains gold mineralization and is approximately 100 m north of the Main Zone.
The Main Zone is a broad zone of disseminated gold mineralization up to 500 m wide, with grades for gold between 0.50 and 3.00 grams per tonne (“g/t”) Au. Massive, pillowed, and variolitic basalts crop out and can be seen in diamond drill core from holes collared near Highway 101. Hydrothermally altered variolitic basalts are the principal hosts of the Main Zone mineralization. These basalts were affected by pervasive and vein silicification, carbonatization, albitization, pervasive but weak hematization, and vein sericitization. Syenite and lamprophyre dykes intruded the basalts and are locally mineralized. Pyrite is the main sulphide mineral and occurs as disseminations and in veins, locally up to 50%, over narrow intervals (average 5% to 10%).
| Fenn-Gib Gold Project |
Page 3 | |
| NI 43-101 Technical Report and Pre-Feasibility Study |
December 19, 2025 | |
|
|
| Figure 1-1: | Plan View of Mineralized Envelopes |
Source: TMAC, 2024
The Deformation Zone contains narrower and higher-grade intersections associated with altered sediments, intermediate dykes, and grey syenite. Gold mineralization is associated with pyrite either in quartz-healed breccias or as very fine disseminations. The Contact Fault has been interpreted to have acted as a channel for gold-bearing hydrothermal fluids and is host to the Deformation Zone and the southern boundary of the Main Zone. The Deformation Zone mineralization has been defined for approximately 2.0 km along strike.
The Footwall Zone is north of the Main Zone (Figure 1-1). The Footwall Zone structural and mineralized corridor strikes in a north-easterly direction and drilling has intercepted the zone over a strike length of approximately 500 m to a vertical depth of about 600 m below surface (open in all directions). The Footwall Zone consists of multiple mineralized zones hosted primarily in the footwall mafic volcanic assemblage, with a steep northerly dip. Mineralization consists of bleached, buff-altered (silica-albite-sericite-carbonate alteration), pillowed mafic volcanic with pyrite ranging from 2% to over 20%.
| Fenn-Gib Gold Project |
Page 4 | |
| NI 43-101 Technical Report and Pre-Feasibility Study |
December 19, 2025 | |
|
|
| 1.7 | Deposit Types |
Gold deposits within the Abitibi-Greenstone Belt, part of the Abitibi Subprovince, occur in four principal types as identified by Robert and Poulsen (1997) and Berger and Amelin (1998). These include synvolcanic and synsedimentary deposits, syenite-associated deposits, syntectonic mesothermal vein deposits, and remobilized post-tectonic vein deposits. Synvolcanic deposits, such as the Horne Deposit in Quebec, are associated with volcanogenic massive sulphide systems and ocean-floor alteration, while synsedimentary processes contributed to gold localization at deposits like Aunor and Dome in the Timmins camp. Syenite-associated deposits, exemplified by Kerr-Addison and Holt McDermott, are spatially related to syntectonic plutons intruded near regional shear zones, with mineralizing fluids interpreted as magmatic in origin; the Fenn-Gib Deposit is best represented by this model. Mesothermal vein deposits, including Camflo and Sigma, formed syntectonically from deep crustal metamorphic fluids along active shear zones during orogenesis. A fourth type, represented by the Croesus Mine near Fenn-Gib, comprises late-stage quartz veins formed by remobilization of gold-bearing fluids along north-south fractures. Literature suggests at least three phases of gold introduction in the Abitibi: early synvolcanic and synsedimentary events, intrusion-related mineralization, and a final metamorphism-related phase (Dubé & Mercier-Langevin, 2020).
| 1.8 | Exploration |
Exploration conducted by Mayfair Gold since 2021 includes helicopter-towed magnetic surveys, surface geochemical sampling programs (MMI and SGH), direct current (“DC”) resistivity-induced polarization surveys, and LiDAR acquisition. These programs have expanded the understanding of mineralization on the property and identified additional exploration targets for future work.
Exploration conducted by Mayfair Gold since 2021 includes:
| | SHA Geophysics Ltd. (SHA) carried out a Heli-GT helicopter-towed, three-axis magnetic gradiometer survey over the North and South property blocks in 2021 (Munroe, 2021). |
| | Surface work on the North Block included an orientation soil and vegetation sample mobile-metal-ion (MMI) and soil-gas hydrocarbons (SGH) test sampling program during 2022 (Aurora Geosciences, 2023). |
| | Aurora conducted a DC resistivity-induced polarization (IP) survey for the Company on the North Block’s Grid A and Grid B of the Project in 2022 and 2023 (Jelenic, 2023). |
In 2022, a LiDAR survey and aerial photography acquisition over both the Fenn-Gib Gold project North and South Blocks was contracted to McElhanney (2022).
| 1.9 | Drilling |
The Company acquired a 100% interest in the Fenn-Gib Property on December 31, 2020, and in mid-January 2021 commenced infill and expansion resource drilling on the Fenn-Gib Deposit on the North Block. As of June 20, 2025, the Company has completed approximately 190,000 m in 339 drill holes.
| Fenn-Gib Gold Project |
Page 5 | |
| NI 43-101 Technical Report and Pre-Feasibility Study |
December 19, 2025 | |
|
|
| 1.10 | Mineral Processing and Metallurgical Testwork |
Metallurgical studies associated with the Fenn-Gib Gold project include recent efforts of Mayfair Gold (2022-2025), and earlier programs conducted by LSG (2014 -2015) and Tahoe (2017-2018). The objective of the various testwork programs was to provide sufficient metallurgical data to support the design of an optimal process to produce doré bars, for refining by others. The metallurgical testing was conducted on composite samples, over a range in head grade from 0.2 to 19.1 g/t Au and 0.3 to 8.1% S2-. Composite sample selection is representative of the range in gold grade, sulphide content, and lithology with a focus on the ore expected during the life-of-mine open pit phases.
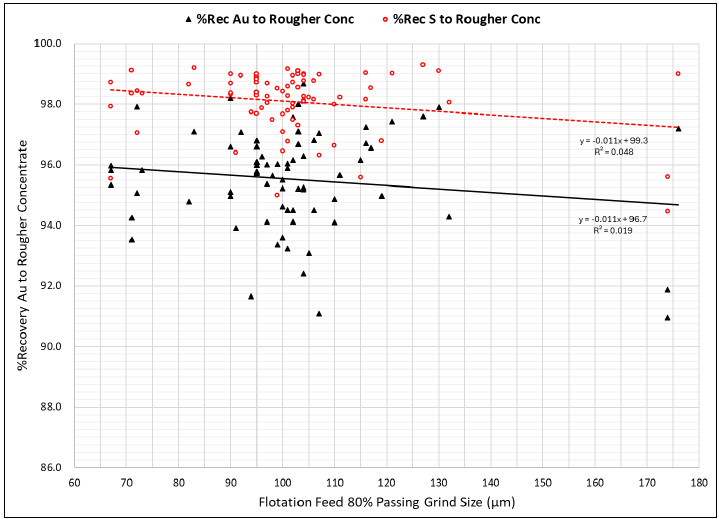
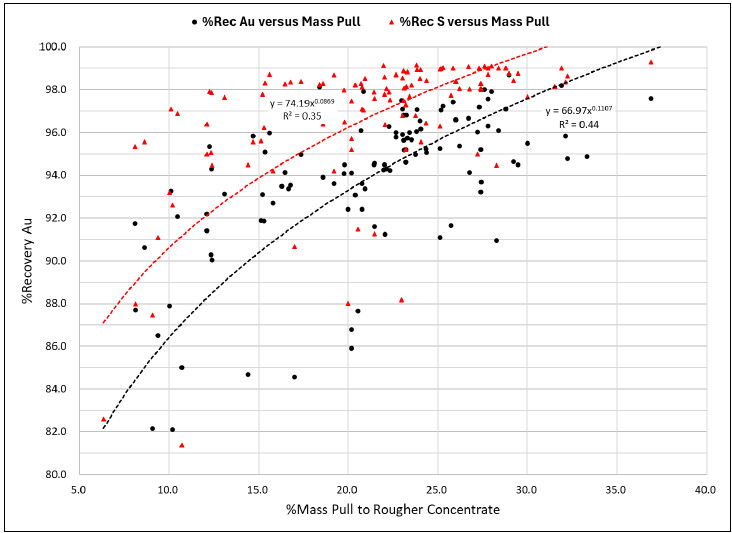
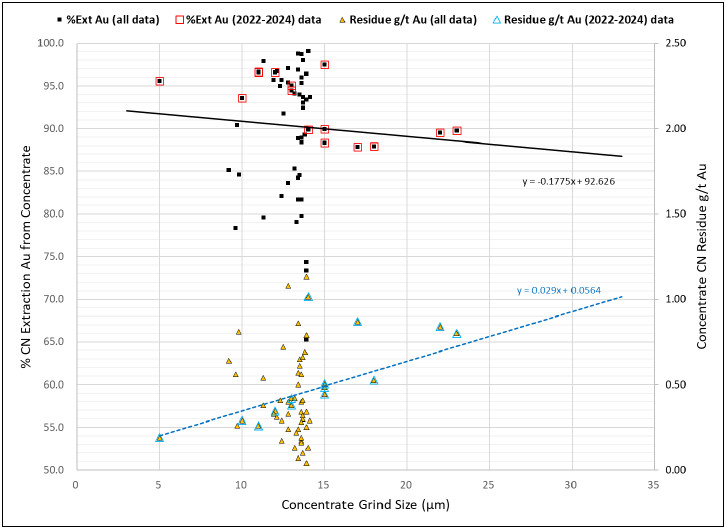
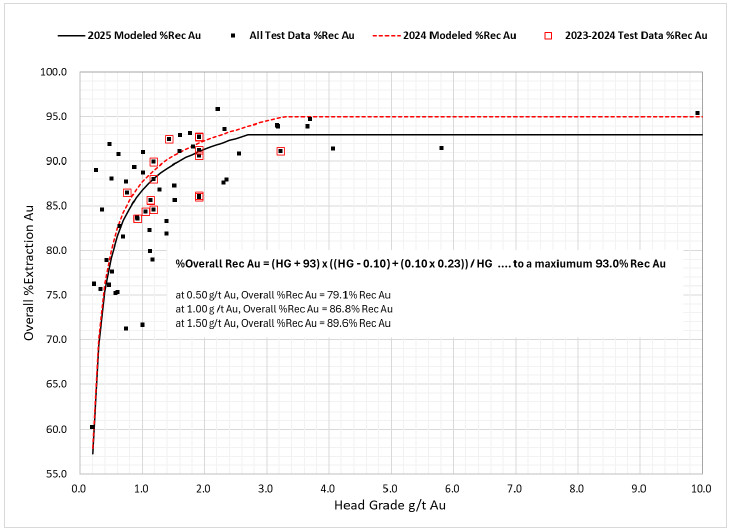
The PFS metallurgical testwork program concluded the optimum recovery process is crushing and grinding, followed by flotation, concentrate regrind and cyanidation of the rougher concentrate. The target primary 80% passing grind size (P80) was determined to be 106 µm, with a 23 to 25% rougher flotation mass recovery, yielding a maximum 97% Au recovery to a rougher concentrate. The concentrate regrind target P80 selected was 13 µm, achieving an average leach extraction of 96% Au for an estimated overall 89.6% Au recovery at a 1.5 g/t Au feed grade.
Comprehensive comminution testing was completed on ten composites, considering crusher work index, JKTech Axb rock competency, semi-autogenous grinding (“SAG”), SAG Power Index (“SPI”), Bond ball mill work index, and abrasion index. This work confirmed the mineralized material processed in the early production years to be relatively hard and competent, with a design Axb of 22.7.
Gravity concentration is included in the process design as a provisional allowance; however, the gravity circuit will not be included in the initial project. Provision for this circuit will be incorporated into the process and construction designs to allow for future installation as part of sustaining capital, should the presence of sufficient coarse free gold suitable for gravity concentration be confirmed.
The metallurgical testwork completed is sufficient to inform the development of design criteria for crushing, grinding, flotation, concentrate regrinding and cyanidation of the reground concentrate to produce doré bullion.
| 1.11 | Mineral Resource Estimate |
Mr. Tim Maunula, P.Geo., Principal Geologist, of TMAC, is the QP responsible for completing the Project’s MRE.
The MRE incorporates extensive drill hole data from surface diamond drill programs combining both historical drilling completed prior to 2017 and Mayfair Gold’s drilling campaigns completed from 2021-2024. The cut-off date for assay data used in the 2024 MRE was April 30, 2024. All data received were in NAD 83 UTM coordinates (Zone 17).
The MRE was:
| | prepared using Hexagon Mining, HxGN MinePlan 16.2.1 (MinePlan) |
| | classified according to the CIM Definition Standards |
| | reported at a 0.3 g/t Au cut-off grade, which is amenable to open pit extraction. |
| Fenn-Gib Gold Project |
Page 6 | |
| NI 43-101 Technical Report and Pre-Feasibility Study |
December 19, 2025 | |
|
|
The MRE for the Project is based on diamond drill hole data consisting of gold assays, geological descriptions, and density measurements.
The drill-hole database for the MRE used 457 historical drill holes (140,283 m) and 291 Mayfair Gold drill holes, which together yielded 217,334 assays used in the MRE.
The primary gold mineralization for the Project was modelled in three domains: Main Zone, Deformation Zone, and Footwall Zone (which included a Footwall Zone High Grade). However, gold mineralization is also contained within the other contiguous geological domains: mafic volcanics, pyroxenite, ultramafic volcanics, and sediments (Section 14.4). Mayfair Gold modelled the rock type groups using Datamine Studio EM (“Datamine”). The QP reviewed and validated these wireframes for use in the MRE. Gold grades were estimated separately by rock type within each domain.
The Fenn-Gib block model was estimated using three interpolation methods: nearest neighbour (“NN”), inverse distance weighting squared (“IDW2”), and ordinary kriging (OK). Uncapped and capped gold grades were estimated for the OK model. Only capped gold grades were estimated for the NN and IDW2 models.
The Fenn-Gib Gold project hosts mineral resources at a 0.3 g/t Au cut-off grade comprised of an indicated resource of 181.3 million tonnes (“Mt”) grading 0.74 g/t Au for 4.3 million contained gold ounces plus an additional Inferred Resource of 8.9 Mt at 0.49 g/t Au containing 141,000 gold ounces. Table 1-1 presents the MRE reported within a constraining resource pit shell and categorized by resource classification. The MRE has an effective date of September 3, 2024, and was prepared by QP Tim Maunula, P.Geo. Mineral resources that are not mineral reserves do not have demonstrated economic viability.
| Table 1-1: | Mineral Resource Estimate |
| Resource Category |
Cut-Off (Au g/t) |
Tonnes (t) |
Au (g/t) |
Au (oz) |
||||||||||||
| Indicated |
0.3 | 181,302,000 | 0.74 | 4,313,000 | ||||||||||||
| Inferred |
0.3 | 8,921,000 | 0.49 | 141,000 | ||||||||||||
Notes:
| 1. | Effective date of this updated MRE is September 3, 2024. The assay cut-off date for drill holes included in the mineral resource was April 30, 2024. |
| 2. | All mineral resources have been estimated in accordance with the CIM Definitions Standards, as required under National Instrument (NI) 43-101. Mineral resource statement prepared by Tim Maunula, P.Geo. in accordance with NI 43-101. |
| 3. | Mineral resources reported demonstrate reasonable prospect of eventual economic extraction, as required under NI 43-101. Mineral resources are not mineral reserves and do not have demonstrated economic viability. The mineral resources may be materially affected by environmental, permitting, legal, marketing, and other relevant issues. |
| 4. | Mineral resources are reported at a cut-off grade of 0.30 g/t Au for an open-pit mining scenario using a 50° pit slope angle. Cut-off grades are based on a price of US$2,000/oz gold, and an open pit mining cost of $3.25/t, process cost of $15.50/t and G&A $2.00/t. Metallurgical recovery of 94% was used. Densities were assigned based on interpreted lithology. |
| 5. | Troy ounce = tonnes x grade/31.10348. All numbers have been rounded to reflect the relative accuracy of the estimate. |
| 6. | The quantity and grade of reported inferred resources are uncertain in nature and there has not been sufficient work to define these inferred resources as indicated or measured resources. It is reasonably expected that many of the inferred mineral resources could be upgraded to Indicated mineral resources with continued exploration. |
| 7. | Tonnages and ounces in the tables are rounded to the nearest thousand. Numbers may not total due to rounding. |
| Fenn-Gib Gold Project |
Page 7 | |
| NI 43-101 Technical Report and Pre-Feasibility Study |
December 19, 2025 | |
|
|
| 1.12 | Mineral Reserve Estimate |
The reserves for the Fenn-Gib Gold project are based on the conversion of the indicated mineral resources in the study mine plan within the ultimate open pit limits. No measured mineral resources are within the ultimate pit design. The level of information from drill holes and degree of certainty on assumptions used by the mine plan estimates provides reasonable support to classify Indicated mineral resources conversion directly to probable reserves.
The total mineral reserve for the Fenn-Gib Gold project is shown in Table 1-2.
| Table 1-2: | Fenn-Gib Proven and Probable Mineral Reserves - December 19, 2025 |
| Reserve Class |
Process Feed (Mt) |
Grade Au (g/t) |
Contained Gold Moz |
|||||||||
| Proven |
— | — | — | |||||||||
| Probable |
25.13 | 1.29 | 1.04 | |||||||||
|
|
|
|
|
|
|
|||||||
| Total Reserves |
25.13 | 1.29 | 1.04 | |||||||||
|
|
|
|
|
|
|
|||||||
Note:
| 1. | This mineral reserve estimate has an effective date of December 19, 2025 |
| 2. | The mineral reserve estimation was completed under the supervision of Gordon Zurowski, P.Eng. of AGP Mining Consultants Inc., who is a QP as defined under NI 43-101 |
| 3. | Mineral reserves are stated within the ultimate design pit based on: |
| a. | US$1,750/ounce gold price |
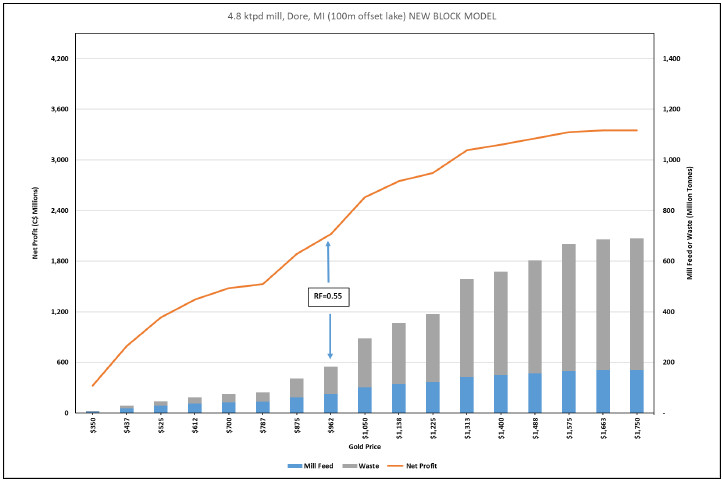
| b. | Pit Limit corresponds to a pit shell with a revenue factor of 0.55, corresponding to a US$962 /ounce gold price |
| c. | An elevated cut-off grade of 0.80 g/t Au for all pit phases |
| d. | Preliminary mining cost assumptions of C$3.24/tonne mined of waste, C$3.23/tonne mined of ore, with an incremental mining cost of C$0.02/tonne/5m bench mined below the 5,310 m elevation |
| e. | Preliminary processing cost assumptions of C$14.50/tonne processed, general & administration assumption of C$2.10/tonne processed, and stockpile rehandle cost assumption of C$1.00/tonne processed |
| f. | Preliminary process recovery assumptions of 92.6% for gold |
| g. | An exchange rate of C$1.35 equal to US$1.00 |
| h. | The preliminary economic, cost and recovery assumptions used at the time of mine planning and reserve estimation may not necessarily conform to those stated in the economic model |
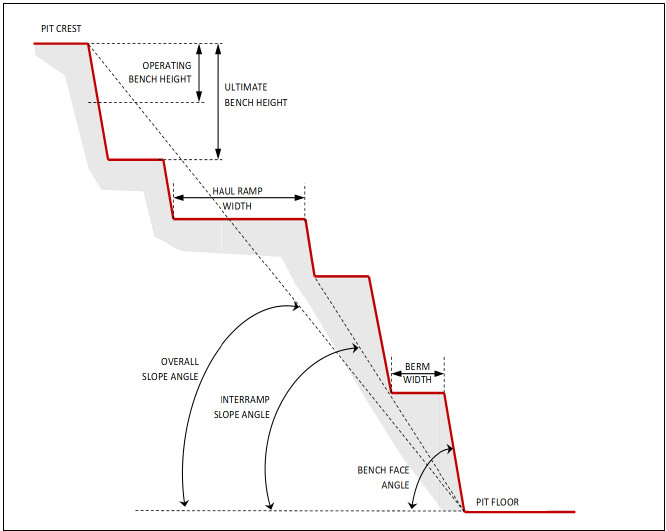
| 4. | Pit slope inter-ramp slope angle assumptions ranged from 28 - 65° and overall slope angles ranging from 21 - 51° |
The QP has not identified any known legal, political, environmental, or other risks that would materially affect the potential development of mineral reserves.
Technical risks that have been identified as potentially affecting the mineral reserves include mining selectivity near the ore contacts, slope stability, and assumed process recoveries for given rock types. These are considered manageable risks that will be mitigated as more testwork and operating experience is obtained.
| Fenn-Gib Gold Project |
Page 8 | |
| NI 43-101 Technical Report and Pre-Feasibility Study |
December 19, 2025 | |
|
|
| 1.13 | Mining Methods |
The PFS mine plan is based on open pit mining. With current metal pricing levels, knowledge of the mineralization, grade tenor, grade distribution and proximity to surface open pit mining offers the most reasonable approach for development.
A main pit with three phases together with two smaller satellite pits will provide the open pit feed material necessary to maintain the process plant feed rate at 4,800 tonnes/day (“t/d”). The main pit is proposed as a three-phase design using 5 m benches in ore which provides 25.1 Mt of mill feed grading 1.29 g/t Au. Waste from this pit will total 151.9 Mt for a strip ratio of 6.0:1.0 (waste: mill feed).
The mill feed cut-off is 0.80 g/t Au. During the mine operation minimal material will be stockpiled (0.8 Mt) and only at the beginning of the mine life when ore is encountered during the pre-stripping operation. This will be reclaimed in Year 1.
The pit phases are scheduled to provide 4,800 t/d of feed to the mill over a 14.5-year mining life after one year of pre-production stripping. The pits are sequenced to minimize initial stripping and provide higher feed grades in the early years of mine life while assisting in the construction of the tailings management facility.
The main fleet will consist of three 165 millimeter (“mm”) down the hole drills, two 16 m3 diesel hydraulic shovels and one 13 m3 front end loader. Another 13 cubic meters (“m3”) loader will be at the crusher and can be used in the pit as needed. The truck fleet will total 8 - 92-t trucks at the peak of mining. They will deliver waste material for tailings facility construction. There is also a smaller fleet of two articulated trucks and two 63-tonne trucks for tailings facility maintenance and lift development. The usual assortment of dozers, graders, small backhoes, and other support equipment is considered in the equipment cost estimate.
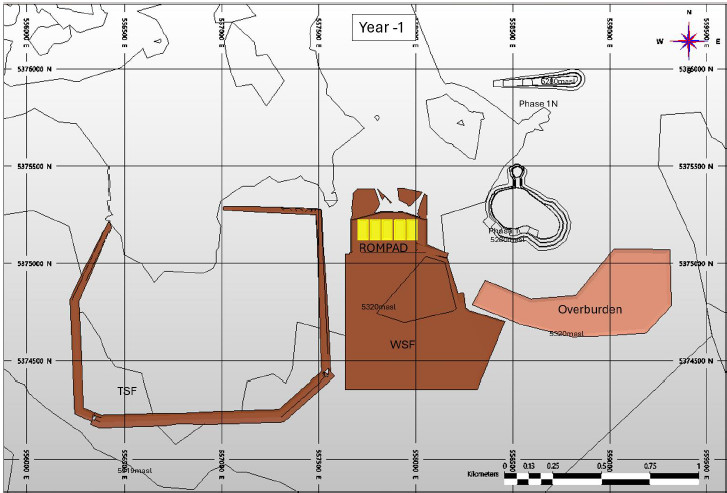
Year -1 is the start of major mining activity using the mining equipment and the site infrastructure (roads, highway relocation, pads, etc.) are in place. The early phases will provide the highest grade to the mill in the first six years in the schedule. The open pit will be in operation until the middle of Year 15.
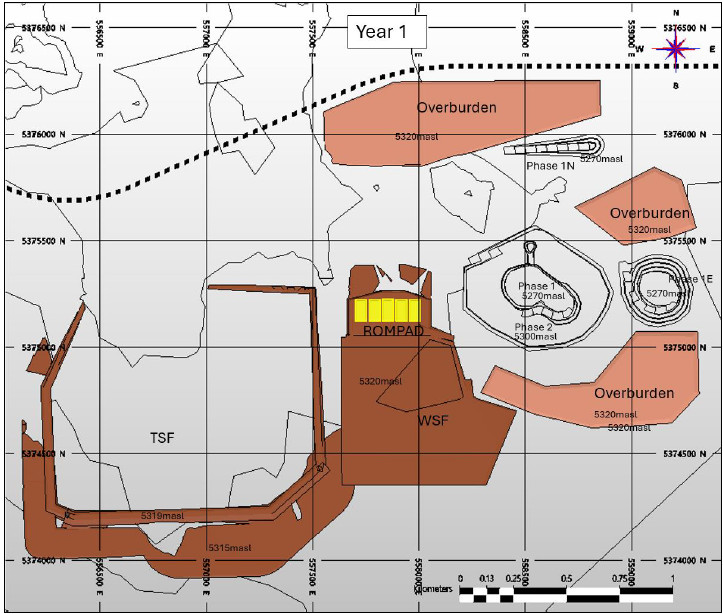
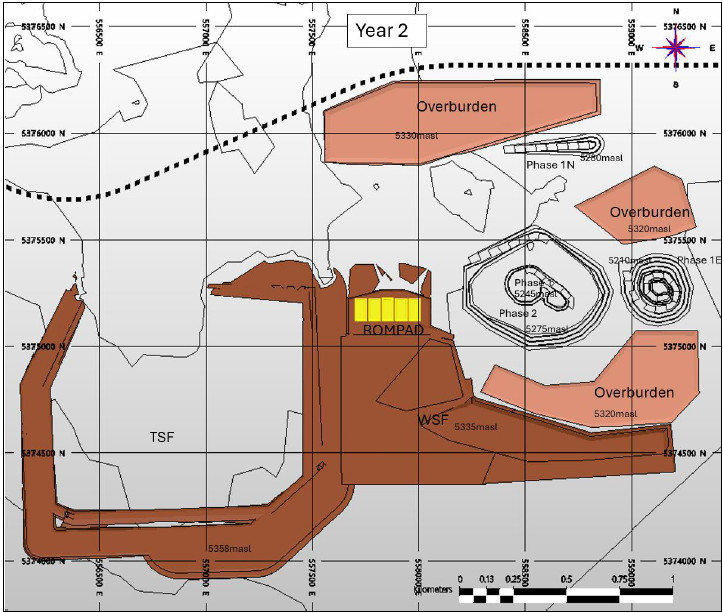
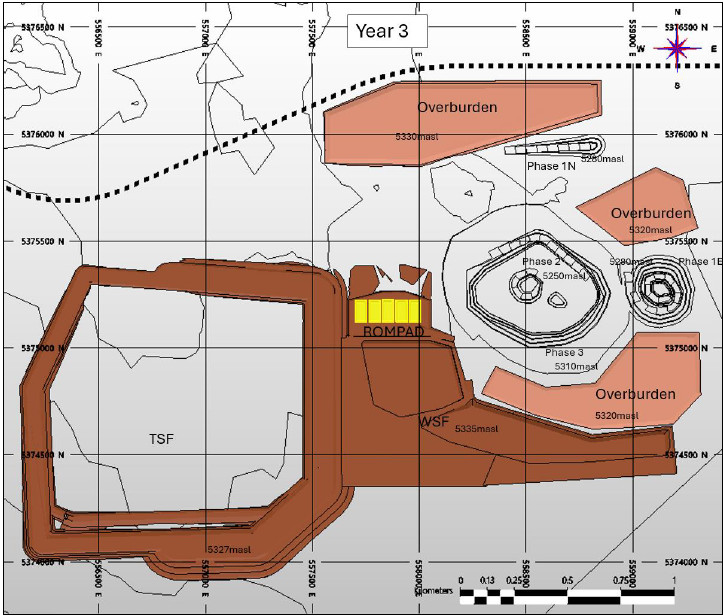
Waste material from the pit will be used in the construction of the TSF with excess going into the various MRSA and overburden stockpiles. As the MRSA advances upwards, re-sloping of the sides will be occurring to allow for concurrent reclamation and reducing the visual impact of the facility.
In addition to the main open pit, two satellite pits will be mined and these will be used for water storage and diversion later in the mine life. The Phase 1N pit will be used to provide rock material for various mine infrastructure including haul roads, and pads as needed.
| 1.14 | Recovery Methods |
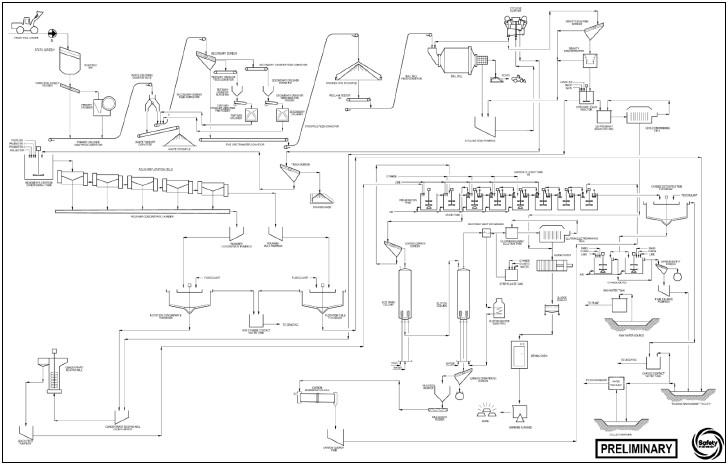
Development of the process flowsheet for the Fenn-Gib Gold project is based on metallurgical test work described in Section 13. Crushing and grinding followed by sulphide flotation, rougher concentrate regrinding and cyanidation, carbon adsorption, desorption and regeneration, with cyanide detox of the CIL tailings. Gravity concentration may be included in the flowsheet as a sustaining capital project.
| Fenn-Gib Gold Project |
Page 9 | |
| NI 43-101 Technical Report and Pre-Feasibility Study |
December 19, 2025 | |
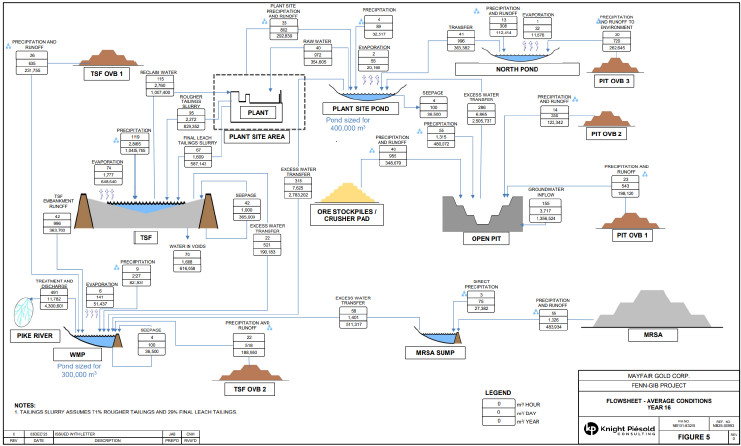
|
|
The process flowsheet consists of the following circuits:
| | Three-stage crushing of run-of-mine (“ROM”) ore. |
| | A diverter chute to allow for crushing of waste rock for on-site construction purposes, including the TSF. |
| | A crushed ore stockpile to provide 24 hours live capacity head of the grinding circuit. |
| | Ball mill with trommel screen and cyclone classification yielding an 80% passing 106 µm flotation feed. |
| | Provision for future installation of gravity concentration and intensive leaching of the gravity concentrate. |
| | Sulphide and fine free gold flotation yielding a rougher concentrate. |
| | Flotation concentrates dewatering and regrinding yielding an 80% passing 13 µm concentrate for cyanidation. |
| | Cyanidation and carbon in leach (“CIL”) adsorption of the reground rougher concentrate. |
| | Acid washing of loaded carbon and AARL carbon stripping followed by EW and refining to produce doré bullion. |
| | Carbon regeneration. |
| | Cyanide destruction of CIL tailings using the SO2/air process. |
| | Process water management. |
| | Tailings disposal. |
| 1.15 | Project Infrastructure |
The Fenn-Gib Gold project infrastructure plan encompasses all major facilities required for mine development, processing, and support operations. Key components include the following:
| | Mine and Process Facilities: An open pit, process plant (including crushing facilities, stockpile covers, reagent warehouse), and mine maintenance facilities (truck shop, wash bay, and warehouses). Essential buildings will be constructed on-site, while non-essential services are planned to be in Matheson. |
| | Site Access: The project is accessible via Highway 101, with connections to the Trans-Canada Highway and Ontario Northland Rail Line. Timmins Airport provides regional air service. |
| | Highway 101 Relocation: A 5 km segment of Highway 101 will be realigned to maintain safe separation from the ultimate open pit footprint. Three alignment alternatives were evaluated; the preferred option is included in the PFS design to be constructed following the initial construction phase. The timing will be re-evaluated with the next phase of work and will be pending the approvals associated with this scope. |
| | Tailings and Waste Management: A paddock-style TSF designed for co-disposal of tailings and PAG mine rock, with staged construction and integrated water reclaim systems. Non-PAG mine rock and overburden from the open pit will be used to construct perimeter embankments. A mine rock storage area and overburden stockpiles are included to store mine rock and overburden not utilized for embankment construction. |
| Fenn-Gib Gold Project |
Page 10 | |
| NI 43-101 Technical Report and Pre-Feasibility Study |
December 19, 2025 | |
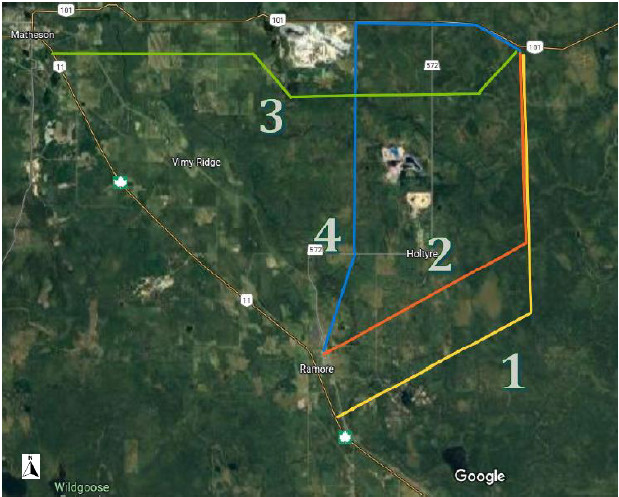
|
|
| | Water Management: Systems include runoff and seepage collection, water management ponds, and a Water Treatment Plant with discharge to Pike River (subject to permitting). A site-wide water balance has been developed with calibration of the model to continue with future site investigations and ongoing site monitoring. |
| | Power Supply: The site requires approximately 16 megawatt (“MW”). The preferred option is a Hydro One grid connection via a 27.6 kilovolt (“kV”) line from Ramore TS, with contingency plans for temporary on-site generation should the connection schedule be delayed. |
| | Fuel and Utilities: Dedicated fuel storage facilities will comply with provincial standards. Potable water will be sourced from a domestic well and treated on-site. |
| | Accommodation: A temporary construction camp for an estimated peak loading of approximately 400 personnel will be located off-site in Matheson; no operations camp is planned. |
| 1.16 | Market Studies and Contracts |
Long-term metal price assumptions and foreign exchange rates (C$/US$) were provided by CIBC Global Mining Group and reviewed by the QP indicate that the gold price and foreign exchange rate used in the financial analysis are appropriate and the Fenn-Gib produced gold is expected to be marketable under current conditions, with no significant barriers to saleability identified. Although no significant contracts are currently in place, the QP considers the market assumptions used in the technical report to be reasonable. Risks associated with pricing and market access are discussed further in Section 25.
| 1.17 | Environmental, Permitting and Social Considerations |
| 1.17.1 | Environmental Considerations |
Extensive baseline environmental studies have been conducted since 2021, covering terrestrial and aquatic ecosystems (including species at risk (“SAR”)), groundwater, air quality, noise, and cultural heritage resources.
A preliminary geochemical characterization program was initiated in 2023, with follow up work ongoing as of the fall of 2025. The purpose of this work is to evaluate the metal leaching and acid rock drainage potential of mine rock, overburden, and tailings materials. Preliminary results have indicated a portion of the mine rock and tailings are PAG and require engineered containment and that will be accomplished by subaqueous deposition within the TSF.
| 1.17.2 | Closure and Reclamation Considerations |
A conceptual closure strategy that will be the basis of the Closure Plan has been developed that is consistent with the requirements of the Mine Rehabilitation Code of Ontario, that includes, among other things, removal of infrastructure, machinery and equipment, stabilization of tailings and MRSAs, securing the open pit to ensure public safety is maintained and allowing the pit to fill with water, and remediation of disturbed surfaces and subsequent revegetation to support designated end land uses. Financial assurance will be provided to cover the full cost of closure and long-term monitoring.
| Fenn-Gib Gold Project |
Page 11 | |
| NI 43-101 Technical Report and Pre-Feasibility Study |
December 19, 2025 | |
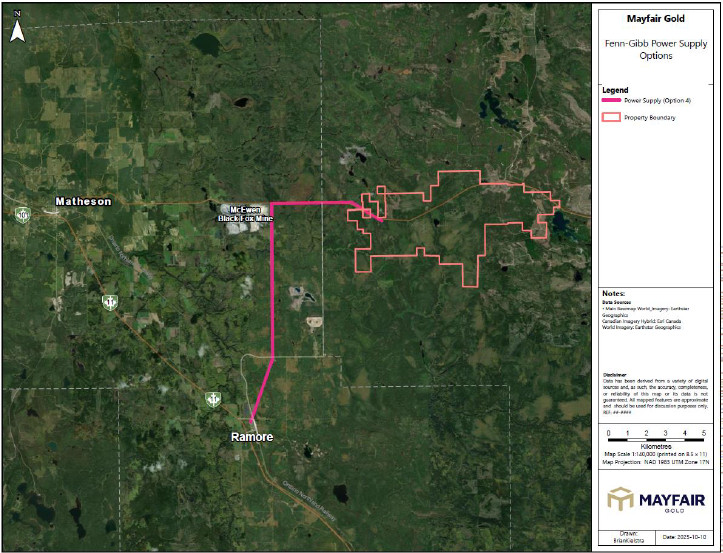
|
|
| 1.17.3 | Permitting Considerations |
The Project will require a suite of permits and approvals typical of mine developments of the sort contemplated at Fenn-Gib, primarily under provincial jurisdiction, to support all mine phases. Select elements of the Project will require approval through one or more provincial class environmental assessment (“EA”) processes. The Project as contemplated does not trigger a comprehensive EA with the Province. The Project is not a Physical Activity as defined in the Physical Activities Regulations under the federal Impact Assessment Act and therefore federal impact assessment (“IA”) is not indicated though an authorization under the federal Fisheries Act may be required in relation to impacts to fish and fish habitat. Early engagement with regulators has been initiated, and no significant impediments to permitting have been identified. Mayfair is in discussions with the Ontario government regarding entry into the “One Project, One Process” (“1P1P”) initiative that includes facilitation of all necessary provincial approvals through a dedicated Mine Authorization and Permitting Delivery Team (MAPDT).
| 1.17.4 | Social Considerations |
Social and community engagement is ongoing and proactive. The Project is located within Treaty 9 and the traditional territory of Apitipi Anicinapek Nation, with an active Exploration Agreement in place. Consultation with additional Indigenous communities and local stakeholders has also commenced, and a “good neighbour” agreement with the Town of Matheson is anticipated to address employment, procurement, and community investment.
| 1.18 | Capital and Operating Cost |
| 1.18.1 | Capital Cost Estimate |
The capital cost estimate was developed in Q3 2025 dollars based on budgetary quotations for equipment and construction contracts, as well as Ausenco’s in-house database of projects and studies including experience from similar operations. All cost are in Canadian Dollars ($) unless specified otherwise.
The estimate includes mining, processing, onsite infrastructure, tailings and MRSAs, offsite infrastructure, project indirect costs, project delivery, owners’ costs, and contingency.
The following parameters and qualifications were considered:
| | No allowance has been made for exchange rate fluctuations. |
| | There is no escalation added to the estimate. |
| | A growth allowance was included. |
Data for the estimates have been obtained from numerous sources, including:
| | mine schedules |
| | PFS-level engineering design by Ausenco, AGP, and KP |
| Fenn-Gib Gold Project |
Page 12 | |
| NI 43-101 Technical Report and Pre-Feasibility Study |
December 19, 2025 | |
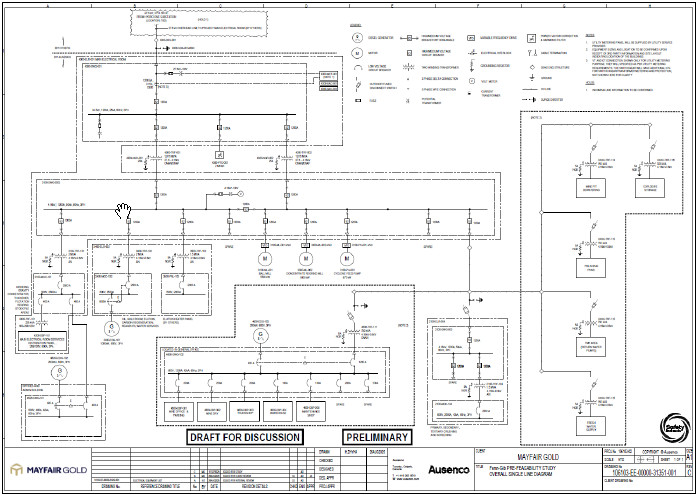
|
|
| | topographical information obtained from the site survey |
| | geotechnical investigations |
| | budgetary equipment quotes from suppliers |
| | budgetary unit costs from several local contractors for civil, concrete, steel, electrical, piping, and mechanical works |
| | data from similar recently completed studies and projects. |
Major cost categories (permanent equipment, material purchase, installation, subcontracts, indirect costs, and Owner’s costs) were identified and analyzed. A contingency was applied in the cost estimate and was based on ranging the accuracy of the data by discipline and WBS level 2 and applying a deterministic method. An overall contingency amount was derived in this fashion.
The capital cost summary is presented in Table 1-3. The total initial capital cost for the Fenn-Gib Gold project is $450 million; and LOM sustaining costs are $110 million inclusive of closure costs.
| Table 1-3: | Capital Cost Estimate |
| WBS Level 1 |
WBS Description |
Initial Capital Cost ($M) |
Sustaining Cost ($M) | Total Cost ($M) | ||||||||||
| 1000 |
Mining | 31.4 | 24.4 | 55.8 | ||||||||||
| 2000 |
Crushing | 21.6 | 1.1 | 22.7 | ||||||||||
| 3000 |
Process Plant | 114.7 | 1.4 | 116.1 | ||||||||||
| 4000 |
On Site Infrastructure | 72.4 | 14.6 | 87.0 | ||||||||||
| 5000 |
Off Site Infrastructure | 15.6 | 13.3 | 28.9 | ||||||||||
|
|
|
|
|
|
|
|||||||||
| Total Direct Costs | 255.8 | 54.7 | 310.5 | |||||||||||
|
|
|
|
|
|
|
|||||||||
| 6000 |
Project Preliminaries | 35.9 | 0.0 | 35.9 | ||||||||||
| 7000 |
Project Delivery | 30.7 | 2.5 | 33.3 | ||||||||||
| 8000 |
Owner’s Costs | 61.7 | 3.7 | 65.3 | ||||||||||
|
|
|
|
|
|
|
|||||||||
| Total Indirect Costs | 128.3 | 6.2 | 134.5 | |||||||||||
|
|
|
|
|
|
|
|||||||||
| Total Direct + Indirect Costs | 384.1 | 60.9 | 444.9 | |||||||||||
|
|
|
|
|
|
|
|||||||||
| 9000 |
Contingency | 65.9 | 0.0 | 65.9 | ||||||||||
|
|
|
|
|
|
|
|||||||||
| Total Capital Cost | 450.0 | 60.9 | 510.9 | |||||||||||
|
|
|
|
|
|
|
|||||||||
| 1.18.2 | Operating Cost Estimate |
The operating cost estimate is presented in Q3 2025 Canadian dollars ($) and was prepared to a Class 4 estimate with an accuracy of ±25% as defined by the Association for the Advancement of Cost Engineering International. The estimate includes mining, processing, and general and administration (“G&A”) costs.
| Fenn-Gib Gold Project |
Page 13 | |
| NI 43-101 Technical Report and Pre-Feasibility Study |
December 19, 2025 | |
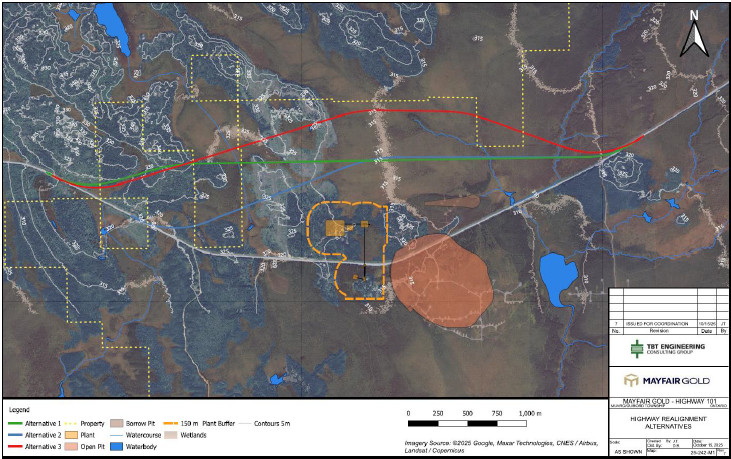
|
|
The mine operating costs have been estimated from first principles with vendor quotations for repair and maintenance costs and other suppliers for consumables. Key inputs to the mine cost are fuel and labour. The mining fleet and support equipment fleets are diesel powered.
The operating costs were calculated based on process and maintenance consumables, workforce and G&A costs.
Common to all operating cost estimates are the following assumptions:
| | Costs are estimated based on Q3 2025 pricing without allowances for inflation. |
| | For material sourced in US dollars, an exchange rate of C$1.35 to US$1.00 was assumed. |
| | Estimated cost for diesel is $1.13/L. |
| | Power costs are calculated using a unit price of $0.11/kWh, provided to Ausenco by Mayfair Gold. |
The overall operating cost over the life-of-mine of the project is $1,493 million over 15 years, or an average of $59.43/t processed. The operating costs are summarized in Table 1-4 below.
| Table 1-4: | Operating Cost Summary |
| Cost Area |
Total LOM ($M) | $/t Processed | % of Total | |||||||||
| Mining1 |
771 | 30.66 | 52 | % | ||||||||
| Process |
483 | 19.22 | 32 | % | ||||||||
| G&A |
171 | 6.82 | 11 | % | ||||||||
| Refining and Royalties |
69 | 2.73 | 5 | % | ||||||||
|
|
|
|
|
|
|
|||||||
| Total |
1,493 | 59.43 | 100 | % | ||||||||
|
|
|
|
|
|
|
|||||||
Note:
| 1. | Equivalent to $4.53/t mined |
| 1.19 | Economic Analysis |
| 1.19.1 | Economic Summary |
The results of the economic analyses discussed in this chapter represent forward-looking information as defined under Canadian securities law. The results depend on inputs that are subject to known and unknown risks, uncertainties, and other factors that may cause actual results to differ materially from those presented here.
Information that is forward-looking includes:
| | mineral resource estimates |
| | assumed commodity prices and exchange rates |
| Fenn-Gib Gold Project |
Page 14 | |
| NI 43-101 Technical Report and Pre-Feasibility Study |
December 19, 2025 | |
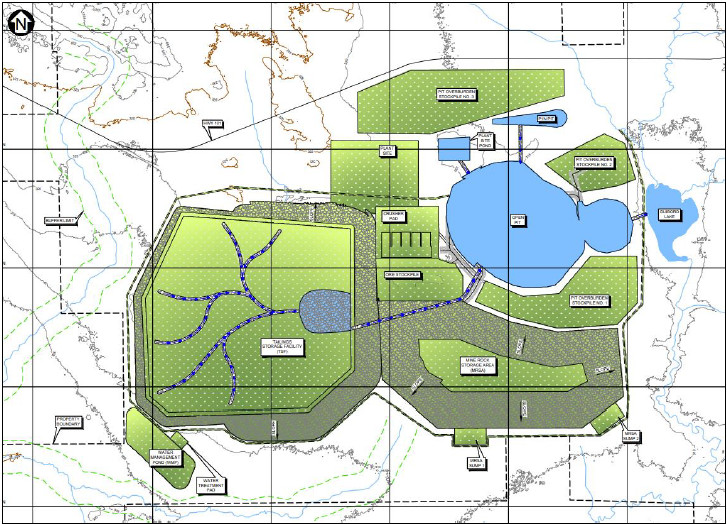
|
|
| | proposed mine production plan |
| | projected mining and process recovery rates |
| | assumptions regarding mining dilution and estimated future production |
| | sustaining costs and proposed operating costs |
| | assumptions regarding closure costs and closure requirements |
| | assumptions regarding environmental, permitting, and social risks. |
Additional risks to the forward-looking information includes:
| | changes to costs of production from what is assumed |
| | unrecognized environmental risks |
| | unanticipated reclamation expenses |
| | unexpected variations in quantity of ore, grade, or recovery rates |
| | accidents, labour disputes, and other risks of the mining industry |
| | geotechnical or hydrogeological considerations during mining being different from what was assumed |
| | failure of mining methods to operate as anticipated |
| | failure of plant, equipment, or processes to operate as anticipated |
| | changes to assumptions as to the availability of electrical power, and the power rates used in the operating cost estimates and financial analysis |
| | changes to site access, use of water for mining purposes, and to time to obtain environment and other regulatory permits |
| | ability to maintain the social licence to operate |
| | changes to interest rates |
| | changes to tax rates. |
The economic analysis was performed assuming a gold price of US$3,100/oz, which was based on long-term consensus analyst estimates. The forecasts are meant to reflect the average metals price expectation over the life of the project. No price inflation or escalation factors were considered. Commodity prices can be volatile, and there is the potential for deviation from the forecast. The economic analysis also used the following assumptions:
| | A pre-production period of 36 months including an initial 12-month detailed engineering period followed by 24-month construction and commissioning period. |
| Fenn-Gib Gold Project |
Page 15 | |
| NI 43-101 Technical Report and Pre-Feasibility Study |
December 19, 2025 | |
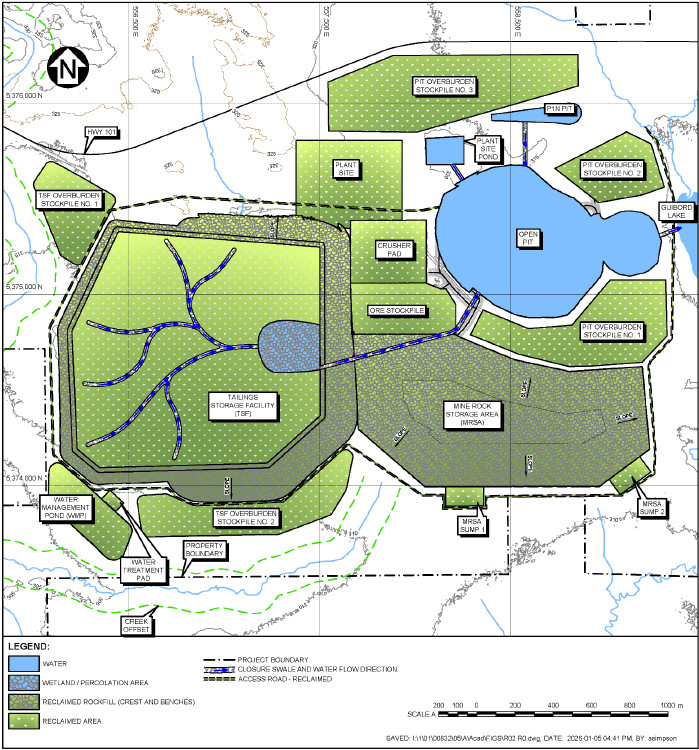
|
|
| | A mine life of 14.3 years. |
| | 100% ownership. |
| | An exchange rate of 1.35 CAD/USD based on a review of current long-term consensus. |
| | Capital cost funded with 100% equity (no financing cost assumed other than for mining equipment leases). |
| | Cash flows that are discounted to the start of construction using an end-period discounting convention. |
| | Metal products are sold in the same year they are produced. |
| | Project revenues are derived from the sale of gold doré. |
| | No contractual arrangements for refining exist. |
| | Costs associated with Indigenous Impact and Benefit Agreements (“IBAs”) have not yet been negotiated and, therefore, are not included in the financial cost model. |
The economic analysis was performed assuming a 5% discount rate with no inflation (constant dollar basis). On a pretax basis, the net present value (“NPV”) discounted at 5% is C$981 million; the internal rate of return (“IRR”) is 28.8%, and payback period is 2.6 years. On a post-tax basis, the NPV discounted at 5% is C$652 million; the IRR is 24.1%, and the payback period is 2.7 years. The analysis was performed on an annual cashflow basis; the cashflow output is shown graphically in Figure 1-2 and a summary of the key financial metrics is presented in Table 1-5.
| Table 1-5: | Economic Analysis Summary Table |
| Description |
Unit |
PFS Base Case Life-of-Mine Total/Average | ||
| General Assumptions | ||||
| Discount Rate |
% | 5 | ||
| Gold Price |
US$/oz | 3,100 | ||
| Exchange Rate |
C$/US$ | 1.35 | ||
| Production | ||||
| Mine Life |
years | 14.3 | ||
| Total Waste Tonnes Mined1 |
kt | 151,866 | ||
| Total Mill Feed Tonnes |
kt | 25,130 | ||
| Mill Head Grade (Au) |
g/t | 1.29 | ||
| Mill Recovery Rate |
% | 88.3 | ||
| Total Mill Ounces Recovered |
koz | 920 | ||
| Total Average Annual Production |
koz | 64 | ||
| Transport, Refining, Royalties | ||||
| Gold Payable |
% | 99.95 | ||
| Refining & Transport Cost |
US$/oz Au | 5.00 | ||
| NSR Royalty |
% | Varies (LOM avg. 1.7%) | ||
| Fenn-Gib Gold Project |
Page 16 | |
| NI 43-101 Technical Report and Pre-Feasibility Study |
December 19, 2025 | |
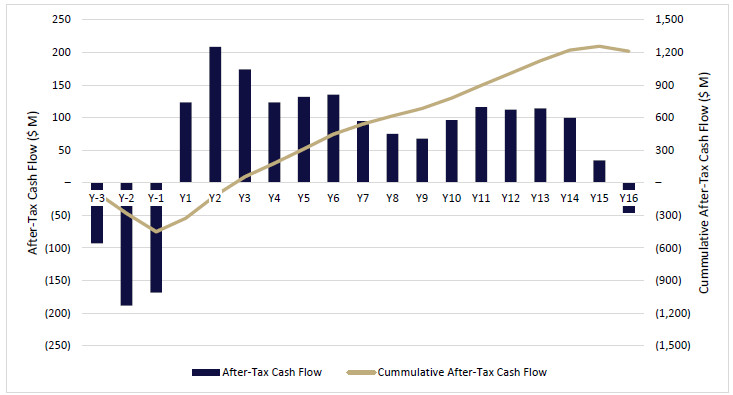
|
|
| Description |
Unit |
PFS Base Case Life-of-Mine Total/Average | ||
| Operating Costs | ||||
| Mining Cost |
$/t mined | 4.53 | ||
| Mining Cost |
$/t processed | 30.66 | ||
| Processing Cost |
$/t processed | 19.22 | ||
| G&A Cost |
$/t processed | 6.82 | ||
| Refining and Royalties |
$/t processed | 2.73 | ||
| Total Operating Cost |
$/t processed | 59.43 | ||
| Cash Costs1 |
US$/oz Au | 1,203 | ||
| All-In Sustaining Cost (AISC)2 |
US$/oz Au | 1,292 | ||
| Capital Expenditures | ||||
| Initial Capital Cost |
$M | 450.0 | ||
| Sustaining Capital Cost |
$M | 60.9 | ||
| Closure Capital Cost |
$M | 49.4 | ||
| Economics | ||||
| Pre-Tax NPV @ 5% |
$M | 980.5 | ||
| Pre-Tax IRR |
% | 28.8% | ||
| Pre-Tax Payback |
years | 2.6 | ||
| Post-Tax NPV @ 5% |
$M | 651.7 | ||
| Post-Tax IRR |
% | 24.1% | ||
| Post-Tax Payback |
years | 2.7 | ||
Notes:
| 1. | Total waste includes overburden, mineralized waste and waste material |
| 2. | Cash Costs and AISC are Non-GAAP financial measures. |
| Fenn-Gib Gold Project |
Page 17 | |
| NI 43-101 Technical Report and Pre-Feasibility Study |
December 19, 2025 | |
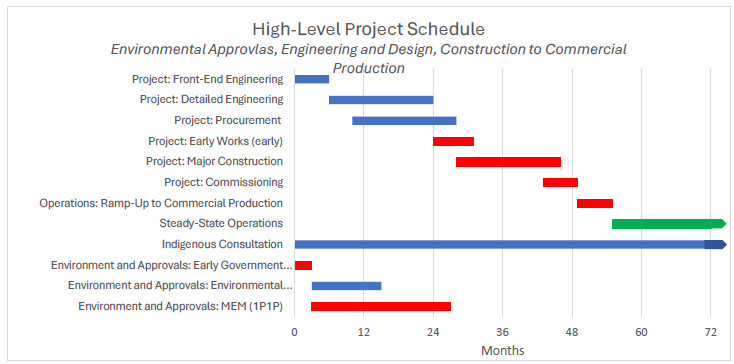
|
|
| Figure 1-2: | After-Tax Cash Flow |
Note: Cash flow and cumulative cash flow are non-GAAP financial. Source: Ausenco, 2025
| 1.19.2 | Sensitivity Analysis |
A sensitivity analysis was conducted on the base case post-tax payback, NPV and IRR of the project using the following variables: gold price, exchange rate, initial capital costs and operating costs. After-tax sensitivity results are shown in Table 1-6.
| Table 1-6: | After-Tax Sensitivity Analysis |
| After-Tax Results |
OPEX Sensitivity | |||||||||||||||||||
| -30% | -15% | 0% | 15% | 30% | ||||||||||||||||
| NPV 5% (M C$) |
826 | 739 | 652 | 564 | 476 | |||||||||||||||
| IRR (%) |
27.7 | % | 25.9 | % | 24.1 | % | 22.1 | % | 20.0 | % | ||||||||||
| Payback (yrs) |
2.4 | 2.5 | 2.7 | 2.9 | 3.2 | |||||||||||||||
| After-Tax Results |
CAPEX Sensitivity | |||||||||||||||||||
| -30% | -15% | 0% | 15% | 30% | ||||||||||||||||
| NPV 5% (M C$) |
773 | 713 | 652 | 591 | 530 | |||||||||||||||
| IRR (%) |
34.2 | % | 28.4 | % | 24.1 | % | 20.7 | % | 17.8 | % | ||||||||||
| Payback (yrs) |
1.9 | 2.3 | 2.7 | 3.1 | 3.6 | |||||||||||||||
| After-Tax Results |
C$/US$ Exchange Rate Sensitivity | |||||||||||||||||||
| 1.25 | 1.30 | 1.35 | 1.40 | 1.45 | ||||||||||||||||
| NPV 5% (M C$) |
536 | 594 | 652 | 710 | 767 | |||||||||||||||
| IRR (%) |
21.4 | % | 22.7 | % | 24.1 | % | 25.4 | % | 26.6 | % | ||||||||||
| Payback (yrs) |
3.0 | 2.8 | 2.7 | 2.6 | 2.5 | |||||||||||||||
| Fenn-Gib Gold Project |
Page 18 | |
| NI 43-101 Technical Report and Pre-Feasibility Study |
December 19, 2025 | |
|
|
| After-Tax Results |
Gold Price Sensitivity (US$/oz) | |||||||||||||||||||||||||||
| 1,600 | 2,100 | 2,600 | 3,100 | 3,600 | 4,100 | 4,600 | ||||||||||||||||||||||
| NPV 5% (M C$) |
-141 | 144 | 399 | 652 | 903 | 1,155 | 1,405 | |||||||||||||||||||||
| IRR (%) |
N/A | 10.3 | % | 17.9 | % | 24.1 | % | 29.4 | % | 34.3 | % | 38.6 | % | |||||||||||||||
| Payback (yrs) |
N/A | 5.2 | 3.5 | 2.7 | 2.2 | 1.9 | 1.7 | |||||||||||||||||||||
| 1.20 | Adjacent Properties |
The Fenn-Gib property is located within Ontario’s “Golden Highway,” a well-established Archean greenstone belt corridor hosting numerous past producing and active gold operations. The property is surrounded by claims and leases held by exploration companies and operators, including STLLR Gold Inc., McEwen Mining Inc., Onyx Gold Inc., and Agnico Eagle Mines Ltd. McEwen Mining’s Fox Complex, located approximately 6 km west, has produced nearly 1 Moz historically and is advancing plans to increase annual output to 60,000 ounces by 2027 and up to 150,000 ounces by 2030. STLLR Gold’s Tower Gold Project, situated southeast along the Porcupine-Destor Fault Zone, reports a current NI 43-101 mineral resource of approximately 3.66 Moz indicated and 4.13 Moz inferred in open pit domains, with additional underground resources exceeding 3 Moz. Onyx Gold is actively exploring the Munro-Croesus Project north of Fenn-Gib, a past producing high grade property proximal to major structural zones. Agnico Eagle controls ground to the south, including the historic Holloway and Holt mines, which collectively produced more than 2 Moz prior to care and maintenance in 2019. The historic Ross Mine, approximately 10 km east, produced over 1 Moz before closing in 1989. While these operations underscore the strong gold endowment of the district, mineralization reported for adjacent properties is not necessarily indicative of mineralization at Fenn-Gib.
| 1.21 | Other Relevant Data and Information |
| 1.21.1 | Project Execution Plan and Schedule |
The Project execution plan contemplates delivery under an engineering, procurement, and construction management (“EPCM”) framework with early contractor engagement to support constructability, sequencing, and execution readiness. An early works program, subject to permitting, is intended to advance site preparation, access roads, overburden removal, construction water management, and initial TSF earthworks. Early commissioning of the primary crusher is planned to allow waste rock generated during site development to be processed and reused for construction activities, including road building and TSF development. Early mobilization of the mining fleet, initially supported by a smaller contractor fleet where appropriate, is expected to accelerate pre-stripping and provide material required for critical earthworks. Selective modularization of plant components may be evaluated to reduce onsite labour and improve installation efficiency, supported by a dedicated off-site project management office providing centralized project controls and reporting.
| Fenn-Gib Gold Project |
Page 19 | |
| NI 43-101 Technical Report and Pre-Feasibility Study |
December 19, 2025 | |
|
|
The Project schedule is structured to advance through engineering, procurement, construction, commissioning, and ramp-up to commercial production. The execution timeline is primarily sensitive to the timing of permitting and approvals, long-lead equipment procurement, and TSF earthworks readiness. Engineering is intended to advance in parallel with permitting and Indigenous engagement, targeting a high level of plant design completion at approval and construction-ready TSF packages to support timely initiation of earthworks. Operational readiness planning is expected to proceed in parallel with construction, including development of operating and maintenance strategies, training programs, supply chain planning, and early involvement of operations personnel during commissioning to support a timely transition to steady-state operations. A high-level schedule for the Fenn-Gib Gold project is presented in Figure 1-3.
| Figure 1-3: | High-Level Schedule from FEED through to Commercial Production |
Source: Mayfair, 2025
| 1.21.2 | Potential Upside Opportunities |
The PFS includes the processing of 1 Moz of reserves of the overall 4.3 Moz indicated resource. This presents several conceptual opportunities that are not included in the base case but may become strategically viable in future years. Further technical, economic and regulatory/permitting review is required for any other options following the start-up of the project as described in this study.
| Fenn-Gib Gold Project |
Page 20 | |
| NI 43-101 Technical Report and Pre-Feasibility Study |
December 19, 2025 | |
|
|
| 1.22 | Conclusions & Recommendations |
Based on the assumptions and parameters presented in the report, the project has a mine plan that is technically feasible and economically viable. The positive financials of the project ($652 million after-tax NPV5% and 24.1% after-tax IRR) support the mineral reserve. To position the Company for a construction decision, it is recommended that critical work streams be advanced in parallel, including front-end engineering development (“FEED”) and detailed design to develop a control budget estimate, permitting and regulatory approvals to secure all necessary authorizations for construction, Indigenous and community engagement and consultation garner input on the project design with impacted communities. Advancing these activities concurrently will ensure technical, regulatory, social, and financial readiness for the next stage of project execution. The budget for this scope is detailed in Table 1-7.
| Table 1-7: | Recommended Work Program |
| Program Component |
Estimated Total Cost ($M) |
|||
| Drilling |
5.7 | |||
| Mining and Geology |
2.0 | |||
| Plant Design |
11.0 | |||
| Metallurgical Testwork |
1.0 | |||
| Tailings and Water Management Designs |
4.5 | |||
| Geotechnical and Site Investigations |
4.6 | |||
| Infrastructure Designs |
2.0 | |||
| Environmental Studies and Community Engagement |
5.0 | |||
| Construction Control Estimate |
0.2 | |||
|
|
|
|||
| Total |
36.0 | |||
|
|
|
|||
| Fenn-Gib Gold Project |
Page 21 | |
| NI 43-101 Technical Report and Pre-Feasibility Study |
December 19, 2025 | |
|
|
| 2 | INTRODUCTION |
| 2.1 | Introduction |
This report was prepared by Ausenco Engineering Canada ULC (Ausenco) and T. Maunula & Associates Consulting Inc. [“TMAC”)., AGP Mining Consultants Inc. (“AGP”), Knight Piésold Ltd. (“KP”), and Ecometrix Inc. an Egis Group Company (“Ecometrix”) for Mayfair Gold Corp (“Mayfair Gold”) to summarize the results of the pre-feasibility study (“PFS”) of the Fenn-Gib Gold project (the “Project” or “Fenn-Gib”).
The responsibilities of the engineering companies who were contracted by Mayfair to prepare this report are as follows:
| | Ausenco managed and coordinated the report preparation, developed the PFS-level design and cost estimate for the process plant and general site infrastructure, and completed the economic analysis. |
| | TMAC completed the work related to property description, accessibility, local resources, geological setting, deposit type, exploration works, drilling and developed the mineral resource estimate (“MRE”) for the project. |
| | AGP designed the open pit mine, ore stockpiles, mine rock storage areas (“MRSA”), mine production schedule, and mine capital and operating costs. |
| | KP completed geotechnical studies, site wide water balancing, and developed the PFS-level design and cost estimate of the tailings storage facility (“TSF”), environment and permitting considerations and closure cost estimate. |
| | Ecometrix completed work related to geochemistry. |
This technical report summarizes the results of the PFS and presents the latest mineral resource and mineral reserve estimates for the Fenn-Gib property. The technical report outlines the development of an open pit mine, processing facilities and related infrastructure both on site and off site.
| 2.2 | Terms of Reference |
The report was prepared in accordance with the Canadian disclosure requirements of National Instrument 43-101 (“NI 43-101”) and Form 43-101 F1, and is prepared using the Canadian Institute of Mining, Metallurgy and Petroleum (“CIM”) Definition Standards for Mineral Resources and Mineral Reserves (“CIM, 2014”) and the CIM Estimation of Mineral Resources and Mineral Reserves Best Practice Guidelines (“CIM, 2019”).
This report supports the disclosure in Mayfair’s news release title “Mayfair Delivers Robust Pre-Feasibility Study for the Fenn-Gib Gold Project” dated January 8, 2026.
| Fenn-Gib Gold Project |
Page 22 | |
| NI 43-101 Technical Report and Pre-Feasibility Study |
December 19, 2025 | |
|
|
All measurement units used in this report are metric. All costs are in Canadian dollars and stated on a 100% project ownership basis unless otherwise noted.
As of the effective date of this report, the authors of this report are not aware of any known litigation potentially affecting the project. The qualified persons (“QPs”), as defined in NI 43-101, did not verify the legality or terms of any underlying agreement(s) that may exist concerning the project ownership, permits, off-take agreements, license agreements, royalties or other agreement(s) between Mayfair and any third parties.
The opinions in this report are based on information collected during investigations by the QPs, which in turn reflects various technical and economic conditions at the time of writing. Given the nature of the mining business, these conditions can change significantly over relatively short periods of time. Consequently, actual results can be significantly more or less favourable.
The Project property comprises 21 fee simple patented properties, 145 unpatented mining claims, and 6 mining lease properties in the Guibord, Munro, Michaud, and McCool Townships in northeast Ontario, Canada that cover 1,877.8 ha.
| 2.3 | Qualified Persons |
The QPs for the report are listed in Table 2-1. By virtue of their education, experience and professional association membership, they are considered QP as defined by NI 43-101.
| Table 2-1: | Report Contributors |
| Qualified Person |
Professional Designation |
Position |
Employer |
Completed site inspection |
Independent of Client | |||||
| Tommaso Roberto Raponi |
P.Eng. | Senior Mineral Processing Specialist | Ausenco | Yes | Yes | |||||
| Tim Maunula |
P.Geo. | Principal Geologist | TMAC | Yes | Yes | |||||
| Gordon Zurowski |
P.Eng. | Principal Mine Engineer | AGP | Yes | Yes | |||||
| Craig Hall |
P.Eng. | Managing Principal | KP | Yes | Yes | |||||
| Richard Cook |
P.Geo (Ltd.) | Specialist Environmental Scientist | KP | No | Yes | |||||
| Sarah Barabash, PhD |
P.Geo (Ltd.) | Director of Mining Services | Ecometrix | No | Yes |
| 2.4 | Site Visits and Scope of Personal Inspection |
| 2.4.1 | Site Inspection for Tim Maunula |
Mr. Maunula visited the site from February 6 to 7, 2023 and April 15 to 17, 2024. His most recent site visit between April 15 and 17, 2024 included an inspection of the property, diamond drilling, core storage, and sampling and logging facilities in Matheson.
| Fenn-Gib Gold Project |
Page 23 | |
| NI 43-101 Technical Report and Pre-Feasibility Study |
December 19, 2025 | |
|
|
| 2.4.2 | Site inspection for Tommaso Roberto Raponi |
Mr. Raponi visited the site on May 22, 2025. He inspected the property to review proposed location of project infrastructure, reviewed diamond drill core and met with project staff.
| 2.4.3 | Site inspection for Gordon Zurowski |
Mr. Zurowski last visited the site on July 26, 2024. During the site visit he inspected the existing road network, potential truck shop locations, location of the proposed pit design and other infrastructure items and nearby power sources. He also inspected core to obtain a representative idea of material to be mined.
| 2.4.4 | Site inspection for Craig Hall |
Mr. Hall visited the site on May 15, 2025. He inspected the property to review the potential locations of the project infrastructure including, TSF and water management structures. In addition, he observed the surface topography and general observable ground conditions.
| 2.5 | Effective Dates |
| | Effective date of Mineral Resource Estimate: September 3, 2024 |
| | Effective date of Mineral Reserve Estimate: December 19, 2025 |
| | Effective date of Financial Model: December 19, 2025 |
| | Effective date of this report: December 19, 2025 |
| | The Report Date: January 14, 2026 |
| 2.6 | Information Sources and References |
| 2.6.1 | Previous technical reports: |
Prior technical reports that have been completed for the Project are:
| | Lakeshore Gold: Dagbert & Desharnais, 2011 (SGS Technical Report) |
| | Mayfair Gold: Kirkham, 2021 (JDS Technical Report) |
| | Mayfair Gold: Maunula, 2023 (TMAC Technical Report) |
| | Mayfair Gold: Maunula, 2025 (TMAC Technical Report) - current resource reported in Ausenco PFS |
| 2.7 | Currency, Units, Abbreviations and Definitions |
All units of measurement in this report are metric and all currencies are expressed in Canadian dollars (symbol: $ or currency: CAD) unless otherwise stated. Contained gold metal is expressed as troy ounces (“oz”), where 1 oz = 31.1035 g. All material tonnes are expressed as dry tonnes (“t”) unless stated otherwise. A list of abbreviations and acronyms is provided in Table 2-2, and units of measurement are listed in Table 2-3.
| Fenn-Gib Gold Project |
Page 24 | |
| NI 43-101 Technical Report and Pre-Feasibility Study |
December 19, 2025 | |
|
|
| Table 2-2: | Abbreviations and Acronyms |
| Abbreviation |
Description | |
| 1P1P |
One Project, One Process | |
| AA |
atomic absorption spectroscopy | |
| AGP |
AGP Mining Consultants Inc. | |
| Au |
gold | |
| Ausenco |
Ausenco Engineering Canada ULC (Ausenco) | |
| Az |
azimuth | |
| BIF |
banded iron formation | |
| BBMWi |
Bond ball mill work index | |
| CAD:USD |
Canadian-American exchange rate | |
| CIM |
Canadian Institute of Mining, Metallurgy and Petroleum | |
| CIM Definition Standards |
CIM Definition Standards for Mineral Resources and Mineral Reserves 2014 | |
| CIM Guidelines |
||
| CIL |
carbon in leach | |
| CoG |
cut-off grade | |
| CRM |
certified reference material | |
| CWi |
Bond crusher work index | |
| Datamine |
Datamine Studio EM | |
| DC |
direct current | |
| DCIP |
direct current resistivity and induced polarization | |
| DDH |
diamond drill hole | |
| EA |
environmental assessment | |
| Ecometrix |
Ecometrix Inc. an Egis Group Company | |
| E-GRG |
extended gravity recoverable gold | |
| EM |
electromagnetic | |
| EPCM |
engineering, procurement, and construction management | |
| FA |
fire assay | |
| FEED |
front-end engineering development | |
| FET |
federal excise tax | |
| FS |
feasibility study | |
| G&A |
general and administration | |
| GPR |
gross production royalty | |
| GRG |
gravity recoverable gold | |
| GQCV |
greenstone-hosted quartz-carbonate vein deposits | |
| GRAV |
gravimetric finish method | |
| IA |
impact assessment | |
| IBAs |
Impact and Benefit Agreements | |
| ICP |
inductively coupled plasma | |
| ICP-OES |
inductively coupled plasma - optical emission spectrometry | |
| ID2 |
inverse distance squared |
| Fenn-Gib Gold Project |
Page 25 | |
| NI 43-101 Technical Report and Pre-Feasibility Study |
December 19, 2025 | |
|
|
| Abbreviation |
Description | |
| ID3 |
inverse distance cubed | |
| IESO |
independent electricity system operator | |
| IFRS |
IFRS Accounting Standards | |
| IOCG |
iron oxide copper gold | |
| IP |
induced polarization | |
| IRGS |
intrusion-related gold system | |
| IRR |
internal rate of return | |
| ISO |
International Organization for Standardization | |
| KP |
Knight Piésold Ltd. | |
| LIDAR |
light detection and ranging | |
| LSG |
Lake Shore Gold Corp. | |
| LUP |
land use permit | |
| MARC |
maintenance and repair contract | |
| MCF |
mechanized cut and fill | |
| MRSA |
mine rock storage areas | |
| MRE |
mineral resource estimate | |
| NAD 83 |
North American Datum of 1983 | |
| NI 43-101 |
National Instrument 43-101 (Regulation 43-101 in Quebec) | |
| NN |
nearest neighbour | |
| NPR |
net proceeds royalties | |
| NPV |
net present value | |
| NSR |
net smelter return | |
| NTS |
national topographic system | |
| OK |
ordinary kriging | |
| PAG |
potentially acid generation | |
| PEA |
preliminary economic assessment | |
| PFS |
pre-feasibility study | |
| PGE |
platinum group elements | |
| QA/QC |
quality assurance/quality control | |
| QP |
qualified person (as defined in National Instrument 43-101) | |
| ROM |
run of mine | |
| RQD |
rock quality designation | |
| SAG |
semi-autogenous grinding | |
| SAR |
species at risk | |
| SCC |
Standards Council of Canada | |
| SD |
standard deviation | |
| Sd-BWI |
micro hardness or bond ball mill work index on SAG ground material | |
| SEDEX |
sedimentary exhalative deposits | |
| SEM |
scanning electron microscopy | |
| SG |
specific gravity | |
| SGH |
soil-gas hydrocarbons | |
| SGS |
SGS Canada Inc. | |
| SHA |
SHA Geophysics Ltd. | |
| SIA |
systems impact assessment | |
| SPI |
SAG Power Index |
| Fenn-Gib Gold Project |
Page 26 | |
| NI 43-101 Technical Report and Pre-Feasibility Study |
December 19, 2025 | |
|
|
| Abbreviation |
Description | |
| Tahoe |
Tahoe Resources Inc. | |
| TIMA-X |
TESCAN Integrated Mineral Analyzer | |
| TMAC |
T. Maunula & Associates Consulting Inc. | |
| TSF |
tailings storage facility | |
| UG |
underground | |
| UTM |
Universal Transverse Mercator coordinate system | |
| UV |
ultraviolet | |
| VLF-EM |
very low frequency electromagnetic | |
| VMS |
volcanogenic massive sulphide |
| Table 2-3: | Units of Measurement |
| Abbreviation |
Description | |
| % |
percent | |
| % solids |
percent solids by weight | |
| CAD |
Canadian dollar (currency) | |
| C$ |
Canadian dollar (as symbol) | |
| $/t |
dollars per metric tonne | |
| ° |
angular degree | |
| °C |
degree Celsius | |
| µm |
micron (micrometer) | |
| cm |
centimeter | |
| cm3 |
cubic centimeter | |
| ft |
foot (12 inches) | |
| GJ/d |
gigajoules/day | |
| g |
gram | |
| g/cm3 |
gram per cubic centimeter | |
| g/L |
gram per liter | |
| g/t |
gram per metric ton (tonne) | |
| h |
hour (60 minutes) | |
| ha |
hectare | |
| kg |
kilogram | |
| kg/t |
kilogram per tonne | |
| km |
kilometer | |
| km2 |
square kilometer | |
| kV |
kilovolt | |
| kW |
kilowatt | |
| kWh/t |
kilowatt-hour per tonne | |
| L |
liter |
| Fenn-Gib Gold Project |
Page 27 | |
| NI 43-101 Technical Report and Pre-Feasibility Study |
December 19, 2025 | |
|
|
| Abbreviation |
Description | |
| lb |
pound | |
| m, m2, m3 |
meter, square meter, cubic meter | |
| M |
million | |
| Ma |
million years (annum) | |
| masl |
meters above mean sea level | |
| Mm3 |
Million cubic meters | |
| mm |
millimeter | |
| mm/a |
millimeter/year | |
| Moz |
million (troy) ounces | |
| Mt |
million tonnes | |
| MW |
megawatt | |
| oz |
troy ounce | |
| oz/t |
ounce (troy) per tonne | |
| oz/ton |
ounce (troy) per short ton (2,000 lbs) | |
| ppb |
parts per billion | |
| ppm |
parts per million | |
| t |
metric tonne (1,000 kg) | |
| ton |
short ton (2,000 lbs) | |
| t/d |
tonnes per day | |
| USD |
US dollars (currency) | |
| US$ |
US dollar (as symbol) |
| Fenn-Gib Gold Project |
Page 28 | |
| NI 43-101 Technical Report and Pre-Feasibility Study |
December 19, 2025 | |
|
|
| 3 | RELIANCE ON OTHER EXPERTS |
| 3.1 | Introduction |
The QP’s have relied upon other expert reports that provided information regarding mineral rights, surface rights, property agreements, royalties, environmental, permitting, social license, and taxation for sections of this Report.
| 3.2 | Property Agreements, Mineral Tenure, Surface Rights and Royalties |
The QPs have not independently reviewed ownership of the Project area and any underlying property agreements, mineral tenure, surface rights, or royalties. The QP’s have fully relied upon, information derived from Mayfair Gold and legal experts retained by Mayfair Gold. Including the following:
| | Poehlman, T. (2024): Mayfair Gold Land Report, 23 April 2024. Report Generated on Mining Lands Administration System by In Good Standing Corporation |
This information is used in Section 1.4, Section 4, and Section 25.2. The information is also used in support of Sections 14, 15 and 24.
| 3.3 | Taxation |
The QP’s have fully relied upon for information supplied by external taxation experts, retained by Mayfair Gold, related to taxation as applied to the financial model and received from their external expert in correspondence titled “Mayfair Tax Model” on December 22, 2025.
This information is used in Section 1.19 and 22 based on the model for the Project provided by Mayfair Gold for the technical report. This information is used in support of the financial analysis for the project.
| Fenn-Gib Gold Project |
Page 29 | |
| NI 43-101 Technical Report and Pre-Feasibility Study |
December 19, 2025 | |
|
|
| 4 | PROPERTY DESCRIPTION AND LOCATION |
| 4.1 | Property Location |
The Project is in located in Guibord and Munro Townships in northeast Ontario. The Project lies 43 km northwest of Kirkland Lake and 21 km east of Matheson, south of Abitibi Lake. The property center is at UTM 17N 559078 5374037 (NAD 83) or 48°31’ N 80°12’ W. The Project is accessible year-round by Highway 101, which passes directly through the Project. Highway 101 connects with the Trans-Canada Highway at Matheson (Figure 4-1). The nearest airport is 20 km north of Timmins, which itself is 80 km from the property. The Project is in a very mining-friendly jurisdiction amongst dozens of historical mines and several active mines between Rouyn and Timmins gold-mining camps.
| Figure 4-1: | Location Map, Fenn-Gib Property |
Source: Mayfair, 2025
| Fenn-Gib Gold Project |
Page 30 | |
| NI 43-101 Technical Report and Pre-Feasibility Study |
December 19, 2025 | |
|
|
| 4.2 | Property and Title in Ontario |
Ontario’s Mining Act governs mineral tenure in the province. Mineral rights can be held through three types of tenure: (1) unpatented mining claims (staked claims requiring annual work expenditures or cash payments to maintain good standing, typically renewable indefinitely), (2) mining leases (converted from claims after demonstrating sufficient exploration work, with 21-year renewable terms), and (3) mining patents (fee simple ownership of both surface and mineral rights).
The Province of Ontario retains ownership of most surface rights on unpatented claims. Mining lease holders may acquire surface rights for mining purposes subject to provincial approval. Patent holders own both surface and mineral rights in fee simple.
Water rights for mining operations in Ontario are regulated under the Ontario Water Resources Act, requiring permits from the Ministry of the Environment, Conservation and Parks for water takings exceeding specified thresholds.
Royalties in Ontario are privately negotiated agreements between parties and may include net smelter returns (“NSR”), net profit interests (“NPI”), or net proceeds royalties (“NPR”). The Province does not impose a provincial mining royalty or tax on mineral production.
| 4.3 | Project Ownership |
Mayfair Gold owns a 100% interest in 21 fee simple patented properties, 145 unpatented mining claims, and six mining lease properties in the Guibord, Munro, Michaud, and McCool Townships in northeast Ontario, Canada (collectively, the Fenn-Gib Project) that cover 1,877.8 ha (Figure 4-2). Lake Shore Gold Corp (“LSG”) agreed to sell the Project to Mayfair Gold pursuant to an asset purchase agreement dated June 8, 2020.
| 4.4 | Mineral Tenure |
The QP’s review of permits and agreements summarized in this section (Table 4-1 and Table 4-2) between third parties is based on information provided by Mayfair Gold and their third-party expert’s report of the land tenure completed on Mining Lands Administration System (“MLAS”) in June 2024 (Poehlman, 2024). An independent verification of land title was not conducted. Mayfair Gold has confirmed that there are no known litigations potentially affecting the Project.
The QPs did not independently verify the legality of any underlying agreement that may exist concerning the licences or other agreement between third parties have instead relied on information provided by Mayfair Gold.
| Fenn-Gib Gold Project |
Page 31 | |
| NI 43-101 Technical Report and Pre-Feasibility Study |
December 19, 2025 | |
|
|
| Table 4-1: | Mineral Tenure Table |
| Legacy Claim No. |
Township or Area |
Tenure ID (Cell No.) |
Anniversary |
Recorded Holder |
Work Required ($) |
Royalty Holders | ||||||
| 12001951 |
Guibord | 106345 | 2027-10-20 | Mayfair 100% | 200 | Stanley G. Hawkins | ||||||
| 12001951 |
Guibord | 341670 | 2027-04-23 | Mayfair 100% | 400 | Stanley G. Hawkins | ||||||
| 12001951 |
Guibord | 340323 | 2027-04-23 | Mayfair 100% | 400 | Stanley G. Hawkins | ||||||
| 12001951 |
Guibord | 320120 | 2027-04-23 | Mayfair 100% | 200 | Stanley G. Hawkins | ||||||
| 12001951 |
Guibord | 320119 | 2027-04-23 | Mayfair 100% | 200 | Stanley G. Hawkins | ||||||
| 12001951 |
Guibord | 320118 | 2027-04-23 | Mayfair 100% | 200 | Stanley G. Hawkins | ||||||
| 12001951 |
Guibord | 254207 | 2027-04-23 | Mayfair 100% | 400 | Stanley G. Hawkins | ||||||
| 12001951 |
Guibord | 235237 | 2027-04-23 | Mayfair 100% | 400 | Stanley G. Hawkins | ||||||
| 12001951 |
Guibord | 235236 | 2027-04-23 | Mayfair 100% | 200 | Stanley G. Hawkins | ||||||
| 12001951 |
Guibord | 199631 | 2027-04-23 | Mayfair 100% | 200 | Stanley G. Hawkins | ||||||
| 12001951 |
Guibord | 180138 | 2027-04-23 | Mayfair 100% | 200 | Stanley G. Hawkins | ||||||
| 12001951 |
Guibord | 178778 | 2027-04-23 | Mayfair 100% | 200 | Stanley G. Hawkins | ||||||
| 12001951 |
Guibord | 135440 | 2027-04-23 | Mayfair 100% | 200 | Stanley G. Hawkins | ||||||
| 12001951 |
Guibord | 135439 | 2027-04-23 | Mayfair 100% | 400 | Stanley G. Hawkins | ||||||
| 12001951 |
Guibord | 123444 | 2027-04-23 | Mayfair 100% | 200 | Stanley G. Hawkins | ||||||
| 12001961 |
Guibord | 106836 | 2027-04-23 | Mayfair 100% | 400 | Stanley G. Hawkins | ||||||
| 12001961 |
Guibord | 340323 | 2027-04-23 | Mayfair 100% | 400 | Stanley G. Hawkins | ||||||
| 12001961 |
Guibord | 320120 | 2027-04-23 | Mayfair 100% | 200 | Stanley G. Hawkins | ||||||
| 12001961 |
Guibord | 302105 | 2027-04-23 | Mayfair 100% | 400 | Stanley G. Hawkins | ||||||
| 12001961 |
Guibord | 299673 | 2027-04-23 | Mayfair 100% | 200 | Stanley G. Hawkins | ||||||
| 12001961 |
Guibord | 281352 | 2027-04-23 | Mayfair 100% | 200 | Stanley G. Hawkins | ||||||
| 12001961 |
Guibord | 280132 | 2027-04-23 | Mayfair 100% | 400 | Stanley G. Hawkins | ||||||
| 12001961 |
Guibord | 280131 | 2027-04-23 | Mayfair 100% | 200 | Stanley G. Hawkins | ||||||
| 12001961 |
Guibord | 196478 | 2027-04-23 | Mayfair 100% | 400 | Stanley G. Hawkins | ||||||
| 12001961 |
Guibord | 190465 | 2027-04-23 | Mayfair 100% | 200 | Stanley G. Hawkins | ||||||
| 12001961 |
Guibord | 174433 | 2027-04-23 | Mayfair 100% | 200 | Stanley G. Hawkins | ||||||
| 12001961 |
Guibord | 135439 | 2027-04-23 | Mayfair 100% | 400 | Stanley G. Hawkins | ||||||
| 12001971 |
Guibord | 106835 | 2027-04-23 | Mayfair 100% | 200 | Stanley G. Hawkins | ||||||
| 12001971 |
Guibord | 340323 | 2027-04-23 | Mayfair 100% | 400 | Stanley G. Hawkins | ||||||
| 12001971 |
Guibord | 302106 | 2027-04-23 | Mayfair 100% | 200 | Stanley G. Hawkins | ||||||
| 12001971 |
Guibord | 302105 | 2027-04-23 | Mayfair 100% | 400 | Stanley G. Hawkins | ||||||
| 12001971 |
Guibord | 302104 | 2027-04-23 | Mayfair 100% | 400 | Stanley G. Hawkins | ||||||
| 12001971 |
Guibord | 281352 | 2027-04-23 | Mayfair 100% | 200 | Stanley G. Hawkins | ||||||
| 12001971 |
Guibord | 281351 | 2027-04-23 | Mayfair 100% | 200 | Stanley G. Hawkins | ||||||
| 12001971 |
Guibord | 246022 | 2027-04-23 | Mayfair 100% | 200 | Stanley G. Hawkins | ||||||
| 12001971 |
Guibord | 233345 | 2027-04-23 | Mayfair 100% | 400 | Stanley G. Hawkins | ||||||
| 12001971 |
Guibord | 225340 | 2027-04-23 | Mayfair 100% | 400 | Stanley G. Hawkins | ||||||
| 12001971 |
Guibord | 178779 | 2027-04-23 | Mayfair 100% | 400 | Stanley G. Hawkins | ||||||
| 12001971 |
Guibord | 178778 | 2027-04-23 | Mayfair 100% | 200 | Stanley G. Hawkins | ||||||
| 12001971 |
Guibord | 149502 | 2027-04-23 | Mayfair 100% | 200 | Stanley G. Hawkins | ||||||
| 12001971 |
Guibord | 122039 | 2027-04-23 | Mayfair 100% | 200 | Stanley G. Hawkins | ||||||
| 12001971 |
Guibord | 122038 | 2027-04-23 | Mayfair 100% | 200 | Stanley G. Hawkins |
| Fenn-Gib Gold Project |
Page 32 | |
| NI 43-101 Technical Report and Pre-Feasibility Study |
December 19, 2025 | |
|
|
| Legacy Claim No. |
Township or Area |
Tenure ID (Cell No.) |
Anniversary |
Recorded Holder |
Work Required ($) |
Royalty Holders | ||||||
| 12001971 |
Guibord | 106836 | 2027-04-23 | Mayfair 100% | 400 | Stanley G. Hawkins | ||||||
| 12001981 |
Guibord | 103250 | 2027-04-23 | Mayfair 100% | 200 | Stanley G. Hawkins | ||||||
| 12001981 |
Guibord | 323679 | 2027-04-23 | Mayfair 100% | 200 | Stanley G. Hawkins | ||||||
| 12001981 |
Guibord | 287668 | 2027-04-23 | Mayfair 100% | 400 | Stanley G. Hawkins | ||||||
| 12001981 |
Guibord | 228380 | 2027-04-23 | Mayfair 100% | 200 | Stanley G. Hawkins | ||||||
| 12001981 |
Guibord | 228379 | 2027-04-23 | Mayfair 100% | 200 | Stanley G. Hawkins | ||||||
| 12001981 |
Guibord | 190465 | 2027-04-23 | Mayfair 100% | 200 | Stanley G. Hawkins | ||||||
| 12001981 |
Guibord | 174433 | 2027-04-23 | Mayfair 100% | 200 | Stanley G. Hawkins | ||||||
| 12001981 |
Guibord | 155055 | 2027-04-23 | Mayfair 100% | 200 | Stanley G. Hawkins | ||||||
| 12001981 |
Guibord | 127124 | 2027-04-23 | Mayfair 100% | 200 | Stanley G. Hawkins | ||||||
| 4258499 |
Guibord | 230569 | 2027-07-07 | Mayfair 100% | 200 | None | ||||||
| 4258499 |
Guibord | 344528 | 2027-07-07 | Mayfair 100% | 200 | None | ||||||
| 4258499 |
Guibord, Munro | 227696 | 2027-07-07 | Mayfair 100% | 200 | None | ||||||
| 4258499 |
Guibord, Munro | 171033 | 2027-07-07 | Mayfair 100% | 400 | None | ||||||
| 4258968 |
Guibord | 106345 | 2027-10-20 | Mayfair 100% | 200 | None | ||||||
| 4258968 |
Guibord | 312371 | 2027-10-20 | Mayfair 100% | 200 | None | ||||||
| 4258968 |
Guibord | 305057 | 2027-10-20 | Mayfair 100% | 200 | None | ||||||
| 4258968 |
Guibord | 291635 | 2027-10-20 | Mayfair 100% | 200 | None | ||||||
| 4258968 |
Guibord | 110758 | 2027-10-20 | Mayfair 100% | 200 | None | ||||||
| 4258968 |
Guibord | 110605 | 2027-10-20 | Mayfair 100% | 200 | None | ||||||
| 4272132 |
Guibord | 110605 | 2027-10-20 | Mayfair 100% | 200 | None | ||||||
| 4272132 |
Guibord | 237687 | 2027-06-21 | Mayfair 100% | 200 | None | ||||||
| 4272132 |
Guibord, Munro | 237686 | 2027-06-21 | Mayfair 100% | 200 | None | ||||||
| 4272132 |
Guibord, Munro | 208539 | 2027-06-21 | Mayfair 100% | 200 | None | ||||||
| 737677 |
Guibord | 161029 | 2028-01-18 | Mayfair 100% | 400 | Meunier; 2329113 Ont Inc | ||||||
| 737677 |
Guibord | 278587 | 2028-01-18 | Mayfair 100% | 400 | Meunier; 2329113 Ont Inc | ||||||
| 737677 |
Guibord, Munro | 172259 | 2028-01-18 | Mayfair 100% | 400 | Meunier; 2329113 Ont Inc | ||||||
| 737677 |
Guibord, Munro | 127179 | 2028-01-18 | Mayfair 100% | 400 | Meunier; 2329113 Ont Inc | ||||||
| 737678 |
Guibord | 102172 | 2028-01-18 | Mayfair 100% | 200 | Meunier; 2329113 Ont Inc | ||||||
| 737678 |
Guibord | 278587 | 2028-01-18 | Mayfair 100% | 400 | Meunier; 2329113 Ont Inc | ||||||
| 737678 |
Guibord | 249548 | 2028-01-18 | Mayfair 100% | 200 | Meunier; 2329113 Ont Inc | ||||||
| 737678 |
Guibord | 161029 | 2028-01-18 | Mayfair 100% | 400 | Meunier; 2329113 Ont Inc | ||||||
| 737679 |
Guibord | 129350 | 2028-01-18 | Mayfair 100% | 200 | Meunier; 2329113 Ont Inc | ||||||
| 737679 |
Guibord | 278587 | 2028-01-18 | Mayfair 100% | 400 | Meunier; 2329113 Ont Inc | ||||||
| 737679 |
Guibord | 249548 | 2028-01-18 | Mayfair 100% | 200 | Meunier; 2329113 Ont Inc | ||||||
| 737679 |
Guibord | 230569 | 2028-07-07 | Mayfair 100% | 200 | Meunier; 2329113 Ont Inc | ||||||
| 7376802 |
Guibord | 230569 | 2028-07-07 | Mayfair 100% | 200 | Meunier; 2329113 Ont Inc | ||||||
| 7376802 |
Guibord | 278587 | 2028-01-18 | Mayfair 100% | 400 | Meunier; 2329113 Ont Inc | ||||||
| 7376802 |
Guibord, Munro | 171033 | 2027-07-07 | Mayfair 100% | 400 | Meunier; 2329113 Ont Inc | ||||||
| 7376802 |
Guibord, Munro | 127179 | 2028-01-18 | Mayfair 100% | 400 | Meunier; 2329113 Ont Inc | ||||||
| 7588952 |
Guibord | 292372 | 2028-01-18 | Mayfair 100% | 400 | Meunier; 2329113 Ont Inc | ||||||
| 7588952 |
Guibord, Mccool, Michaud, Munro |
169590 | 2028-01-18 | Mayfair 100% | 400 | Meunier; 2329113 Ont Inc | ||||||
| 7588952 |
Guibord, Michaud | 295969 | 2028-01-18 | Mayfair 100% | 400 | Meunier; 2329113 Ont Inc |
| Fenn-Gib Gold Project |
Page 33 | |
| NI 43-101 Technical Report and Pre-Feasibility Study |
December 19, 2025 | |
|
|
| Legacy Claim No. |
Township or Area |
Tenure ID (Cell No.) |
Anniversary |
Recorded Holder |
Work Required ($) |
Royalty Holders | ||||||
| 7588952 |
Guibord, Munro | 102606 | 2028-01-18 | Mayfair 100% | 400 | Meunier; 2329113 Ont Inc | ||||||
| 7588962 |
Guibord | 292372 | 2028-01-18 | Mayfair 100% | 400 | Meunier; 2329113 Ont Inc | ||||||
| 7588962 |
Guibord | 343062 | 2028-01-18 | Mayfair 100% | 200 | Meunier; 2329113 Ont Inc | ||||||
| 7588962 |
Guibord, Michaud | 296129 | 2028-01-18 | Mayfair 100% | 400 | Meunier; 2329113 Ont Inc | ||||||
| 7588962 |
Guibord, Michaud | 295969 | 2028-01-18 | Mayfair 100% | 400 | Meunier; 2329113 Ont Inc | ||||||
| 7588972 |
Guibord | 143705 | 2028-01-18 | Mayfair 100% | 200 | Meunier; 2329113 Ont Inc | ||||||
| 7588972 |
Guibord | 343062 | 2028-01-18 | Mayfair 100% | 200 | Meunier; 2329113 Ont Inc | ||||||
| 7588972 |
Guibord, Michaud | 296129 | 2028-01-18 | Mayfair 100% | 400 | Meunier; 2329113 Ont Inc | ||||||
| 7588972 |
Guibord, Michaud | 211597 | 2028-01-18 | Mayfair 100% | 200 | Meunier; 2329113 Ont Inc | ||||||
| 7588982 |
Guibord | 122493 | 2028-01-18 | Mayfair 100% | 200 | Meunier; 2329113 Ont Inc | ||||||
| 7588982 |
Guibord | 343062 | 2028-01-18 | Mayfair 100% | 200 | Meunier; 2329113 Ont Inc | ||||||
| 7588982 |
Guibord | 292372 | 2028-01-18 | Mayfair 100% | 400 | Meunier; 2329113 Ont Inc | ||||||
| 7588982 |
Guibord | 182387 | 2028-01-18 | Mayfair 100% | 400 | Meunier; 2329113 Ont Inc | ||||||
| 7588992 |
Guibord | 182387 | 2028-01-18 | Mayfair 100% | 400 | Meunier; 2329113 Ont Inc | ||||||
| 7588992 |
Guibord | 292372 | 2028-01-18 | Mayfair 100% | 400 | Meunier; 2329113 Ont Inc | ||||||
| 7588992 |
Guibord, Munro | 265007 | 2028-01-18 | Mayfair 100% | 400 | Meunier; 2329113 Ont Inc | ||||||
| 7588992 |
Guibord, Munro | 102606 | 2028-01-18 | Mayfair 100% | 400 | Meunier; 2329113 Ont Inc | ||||||
| 7589002 |
Mccool, Munro | 321590 | 2028-01-18 | Mayfair 100% | 200 | Meunier; 2329113 Ont Inc | ||||||
| 7589012 |
Guibord, Mccool, Michaud, Munro |
169590 | 2028-01-18 | Mayfair 100% | 400 | Meunier; 2329113 Ont Inc | ||||||
| 7589012 |
Mccool, Munro | 321590 | 2028-01-18 | Mayfair 100% | 200 | Meunier; 2329113 Ont Inc | ||||||
| 7589022 |
Guibord, Mccool, Michaud, Munro |
169590 | 2028-01-18 | Mayfair 100% | 400 | Meunier; 2329113 Ont Inc | ||||||
| 7589022 |
Mccool | 141919 | 2028-01-18 | Mayfair 100% | 200 | Meunier; 2329113 Ont Inc | ||||||
| 7589022 |
Mccool, Michaud | 340957 | 2028-01-18 | Mayfair 100% | 200 | Meunier; 2329113 Ont Inc | ||||||
| 7589022 |
Mccool, Munro | 321590 | 2028-01-18 | Mayfair 100% | 200 | Meunier; 2329113 Ont Inc | ||||||
| 7836562 |
Munro | 103522 | 2028-01-18 | Mayfair 100% | 200 | Meunier; 2329113 Ont Inc | ||||||
| 7836562 |
Munro | 185337 | 2028-01-18 | Mayfair 100% | 200 | Meunier; 2329113 Ont Inc | ||||||
| 7836572 |
Guibord, Munro | 234383 | 2028-01-18 | Mayfair 100% | 400 | Meunier; 2329113 Ont Inc | ||||||
| 7836572 |
Guibord, Munro | 265007 | 2028-01-18 | Mayfair 100% | 400 | Meunier; 2329113 Ont Inc | ||||||
| 7836572 |
Munro | 185337 | 2028-01-18 | Mayfair 100% | 200 | Meunier; 2329113 Ont Inc | ||||||
| 7836572 |
Munro | 103522 | 2028-01-18 | Mayfair 100% | 200 | Meunier; 2329113 Ont Inc | ||||||
| 7836582 |
Guibord, Munro | 172259 | 2028-01-18 | Mayfair 100% | 400 | Meunier; 2329113 Ont Inc | ||||||
| 7836582 |
Guibord, Munro | 234383 | 2028-01-18 | Mayfair 100% | 400 | Meunier; 2329113 Ont Inc | ||||||
| 7836582 |
Munro | 336091 | 2028-01-18 | Mayfair 100% | 200 | Meunier; 2329113 Ont Inc | ||||||
| 7836582 |
Munro | 103522 | 2028-01-18 | Mayfair 100% | 200 | Meunier; 2329113 Ont Inc | ||||||
| 7836592 |
Munro | 103522 | 2028-01-18 | Mayfair 100% | 200 | Meunier; 2329113 Ont Inc | ||||||
| 7836592 |
Munro | 336091 | 2028-01-18 | Mayfair 100% | 200 | Meunier; 2329113 Ont Inc | ||||||
| 7836602 |
Mccool, Michaud | 306824 | 2028-01-18 | Mayfair 100% | 200 | Meunier; 2329113 Ont Inc | ||||||
| 7836602 |
Mccool, Michaud | 344041 | 2028-01-18 | Mayfair 100% | 200 | Meunier; 2329113 Ont Inc | ||||||
| 7836602 |
Michaud | 182448 | 2028-01-18 | Mayfair 100% | 400 | Meunier; 2329113 Ont Inc | ||||||
| 7836602 |
Michaud | 165183 | 2028-01-18 | Mayfair 100% | 400 | Meunier; 2329113 Ont Inc | ||||||
| 7836612 |
Michaud | 164380 | 2028-01-18 | Mayfair 100% | 200 | Meunier; 2329113 Ont Inc | ||||||
| 7836612 |
Michaud | 338797 | 2028-01-18 | Mayfair 100% | 400 | Meunier; 2329113 Ont Inc |
| Fenn-Gib Gold Project |
Page 34 | |
| NI 43-101 Technical Report and Pre-Feasibility Study |
December 19, 2025 | |
|
|
| Legacy Claim No. |
Township or Area |
Tenure ID (Cell No.) |
Anniversary |
Recorded Holder |
Work Required ($) |
Royalty Holders | ||||||
| 7836612 |
Michaud | 182448 | 2028-01-18 | Mayfair 100% | 400 | Meunier; 2329113 Ont Inc | ||||||
| 7836612 |
Michaud | 165183 | 2028-01-18 | Mayfair 100% | 400 | Meunier; 2329113 Ont Inc | ||||||
| 7836622 |
Michaud | 164380 | 2028-01-18 | Mayfair 100% | 200 | Meunier; 2329113 Ont Inc | ||||||
| 7836622 |
Michaud | 338797 | 2028-01-18 | Mayfair 100% | 400 | Meunier; 2329113 Ont Inc | ||||||
| 7836622 |
Michaud | 326393 | 2028-01-18 | Mayfair 100% | 400 | Meunier; 2329113 Ont Inc | ||||||
| 7836622 |
Michaud | 285056 | 2028-01-18 | Mayfair 100% | 200 | Meunier; 2329113 Ont Inc | ||||||
| 7836632 |
Michaud | 152984 | 2028-01-18 | Mayfair 100% | 400 | Meunier; 2329113 Ont Inc | ||||||
| 7836632 |
Michaud | 326393 | 2028-01-18 | Mayfair 100% | 400 | Meunier; 2329113 Ont Inc | ||||||
| 7836632 |
Michaud | 285056 | 2028-01-18 | Mayfair 100% | 200 | Meunier; 2329113 Ont Inc | ||||||
| 7836632 |
Michaud | 266322 | 2028-01-18 | Mayfair 100% | 200 | Meunier; 2329113 Ont Inc | ||||||
| 7836642 |
Michaud | 152984 | 2028-01-18 | Mayfair 100% | 400 | Meunier; 2329113 Ont Inc | ||||||
| 7836642 |
Michaud | 274289 | 2028-01-18 | Mayfair 100% | 200 | Meunier; 2329113 Ont Inc | ||||||
| 7836642 |
Michaud | 266322 | 2028-01-18 | Mayfair 100% | 200 | Meunier; 2329113 Ont Inc | ||||||
| 7836642 |
Michaud | 219132 | 2028-01-18 | Mayfair 100% | 200 | Meunier; 2329113 Ont Inc | ||||||
| 7836652 |
Michaud | 122689 | 2028-01-18 | Mayfair 100% | 200 | Meunier; 2329113 Ont Inc | ||||||
| 7836652 |
Michaud | 326393 | 2028-01-18 | Mayfair 100% | 400 | Meunier; 2329113 Ont Inc | ||||||
| 7836652 |
Michaud | 323029 | 2028-01-18 | Mayfair 100% | 200 | Meunier; 2329113 Ont Inc | ||||||
| 7836652 |
Michaud | 266322 | 2028-01-18 | Mayfair 100% | 200 | Meunier; 2329113 Ont Inc | ||||||
| 7836662 |
Michaud | 152983 | 2028-01-18 | Mayfair 100% | 200 | Meunier; 2329113 Ont Inc | ||||||
| 7836662 |
Michaud | 274289 | 2028-01-18 | Mayfair 100% | 200 | Meunier; 2329113 Ont Inc | ||||||
| 7836662 |
Michaud | 157789 | 2028-01-18 | Mayfair 100% | 200 | Meunier; 2329113 Ont Inc | ||||||
| 7836662 |
Michaud | 152984 | 2028-01-18 | Mayfair 100% | 400 | Meunier; 2329113 Ont Inc | ||||||
| 7836672 |
Michaud | 117934 | 2028-01-18 | Mayfair 100% | 200 | Meunier; 2329113 Ont Inc | ||||||
| 7836672 |
Michaud | 285056 | 2028-01-18 | Mayfair 100% | 200 | Meunier; 2329113 Ont Inc | ||||||
| 7836672 |
Michaud | 152984 | 2028-01-18 | Mayfair 100% | 400 | Meunier; 2329113 Ont Inc | ||||||
| 7836672 |
Michaud | 152983 | 2028-01-18 | Mayfair 100% | 200 | Meunier; 2329113 Ont Inc | ||||||
| 7836732 |
Mccool, Munro | 321590 | 2028-01-18 | Mayfair 100% | 200 | Meunier; 2329113 Ont Inc | ||||||
| 7836732 |
Munro | 289219 | 2028-01-18 | Mayfair 100% | 200 | Meunier; 2329113 Ont Inc | ||||||
| 7836742 |
Guibord, Mccool, Michaud, Munro |
169590 | 2028-01-18 | Mayfair 100% | 400 | Meunier; 2329113 Ont Inc | ||||||
| 7836742 |
Guibord, Munro | 102606 | 2028-01-18 | Mayfair 100% | 400 | Meunier; 2329113 Ont Inc | ||||||
| 7836742 |
Mccool, Munro | 321590 | 2028-01-18 | Mayfair 100% | 200 | Meunier; 2329113 Ont Inc | ||||||
| 7836742 |
Munro | 289219 | 2028-01-18 | Mayfair 100% | 200 | Meunier; 2329113 Ont Inc | ||||||
| 7836752 |
Guibord, Munro | 102606 | 2028-01-18 | Mayfair 100% | 400 | Meunier; 2329113 Ont Inc | ||||||
| 7836752 |
Guibord, Munro | 265007 | 2028-01-18 | Mayfair 100% | 400 | Meunier; 2329113 Ont Inc | ||||||
| 7836752 |
Munro | 289219 | 2028-01-18 | Mayfair 100% | 200 | Meunier; 2329113 Ont Inc | ||||||
| 7836752 |
Munro | 185337 | 2028-01-18 | Mayfair 100% | 200 | Meunier; 2329113 Ont Inc | ||||||
| 7836762 |
Munro | 185337 | 2028-01-18 | Mayfair 100% | 200 | Meunier; 2329113 Ont Inc | ||||||
| 7836762 |
Munro | 289219 | 2028-01-18 | Mayfair 100% | 200 | Meunier; 2329113 Ont Inc | ||||||
| 7836772 |
Guibord, Mccool, Michaud, Munro |
169590 | 2028-01-18 | Mayfair 100% | 400 | Meunier; 2329113 Ont Inc | ||||||
| 7836772 |
Guibord, Michaud | 295969 | 2028-01-18 | Mayfair 100% | 400 | Meunier; 2329113 Ont Inc | ||||||
| 7836772 |
Mccool, Michaud | 340957 | 2028-01-18 | Mayfair 100% | 200 | Meunier; 2329113 Ont Inc | ||||||
| 7836772 |
Michaud | 177972 | 2028-01-18 | Mayfair 100% | 400 | Meunier; 2329113 Ont Inc |
| Fenn-Gib Gold Project |
Page 35 | |
| NI 43-101 Technical Report and Pre-Feasibility Study |
December 19, 2025 | |
|
|
| Legacy Claim No. |
Township or Area |
Tenure ID (Cell No.) |
Anniversary |
Recorded Holder |
Work Required ($) |
Royalty Holders | ||||||
| 7836782 |
Mccool, Michaud | 340957 | 2028-01-18 | Mayfair 100% | 200 | Meunier; 2329113 Ont Inc | ||||||
| 7836782 |
Michaud | 177972 | 2028-01-18 | Mayfair 100% | 400 | Meunier; 2329113 Ont Inc | ||||||
| 7836792 |
Michaud | 177972 | 2028-01-18 | Mayfair 100% | 400 | Meunier; 2329113 Ont Inc | ||||||
| 7836792 |
Michaud | 206995 | 2028-01-18 | Mayfair 100% | 400 | Meunier; 2329113 Ont Inc | ||||||
| 7836802 |
Guibord, Michaud | 295969 | 2028-01-18 | Mayfair 100% | 400 | Meunier; 2329113 Ont Inc | ||||||
| 7836802 |
Guibord, Michaud | 296129 | 2028-01-18 | Mayfair 100% | 400 | Meunier; 2329113 Ont Inc | ||||||
| 7836802 |
Michaud | 206995 | 2028-01-18 | Mayfair 100% | 400 | Meunier; 2329113 Ont Inc | ||||||
| 7836802 |
Michaud | 177972 | 2028-01-18 | Mayfair 100% | 400 | Meunier; 2329113 Ont Inc | ||||||
| 7836812 |
Guibord, Michaud | 211597 | 2028-01-18 | Mayfair 100% | 200 | Meunier; 2329113 Ont Inc | ||||||
| 7836812 |
Guibord, Michaud | 296129 | 2028-01-18 | Mayfair 100% | 400 | Meunier; 2329113 Ont Inc | ||||||
| 7836812 |
Michaud | 323029 | 2028-01-18 | Mayfair 100% | 200 | Meunier; 2329113 Ont Inc | ||||||
| 7836812 |
Michaud | 206995 | 2028-01-18 | Mayfair 100% | 400 | Meunier; 2329113 Ont Inc | ||||||
| 7836822 |
Michaud | 206995 | 2028-01-18 | Mayfair 100% | 400 | Meunier; 2329113 Ont Inc | ||||||
| 7836822 |
Michaud | 323029 | 2028-01-18 | Mayfair 100% | 200 | Meunier; 2329113 Ont Inc | ||||||
| 7836832 |
Mccool, Michaud | 306824 | 2028-01-18 | Mayfair 100% | 200 | Meunier; 2329113 Ont Inc | ||||||
| 7836832 |
Mccool, Michaud | 340957 | 2028-01-18 | Mayfair 100% | 200 | Meunier; 2329113 Ont Inc | ||||||
| 7836832 |
Michaud | 177972 | 2028-01-18 | Mayfair 100% | 400 | Meunier; 2329113 Ont Inc | ||||||
| 7836832 |
Michaud | 165183 | 2028-01-18 | Mayfair 100% | 400 | Meunier; 2329113 Ont Inc | ||||||
| 7836842 |
Michaud | 165183 | 2028-01-18 | Mayfair 100% | 400 | Meunier; 2329113 Ont Inc | ||||||
| 7836842 |
Michaud | 338797 | 2028-01-18 | Mayfair 100% | 400 | Meunier; 2329113 Ont Inc | ||||||
| 7836842 |
Michaud | 206995 | 2028-01-18 | Mayfair 100% | 400 | Meunier; 2329113 Ont Inc | ||||||
| 7836842 |
Michaud | 177972 | 2028-01-18 | Mayfair 100% | 400 | Meunier; 2329113 Ont Inc | ||||||
| 7836852 |
Michaud | 206995 | 2028-01-18 | Mayfair 100% | 400 | Meunier; 2329113 Ont Inc | ||||||
| 7836852 |
Michaud | 338797 | 2028-01-18 | Mayfair 100% | 400 | Meunier; 2329113 Ont Inc | ||||||
| 7836852 |
Michaud | 326393 | 2028-01-18 | Mayfair 100% | 400 | Meunier; 2329113 Ont Inc | ||||||
| 7836852 |
Michaud | 323029 | 2028-01-18 | Mayfair 100% | 200 | Meunier; 2329113 Ont Inc | ||||||
| 7836862 |
Guibord | 182387 | 2028-01-18 | Mayfair 100% | 400 | Meunier; 2329113 Ont Inc | ||||||
| 7836862 |
Guibord | 341457 | 2028-01-18 | Mayfair 100% | 400 | Meunier; 2329113 Ont Inc | ||||||
| 7836862 |
Guibord, Munro | 265007 | 2028-01-18 | Mayfair 100% | 400 | Meunier; 2329113 Ont Inc | ||||||
| 7836862 |
Guibord, Munro | 234383 | 2028-01-18 | Mayfair 100% | 400 | Meunier; 2329113 Ont Inc | ||||||
| 7836872 |
Guibord | 122493 | 2028-01-18 | Mayfair 100% | 200 | Meunier; 2329113 Ont Inc | ||||||
| 7836872 |
Guibord | 341457 | 2028-01-18 | Mayfair 100% | 400 | Meunier; 2329113 Ont Inc | ||||||
| 7836872 |
Guibord | 182387 | 2028-01-18 | Mayfair 100% | 400 | Meunier; 2329113 Ont Inc | ||||||
| 7836872 |
Guibord | 127699 | 2028-01-18 | Mayfair 100% | 200 | Meunier; 2329113 Ont Inc | ||||||
| 7836882 |
Guibord | 102172 | 2028-01-18 | Mayfair 100% | 200 | Meunier; 2329113 Ont Inc | ||||||
| 7836882 |
Guibord | 324287 | 2028-01-18 | Mayfair 100% | 200 | Meunier; 2329113 Ont Inc | ||||||
| 7836882 |
Guibord | 324286 | 2028-01-18 | Mayfair 100% | 200 | Meunier; 2329113 Ont Inc | ||||||
| 7836882 |
Guibord | 127699 | 2028-01-18 | Mayfair 100% | 200 | Meunier; 2329113 Ont Inc | ||||||
| 7836892 |
Guibord | 102172 | 2028-01-18 | Mayfair 100% | 200 | Meunier; 2329113 Ont Inc | ||||||
| 7836892 |
Guibord | 341457 | 2028-01-18 | Mayfair 100% | 400 | Meunier; 2329113 Ont Inc | ||||||
| 7836892 |
Guibord | 161029 | 2028-01-18 | Mayfair 100% | 400 | Meunier; 2329113 Ont Inc | ||||||
| 7836892 |
Guibord | 127699 | 2028-01-18 | Mayfair 100% | 200 | Meunier; 2329113 Ont Inc | ||||||
| 7836902 |
Guibord | 161029 | 2028-01-18 | Mayfair 100% | 400 | Meunier; 2329113 Ont Inc | ||||||
| 7836902 |
Guibord | 341457 | 2028-01-18 | Mayfair 100% | 400 | Meunier; 2329113 Ont Inc |
| Fenn-Gib Gold Project |
Page 36 | |
| NI 43-101 Technical Report and Pre-Feasibility Study |
December 19, 2025 | |
|
|
| Legacy Claim No. |
Township or Area |
Tenure ID (Cell No.) |
Anniversary |
Recorded Holder |
Work Required ($) |
Royalty Holders | ||||||
| 7836902 |
Guibord, Munro | 234383 | 2028-01-18 | Mayfair 100% | 400 | Meunier; 2329113 Ont Inc | ||||||
| 7836902 |
Guibord, Munro | 172259 | 2028-01-18 | Mayfair 100% | 400 | Meunier; 2329113 Ont Inc | ||||||
| 7836912 |
Munro | 184751 | 2028-01-18 | Mayfair 100% | 200 | Meunier; 2329113 Ont Inc | ||||||
| 7836912 |
Munro | 344243 | 2028-01-18 | Mayfair 100% | 400 | Meunier; 2329113 Ont Inc | ||||||
| 7836912 |
Munro | 299259 | 2028-01-18 | Mayfair 100% | 200 | Meunier; 2329113 Ont Inc | ||||||
| 7836912 |
Munro | 251563 | 2028-01-18 | Mayfair 100% | 200 | Meunier; 2329113 Ont Inc | ||||||
| 7836922 |
Munro | 174512 | 2028-01-18 | Mayfair 100% | 400 | Meunier; 2329113 Ont Inc | ||||||
| 7836922 |
Munro | 344243 | 2028-01-18 | Mayfair 100% | 400 | Meunier; 2329113 Ont Inc | ||||||
| 7836922 |
Munro | 336091 | 2028-01-18 | Mayfair 100% | 200 | Meunier; 2329113 Ont Inc | ||||||
| 7836922 |
Munro | 184751 | 2028-01-18 | Mayfair 100% | 200 | Meunier; 2329113 Ont Inc | ||||||
| 7836932 |
Munro | 174512 | 2028-01-18 | Mayfair 100% | 400 | Meunier; 2329113 Ont Inc | ||||||
| 7836932 |
Munro | 336091 | 2028-01-18 | Mayfair 100% | 200 | Meunier; 2329113 Ont Inc | ||||||
| 7836942 |
Munro | 251563 | 2028-01-18 | Mayfair 100% | 200 | Meunier; 2329113 Ont Inc | ||||||
| 7836942 |
Munro | 344243 | 2028-01-18 | Mayfair 100% | 400 | Meunier; 2329113 Ont Inc | ||||||
| 7836942 |
Munro | 322406 | 2028-01-18 | Mayfair 100% | 400 | Meunier; 2329113 Ont Inc | ||||||
| 7836942 |
Munro | 322405 | 2028-01-18 | Mayfair 100% | 200 | Meunier; 2329113 Ont Inc | ||||||
| 7836952 |
Munro | 174512 | 2028-01-18 | Mayfair 100% | 400 | Meunier; 2329113 Ont Inc | ||||||
| 7836952 |
Munro | 344243 | 2028-01-18 | Mayfair 100% | 400 | Meunier; 2329113 Ont Inc | ||||||
| 7836952 |
Munro | 322406 | 2028-01-18 | Mayfair 100% | 400 | Meunier; 2329113 Ont Inc | ||||||
| 7836952 |
Munro | 227695 | 2028-01-18 | Mayfair 100% | 400 | Meunier; 2329113 Ont Inc | ||||||
| 7836962 |
Munro | 174512 | 2028-01-18 | Mayfair 100% | 400 | Meunier; 2329113 Ont Inc | ||||||
| 7836962 |
Munro | 227695 | 2028-01-18 | Mayfair 100% | 400 | Meunier; 2329113 Ont Inc | ||||||
| 7836972 |
Guibord, Munro | 127179 | 2028-01-18 | Mayfair 100% | 400 | Meunier; 2329113 Ont Inc | ||||||
| 7836972 |
Guibord, Munro | 171033 | 2028-01-18 | Mayfair 100% | 400 | Meunier; 2329113 Ont Inc | ||||||
| 7836972 |
Munro | 227695 | 2028-01-18 | Mayfair 100% | 400 | Meunier; 2329113 Ont Inc | ||||||
| 7836972 |
Munro | 174512 | 2028-01-18 | Mayfair 100% | 400 | Meunier; 2329113 Ont Inc | ||||||
| 7836982 |
Guibord, Munro | 127179 | 2028-01-18 | Mayfair 100% | 400 | Meunier; 2329113 Ont Inc | ||||||
| 7836982 |
Guibord, Munro | 172259 | 2028-01-18 | Mayfair 100% | 400 | Meunier; 2329113 Ont Inc | ||||||
| 7836982 |
Munro | 336091 | 2028-01-18 | Mayfair 100% | 200 | Meunier; 2329113 Ont Inc | ||||||
| 7836982 |
Munro | 174512 | 2028-01-18 | Mayfair 100% | 400 | Meunier; 2329113 Ont Inc | ||||||
| 7837272 |
Munro | 153043 | 2028-01-18 | Mayfair 100% | 200 | Meunier; 2329113 Ont Inc | ||||||
| 7837272 |
Munro | 322406 | 2028-01-18 | Mayfair 100% | 400 | Meunier; 2329113 Ont Inc | ||||||
| 7837272 |
Munro | 322405 | 2028-01-18 | Mayfair 100% | 200 | Meunier; 2329113 Ont Inc | ||||||
| 7837272 |
Munro | 168333 | 2028-01-18 | Mayfair 100% | 400 | Meunier; 2329113 Ont Inc | ||||||
| 7837282 |
Munro | 123728 | 2028-01-18 | Mayfair 100% | 200 | Meunier; 2329113 Ont Inc | ||||||
| 7837282 |
Munro | 322406 | 2028-01-18 | Mayfair 100% | 400 | Meunier; 2329113 Ont Inc | ||||||
| 7837282 |
Munro | 227695 | 2028-01-18 | Mayfair 100% | 400 | Meunier; 2329113 Ont Inc | ||||||
| 7837282 |
Munro | 168333 | 2028-01-18 | Mayfair 100% | 400 | Meunier; 2329113 Ont Inc | ||||||
| 7837292 |
Munro | 123728 | 2028-01-18 | Mayfair 100% | 200 | Meunier; 2329113 Ont Inc | ||||||
| 7837292 |
Munro | 227695 | 2028-01-18 | Mayfair 100% | 400 | Meunier; 2329113 Ont Inc | ||||||
| 7837302 |
Guibord, Munro | 171033 | 2028-01-18 | Mayfair 100% | 400 | Meunier; 2329113 Ont Inc | ||||||
| 7837302 |
Guibord, Munro | 227696 | 2028-01-18 | Mayfair 100% | 200 | Meunier; 2329113 Ont Inc | ||||||
| 7837302 |
Munro | 227695 | 2028-01-18 | Mayfair 100% | 400 | Meunier; 2329113 Ont Inc | ||||||
| 7837302 |
Munro | 123728 | 2028-01-18 | Mayfair 100% | 200 | Meunier; 2329113 Ont Inc |
| Fenn-Gib Gold Project |
Page 37 | |
| NI 43-101 Technical Report and Pre-Feasibility Study |
December 19, 2025 | |
|
|
| Legacy Claim No. |
Township or Area |
Tenure ID (Cell No.) |
Anniversary |
Recorded Holder |
Work Required ($) |
Royalty Holders | ||||||
| 7837312 |
Munro | 123728 | 2028-01-18 | Mayfair 100% | 200 | Meunier; 2329113 Ont Inc | ||||||
| 7837322 |
Munro | 123728 | 2028-01-18 | Mayfair 100% | 200 | Meunier; 2329113 Ont Inc | ||||||
| 7837322 |
Munro | 168333 | 2028-01-18 | Mayfair 100% | 400 | Meunier; 2329113 Ont Inc | ||||||
| 7837332 |
Munro | 153043 | 2028-01-18 | Mayfair 100% | 200 | Meunier; 2329113 Ont Inc | ||||||
| 7837332 |
Munro | 168333 | 2028-01-18 | Mayfair 100% | 400 | Meunier; 2329113 Ont Inc | ||||||
| 7837342 |
Munro | 121382 | 2028-01-18 | Mayfair 100% | 200 | Meunier; 2329113 Ont Inc | ||||||
| 7837342 |
Munro | 205680 | 2028-01-18 | Mayfair 100% | 200 | Meunier; 2329113 Ont Inc | ||||||
| 7837342 |
Munro | 168333 | 2028-01-18 | Mayfair 100% | 400 | Meunier; 2329113 Ont Inc | ||||||
| 7837342 |
Munro | 153043 | 2028-01-18 | Mayfair 100% | 200 | Meunier; 2329113 Ont Inc | ||||||
| 7837352 |
Munro | 123728 | 2028-01-18 | Mayfair 100% | 200 | Meunier; 2329113 Ont Inc | ||||||
| 7837352 |
Munro | 330899 | 2028-01-18 | Mayfair 100% | 200 | Meunier; 2329113 Ont Inc | ||||||
| 7837352 |
Munro | 205680 | 2028-01-18 | Mayfair 100% | 200 | Meunier; 2329113 Ont Inc | ||||||
| 7837352 |
Munro | 168333 | 2028-01-18 | Mayfair 100% | 400 | Meunier; 2329113 Ont Inc | ||||||
| 78378022 |
Mccool | 141919 | 2028-01-18 | Mayfair 100% | 200 | Meunier; 2329113 Ont Inc | ||||||
| 7837802 |
Mccool, Munro | 321590 | 2028-01-18 | Mayfair 100% | 200 | Meunier; 2329113 Ont Inc | ||||||
| 7837812 |
Mccool, Michaud | 285102 | 2028-01-18 | Mayfair 100% | 200 | Meunier; 2329113 Ont Inc | ||||||
| 7837812 |
Mccool, Michaud | 344041 | 2028-01-18 | Mayfair 100% | 200 | Meunier; 2329113 Ont Inc | ||||||
| 7837812 |
Michaud | 225791 | 2028-01-18 | Mayfair 100% | 200 | Meunier; 2329113 Ont Inc | ||||||
| 7837812 |
Michaud | 182448 | 2028-01-18 | Mayfair 100% | 400 | Meunier; 2329113 Ont Inc | ||||||
| 7838172 |
Michaud | 164380 | 2028-01-18 | Mayfair 100% | 200 | Meunier; 2329113 Ont Inc | ||||||
| 7838172 |
Michaud | 225791 | 2028-01-18 | Mayfair 100% | 200 | Meunier; 2329113 Ont Inc | ||||||
| 7838172 |
Michaud | 189061 | 2028-01-18 | Mayfair 100% | 200 | Meunier; 2329113 Ont Inc | ||||||
| 7838172 |
Michaud | 182448 | 2028-01-18 | Mayfair 100% | 400 | Meunier; 2329113 Ont Inc | ||||||
| 7838182 |
Michaud | 189061 | 2028-01-18 | Mayfair 100% | 200 | Meunier; 2329113 Ont Inc | ||||||
| 7838182 |
Michaud | 311788 | 2028-01-18 | Mayfair 100% | 200 | Meunier; 2329113 Ont Inc | ||||||
| 7838182 |
Michaud | 311787 | 2028-01-18 | Mayfair 100% | 200 | Meunier; 2329113 Ont Inc | ||||||
| 7838182 |
Michaud | 225791 | 2028-01-18 | Mayfair 100% | 200 | Meunier; 2329113 Ont Inc | ||||||
| 8941743 |
Guibord | 203737 | 2027-07-14 | Mayfair 100% | 200 | A. Fenn | ||||||
| 8941743 |
Guibord | 276413 | 2027-07-14 | Mayfair 100% | 200 | A. Fenn | ||||||
| 8941743 |
Guibord, Munro | 323207 | 2027-07-14 | Mayfair 100% | 200 | A. Fenn | ||||||
| 8941743 |
Guibord, Munro | 294568 | 2027-07-14 | Mayfair 100% | 200 | A. Fenn | ||||||
| 8941783 |
Guibord, Munro | 251594 | 2027-07-14 | Mayfair 100% | 200 | A. Fenn | ||||||
| 8941783 |
Guibord, Munro | 294568 | 2027-07-14 | Mayfair 100% | 200 | A. Fenn | ||||||
| 8941793 |
Guibord, Munro | 294568 | 2027-07-14 | Mayfair 100% | 200 | A. Fenn | ||||||
| 8941793 |
Guibord, Munro | 323207 | 2027-07-14 | Mayfair 100% | 200 | A. Fenn | ||||||
| 8941793 |
Munro | 173320 | 2027-07-14 | Mayfair 100% | 200 | A. Fenn | ||||||
| 8941793 |
Munro | 155186 | 2027-07-14 | Mayfair 100% | 200 | A. Fenn | ||||||
| —3 |
Munro | 950149 | 2027-06-26 | Mayfair 100% | 400 | A. Fenn | ||||||
| 30157374 |
Guibord, Munro | 126576 | 2027-12-21 | Mayfair 100% | 200 | Meunier3 | ||||||
| 30157374 |
Munro | 271126 | 2027-12-21 | Mayfair 100% | 200 | Meunier3 | ||||||
| 30157374 |
Munro | 271125 | 2027-12-21 | Mayfair 100% | 200 | Meunier3 | ||||||
| 30157374 |
Guibord, Munro | 179863 | 2027-12-21 | Mayfair 100% | 200 | Meunier3 | ||||||
| 11924894 |
Guibord | 109887 | 2027-04-02 | Mayfair 100% | 200 | Meunier3 | ||||||
| 11924894 |
Guibord | 325857 | 2027-04-02 | Mayfair 100% | 200 | Meunier3 |
| Fenn-Gib Gold Project |
Page 38 | |
| NI 43-101 Technical Report and Pre-Feasibility Study |
December 19, 2025 | |
|
|
| Legacy Claim No. |
Township or Area |
Tenure ID (Cell No.) |
Anniversary |
Recorded Holder |
Work Required ($) |
Royalty Holders | ||||||
| 11924894 |
Guibord | 275832 | 2027-04-02 | Mayfair 100% | 200 | Meunier3 | ||||||
| 11924894 |
Guibord | 275831 | 2027-04-02 | Mayfair 100% | 200 | Meunier3 | ||||||
| 11924894 |
Guibord | 259178 | 2027-04-02 | Mayfair 100% | 400 | Meunier3 | ||||||
| 11924894 |
Guibord | 203147 | 2027-04-02 | Mayfair 100% | 200 | Meunier3 | ||||||
| 11924894 |
Guibord | 172897 | 2027-04-02 | Mayfair 100% | 200 | Meunier3 | ||||||
| 11924894 |
Guibord | 144336 | 2027-04-02 | Mayfair 100% | 200 | Meunier3 | ||||||
| 11924894 |
Guibord | 138341 | 2027-04-02 | Mayfair 100% | 200 | Meunier3 | ||||||
| 42578204 |
Guibord, Munro | 179863 | 2027-12-21 | Mayfair 100% | 200 | Meunier3 | ||||||
| 42578204 |
Munro | 271126 | 2027-12-21 | Mayfair 100% | 200 | Meunier3 | ||||||
| 42578204 |
Munro | 271125 | 2027-12-21 | Mayfair 100% | 200 | Meunier3 | ||||||
| 42578204 |
Munro | 215180 | 2027-12-21 | Mayfair 100% | 200 | Meunier3 | ||||||
| 42578204 |
Guibord, Munro | 185902 | 2027-12-21 | Mayfair 100% | 200 | Meunier3 |
Note:
| 1. | Claims subject to a 2% NSR |
| 2. | Claims subject to 2.5% NSR (2.25% Meunier and 0.25% 2329113 Ontario Inc.) |
| 3. | Claims subject to a 5% NPR |
| 4. | Claims subject to a 2.5% NSR |
NSR = net smelter return; NPI = net profits interests
For further information on royalties, please see Section 4.8 below
| Table 4-2: | Summary of Mining Patents |
| Patents |
Township |
Parcel No. |
Legal Rights |
Description |
Ha |
PIN No. |
Royalty Holder/s | |||||||
| PAT-490811 |
Guibord | 4220SEC | Mining and Surface Rights | L9189, NE1/4 of S1/2 Lot 8 Con 6 | 16.946 | 65379-0191(LT) | None | |||||||
| PAT-490821 |
Guibord | 4219SEC | Mining and Surface Rights | L9190, SE1/4 of S1/2 Lot 8 Con 6 | 16.946 | 65379-0192(LT) | None | |||||||
| PAT-490801 |
Guibord | 4217SEC | Mining and Surface Rights | L9188, SE 1/4 of N1/2 Lot 8 Con 6 | 16.946 | 65379-0189(LT) | None | |||||||
| PAT-490791 |
Guibord | 4218SEC | Mining and Surface Rights | L8290, SW1/4 of S1/2 Lot 7 Con 6 | 16.896 | 65379-0194(LT) | None | |||||||
| PAT-490781 |
Guibord | 4215SEC | Mining and Surface Rights | L9252, SE1/4 of S1/2 Lot 7 Con 6 | 17.3 | 65379-0195(LT) | None | |||||||
| PAT-490771 |
Guibord | 4216SEC | Mining and Surface Rights | L8289, NW1/4 of S1/2 Lot 7 Con 6 | 16.896 | 65379-0193(LT) | None | |||||||
| PAT-272961 |
Munro | 2636SEC | Mining and Surface Rights | NE 1/4 OF S 1/2 OF LOT 9 CON 1 | 16.036 | 65367-0116(LT) | None | |||||||
| PAT-43491 |
Guibord | 11391SEC | Mining and Surface Rights | NE 1/4 OF N 1/2 LOT 7 CON 6 - L45564 | 16.896 | 65379-0196(LT) | None | |||||||
| L455611 |
Munro | 11516SEC | Surface Rights | L45561 | 16 | 65367-0145(LT) | Same land as L894178 |
| Fenn-Gib Gold Project |
Page 39 | |
| NI 43-101 Technical Report and Pre-Feasibility Study |
December 19, 2025 | |
|
|
| Patents |
Township |
Parcel No. |
Legal Rights |
Description |
Ha |
PIN No. |
Royalty Holder/s | |||||||
| L455621 |
Munro | 11393SEC | Surface Rights | L45562 | 16 | 65367-0119(LT) | Same land as L894179 | |||||||
| L455631 |
Guibord | 11392SEC | Surface Rights | L45563 | 16 | 65379-0197(LT) | Same land as L894174 | |||||||
| PAT-487971,2 |
Munro | 12010SEC | Mining Rights | SE1/4 S1/2 LOT 10 CON 1 - L52228 | 15.682 | 65367-0153(LT) | Backman | |||||||
| PAT-26403 |
Guibord | 4074SEC | Mining and Surface Rights |
SW1/4 of N1/2 Lot 9 Con 6 | 16.744 | 65379-0186(LT) | Dyer | |||||||
| PAT-26393 |
Guibord | 281SEC | Mining and Surface Rights |
NW1/4 of N1/2 Lot 9 Con 6 | 16.744 | 65379-0185(LT) | Dyer | |||||||
| PAT-26383 |
Guibord | 3920SEC | Mining and Surface Rights |
NW1/4 of S1/2 Lot 1 Con 6 | 16.592 | 65379-0201(LT) | Dyer | |||||||
| PAT-26373 |
Guibord | 3929SEC | Mining and Surface Rights |
NE1/4 of S1/2 Lot 2 Con 6 | 17.199 | 65379-0200(LT) | Dyer | |||||||
| PAT-54943 |
Guibord | 9275SEC | Mining and Surface Rights | LOT 8 CON 3 - L37004 | 16.187 | 65379-0159(LT) | New Klondike Exploration | |||||||
| PAT-54933 |
Guibord | 9274SEC | Mining and Surface Rights | LOT 7 CON 3 - L37003 | 16.137 | 65379-0160(LT) | New Klondike Exploration | |||||||
| PAT-54923 |
Guibord | 9273SEC | Mining and Surface Rights | LOT 7 CON 3 - L37002 | 16.137 | 65379-0161(LT) | New Klondike Exploration | |||||||
| PAT-54913 |
Guibord | 9271SEC | Mining and Surface Rights | NW 1/4 OF S 1/2 LOT 5, CON 2, L36779 | 16.238 | 65379-0135(LT) | New Klondike Exploration | |||||||
| PAT-54903 |
Guibord | 9272SEC | Mining and Surface Rights | LOT 6 CON 2 - L36778 | 16.238 | 65379-0134(LT) | New Klondike Exploration |
Note:
| 1. | Subject to Barrick Gold Corporation’s back-in rights, described in Section 4.8 |
| 2. | 5% NPR |
| 3. | 2% NSR |
NSR = net smelter return; NPI = net profits interests
| 4.5 | Property Agreements |
There are no property agreements nor obligations that must be met to retain the Property other than the obligations described above related to maintaining claims and leases in good standing.
| Fenn-Gib Gold Project |
Page 40 | |
| NI 43-101 Technical Report and Pre-Feasibility Study |
December 19, 2025 | |
|
|
| 4.6 | Surface Rights |
Mayfair Gold does not have a right, title, or claim to the surface rights of the claims except to enter upon, use, and occupy such part or parts necessary for the purpose of prospecting and exploration (Ontario Mining Act, R.S. O. 1990, Chapter M).
Mayfair Gold owns fee simple surface and mineral rights on all 21 patented properties. On mining leases, the Company holds surface rights for mining and exploration purposes. Mayfair Gold holds sufficient surface rights necessary for current and anticipated future exploration activities on the Project
| Figure 4-2: | Location of Surface Rights |
Source: Mayfair, 2025
| Fenn-Gib Gold Project |
Page 41 | |
| NI 43-101 Technical Report and Pre-Feasibility Study |
December 19, 2025 | |
|
|
| 4.7 | Water Rights |
Water rights for mining operations in Ontario are regulated under the Ontario Water Resources Act. Permits from the Ministry of the Environment, Conservation and Parks are required for water takings exceeding specified thresholds. To date, Mayfair Gold’s exploration activities do not require water permits. As development activities are anticipated to progress, appropriate water permits will be obtained as required.
| 4.8 | Royalties and Encumbrances |
Mayfair Gold owns a 100% interest in 21 fee simple patented properties, 145 unpatented mining claims, and six mining lease properties in the Guibord, Munro, Michaud, and McCool Townships in northeast Ontario, Canada (collectively, the Fenn-Gib Project). LSG agreed to sell the Project to Mayfair pursuant to an asset purchase agreement dated June 8, 2020. Concurrent with the closing of Mayfair’s acquisition of the Fenn-Gib Project, Mayfair granted LSG a 1% NSR royalty over the Project to be paid in addition to those summarized in Table 4-1 and Table 4-2. LSG subsequently sold the interest in the 1% NSR royalty to Metalla Royalty and Smelting Ltd.
Barrick Gold Corporation holds a back-in right to acquire a 51% interest in certain claims (as noted in Table 4-2) within the Project by paying Mayfair twice the expenditures made on the property and to advance the Project. This right is triggered if a NI 43-101 technical report demonstrates a mineral resource of at least 5 million ounces (“Moz”) of gold on the relevant claims. This right expires on August 18, 2032.
Portions of the property are subject to a 5% NPR. The NPR is equal to 5% of net profits (gross revenues minus operating expenses, sustaining capital costs and taxes that can be reasonably attributed to the mining, processing, refining and sale of ores, metals and/or concentrates) derived from production from the mining claims after payback of the capital expenditures necessary to bring the mining claim into production. None of the mineral resource or reserves presented in this report are subject to this NPR.
A summary of the various royalties on the property is presented in Figure 4-3.
| Fenn-Gib Gold Project |
Page 42 | |
| NI 43-101 Technical Report and Pre-Feasibility Study |
December 19, 2025 | |
|
|
| Figure 4-3: | Fenn-Gib Royalties |
Source: Mayfair, 2025
| 4.9 | Environmental Considerations |
No material environmental liabilities have been identified to date.
| 4.10 | Permitting Considerations |
There are two valid exploration permits in place on the Fenn-Gib North Block that includes mechanized drilling, Exploration Permit PR-23-000124 issued on June 14, 2023, and Exploration Permit PR-25-000120 issued on July 29, 2025. There are no active exploration permits on the Fenn-Gib South Block. All exploration permits are valid for a term of three years from the date of issue and issued pursuant to subsection 78.3(2) of the Mining Act, R.S.O. 1990, Chapter M.
| Fenn-Gib Gold Project |
Page 43 | |
| NI 43-101 Technical Report and Pre-Feasibility Study |
December 19, 2025 | |
|
|
| 4.11 | Social License Considerations |
See Section 20 for details relating to the social license considerations.
| 4.12 | Project risks and Uncertainties |
The QP did not independently verify the legality of any underlying agreement that may exist concerning the licences or other agreements between third parties but have instead relied on the client’s solicitors to have conducted the proper legal due diligence.
The QP is not aware of any other significant factors and risks that would affect Mayfair’s access, title, or the right or ability to perform work on the proper.
| Fenn-Gib Gold Project |
Page 44 | |
| NI 43-101 Technical Report and Pre-Feasibility Study |
December 19, 2025 | |
|
|
| 5 | ACCESSIBILITY, CLIMATE, LOCAL RESOURCES, INFRASTRUCTURE AND PHYSIOGRAPHY |
| 5.1 | Accessibility |
The Property is easily accessible, east from Timmins, via Highway 101, which crosses the upper central part of the property. The highway links the provinces of Ontario and Quebec between the towns of Matheson and Duparquet; the highway becomes Autoroute 388 in the Province of Quebec. A few drill trails cross the property in a north-south direction.
| 5.2 | Climate |
Climatic conditions are continental; characterized by cold winters with snow, and warm summers with moderate precipitation. The temperature ranges between 11°C to 25°C during the summer and between -10°C to -25°C during the winter. July is the warmest month and January the coldest. Total precipitation ranges between 801 and 1,200 millimeter per year (“mm/a”). The rainiest month is July, with an average of 92 mm, and January gets an average of 62 mm of snow. Exploration and site activities can be undertaken all year long. However, work is made difficult during transitional seasons where the ground is saturated with water from the melting snow in spring, and before winter when lakes are not frozen.
| 5.3 | Local Resources and Infrastructure |
The Project benefits from its location near multiple established mining centers, including Matheson (pop. 2,500) just 17 km from the Project, and the larger mining hubs of Kirkland Lake (pop. 6,000), Timmins (pop. 41,000), and Rouyn-Noranda (pop. 42,000) all within a one-hour drive, providing access to mining services, skilled labour, and supplies.
An Ontario Hydro 27 kilovolt (“kV”) power-transmission line follows Highway 101 through the property; a high-voltage transformer station is located at Ramore, some 15 km to the southwest. Natural gas is available approximately 17.5 km away, and there is a compressed natural gas (“CNG”) station between Timmins and Matheson with a capacity of 10,000 gigajoules/day (“GJ/d”).
The Project is partially transected by Highway 101, which provides easy access to the Project. The highway is not viewed as an impediment or risk to development currently, but realignment of the highway will be required as part of future Project development.
In addition, the area is generally and intermittently covered by shallow sloughs and wetlands. Some streams and water bodies on site are considered fish habitat, as a few small-bodied fish were captured during surveys. Many streams are not well-defined channels and instead flow as braided surface water through wet, boggy forest. Studies to determine the flora and fauna that may be affected by potential mining operations and infrastructure are ongoing. However, it is not believed that these water bodies and features pose a risk to development. It is not believed there is any risk to access, permitting, or social license based on information available at this time.
| Fenn-Gib Gold Project |
Page 45 | |
| NI 43-101 Technical Report and Pre-Feasibility Study |
December 19, 2025 | |
|
|
| 5.4 | Physiography |
The Project lies within the extensive Abitibi Clay Belt, a continuous flat-lying sheet of glaciolacustrine sediments deposited in glacial lakes Barlow and Ojibway as the Laurentide Ice Sheet receded during the Quaternary period approximately 10,000 years ago. A large glaciofluvial deposit, the Munro Esker, flanks the Project area on the east, rising about 40 m above the clay plain.
Averaging 315 meters above sea level (“masl”), most of the Property is covered by dense alder swamp that supports a thin growth of poorly developed black spruce. Higher parts of the area support a mature growth of black spruce, jack pine, poplar, and white birch. Most of the timber on the Project site has little commercial value, but the esker’s well-drained sands and gravels support commercially valuable white pine stands. Differences in elevation are not more than 15 m throughout the Property.
| 5.5 | Seismicity |
The Project area lies within a low seismic hazard zone as defined by the 2020 National Building Code of Canada, with a low probability of experiencing damaging ground motion from seismic events.
| Fenn-Gib Gold Project |
Page 46 | |
| NI 43-101 Technical Report and Pre-Feasibility Study |
December 19, 2025 | |
|
|
| 6 | HISTORY |
| 6.1 | Regional History |
From its initial discovery and work in 1911 the Fenn-Gib Property has been explored and developed by various operators, including Pangea Goldfields Incorporated, LSG, and Tahoe Resources Inc. (“Tahoe”).
In 2011, LSG completed a program of eight drill holes, three of which were twins used for verification purposes. In addition, Dagbert & Desharnais (2011) authored an NI 43-101 technical report and MRE.
During 2012, exploration activities conducted on the Fenn-Gib Property in the southwest half of Lot 5 Concession VI consisted of LSG’s drilling contractors, Norex Drilling Ltd., completing 34 diamond drill holes (“DDH”) totalling 15,802 m. Reconnaissance mapping and prospecting were also carried out on both the North and South claim blocks during 2012.
During 2014, LSG carried out outcrop investigations and prospecting consisting of 14 samples.
During 2017, Tahoe conducted a surface-definition diamond drilling program on the Fenn-Gib Deposit, which included 98 holes for a total of 40,235 m. After 2017, Tahoe completed no further exploration activities or drilling at Fenn-Gib.
| 6.2 | Property Exploration History |
Since its initial discovery and early exploration in 1911, the Fenn-Gib property has been explored and developed by various operators. In 2017 LSG carried out the last physical work prior to Mayfair’s acquisition on December 31, 2020. The primary sources of information referenced and paraphrased in this section are historical, with significant reliance on the findings presented in the Dagbert & Desharnais (2011), which also referenced Pangea’s Fenn-Gib Drilling Report (Brown, 2002).
Figure 6-1 illustrates the position of various mineral showings on or around the Fenn-Gib Project. Table 6-1 summarizes the exploration activities conducted. Further details on the exploration history may be reviewed in Maunula (2023) and Dagbert & Desharnais (2011).
| Fenn-Gib Gold Project |
Page 47 | |
| NI 43-101 Technical Report and Pre-Feasibility Study |
December 19, 2025 | |
|
|
| Figure 6-1: | Geological Map Illustrating Mineral Showings (historic claim block outline) |
Source: SGS, 2011
| Fenn-Gib Gold Project |
Page 48 | |
| NI 43-101 Technical Report and Pre-Feasibility Study |
December 19, 2025 | |
|
|
| Table 6-1: | Exploration History |
| Name |
Identifier |
Description |
Source Map |
Commodity | ||||
| American Eagle Mine | MDI42A09SE00018 | The shaft 0.03 km north and 2.2 km east of the southwest corner of Munro Township |
OGS 1980, P866 Munro TP | Gold | ||||
| Backhoe Till Sample 85-110B | MDI42A08NE00049 | Sample pit | OGS 1986 MAP 80-843 | Gold | ||||
| Backhoe Till Sample 85-111B | MDI42A08NE00050 | Sample pit | OGS 1986 MAP 80-843 | Gold | ||||
| Backhoe Till Sample 85-112B | MDI42A08NE00051 | Sample pit | OGS 1986 MAP 80-843 | Gold | ||||
| Barrett-1 | MDI42A09SE00155 | Diamond drill hole | OGS 1951 MAP 1951-6 Guibord | Gold, copper, zinc | ||||
| Bird, S. J. | MDI42A09SE00057 | Pit | OGS 1987 GDIF 399 Exploration Data Map | Gold | ||||
| C4 | NA | Several anomalous gold including 6.7 m at 7.1 g/t Au (C4-1A) |
Rennick 2004 (Tandem Resources HW101) | Gold | ||||
| Cameron | MDI42A09SE00062 | Trenches & DDH | OGS 1987 GDIF 399 Exploration Data Map | Gold, zinc | ||||
| Canadian Johns Mansville | MDI42A09SE00193 | Stripped area | OGS 1987 GDIF 399 Exploration Data Map | Gold, copper | ||||
| Cominco-1 | MDI42A09SE00054 | Diamond drill hole (G80-1: 1.9 m at 5.4 g/t Au) | OGS 1987 GDIF 399 Exploration Data Map | Gold | ||||
| Cominco-2 | MDI42A09SE00187 | Point | OGS 1987, GDIF 399 Exploration Data Map | Gold, copper | ||||
| Gibb East G-213 | MDI000000000540 | DDH G-313 in assessment file KL-5295 | DDH G-213 | Gold | ||||
| Gibb East G-215 | MDI000000000539 | Diamond drill hole G-215 | DDH G-215 | Gold | ||||
| Gibb East G216 | MDI000000000541 | DDH G-216 in assessment file KL-5295 | DDH G-216 in file KL-5295 | Gold | ||||
| Gibb East G217 | MDI000000000542 | DDH G-217 in assessment file KL-5295 | DDH G-217 | Gold | ||||
| Guibord Lake East | MDI42A09SE00190 | Diamond drill hole 397 | OGS 1987 GDIF 399 Exploration Data Map | Gold, copper, zinc | ||||
| Guibord Lake West | MDI42A08SE00121 | Diamond drill hole #398 | OGS 1987 GDIF 399 Exploration Data Map | Gold, copper, lead, zinc | ||||
| GUI-POR #1 | MDI42A09SE00052 | Point | OGS 1987 GDIF 399 Exploration Data Map | Gold | ||||
| Hansen-Mcdonnell | MDI42A09SE00063 | Point | OGS 1987 GDIF 399 Exploration Data Map | Gold | ||||
| Hislop-East | MDI42A08SW00019 | Quartz vein | OGS 1956 MAP 1955-5 Township of Hislop | Gold | ||||
| Sonic Drill Hole 87-42 | MDI42A09SE00066 | Diamond drill hole 87-42 | OGS 1988 Map 81-119 | Gold | ||||
| Skjonsby | N/A | N/A | N/A | Gold | ||||
| Talisman | MDI42A09SE00188 | Shaft | OGS 1951 AR VOL 60 PT9 MAP 1951-6 Guibord | Gold, lead, silver |
Note: 1. Refer to Figure 6-1 for location. 2. Mainly compiled by the Ontario Ministry of Northern Development and Mines
| Fenn-Gib Project |
Page 49 | |
| NI 43-101 Technical Report and Pre-Feasibility Study |
December 19, 2025 | |
|
|
| 6.2.1 | Pangea Goldfields Inc. (1990s - 2012) |
Pangea Goldfields Inc. (Pangea) completed diamond drilling on the Fenn-Gib Deposit during the mid to late 1990s, using predominantly BQ and NQ diameter core. Pangea’s work is documented in Brown (2002).
| 6.2.2 | Lake Shore Gold Corp. and Tahoe Resources Inc. (2011 - 2019) |
LSG carried out exploration between 2012 and 2019 as summarized in Table 6-2. Additional details regarding the programs and results can be found in Maunula (2023).
Tahoe acquired LSG as a subsidiary on February 10, 2016. Pan American Silver Corp. (Pan American) bought Tahoe Resources on February 12, 2019, and LSG became its subsidiary.
| Table 6-2: | LSG and Tahoe Exploration Activities |
| Year |
Company |
Description | ||
| 2012 |
LSG | Diamond drill program: 34 drill holes totalling 15,802 m | ||
| LSG | Reconnaissance mapping and prospecting: 291 field samples | |||
| 2014 |
LSG | Outcrop investigation and prospecting: 14 samples | ||
| 2017 |
Tahoe | Definition diamond drill programs: 80 drill holes, 32,1013 m and 4 drill holes, 2,589 m | ||
| Tahoe | Exploration diamond drill program: 14 drill holes, 5,653 m | |||
| Tahoe | Metallurgical testwork: 14 composite samples from 1⁄2 cut NQ drill core |
On June 8, 2020, the Company entered into a binding asset purchase agreement with LSG for the Fenn-Gib Project. Under the terms of the agreement, Mayfair Gold agreed to acquire 21 fee simple patented properties, 144 unpatented mining claims, and 153 patented leasehold mining claims located in the Guibord, Munro, Michaud, and McCool Townships in northeast Ontario. The Company assumed 100% ownership of the Project on December 31, 2020, and commenced exploration in mid-January 2021.
| 6.3 | Historical Resource Estimates |
SGS completed a MRE in 2011 that included 40.8 million tonnes (“Mt”) grading 0.99 g/t Au in the Indicated category and 24.5 Mt at 0.95 g/t Au in the Inferred category (Dagbert & Desharnais, 2011). The indicated and inferred mineral resources are historical estimates and use the categories set out in NI 43-101, effective as of November 17, 2011. The QP has not done sufficient work to classify the historical estimate as current mineral resources; and the company is not treating the historical estimate as current mineral resources.
| Fenn-Gib Project |
Page 50 | |
| NI 43-101 Technical Report and Pre-Feasibility Study |
December 19, 2025 | |
|
|
Between 2020 and 2023 the Company commissioned three mineral resource updates on the Project. The QP has not done sufficient work to classify the following historical estimates as current mineral resources; and the company is not treating these historical estimates as current mineral resources:
| | An open pit-constrained NI 43-101 MRE dated February 5, 2021, which reported a total indicated mineral resource of 70.2 Mt containing 2.08 Moz of gold grading 0.921 g/t Au, and an inferred mineral resource of 3.8 Mt containing 75,000 oz of gold grading 0.618 g/t Au at a 0.35 g/t Au cut-off grade (Kirkham et al., 2021). The 2021 MRE is not current and should not be relied upon. |
| | An updated NI 43-101 MRE of an open pit constrained indicated mineral resource of 118.07 Mt containing 3.06 Moz of gold grading 0.81 g/t Au, and an inferred mineral resource of 13.8 Mt containing 0.31 Moz of gold grading 0.70 g/t Au at a 0.35 g/t Au cut-off grade (Mayfair Gold, October 2022). The 2022 MRE is not current and should not be relied upon. |
| | The mineral resources for the Project within a 50° constrained open pit at a 0.4 g/t Au cut-off grade were indicated resource of 113.7 Mt at 0.93 g/t Au and an inferred resource of 5.7 Mt at 0.85 g/t Au with an effective date of April 6, 2023 (Maunula, 2023). The 2023 MRE is not current and should not be relied upon. |
| 6.4 | Production |
No significant historical production has occurred on the site.
| Fenn-Gib Project |
Page 51 | |
| NI 43-101 Technical Report and Pre-Feasibility Study |
December 19, 2025 | |
|
|
| 7 | GEOLOGICAL SETTING AND MINERALIZATION |
| 7.1 | Regional Geology |
The Project is in the southern portion of the Abitibi Subprovince, which is part of the Superior Province of the Canadian Shield. The Abitibi Subprovince is principally composed of volcanic and sedimentary assemblages that have generally been metamorphosed to greenschist facies and intruded by late tectonic plutons of tonalite and trondhjemite affinity. The Project area is underlain by rocks of the Hoyle Assemblage (sedimentary) and the Kidd-Munro Assemblage (volcanic) and lies on the northern portion of the Blake River Synclinorium and approximately 2 km north of the Porcupine-Destor Fault (Figure 7-1).
The main structural features of the area are the Blake River Synclinorium, the Porcupine-Destor Fault Zone and the Cadillac-Larder Lake Fault Zone. The fault zones are respectively located on the north and south limbs of the synclinorium. These structures were formed during the Kenoran Orogeny, a period of north-south compression. It appears that all known major gold deposits in the southern Abitibi are located within a few kilometers of these two fault zones.
Within the vicinity of the Project the Porcupine-Destor Fault Zone occurs as a Z-shaped sigmoidal structure that splits into three branches. Both extremities of the Z-shaped structure are east-west trending, while the central portion is more southeasterly trending. Due to poor exposure, the sense and magnitude of displacement along the structure in the Project area is unknown but based on more regional information it is thought to be mainly vertical. In the Timmins area where it is well exposed, a sinistral strike-slip movement with a vertical component is reported, whereby the south block moved up relative to the north block (Berger, 2002).
| Fenn-Gib Project |
Page 52 | |
| NI 43-101 Technical Report and Pre-Feasibility Study |
December 19, 2025 | |
|
|
| Figure 7-1: | Regional Geology Plan |
Note: The location of the Project is shown by the red square. Source: Berger, 2002
| Fenn-Gib Project |
Page 53 | |
| NI 43-101 Technical Report and Pre-Feasibility Study |
December 19, 2025 | |
|
|
| 7.2 | Project Geology |
The Project is underlain by the dominantly volcanic Kidd-Munro assemblage to the north and the dominantly sedimentary Hoyle assemblage to the south. The two sequences are juxtaposed along the Contact Fault, an east-west to southeast trending shear zone, which is interpreted to be a splay of the Porcupine-Destor Fault Zone. Within the deposit, the Contact Fault is characterized by brittle deformation accompanied by intense carbonatization and silicification. Rocks from both assemblages were intruded by a variety of late intrusive rock including syenite and granitoid plugs and dykes, lamprophyre dykes, and diabase dykes. A 3 km-long, by 100 to 200 m-wide mafic intrusive complex intrudes the Kidd-Munro Assemblage at or near its southern contact.
All lithologic units in and adjacent to the Deformation Zone are moderately to intensely altered. This alteration persists for a distance north and south of the fault, outlining a major alteration halo at least 2 km long and 500 m wide. A variety of alteration styles occur within the broad alteration halo, including silicification, albitization, potash metasomatism, carbonatization, sericitization, chloritization, and hematization. Fuchsite (Mariposite) can occur within the Deformation Zone. Sulphide mineralization, mainly pyrite, occurs as disseminations and fracture fillings in concentrations ranging from trace to 20% in association with the more strongly altered areas. Gold is commonly associated with the sulphide mineralization, especially in areas of coincident silicification and albitization.
Several styles of gold mineralization have been identified within the Project area. The most common style consists of quartz-carbonate veins, stringers, and breccias hosted within intensely altered volcanic rocks and granitoid intrusions (i.e., the Main Zone and Deformation Zone). A second style is characterized by gold associated with intensely altered sediments, containing variable amounts of fine crystalline pyrite within and in the hanging wall to the Deformation Zone. A third style involves gold mineralization related to alteration, shearing, and sulphide mineralization within north-northeast-trending structures including the Main Zone, Deformation Zone, and Footwall Zone.
| 7.3 | Mineralization |
Significant concentrations of gold mineralization on the Project primarily occur within two zones, the Main Zone and the Deformation Zone. These two zones overlap and are shown in Figure 7-2. The third zone, Footwall Zone, also contains gold mineralization and is approximately 100 m north of the Main Zone.
The Main Zone is a broad zone (average width of 100 m) of disseminated gold mineralization up to 500 m along strike, with grades for gold between 0.50 and 3.00 g/t Au. Massive, pillowed, and variolitic basalts crop out and can be seen in diamond drill core from holes collared near Highway 101. Hydrothermally altered variolitic basalts are the principal hosts of the Main Zone mineralization. These basalts were affected by pervasive and vein silicification, carbonatization, albitization, pervasive but weak hematization, and vein sericitization. Syenite and lamprophyre dykes intruded the basalts and are locally mineralized. Pyrite is the main sulphide mineral and occurs as disseminations and in veins, locally up to 50%, over narrow intervals (average 5% to 10%).
The Deformation Zone contains narrower and higher-grade intersections associated with altered sediments, intermediate dykes, and grey syenite. Gold mineralization is associated with pyrite either in quartz-healed breccias or as very fine disseminations. The Contact Fault has been interpreted to have acted as a channel for gold-bearing hydrothermal fluids and is host to the Deformation Zone and the southern boundary of the Main Zone. The Deformation Zone mineralization has been defined for approximately 2.0 km along strike (width ranges from 50 to 250 m) but remains open along strike and open at depth.
| Fenn-Gib Project |
Page 54 | |
| NI 43-101 Technical Report and Pre-Feasibility Study |
December 19, 2025 | |
|
|
The Footwall Zone is north of the Main Zone (Figure 7-2). The Footwall Zone’s structural and mineralized corridor strikes in a north easterly direction, and drilling has intercepted the zone over a strike length of approximately 500 m (average width 250 m) and a vertical depth of about 600 m below surface (open in all directions). The Footwall Zone consists of multiple mineralized zones hosted primarily in the footwall mafic volcanic assemblage, with a steep northerly dip. Mineralization consists of bleached, buff-altered (silica-albite-sericite-carbonate alteration), pillowed mafic volcanic with pyrite ranging from 2% to over 20%.
| Figure 7-2: | Project Geology Plan |
Note: Drill traces projected to surface. Source: TMAC, 2024
| Fenn-Gib Project |
Page 55 | |
| NI 43-101 Technical Report and Pre-Feasibility Study |
December 19, 2025 | |
|
|
| 8 | DEPOSIT TYPES |
| 8.1 | Deposit Model |
Four major types of gold deposits are recognized in the Abitibi-Greenstone Belt (which is within the Abitibi Subprovince)-Robert and Poulsen (1997) identified three major types and Berger and Amelin (1998) have suggested a fourth. In order of the timing of development, these deposit types are: synvolcanic and synsedimentary deposits, syenite-associated deposits, syntectonic mesothermal vein deposits, and remobilized post-tectonic vein deposits.
Synvolcanic deposits include volcanogenic massive sulphide-related gold deposits with ocean floor alteration and replacement facies, represented primarily by the Horne Deposit in Quebec. Synsedimentary gold deposition is a key factor in the localization of gold at the Aunor and Dome Deposits in the Timmins camp. These early mineralizing events have drawn attention to the role of volcanic and sedimentary processes.
Syntectonic plutons, intruded near regional-scale shear zones, became the focus of exploration and research due to their close spatial relationships with some gold deposits. Mineralizing fluids are interpreted to have been derived from the plutons during emplacement. Numerous examples of this type of deposit can be found in the Abitibi, including at least one phase of mineralization at the Aunor and Dome Deposits, as well as deposits associated with the Bourlamaque pluton of the Val D’Or district, the Kerr-Addison Deposit, the Hollinger McIntyre Deposit, the Holt McDermott Deposit, and the Holloway Deposit. The Fenn-Gib Deposit is best represented by this model.
Mesothermal syntectonic vein deposits are associated with carbonate-albite-tourmaline veins, which crosscut the regional foliation. The deposits are thought to have developed syntectonically, based on structural relationships, with deep crustal fluids that used the active shear zones as conduits, contemporaneous with orogenesis and peak metamorphism. Examples of such deposits include the Camflo Mine and the Sigma Mine.
A fourth, less-common type of deposit occurs as quartz veins with north-south strikes and moderate dips and is thought to be due to a remobilization of gold-bearing fluids along north-south fractures (Berger & Amelin, 1998). These deposits crosscut regional fabrics and formed late in the area’s tectonic history. The Croesus Mine, perhaps the highest-grade deposit in the Abitibi, is thought to be one such deposit. This historical mine is less than 4 km northwest of the Fenn-Gib Deposit, within the volcanic rocks of the Kidd-Munro assemblage.
In the case of synvolcanic and syenite-associated deposits, the fluids were most likely derived from magmatic activity. For the syntectonic mesothermal vein deposits, fluids may have been metamorphic fluids from the deep crust. The literature suggests that there were at least three phases of gold introduction into the Abitibi: synsedimentary and synvolcanic introduction of gold, followed by intrusion-related gold mineralization, and a final metamorphism-related mineralizing event (Dubé & Mercier-Langevin, 2020).
| Fenn-Gib Project |
Page 56 | |
| NI 43-101 Technical Report and Pre-Feasibility Study |
December 19, 2025 | |
|
|
| 8.2 | Comments on Deposit Type |
The Fenn-Gib Deposit is best represented by the syntectonic plutonic-associated deposit model, where mineralizing fluids are interpreted to have been derived from syntectonic plutons intruded near regional-scale shear zones during emplacement. The Fenn-Gib mineralization exhibits characteristics consistent with this model, including its spatial association with the Contact Fault (interpreted as a splay of the Porcupine-Destor Fault Zone), presence of multiple intrusive phases (syenite, granitoid plugs and dykes, lamprophyre dykes), and alteration assemblages (silicification, carbonatization, albitization, sericitization) typical of syntectonic hydrothermal systems. The deposit shares similarities with other major deposits in the Abitibi of this type, including Kerr-Addison, Hollinger-McIntyre, and Holloway.
The Company’s exploration program focuses on the Main Zone, Deformation Zone, and Footwall Zone, all of which exhibit characteristics of the syntectonic plutonic-associated deposit model. Exploration activities target extensions of known mineralization along strike and at depth, as well as parallel structures within the broader mineralizing system. The recognition of multiple mineralization styles (quartz-carbonate veins, disseminated gold in altered volcanics, and structurally-controlled high-grade zones) reflects the complex polyphase history typical of Abitibi gold deposits, supporting continued exploration for additional zones of mineralization.
| Fenn-Gib Project |
Page 57 | |
| NI 43-101 Technical Report and Pre-Feasibility Study |
December 19, 2025 | |
|
|
| 9 | EXPLORATION |
| 9.1 | Introduction |
Exploration conducted by Mayfair Gold since the acquisition of the Fenn-Gib Project on December 31, 2020, has consisted of surface geochemical sampling, geophysical surveys, and extensive diamond drilling. This section describes exploration activities completed by or on behalf of the Company from 2021 through 2024. Diamond drilling activities are described in Section 10.
| 9.2 | Grids and Surveys |
A LiDAR survey and aerial photography acquisition was contracted to McElhanney of Vancouver, B.C., over both the Project North and South Blocks. The survey, which included 12 flightlines totalling 116 line-km, was flown on June 10, 2022 (McElhanney, 2022). The full swath width was 1,650 m. The LiDAR data provides topographic surface control for resource estimation and was used as the topographic surface for clipping the resource pit shell. All exploration data are referenced to NAD 83 UTM coordinates Zone 17.
| 9.3 | Geological Mapping |
Localized geological mapping and prospecting has been conducted by Mayfair Gold project geologists during diamond drilling programs and surface reconnaissance activities. Geological descriptions and observations from diamond drill core have been recorded and compiled as part of the database for the MRE. Surface geological observations and mapping relative to property boundaries are incorporated into the geological model used for resource estimation.
| 9.4 | Geochemistry |
Surface work on the North Block included an orientation soil and vegetation sample mobile-metal-ion (MMI) and soil-gas hydrocarbons (SGH) test sampling program during 2022. Each survey had a sample spacing of 25m and line spacing of 100 m. Aurora Geosciences Ltd. (Aurora) carried out this work under contract, with SGH processing (Brown and Sutherland, 2022) completed at Activation Laboratories Ltd. in Ancaster, Ontario, and MMI processing completed at SGS Laboratories in Burnaby, B.C. (Aurora Geosciences, 2023). The MMI samples targeted variations in mobile metal ion concentrations in soils overlying the mineralized zones. A total of 390 SGH samples were analyzed for hydrocarbon anomalies that may indicate proximity to mineralization. Results from these orientation surveys could provide baseline geochemical information for future exploration targeting. Additional sampling was recommended to better define the mineralization and potentially locate a redox zone if it exists, which in turn could increase the confidence rating.
| Fenn-Gib Project |
Page 58 | |
| NI 43-101 Technical Report and Pre-Feasibility Study |
December 19, 2025 | |
|
|
| 9.5 | Geophysics |
In 2021, the Company contracted SHA Geophysics Ltd. (SHA) to carry out a Heli-GT helicopter-towed, three-axis magnetic gradiometer survey over the North and South property blocks (Munro, 2021). During April 7-12, 2021, a total of 1,751 km of data was collected along 75 m traverse spacing. The two property blocks were each surveyed in two orthogonal directions, for a total of four individual surveys. The North Block was flown at headings of 60° and 330° (N060 and N330); the South Block was flown at headings of 80° and 350° (S080 and S350). The magnetic gradiometer data provided regional geophysical signatures to identify structural and lithological variations across the property.
Aurora conducted a direct current (“DC”) resistivity-induced polarization (“IP”) survey for the Company on the North Block’s Grid A and Grid B of the Project (Jelenic, 2023). Grid A consisted of 66 north-south IP lines totalling 103 line-km, and Grid B consisted of 27 northwest-southeast IP lines totalling 29.45 line-km. Aurora completed the work on Grid A using two deployments from October 5, 2022, to January 15, 2023, and the work on Grid B was completed in two deployments from April 4 to May 14, 2023. The survey used a pole-dipole electrode array with 50 m dipoles for Grid A and 25 m dipoles for Grid B. The DC resistivity-IP survey identified zones of elevated chargeability and resistivity anomalies associated with mineralization and alteration.
| 9.6 | Petrology, Mineralogy, and Research Studies |
Mineralogical studies have been conducted as part of the metallurgical testwork program described in Section 13. These studies include scanning electron microscopy (“SEM”) analysis, TESCAN Integrated Mineral Analyzer (“TIMA-X”) mineralogical characterization, and gravity recoverable gold (“GRG”) determinations. These studies have characterized the mineralogy, grain size, and liberation characteristics of gold and sulphide minerals in relation to the deposit lithologies and grades.
| 9.7 | Exploration Potential |
The Fenn-Gib Deposit remains open at depth and along strike in multiple directions, presenting significant exploration potential. The Main Zone, Deformation Zone, and Footwall Zone have been defined over their respective strike lengths and vertical extents, but drilling has not been extended fully to depth or along strike in all directions. Additional mineralized zones may exist in structurally similar settings within the broader property area, particularly along parallel structures to the Contact Fault and within subsidiary shear zones.
| 9.8 | Targets for Further Exploration |
Several exploration targets have been identified on the broader Fenn-Gib Project beyond the current resource estimate pit shell. Tahoe Resources carried out a desktop review for LSG on several early-stage exploration targets on the Fenn-Gib Project, including American Eagle, G-101, Central Syenite, Horseshoe Zone, Canamax Zone, Perry Lake Prospect, and South Block (Brace et al., 2017). The location of these exploration targets on the Project is shown in Figure 9-1. Additional diatreme breccia mineralization was encountered in drill core in the southeast part of the property (Cominco showings), which is associated with anomalous gold mineralization and represents another exploration target. These targets remain relatively unexplored and warrant further investigation through systematic drilling and surface geochemical sampling.
| Fenn-Gib Project |
Page 59 | |
| NI 43-101 Technical Report and Pre-Feasibility Study |
December 19, 2025 | |
|
|
| Figure 9-1: | Targets for Further Exploration Location Map |
Source: Brace et al., 2017
| Fenn-Gib Project |
Page 60 | |
| NI 43-101 Technical Report and Pre-Feasibility Study |
December 19, 2025 | |
|
|
| 10 | DRILLING |
| 10.1 | Historical Drilling |
The Project benefits from extensive historical exploration, with previous owners and operators completing 586 drill holes totaling 169,702.51 m. The historical drill holes were predominately BQ and NQ diameter drill holes prior to 2011 and then primarily NQ diameter drill holes for the 2011-2012 and 2017 campaigns. Pangea Goldfields Inc. (Pangea) completed drilling on the Fenn-Gib Deposit in the mid to late 1990s and LSG in 2011-2012 and in 2017. Other operators or joint-venture partners included NAR Resources Ltd., Tandem Resources Ltd., Lacana Mining Corp., Corona Gold Corporation, Normina Mineral Development Corporation, and Tahoe Resources Inc. Of the 586 drill holes on the Project from historical drill campaigns by several operators, 457 drill holes have been used for the 2024 MRE.
| 10.2 | Mayfair Gold Drilling |
Since acquiring the project on December 31, 2020, Mayfair Gold has conducted diamond drilling campaigns using Major Drilling Group International as the primary contractor, with contributions from Northtech Drilling (summer-winter 2021) and Full Force Drilling (summer 2022). Drilling has been completed with diamond drill rigs, with most core drilled as NQ size and only a handful of holes drilled on the South Block and part of one hole on the North Block as HQ size. Table 10-1 summarizes Mayfair Gold’s drilling campaigns completed as of June 20, 2025. The Company completed an additional 27 drill holes totaling 11,503.6 m after April 30, 2024, the cut-off date used for this MRE. There is no expected material impact for holes completed after MRE. The drilling program also included an additional 21 regional drill holes which are part of Mayfair Gold’s property exploration.
Collar locations for all drill holes have been surveyed in NAD83 UTM Zone 17N. Figure 10-1 provides the plan view of the drill-hole locations used in the MRE.
| Table 10-1: | Drill Summary Table |
| Year |
As of April 30, 2024 Cut-off Date | Total Fenn-Gib Drill Holes | ||||||||||||||
| No. of Holes | Meters | No. of Holes | Meters | |||||||||||||
| 2021 |
90 | 54,936.70 | 90 | 54,936.70 | ||||||||||||
| 2022 |
97 | 54,482.05 | 118 | 61,996.55 | ||||||||||||
| 2023 |
89 | 54,975.50 | 89 | 54,975.50 | ||||||||||||
| 2024 |
15 | 14,630.10 | 42 | 18,229.30 | ||||||||||||
|
|
|
|
|
|
|
|
|
|||||||||
| Total |
291 | 179,024.35 | 339 | 190,138.05 | ||||||||||||
|
|
|
|
|
|
|
|
|
|||||||||
| Fenn-Gib Project |
Page 61 | |
| NI 43-101 Technical Report and Pre-Feasibility Study |
December 19, 2025 | |
|
|
| Figure 10-1: | Drill Collar Location Plan |
Note: Drill hole trace projected to surface and coloured by geology code. Code descriptions can be found in Table 14-1. Source: TMAC, 2024
| Fenn-Gib Project |
Page 62 | |
| NI 43-101 Technical Report and Pre-Feasibility Study |
December 19, 2025 | |
|
|
| 10.3 | Mayfair Diamond Drilling Procedures |
| 10.3.1 | Spotting Drill Holes |
As of January 2021, Mayfair geologists spot drill-hole collar locations referenced to UTM 17N by using a hand-held Garmin GPS using the NAD 83 geodetic datum. A wooden stake is left in the ground at the collar location and marked with flagging tape labelled with the drill-hole identification, and the planned azimuth, dip, and depth. The location and drill-hole information are reviewed and confirmed with the drilling supervisor.
| 10.3.2 | Drilling |
Since January 2021, drilling on the Project has been carried out primarily by Major Drilling Group International (Major Drilling). Northtech Drilling completed a limited number of holes in the summer-winter 2021 period and Full Force Drilling contributed additional drilling in the summer of 2022.
Drilling was completed with the use of diamond drill rigs. Most of the core was drilled NQ size, only a handful of holes drilled on the South Block and part of one hole from the North Block were HQ size.
| | Core was placed in core boxes. Wood blocks are placed after each drill run labelled with the corresponding downhole depth in meters. |
| | Core boxes were labelled with the drill-hole identification name and number in numerical sequence starting from the beginning of the hole to the end. A lid was placed on the core box and sealed at both ends with tape. |
| | Either the Drilling Foreperson delivered the core to the Mayfair Gold Matheson Exploration office or the Mayfair employees picked up the core at the drill rig location, to take it back to the office. |
| | Once drilling was completed, the casing was left in the ground (unless instructed otherwise by Mayfair geologists). The casing was capped. Affixed to the cap was roughly a 1 m-long metal flag post. |
| | Once drilling was completed, and the drill rig moved off the collar location, the Mayfair geologists conduct a post-drill site inspection. |
| 10.3.3 | Collar Surveys |
All drill-hole collar locations drilled from January 2021 to present have been professionally surveyed or surveyed using a hand-held Garmin GPS.
Initially, Mayfair geologists or geo-technicians survey the collar locations with a hand-held Garmin GPS. A final professional survey is completed for each collar location. This professional survey is done periodically throughout the drilling program. To date, Mayfair has used Talbot Survey Inc. to complete the final professional collar location surveys.
Please note that the final professional survey data replaces the location data collected by the hand-held Garmin GPS. Data regarding the collar survey method is recorded in the drill-hole database.
| Fenn-Gib Project |
Page 63 | |
| NI 43-101 Technical Report and Pre-Feasibility Study |
December 19, 2025 | |
|
|
| 10.3.4 | Downhole Surveys |
As of January 2021, Mayfair Gold is using the following tools: REFLEX TN14 GYROCOMPASS, REFLEX EZ-GYRO, and the REFLEX GYRO SPRINT-IQ. Aurora Geoscience completed a small drilling program on the South Block during summer 2022 using the REFLEX EZ-TRAC for downhole surveys.
The driller and driller’s assistant collect downhole survey data during the drilling process. Imdex Limited provided training on these tools.
| | The TN14 GYROCOMPASS was used to align the drill to the planned azimuth and dip as specified by Mayfair geologists. |
| | Rule of thumb for TN14 test approval was less than 1 degree of deviation on the azimuth or dip. |
| | Exceptions to larger than 1-degree deviations were made; however, this was up to the discretion of Mayfair geologists. |
| | For the first approximately 150 m of drilling, after casing, the EZ-GYRO tool was used at 50 m intervals to monitor the azimuth and dip. These tests were sent to the Mayfair geologists for approval (via text and by uploading to the ImdexHUB-IQ website). |
| | The first test was taken after casing. Drillers were instructed to wait for approval from the Mayfair geologists before continuing drilling. |
| | Rule of thumb for approval was a less-than-2-degree deviation on the azimuth or dip. |
| | Exceptions to a larger-than-2-degree deviation were made; however, this was at the discretion of Mayfair geologists. |
| | After about 150 m of drilling past casing, no other downhole tests were taken to monitor the azimuth and dip. |
Once drilling was complete, a finalized downhole survey test was taken. This final test was completed with the GYRO SPRINT-IQ tool. Continuous tests were taken at 3-5 m intervals as the tool was lowered down the hole (IN-Test) and as it was brought back up the hole (OUT-Test). There have been a handful of drill holes where only the EZ-GYRO tool was used at 50 m intervals for the entire length of the drill hole.
| 10.3.4.1 | Geotechnical and Hydrological Drilling |
ALS Limited’s GeoticLog 8.2.14 (GeoticLog) is the software that Mayfair uses to record all geotechnical and geological logging data.
| | Mayfair geologists complete or supervise geotechnical logging at the Matheson Exploration site. |
| | Core is measured into 1 m intervals between the wooden meter blocks the drillers insert as reference. |
| Fenn-Gib Project |
Page 64 | |
| NI 43-101 Technical Report and Pre-Feasibility Study |
December 19, 2025 | |
|
|
| | From and to metreage of intervals with the same or similar Rock Quality Designation (RQD) are broken out and recorded in GeoticLog. Within the given RQD interval, the sum of all pieces of core that are longer than 10 cm is recorded in GeoticLog. GeoticLog will calculate the RQD percentage. |
Photographs are taken of the wet core after it has been measured. Core photographs are stored on Mayfair’s server.
Mayfair Gold geologists complete geological logging at the Matheson Exploration site.
| | Major geological intervals are broken out. From and to metreage, and detailed descriptions are recorded in GeoticLog. |
| | major lithology intervals should be 2 m or more long. Intervals that are less than 2 m long are to be broken out in the Minor Lithology section in GeoticLog. |
| | There are situations where including a Major Lithology interval that is <2 m long is acceptable; this is at the discretion and critical thinking of the geologist. |
| | Within the boundaries of each Major Lithology interval, the following data are recorded in GeoticLog: alteration present and its intensity; pyrite percentage and the style of pyrite mineralization; any other sulphide minerals present and their percentage; structures present; veining present. |
To ensure data integrity, drill-hole data is automatically locked upon completion of logging. Any subsequent modifications require authorization from the database manager, maintaining a secure chain of custody for all geological data.
All geotechnical and geological logging data were recorded using ALS Limited’s GeoticLog 8.2.14 software. Geotechnical logging involved measuring core into 1 m intervals between wooden meter blocks and recording Rock Quality Designation (RQD) as the sum of all core pieces longer than 10 cm within each interval, with GeoticLog calculating RQD percentages. Core was photographed when wet after measurement, with photographs stored on Mayfair’s server for reference and documentation.
Geological logging broke out major geological intervals with from/to metreage and detailed descriptions, with major lithology intervals ≥2 m long (intervals <2 m recorded in Minor Lithology sections). Logged data included alteration type and intensity, pyrite percentage and style, other sulphide minerals and percentages, structures, and veining characteristics. Core has been stored in a locked core yard adjacent to the core-shack at the Matheson facility. Drill-hole data are automatically locked upon completion of logging, with modifications requiring authorization from the database manager to maintain data integrity and security.
| 10.4 | Significant Results and Interpretation |
The drill-hole database includes 217,354 assayed intervals and 20,688 unassayed intervals from 748 total drill holes (457 historical + 291 Mayfair Gold holes as of April 30, 2024, cut-off date). The most recent drilling campaigns (2023-2024) have successfully expanded mineralization within all three primary mineralized zones: the Main Zone, Deformation Zone, and Footwall Zone.
| Fenn-Gib Project |
Page 65 | |
| NI 43-101 Technical Report and Pre-Feasibility Study |
December 19, 2025 | |
|
|
Table 10-2 summarizes the significant drill hole intersections encountered in the Mayfair Gold Drill holes.
| Table 10-2: | Significant Drill Hole Intersections |
| Hole |
From (m) |
To (m) |
Length (m) |
Au (g/t) | ||||||
| FG23-304 | 336.00 | 361.90 | 25.90 | 1.46 | ||||||
| including | 336.00 | 337.00 | 1.00 | 14.32 | ||||||
| and | 345.50 | 349.00 | 3.50 | 3.00 | ||||||
| and | 360.00 | 361.90 | 1.90 | 5.88 | ||||||
| 387.30 | 389.60 | 2.30 | 2.49 | |||||||
| 435.50 | 437.50 | 2.00 | 2.20 | |||||||
| FG23-300 | 334.80 | 351.00 | 16.20 | 2.05 | ||||||
| including | 334.80 | 341.00 | 6.20 | 3.72 | ||||||
| including | 334.80 | 336.00 | 1.20 | 4.10 | ||||||
| 338.00 | 339.00 | 1.00 | 9.61 | |||||||
| 340.10 | 341.00 | 0.90 | 6.76 | |||||||
| and | 349.00 | 351.00 | 2.00 | 2.26 | ||||||
| FG23-311 | 58.30 | 61.20 | 2.90 | 0.87 | ||||||
| 145.00 | 163.00 | 18.00 | 1.15 | |||||||
| including | 145.00 | 148.00 | 3.00 | 5.98 | ||||||
| including | 145.00 | 146.00 | 1.00 | 14.57 | ||||||
| FG23-313 | 198.00 | 203.00 | 5.00 | 1.41 | ||||||
| including | 198.00 | 200.00 | 2.00 | 2.48 | ||||||
| including | 199.00 | 200.00 | 1.00 | 3.60 | ||||||
| FG23-314 | 73.00 | 81.00 | 8.00 | 2.19 | ||||||
| including | 80.00 | 81.00 | 1.00 | 13.48 | ||||||
| 174.00 | 191.10 | 17.10 | 2.19 | |||||||
| including | 174.00 | 176.00 | 2.00 | 13.67 | ||||||
| and | 188.40 | 189.30 | 0.90 | 4.66 | ||||||
| 382.00 | 383.00 | 1.00 | 2.32 | |||||||
| FG23-318 | 24.40 | 25.20 | 0.80 | 3.53 | ||||||
| 122.80 | 131.00 | 8.20 | 1.94 | |||||||
| including | 125.00 | 131.00 | 6.00 | 2.47 | ||||||
| including | 125.00 | 128.00 | 3.00 | 4.40 | ||||||
| FG23-323 | 61.50 | 62.90 | 1.40 | 1.93 | ||||||
| 121.00 | 122.00 | 1.00 | 4.21 | |||||||
| 184.50 | 186.00 | 1.50 | 2.86 | |||||||
| 198.10 | 218.00 | 19.90 | 1.34 | |||||||
| including | 198.10 | 206.00 | 7.90 | 2.59 | ||||||
| including | 198.10 | 199.00 | 0.90 | 11.73 |
| Fenn-Gib Project |
Page 66 | |
| NI 43-101 Technical Report and Pre-Feasibility Study |
December 19, 2025 | |
|
|
| Hole |
From (m) |
To (m) |
Length (m) |
Au (g/t) | ||||||
| FG23-326 | 48.00 | 49.00 | 1.00 | 1.72 | ||||||
| 149.20 | 151.40 | 2.20 | 1.17 | |||||||
| 180.00 | 188.00 | 8.00 | 3.67 | |||||||
| including | 180.00 | 184.20 | 4.20 | 6.47 | ||||||
| including | 181.30 | 182.20 | 0.90 | 19.89 | ||||||
| 205.30 | 206.40 | 1.10 | 2.81 | |||||||
| FG23-328 | 104.00 | 105.50 | 1.50 | 15.65 | ||||||
| 164.40 | 165.60 | 1.20 | 2.06 | |||||||
| 174.00 | 181.00 | 7.00 | 7.94 | |||||||
| including | 175.80 | 177.00 | 1.20 | 11.99 | ||||||
| and | 178.60 | 181.00 | 2.40 | 16.20 | ||||||
| FG23-330 | 24.00 | 24.50 | 0.50 | 3782.70 | ||||||
| 51.00 | 52.00 | 1.00 | 3.33 | |||||||
| 204.00 | 205.00 | 1.00 | 1.93 | |||||||
| FG23-339 | 500.10 | 513.00 | 12.90 | 1.38 | ||||||
| including | 500.10 | 504.00 | 3.90 | 3.00 | ||||||
| 530.80 | 541.00 | 10.20 | 1.09 | |||||||
| 549.20 | 554.50 | 5.30 | 3.11 | |||||||
| 675.90 | 681.00 | 5.10 | 2.79 | |||||||
| including | 677.00 | 678.00 | 1.00 | 7.39 | ||||||
| FG23-343 | 554.40 | 558.00 | 3.60 | *2.08 | ||||||
| including | 554.40 | 555.40 | 1.00 | 4.43 | ||||||
| FG23-344A | 498.00 | 528.00 | 30.00 | 4.72 | ||||||
| including | 502.00 | 521.60 | 19.60 | 6.59 | ||||||
| including | 502.00 | 503.00 | 1.00 | 44.70 | ||||||
| and | 517.00 | 521.00 | 4.00 | 10.05 | ||||||
| FG23-345 | 461.00 | 510.50 | 49.50 | 1.44 | ||||||
| including | 461.00 | 463.50 | 2.50 | 9.20 | ||||||
| and | 488.50 | 491.50 | 3.00 | 2.92 | ||||||
| including | 505.00 | 506.00 | 1.00 | 4.36 | ||||||
| 555.00 | 561.00 | 6.00 | 1.43 | |||||||
| including | 555.00 | 557.00 | 2.00 | 2.25 | ||||||
| 590.40 | 596.00 | 5.60 | 1.18 | |||||||
| including | 590.40 | 592.80 | 2.40 | 2.05 | ||||||
| 694.90 | 700.30 | 5.40 | 2.47 | |||||||
| including | 697.00 | 698.20 | 1.20 | 8.99 |
| Fenn-Gib Project |
Page 67 | |
| NI 43-101 Technical Report and Pre-Feasibility Study |
December 19, 2025 | |
|
|
| Hole |
From (m) |
To (m) |
Length (m) |
Au (g/t) | ||||||
| FG23-346 | 428.30 | 443.80 | 15.50 | 2.26 | ||||||
| including | 433.00 | 435.00 | 2.00 | 3.32 | ||||||
| and | 440.00 | 443.00 | 3.00 | 5.03 | ||||||
| 460.00 | 463.30 | 3.30 | 19.84 | |||||||
| including | 461.10 | 462.20 | 1.10 | 54.07 | ||||||
| FG23-347 | 466.00 | 467.00 | 1.00 | 3.83 | ||||||
| 476.80 | 478.00 | 1.20 | 4.80 | |||||||
| 483.00 | 484.50 | 1.50 | 2.59 | |||||||
| 511.00 | 545.00 | 34.00 | 0.83 | |||||||
| including | 529.00 | 531.00 | 2.00 | 1.75 | ||||||
| and | 538.00 | 543.00 | 5.00 | 1.90 | ||||||
| including | 541.50 | 543.00 | 1.50 | 3.76 | ||||||
| 592.50 | 626.00 | 33.50 | 1.28 | |||||||
| including | 592.50 | 595.50 | 3.00 | 4.90 | ||||||
| including | 593.50 | 594.50 | 1.00 | 9.97 | ||||||
| and | 622.00 | 626.00 | 4.00 | 3.34 | ||||||
| including | 622.00 | 623.00 | 1.00 | 7.90 | ||||||
| FG23-348 | 514.00 | 517.00 | 3.00 | 1.10 | ||||||
| 622.00 | 624.30 | 2.30 | 6.44 | |||||||
| including | 623.00 | 624.30 | 1.30 | 9.30 | ||||||
| FG23-350A | 12.00 | 508.00 | 496.00 | 1.14 | ||||||
| including | 38.00 | 59.00 | 21.00 | 2.84 | ||||||
| and | 68.00 | 87.00 | 19.00 | 2.06 | ||||||
| and | 115.00 | 146.20 | 31.20 | 2.40 | ||||||
| including | 133.20 | 141.20 | 8.00 | 4.19 | ||||||
| and | 169.70 | 181.00 | 11.30 | 2.31 | ||||||
| and | 209.00 | 228.00 | 19.00 | 5.45 | ||||||
| and | 407.00 | 417.00 | 10.00 | 2.82 | ||||||
| 683.00 | 807.00 | 124.00 | 1.06 | |||||||
| including | 691.40 | 693.20 | 1.80 | 6.46 | ||||||
| and | 738.00 | 746.60 | 8.60 | 2.56 | ||||||
| including | 738.00 | 740.00 | 2.00 | 5.73 | ||||||
| and | 775.00 | 786.00 | 11.00 | 3.22 | ||||||
| including | 776.00 | 778.00 | 2.00 | 9.31 | ||||||
| 846.00 | 848.00 | 2.00 | 2.08 | |||||||
| 899.00 | 940.00 | 41.00 | 0.74 | |||||||
| 978.00 | 997.20 | 19.20 | 0.92 |
| Fenn-Gib Project |
Page 68 | |
| NI 43-101 Technical Report and Pre-Feasibility Study |
December 19, 2025 | |
|
|
| Hole |
From (m) |
To (m) |
Length (m) |
Au (g/t) | ||||||
| FG23-351 | 372.50 | 374.50 | 2.00 | 5.92 | ||||||
| 403.20 | 420.00 | 16.80 | 2.19 | |||||||
| including | 404.20 | 411.20 | 7.00 | 3.28 | ||||||
| including | 405.20 | 410.20 | 5.00 | 3.60 | ||||||
| and | 413.20 | 415.20 | 2.00 | 3.21 | ||||||
| 434.00 | 448.50 | 14.50 | 1.29 | |||||||
| including | 434.00 | 435.20 | 1.20 | 3.10 | ||||||
| and | 447.00 | 448.50 | 1.50 | 5.39 | ||||||
| 727.50 | 780.00 | 52.50 | 0.67 | |||||||
| including | 727.50 | 728.00 | 0.50 | 2.90 | ||||||
| and | 734.00 | 736.00 | 2.00 | 3.00 | ||||||
| and | 779.00 | 780.00 | 1.00 | 2.21 | ||||||
| FG23-353 | 359.30 | 362.00 | 2.70 | 2.13 | ||||||
| 457.50 | 459.00 | 1.50 | 2.62 | |||||||
| 528.00 | 544.00 | 16.00 | 2.10 | |||||||
| including | 528.00 | 529.00 | 1.00 | 6.27 | ||||||
| and | 534.70 | 543.00 | 8.30 | 2.82 | ||||||
| including | 536.00 | 537.00 | 1.00 | 6.13 | ||||||
| and | 540.00 | 543.00 | 3.00 | 4.07 | ||||||
| 582.10 | 584.00 | 1.90 | 2.35 | |||||||
| FG23-354 | 634.90 | 647.00 | 12.10 | 1.61 | ||||||
| including | 634.90 | 638.00 | 3.10 | 3.63 | ||||||
| and | 646.00 | 647.00 | 1.00 | 4.24 | ||||||
| FG23-356 | 21.20 | 944.00 | 922.80 | 0.75 | ||||||
| including | 145.90 | 184.00 | 38.10 | 1.14 | ||||||
| and | 523.00 | 944.00 | 421.00 | 1.16 | ||||||
| including | 580.00 | 801.00 | 221.00 | 1.69 | ||||||
| including | 612.00 | 635.00 | 23.00 | 2.40 | ||||||
| and | 654.00 | 664.00 | 10.00 | 12.42 | ||||||
| including | 655.00 | 656.50 | 1.50 | 76.12 | ||||||
| and | 709.00 | 710.00 | 1.00 | 26.25 | ||||||
| and | 781.00 | 788.00 | 7.00 | 3.88 | ||||||
| including | 781.00 | 782.00 | 1.00 | 23.24 | ||||||
| and | 795.00 | 801.00 | 6.00 | 2.33 | ||||||
| including | 795.00 | 796.00 | 1.00 | 9.74 | ||||||
| and | 857.00 | 858.00 | 1.00 | 43.61 | ||||||
| FG23-359 | 466.10 | 468.20 | 2.10 | 27.60 | ||||||
| 568.00 | 573.00 | 5.00 | 3.64 | |||||||
| including | 568.00 | 570.00 | 2.00 | 7.26 | ||||||
| 585.00 | 588.20 | 3.20 | 3.70 | |||||||
| including | 586.00 | 587.00 | 1.00 | 6.19 |
| Fenn-Gib Project |
Page 69 | |
| NI 43-101 Technical Report and Pre-Feasibility Study |
December 19, 2025 | |
|
|
| Hole |
From (m) |
To (m) |
Length (m) |
Au (g/t) | ||||||
| FG23-361 | 173.00 | 175.70 | 2.70 | 1.96 | ||||||
| including | 173.00 | 173.70 | 0.70 | 6.17 | ||||||
| 461.20 | 463.50 | 2.30 | 16.47 | |||||||
| 469.50 | 470.00 | 0.50 | 4.18 | |||||||
| 484.10 | 489.10 | 5.00 | 2.19 | |||||||
| including | 485.00 | 486.00 | 1.00 | 5.26 | ||||||
| 632.50 | 638.50 | 6.00 | 1.88 | |||||||
| including | 637.00 | 638.50 | 1.50 | 4.56 | ||||||
| FG23-363 | 337.00 | 338.00 | 1.00 | 2.11 | ||||||
| 511.10 | 532.40 | 21.30 | 1.20 | |||||||
| including | 511.10 | 514.00 | 2.90 | 4.33 | ||||||
| FG23-366 | 391.50 | 392.50 | 1.00 | 2.21 | ||||||
| 524.70 | 526.00 | 1.30 | 4.28 | |||||||
| 594.50 | 597.40 | 2.90 | 6.23 | |||||||
| including | 595.70 | 596.60 | 0.90 | 15.80 | ||||||
| FG23-367 | 908.00 | 908.70 | 0.70 | 1.66 | ||||||
| FG23-368 | 505.50 | 507.40 | 1.90 | 2.87 | ||||||
| 558.50 | 568.50 | 10.00 | 3.14 | |||||||
| including | 558.50 | 559.50 | 1.00 | 15.94 | ||||||
| FG23-370 | 548.00 | 549.00 | 1.00 | 2.91 | ||||||
| 566.00 | 566.70 | 0.70 | 2.07 | |||||||
| 586.00 | 597.00 | 11.00 | 0.85 | |||||||
| including | 586.00 | 587.00 | 1.00 | 2.91 | ||||||
| and | 595.50 | 597.00 | 1.50 | 2.11 | ||||||
| 658.00 | 692.40 | 34.40 | 0.79 | |||||||
| including | 658.00 | 677.00 | 19.00 | 1.06 | ||||||
| including | 658.00 | 659.00 | 1.00 | 3.23 | ||||||
| and | 667.00 | 667.70 | 0.70 | 3.04 | ||||||
| and | 674.00 | 676.00 | 2.00 | 2.90 | ||||||
| and | 687.00 | 692.40 | 5.40 | 1.00 | ||||||
| FG23-371 | 685.00 | 686.10 | 1.10 | 1.21 | ||||||
| FG23-372 | 334.50 | 336.00 | 1.50 | 7.24 | ||||||
| 506.00 | 515.00 | 9.00 | 1.12 | |||||||
| 560.60 | 572.00 | 11.40 | 2.26 | |||||||
| including | 563.60 | 568.60 | 5.00 | 4.07 |
| Fenn-Gib Project |
Page 70 | |
| NI 43-101 Technical Report and Pre-Feasibility Study |
December 19, 2025 | |
|
|
| Hole |
From (m) |
To (m) |
Length (m) |
Au (g/t) | ||||||
| FG23-378 | 441.50 | 442.60 | 1.10 | 3.33 | ||||||
| 496.00 | 517.00 | 21.00 | 0.82 | |||||||
| including | 506.00 | 511.00 | 5.00 | 1.25 | ||||||
| 654.00 | 656.00 | 2.00 | 3.04 | |||||||
| 666.40 | 667.30 | 0.90 | 2.37 | |||||||
| 709.00 | 717.80 | 8.80 | 1.71 | |||||||
| including | 711.00 | 713.00 | 2.00 | 5.13 | ||||||
| FG24-385 | 261.40 | 332.40 | 71.00 | 0.88 | ||||||
| including | 296.70 | 325.00 | 28.30 | 1.40 | ||||||
| including | 296.70 | 298.50 | 1.80 | 19.81 | ||||||
| and | 315.00 | 316.00 | 1.00 | 3.24 | ||||||
| 360.00 | 364.00 | 4.00 | 2.37 | |||||||
| including | 363.00 | 364.00 | 1.00 | 5.95 | ||||||
| 408.10 | 417.00 | 8.90 | 2.01 | |||||||
| FG24-387 | 313.50 | 508.00 | 194.50 | 0.80 | ||||||
| including | 326.00 | 329.00 | 3.00 | 3.02 | ||||||
| and | 379.10 | 380.00 | 0.90 | 4.21 | ||||||
| and | 438.00 | 443.00 | 5.00 | 2.54 | ||||||
| and | 464.70 | 468.00 | 3.30 | 8.56 | ||||||
| including | 467.00 | 468.00 | 1.00 | 23.90 | ||||||
| and | 474.50 | 476.70 | 2.20 | 4.60 | ||||||
| FG24-388 | 312.00 | 380.90 | 68.90 | 1.97 | ||||||
| including | 314.00 | 323.40 | 9.40 | 4.82 | ||||||
| including | 318.00 | 320.10 | 2.10 | 11.25 | ||||||
| and | 339.50 | 352.00 | 12.50 | 3.01 | ||||||
| including | 343.50 | 346.50 | 3.00 | 6.91 | ||||||
| and | 350.90 | 352.00 | 1.10 | 6.63 | ||||||
| and | 375.00 | 380.90 | 5.90 | 4.15 | ||||||
| FG24-390 | 209.00 | 210.00 | 1.00 | 10.72 | ||||||
| 221.50 | 250.00 | 28.50 | 0.55 | |||||||
| 244.20 | 245.20 | 1.00 | 2.96 | |||||||
| 280.00 | 294.00 | 14.00 | 6.12 | |||||||
| including | 281.20 | 282.10 | 0.90 | 68.13 | ||||||
| and | 288.00 | 294.00 | 6.00 | 3.24 | ||||||
| including | 291.00 | 292.00 | 1.00 | 9.13 | ||||||
| FG24-410 | 471.00 | 485.00 | 13.90 | 2.90 | ||||||
| FG24-414 | 377.90 | 397.00 | 19.10 | 1.04 | ||||||
| 449.40 | 470.50 | 21.10 | 1.28 | |||||||
| FG24-415 | 345.50 | 362.00 | 16.50 | 1.06 | ||||||
| 443.00 | 451.00 | 8.00 | 2.07 |
| Fenn-Gib Project |
Page 71 | |
| NI 43-101 Technical Report and Pre-Feasibility Study |
December 19, 2025 | |
|
|
The following are key findings from exploration drilling conducted by Mayfair Gold:
| | Drilling has successfully defined three primary mineralized zones with consistent gold grades and geometries. |
| | The Main Zone continues to expand both along strike and at depth. |
| | The Deformation Zone demonstrates higher-grade intersections associated with structural features. |
| | The Footwall Zone remains open in all directions and presents additional expansion potential. |
| | Core recovery has been consistently good, supporting confidence in assay results. |
| 10.5 | Qualified Person’s Opinion |
In the opinion of the QP, Tim Maunula, P.Geo., the drill-hole logging and survey procedures employed are consistent with generally accepted industry best practices and are therefore considered reliable for the purposes of mineral resource estimation.
| Fenn-Gib Project |
Page 72 | |
| NI 43-101 Technical Report and Pre-Feasibility Study |
December 19, 2025 | |
|
|
| 11 | SAMPLE PREPARATION, ANALYSES, AND SECURITY |
| 11.1 | Introduction |
The assay data used for this technical report represents a comprehensive compilation from certified laboratories, including both historical data from past owners, and recent diamond drilling by Mayfair Gold. The QP believes that certified laboratories historically employed industry best-practice in sample preparation, analyses, and security methods and procedures when developing the data used for the MRE presented in this technical report.
| 11.2 | Historical Sampling Pre-2011 |
LSG compiled a master assay table from various historical records. The database listed assay intervals accompanied by location, Hole ID, from, to, sample number, lab name, assay certificate number, and date; and for each listed interval, a variety of assay results (e.g., check, repeat, and duplicate assays). Prior to 2011, LSG undertook a program of assay certificates database verifications to ensure that the most-reliable method of analysis was selected given the value of the sample (e.g., gravimetric for samples with >3 g/t Au). This process also served to verify the database. Scans of paper drill logs and assay certificates were available to verify data in the master assay table.
Accurassay, TSL Laboratories Inc., and Bourlamaque assayed samples from the early 1986 holes on the Fenn-Gib Project, then Swastika Laboratories (Swastika) (up to 1994), Spectrolab (up to 1997), and Chimitec (1998 and 1999). Swastika Laboratories performed the assaying for the holes Barrick drilled. Swastika is in Swastika, Ontario; Accurassay is in Thunder Bay, Ontario; Bourlamaque Laboratoire D’Analyse is in Val d’Or, Quebec; Spectrolab is in Geraldton, Ontario; TSL Laboratories Inc. is in Saskatoon, Saskatchewan; and Chimitec is in Val d’Or, Quebec. All laboratories were accredited at the time of the analyses.
Due to the historical nature of the data, it is exceedingly difficult to analyze the quality assurance and quality control (QA/QC) method used by the various companies that drilled on the property over the years. It appears that the principal method of ensuring data quality was the use of pulp duplicates that were usually sent to other independent laboratories. This is discussed further in Section 12.1. SGS Geostat (Dagbert and Desharnais, 2011) and LSG undertook a resampling and drill twin program to validate the historical data; the SGS and LSG work continues to be an excellent verification source.
It appears that no certified standards or blanks were used to evaluate the accuracy or contamination effects for the data collected. The assay data were almost completely produced from known laboratories in the 1990s, which were certified and had their internal controls, which included standards and blanks. Those laboratories continue to be in operation today. The verification and validation work LSG and SGS Geostat completed did not highlight any issues with bias or errors. The sampling and analysis methods used by the previous exploration companies was adequate for the use in the MRE.
| Fenn-Gib Project |
Page 73 | |
| NI 43-101 Technical Report and Pre-Feasibility Study |
December 19, 2025 | |
|
|
| 11.3 | Historical Sampling Post 2011 |
From 2017, LSG implemented a comprehensive QA/QC program employing industry standards and best practices for all its drill core. This included regularly inserting blind Certified Reference Materials (CRM) and field blanks randomly into the sample stream. Additionally, pulp and coarse rejects were systematically submitted to ALS in North Vancouver, B.C., for check analysis and additional quality control.
Samples were transported in security-sealed bags to SGS In Timmins, Ontario, and ALS in North Vancouver, for sample preparation by dry crush to 75% mesh to 2 mm, split to 250 g and pulverized to 85% mesh to 75 µm. The samples were then assayed for gold and silver using a 50 g charge with atomic absorption and AAS finish for values exceeding threshold.
A total of 1,356 control samples was assigned for QA/QC purposes and accounted for approximately 20% of total samples taken during the program.
Analyses of blank samples, both pulp and field blanks, consistently yielded gold values near or below the detection limit of the primary laboratory. A single failure was detected; however, the results illustrate no sample contamination.
The performance of the control samples was very good, reflecting the overall high quality of the analysis. Standard OREAS O-250 analyzed by ALS shows two failures; ALS O-210 had three failures, and CDN-GS-3P one failure. SGS had two failures on O-210. Overall, the failure rate of 1.6% for ALS and 1.6% for SGS is very low and illustrates good QC procedures.
ALS performed duplicates check analysis of coarse rejects. Results showed relatively good correlation evident at both low and high gold levels, with a correlation coefficient of 0.995, indicating excellent reproducibility. There appears to be a moderate scatter, which can be interpreted as reflecting the lack of coarse nuggety gold in the Fenn-Gib Deposit.
| 11.4 | Mayfair Gold Sampling |
| 11.4.1 | Sampling Procedure |
| | Sample intervals are marked directly on the drill core. Sample “from” and “to” points are marked by a vertical line drawn perpendicular to the core axis with arrows pointing towards the sample. |
| | Sample information is recorded in sample booklets. The sample tag number becomes the drill core sample identification number (sample ID). QC samples are inserted into the same sampling ID sequence as the drill core. The minimum sample length is 0.5 m, and the maximum is 1.5 m. Sampling intervals are not to cross major lithology boundaries. |
| | The Core Technician marks a cut line on the core prior to cutting. Drill core samples are cut lengthwise, and half of the core is placed into a sample bag. The other half of the core is placed back into the core box in its original location. The second portion of the sample tag is stapled into the core box in its original location (end of the sample). |
| Fenn-Gib Project |
Page 74 | |
| NI 43-101 Technical Report and Pre-Feasibility Study |
December 19, 2025 | |
|
|
| | Sample bags are labelled with the sample ID, and the third portion of the sample tag is placed into the sample bag. Sample bags are sealed with a zip tie or staples. |
| | Core is stored within a locked core yard (Figure 11-1) adjacent to the core-shack at 489 MacDougall Street in Matheson, Ontario. |
| Figure 11-1: | Core Storage Yard, Matheson, Ontario |
Source: TMAC, 2023
| 11.5 | Analytical and Test Laboratories |
Mayfair Gold has used four laboratories: Activation Laboratories Ltd. (ActLabs), Swastika, AGAT Laboratories (AGAT), and MSALABS which are all independent of Mayfair Gold. Mayfair’s primary lab has been Swastika (>50%) followed by ActLabs (5.3%), and AGAT (2.3%). No photon assays from MSALABS have been used in this MRE. All laboratories are all independent of Mayfair Gold.
| Fenn-Gib Project |
Page 75 | |
| NI 43-101 Technical Report and Pre-Feasibility Study |
December 19, 2025 | |
|
|
| 11.5.1 | ActLabs |
ActLabs is an analytical company with global locations. Fenn-Gib Project samples are prepared and analyzed at their ISO 17025:2005-accredited Timmins location at 1752 Riverside Drive.
| | Drill Core Sample Preparation Package (RX1) |
| | Samples are crushed to 80% passing 2 mm. Samples are then split via a riffle to obtain a 250 g sample. 250 g samples are pulverized to 95% passing 105 µm. Cleaner sand is used. |
| | Gold Fire Assays Package (1A2b-30) |
| | Gold fire assay with AA finish of a 30 g sample |
| | Under limit of 5 ppb (0.005 g/t) |
| | Over limit of 10,000 ppb (10 g/t). |
| | Gold Fire Assays Package (1A2-Timmins) |
| | Gold fire assays with AA finish of a 10 g sample. |
| | Overlimit Assay Package (1A3-30) |
| | Gold fire assay with gravimetric finish. When assays from 1A2b-30 return with values >10 g/t they are sent for this package. |
| | Under limit of 0.03 g/t |
| | Over limit of 10,000 g/t. |
| | Specific Gravity (SG) Core-Timmins |
| | A 20-50 g dry core piece is weighed (a). |
| | The same piece of core is then weighed while submerged completely in water (b). |
| | SG is calculated using following formula SG = a/(a-b). |
| | Two pieces per SG sample are measured to show variance and to identify samples to be rechecked. |
| | Multi-element Packages |
| | 1F2 QOP Total (Total Digestion ICPOES) |
| | Code 8-4 Acid Total Digestion-ICPMS. |
| 11.5.2 | Swastika Laboratories |
Swastika is an ISO 17025:2017-accredited assay lab and certified to the ISO 9001: 2015 standard. Fenn-Gib Project samples are prepared and analyzed at their Swastika location 6 km southwest of Kirkland Lake, Ontario.
| Fenn-Gib Project |
Page 76 | |
| NI 43-101 Technical Report and Pre-Feasibility Study |
December 19, 2025 | |
|
|
| | Drill Core Sample Preparation Package |
| | Samples are crushed to minimum 80% passing 1,700 µm. Samples are then split to obtain a 300-500 g sample using a rotary divider. 300-500 g samples are pulverized to minimum 85% passing 74 µm. Cleaner sand is utilized. |
| | Gold Fire Assays Package |
| | Gold fire assay with AA finish of a 30 g sample |
| | Under limit of 10 ppb (0.01 g/t). |
| | Overlimit Assay Package |
| | Gold fire assay with gravimetric finish. When assays return with values >10 g/t they are sent for this package. |
| | Under limit of 0.3 g/t. |
| | Specific Gravity |
| | A dry and room temperature core piece is weighed (Wa) |
| | The same piece of core is then weighed while submerged completely in water (Ww) |
| | SG is calculated using following formula SG = Wa/(Wa-Ww). |
| 11.5.3 | AGAT Laboratories |
AGAT is an analytical company that operates across Canada; it is ISO 17025:2017 accredited and certified to the ISO 9001: 2015 standard. Fenn-Gib Project samples are prepared at AGAT Timmins. Samples are shipped for analysis to their lab at 5623 McAdam Rd., Mississauga, Ontario.
| | Drill Core Sample Preparation Package (200001 Code) |
| | Samples are crushed to 75% passing 2 mm. Samples are then split to obtain a 250 g sample. 250 g samples are pulverized to 85% passing 75 µm. |
| | Gold Fire Assays Package (202051 Code) |
| | Gold fire assay with AAS finish of a 30 g sample |
| | Under limit of 2 ppb (0.002 g/t). |
| | Overlimit Assay Package (202064) |
| | Gold fire assay with gravimetric finish. When assays return with values >10 g/t then are sent for this package. |
| | Multi-Element Package—(201070) |
| | Select samples may be sent for multi element suite |
| Fenn-Gib Project |
Page 77 | |
| NI 43-101 Technical Report and Pre-Feasibility Study |
December 19, 2025 | |
|
|
| | Four acid digestion with ICP-OES finish for 43 elements. |
| 11.5.4 | MSALABS Timmins |
MSALABS is global provider of geochemical laboratory services for the exploration and mining industries. Fenn-Gib Project samples are submitted to the lab at 757 Algonquin Blvd East, Timmins, Ontario. MSALABS follows the guidelines of ISO17025 accreditation and ISO9001, ISO14001, and ISO45001 certification:
| | Sample Preparation (CRU-CPA) |
| | Dry entire sample, crushed up to 1 kg to 70% 02 mm, split 500 g. |
| | Photon Assay (CPA-Au1) |
| | Gamma ray analysis of sample for gold by photon assay instrument. |
| 11.6 | Sample Preparation and Analysis |
Samples were assayed for gold and silver. Mayfair Gold has used four laboratories: Activation Laboratories Ltd. (ActLabs), Swastika, AGAT Laboratories (AGAT), and MSALABS. All laboratories employed fire assay with atomic absorption (AA) or gravimetric finish depending on gold grade. Detection limits vary by laboratory: ActLabs under 5 ppb (0.005 g/t) for standard assays, Swastika under 10 ppb (0.01 g/t), and AGAT under 2 ppb (0.002 g/t). Over-limit assays returning >10 g/t were re-assayed using gravimetric finish by all three primary laboratories. Multi-element packages were available from ActLabs and AGAT for select samples.
| 11.7 | Quality Assurance and Quality Control |
| 11.7.1 | Quality Control Samples |
To ensure data quality and integrity, the Project maintains a rigorous quality control program. The program systematically inserts three QC samples in every 25 samples: one CRM, one blank, and one duplicate. CRMs, sourced from certified commercial retailers, consist of homogeneous fine pulp material with known certified grades and expected variability. These selected CRMs enable assessment of the accuracy of the assay data and monitor for potential bias:
| | The Project uses three different CRMs, at three different grade points during the sampling process. The three different grade ranges reflect the Project’s mineralization and consist of a low grade (<1 g/t), a mid grade (1—3 g/t), and a high grade (5—9 g/t). |
| | As of January 2021, the Project has used CRMs from OREAS and CDN Resource Laboratories. |
Blank samples consist of material that has negligible grade concentrations. These samples are used to monitor for sample contamination during the preparation or analysis process. As of January 2021, the Project is using sand blasting material for its blank samples. The silica sand is sourced from an auto parts store.
| Fenn-Gib Project |
Page 78 | |
| NI 43-101 Technical Report and Pre-Feasibility Study |
December 19, 2025 | |
|
|
Duplicate samples are used to assess the precision of the assay data. A duplicate sample is split from the original sample and given its own sample identification number. As of January 2021, duplicate samples used in the Project drill program consist of “coarse” and “pulp” preparation duplicate samples. These samples are prepared at the assay lab during the sampling process. As of April 25, 2022, Mayfair uses only coarse duplicate samples in their sampling program.
Check assay samples consist of the pulp portion of drill core samples from previously assayed samples. Check assay samples are sent to a secondary lab to assess the accuracy of the assay results. Check assays are submitted on a quarterly to biannual basis, or upon completion of a drill program. Approximately 2% of drill core samples are selected for check assay samples. Of these:
| | approximately half of the samples will be randomly selected from the entire core sample population |
| | the other half of the samples will be randomly selected from samples that returned values >0.34 g/t Au. |
| 11.7.2 | QA/QC Control Charts |
Assay certificates are imported into the GeoticLog program using the “import certificate” function. This function will match the sample ID in the certificate to the correct sample ID and drill hole in GeoticLog. An access database, “Fenn-Gib database,” was created as the working drill hole, assay, and QC monitoring program. The database is linked to the GeoticLog program and pulls the information from there. Query functions have been created to filter QC data by each sub type. In each query, expressions have been built to flag assay results that lie outside of the accepted control limits. The database is password protected.
The QA/QC review and control charts are based on work completed between April 2023 and May 2024.
| 11.7.3 | Blanks |
Mayfair Gold inserted 1,595 blank control samples. There were two samples reporting >0.5 g/t Au () with the remaining failures below that limit (0.13% failure rate). No batches were repeated. Figure 11-2 displays the control chart for blank material.
| Fenn-Gib Project |
Page 79 | |
| NI 43-101 Technical Report and Pre-Feasibility Study |
December 19, 2025 | |
|
|
| Figure 11-2: | Control Chart—Blank Material |
Source: Mayfair, 2024
| 11.7.3.1 | Certified Reference Materials |
The CRM sample certificates indicate the accepted values and ranges or control limits. The reported standard deviation in the CRM certificate is used to define the warning and failure limits:
| | ±2 times standard deviation is considered a warning limit. |
| | ±3 times standard deviation is considered the failure limit. |
| Fenn-Gib Project |
Page 80 | |
| NI 43-101 Technical Report and Pre-Feasibility Study |
December 19, 2025 | |
|
|
The Project uses the following parameters to identify CRM failures that require repeat assays:
| | Any single CRM result that falls outside of 3 standard deviations. |
| | Two or more CRMs that fall outside of 2 standard deviations in a single reported assay certificate. The CRMs do not need to be from the same type. |
| | A single CRM result that falls outside of 2 standard deviations with a blank or duplicate failure in the same certificate. |
| | In some cases, the database manager may consider a single CRM that is outside of 2 standard deviations as a failure if there is an increased amount of CRM samples from multiple certificates from the same lab in the warning zone within a given time period. |
The current CRMs in use by Mayfair Gold are: OREAS-256b, OREAS-251b, and OREAS-254b. Failures were less than 1%, with no repeat assays conducted, as no significant assays were in sequence. Control charts for these three CRMs are shown in Figure 11-3 to Figure 11-5. In general, the three current CRMs perform well within two standard deviations. For the photon assay conducted by MSALABS, there is not sufficient pulp material for analysis, so the samples are marked as IS (for “Insufficient Sample”) and plotted at 0 g/t Au on the CRM Control Charts.
| Fenn-Gib Project |
Page 81 | |
| NI 43-101 Technical Report and Pre-Feasibility Study |
December 19, 2025 | |
|
|
| Figure 11-3: | Control Chart—CRM OREAS 251b |
Source: Mayfair, 2024
| Fenn-Gib Project |
Page 82 | |
| NI 43-101 Technical Report and Pre-Feasibility Study |
December 19, 2025 | |
|
|
| Figure 11-4: | Control Chart—CRM OREAS 254b |
Source: Mayfair, 2024
| Fenn-Gib Project |
Page 83 | |
| NI 43-101 Technical Report and Pre-Feasibility Study |
December 19, 2025 | |
|
|
| Figure 11-5: | Control Chart—CRM OREAS 256b |
Source: Mayfair, 2024
| 11.7.4 | Duplicates |
Coarse duplicate samples were collected after the original sample had been crushed for Swastika (1,568 samples), ActLabs (27 samples), and MSALABS (2 samples). It is expected that duplicate results will return an assay value that is in line with its original sample:
| | Acceptable range for coarse duplicate samples is ±25% of the original assays. |
| | If the gold difference between the original and check assay is less than 0.1 g/t, a percent difference outside of 25% it is not considered to be an outlier. |
| Fenn-Gib Project |
Page 84 | |
| NI 43-101 Technical Report and Pre-Feasibility Study |
December 19, 2025 | |
|
|
The check assays were evaluated using quartile—quartile (Q—Q) plots and relative difference statistics. For Swastika, less than 3% did not meet the QC criteria, and for ActLabs all samples passed. compares the various labs using a Q—Q plot to confirm the repeatability.
The Project’s QC program identified and addressed quality control issues in 2023. Of the four QC failures, one resulted from a result of a sample mix-up with the CRM which was resolved. The remaining three samples initially showed values outside acceptable limits but were confirmed to be within specifications upon re-analysis. Additionally, twenty-three sampling errors, primarily from submitting the incorrect CRM, were identified and resolved; no re-assays were submitted.
The 2024 quality control program identified one QC assay failure resulting from a lab mix-up in samples and resolved through re-analysis. Six QC errors, primarily due to insertion of a different CRM than recorded, were identified and resolved; no additional re-assays were required.
| Fenn-Gib Project |
Page 85 | |
| NI 43-101 Technical Report and Pre-Feasibility Study |
December 19, 2025 | |
|
|
| Figure 11-6: | Control Chart—Duplicate Samples |
Source: Mayfair, 2024
Check assays consisting of the pulp portion of drill core samples previously assayed by Swastika (625 samples) and AGAT (137 samples) were submitted to ActLabs. Check assay samples assess the accuracy and precision of the assay data. It is expected that check assay results will return an assay value that is in line with its original sample:
| | Acceptable range for pulp duplicate samples is ±15% of the original assays. |
| | If the gold difference between the original and check assay is less than 0.1 g/t, a percent difference outside of 15% it is not considered to be an outlier. |
| Fenn-Gib Project |
Page 86 | |
| NI 43-101 Technical Report and Pre-Feasibility Study |
December 19, 2025 | |
|
|
The check assays were evaluated using Q—Q plots (Figure 11-7) and relative difference statistics. The results demonstrate repeatability between labs if samples near the detection limit are removed from the analysis; about 6% of the check assays did not meet the criteria. Figure 11-7 and Figure 11-8 are the Q-Q plots comparing the Swastika and AGAT samples with ActLabs and confirming the repeatability.
| Figure 11-7: | Control Chart—Check Assays, Swastika vs. ActLabs |
Source: Mayfair, 2024
| Fenn-Gib Project |
Page 87 | |
| NI 43-101 Technical Report and Pre-Feasibility Study |
December 19, 2025 | |
|
|
| Figure 11-8: | Control Chart—Check Assays, AGAT vs. ActLabs |
Source: Mayfair, 2024
| 11.8 | Density Determinations |
Density determinations were performed on split core, primarily by Swastika, with some determinations by ActLabs. Density determinations were calculated using the formula SG = Wa/(Wa-Ww), where Wa is the weight of the dry sample, and Ww is the weight of the sample while submerged completely in water. Since 2023, density determinations have been conducted for every tenth sample submitted. In 2023, there were 1,948 density determinations, and 4,360 in 2024.
| Fenn-Gib Project |
Page 88 | |
| NI 43-101 Technical Report and Pre-Feasibility Study |
December 19, 2025 | |
|
|
| 11.9 | Comment on Sample Preparation, Analyses and Security |
The sampling and analysis methods used by Mayfair Gold for the Project represent industry best-practice and adequate procedures for mineral resource estimation. The use of multiple ISO 17025-accredited laboratories (ActLabs, Swastika, AGAT) with overlapping assay ranges provides robust data quality. The comprehensive QA/QC program, including systematic insertion of Certified Reference Materials, field blanks, and duplicate assays at 20% frequency, demonstrates strong quality control. The excellent reproducibility demonstrated by duplicate assays (correlation coefficient of 0.995) and low QC failure rates (1.6%) provide confidence in the analytical data. The secure sample handling procedures, from field collection through secure transport to locked core storage at Matheson, ensure sample integrity throughout the chain of custody.
| 11.10 | Adequacy Statement |
QP, Tim Maunula, P.Geo., believes that the historical and present-day sampling preparation, security, analytical procedures, and quality control protocols conform to generally accepted industry best practices at the time they were performed, and are therefore reliable for the purpose of mineral resource estimation.
| Fenn-Gib Project |
Page 89 | |
| NI 43-101 Technical Report and Pre-Feasibility Study |
December 19, 2025 | |
|
|
| 12 | DATA VERIFICATION |
Data verification has been conducted historically and is ongoing; all of which adequately supports the MRE.
| 12.1 | Legacy data |
As the historical data are a large component of the database, validation and verification of the data have been part of the ongoing work. A variety of validation and verification techniques have been conducted including the following:
| | LSG and Dagbert & Desharnais (2011) conducted a 10% data check compared with scanned laboratory certificates. No discrepancies were identified. |
| | Dagbert & Desharnais (2011) compared the pulp duplicate data with the original assays. With the exception of a limited dataset (0.6% of the 2011 database), there appeared to be no significant bias. |
| | LSG resampled 223 assay intervals (277.1 m) of remaining half cores from the 1986 to 1998 drilling. No significant bias was identified (Dagbert & Desharnais, 2011). |
| | LSG conducted an eight-hole twin drilling program in 2011. The results showed good correlation between the original and the twinned holes (Dagbert & Desharnais, 2011). |
| | A block model was estimated using pre-2017 data versus 2017 data. In general, there was good correlation, except in areas of lower data density. No systematic bias was identified (Kirkham et al., 2021). |
Additional details are available in the Dagbert & Desharnais (2011) and Kirkham et al. (2021) technical reports.
| 12.2 | Verification by Tim Maunula |
| 12.2.1 | Site Inspection |
QP Tim Maunula, P.Geo. conducted his original site visit on February 6 and 7, 2023, including an inspection of the property, review of diamond drilling and logging, sampling, and core-storage facilities in Matheson.
A site visit in support of the 2024 MRE was conducted on April 16 and 17, 2024, including inspecting the property and reviewing diamond drilling and logging, sampling, and core storage facilities in Matheson, Ontario. A representative for Mayfair Gold accompanied Mr. Maunula on both site visits.
| 12.2.2 | Diamond Drilling |
Major Drilling currently conducts diamond drilling. Generally, casing is capped, the drill holes flagged, and the collar identification recorded on a metal strip (Figure 12-1). Mr. Maunula verified the collar locations for FG23-347, FG23-359, FG23-368, and FG24-372 within 1 m.
| Fenn-Gib Project |
Page 90 | |
| NI 43-101 Technical Report and Pre-Feasibility Study |
December 19, 2025 | |
|
|
| Figure 12-1: | Collar Labelling, FG23-347 |
Source: TMAC, 2024
| 12.2.3 | Databases Verification |
The QP conducted data verification during the update of the 2024 MRE. This included the built-in checks associated with importing data in GEMS and MinePlan, random checks of database assays compared with assay certificates, and reviewing the QA/QC performance (Section 11). As discussed in Section 14, exploratory data analysis to evaluate the grade distribution was an additional component of the data verification process.
The QP completed data verification of the assay grades for three drill holes compared with the associated digital import file. This was approximately 4% of Mayfair Gold’s new drilling used in the MRE. The QP did not identify any material issues and data were found to match the original certificates.
| 12.2.4 | Quality Assurance and Quality Control |
Quality assurance and quality control is addressed comprehensively in Section 11. The data verification process included reviewing the QA/QC performance of Mayfair Gold’s programs. The control charts demonstrating CRM performance, blank sample analysis, and duplicate sample reproducibility provide confidence in the assay database.
| Fenn-Gib Project |
Page 91 | |
| NI 43-101 Technical Report and Pre-Feasibility Study |
December 19, 2025 | |
|
|
| 12.2.5 | Comments on Data Verification |
Upon completing the data verification process, the QP believes that the geological data collection, sampling, and QA/QC procedures Mayfair Gold used are consistent with accepted industry practices. Comprehensive verification work included comparative analysis of historical and recent drilling, twin hole programs, resampling programs, and detailed QA/QC documentation, which demonstrates that the database is of suitable quality to support the MRE. The assay data have been verified through multiple independent methods and show no material bias or systematic errors. The database is reliable for mineral resource estimation purposes at the level reported in Section 14.
| 12.3 | Verification by Tommaso Roberto Raponi |
The QP visited the property on May 22, 2025. During the site visit, inspection of the site layout for locations of planned plant and site infrastructure, available drill core, the core logging and core sampling facilities was completed.
Metallurgical test data was verified through a review of previous studies and current testwork reports. Metallurgical testing has been completed at several specialist laboratories. Each laboratory has their own QA/QC procedures, which they adhere to in performing their testing on samples. All metallurgical data was verified and is adequate for this technical report as required by NI 43-101 guidelines.
There have been no limitations on the QP on his verification of any of the data presented in this report. The QP’s opinion is that all data presented in this report is adequate for the purposes of this report and is presented so that it is not misleading.
Inputs into operating costs were obtained through recent quotations or available data from other projects.
| Fenn-Gib Project |
Page 92 | |
| NI 43-101 Technical Report and Pre-Feasibility Study |
December 19, 2025 | |
|
|
| 13 | MINERAL PROCESSING AND METALLURGICAL TESTING |
| 13.1 | Introduction |
The metallurgical test work determined the optimum recovery process to be crushing and grinding, followed by flotation, rougher concentrate regrinding and cyanidation. The target primary 80% passing grind size (P80) was determined to be 106 µm, with a 23% to 25% rougher flotation mass recovery, with 29% selected for design and equipment sizing and, yielding a maximum 97% gold recovery to rougher concentrate. The concentrate regrind size selected was a P80 of 13 µm and achieved a nominal 92% gold extraction during cyanidation. The outcome of flotation followed by cyanidation is an estimated 89.6% gold recovery at a head grade of 1.5 g/t.
Gravity concentration is included in the process design as a provisional allowance; however, the gravity circuit will not be included in the initial project. Provision for this circuit will be incorporated into the process and construction designs to allow for future installation as part of sustaining capital, should the presence of sufficient coarse free gold suitable for gravity concentration be confirmed
Metallurgical testing was conducted on composite samples, over a range in head grade from 0.2 to 19.1 g/t gold and 0.3 to 8.1% sulphide sulphur (S2-). Composite sample selection is representative of the range in gold grade, sulphide sulphur content, and lithology with a focus on the ore expected during the life-of-mine open pit phases.
| 13.2 | Metallurgical Testwork |
More recent metallurgical studies associated with the Project include recent efforts of Mayfair Gold (2022-2025), and earlier programs conducted by Lake Shore Gold (2014 - 2015) and Tahoe Resources (2017-2018). Table 13-1 provides a summary of the respective metallurgical test programs.
| Table 13-1: | Metallurgical Testwork Summary Table |
| Year |
Laboratory/Location |
Testwork Performed | ||
| 2014 - 2015 |
Head analysis, bond ball mill grindability, gravity concentration and cyanidation of gravity tails, rougher flotation, pressure oxidation of rougher concentrate, regrind and cyanidation of rougher concentrate | |||
| 2017 - 2018 |
Head analysis, gravity concentration and cyanidation of gravity tails | |||
| 2022 - 2023 |
SGS Canada Inc., Lakefield, ON | Head analysis, mineralogy, SMC, Bond ball mill grindability and abrasion indices, whole ore cyanidation, rougher concentrate regrind and cyanidation, rougher concentrate pressure oxidation, flotation cleaner circuit locked cycle tests | ||
| 2024 - 2025 |
Head analysis, SMC, bond ball mill grindability and abrasion index, rougher flotation optimization, rougher concentrate regrind and cyanidation, rougher concentrate regrind specific energy, regrind slurry viscosity, heavy liquid separation | |||
| 2024 - 2025 |
PMC, Maple Ridge, BC | Mineralogy | ||
| Fenn-Gib Project |
Page 93 | |
| NI 43-101 Technical Report and Pre-Feasibility Study |
December 19, 2025 | |
|
|
| 13.2.1 | Legacy Testwork Programs (2014 - 2022) |
The earlier programs conducted by Lake Shore Gold (2014-2015), Tahoe Resources (2017-2018) and Mayfair Gold (2022 - 2023) considered various process strategies, including whole ore cyanidation, gravity concentration, rougher flotation, pressure oxidation of rougher concentrate, rougher concentrate regrinding and cyanidation. These programs and subsequent financial analysis concluded that whole ore cyanidation or pressure oxidation of the rougher concentrate were not optimal processing strategies for the Fenn-Gib deposit and have not been pursued. All rougher flotation, concentrate regrind and cyanidation testwork results have been incorporated into the PFS testwork dataset and are discussed in Section 13.2.2.
| 13.2.1.1 | Gravity Concentration |
Gravity concentration tests were performed on samples ground to a target grind size P80 of 100 µm. The ground samples were then processed through a Knelson MD-3 centrifugal concentrator, with the concentrate recovered and upgraded on a Mozley C-800 mineral separator. The Mozley concentrate (0.05% to 0.1% of the original sample mass) was fire assayed to extinction for gold. The results, summarized in Table 13-2, show gold recoveries to gravity concentrate ranging from 0 to 37%, averaging 13.4% with mass recoveries of 0.07 to 0.12%. Typically, gravity recoveries this low do not merit inclusion in the flowsheet. These testwork results were also not considered in any process design criteria or recovery modelling complete as part of the PFS as the test procedure did not follow a scalable test procedure such as the extended gravity recoverable gold (E-GRG) testing.
| Table 13-2: | Gravity Separation Testwork Summary |
| Composite ID |
Year | Grades (g/t Au) | Recovery to Gravity Concentrate (%) | |||||||||||||||
| Head (Assay) | Concentrate | Mass | Au | |||||||||||||||
| FG-11-05 |
2.38 | 330 | 0.08 | 12.0 | ||||||||||||||
| FG-11-08 |
1.33 | 118 | 0.12 | 10.2 | ||||||||||||||
| FG-12-13 |
2015 | 0.94 | 101 | 0.12 | 12.1 | |||||||||||||
| FG-12-29 |
1.98 | 317 | 0.08 | 12.7 | ||||||||||||||
| M-1 |
0.76 | 45.7 | 0.09 | 6.40 | ||||||||||||||
| M-2 |
0.56 | 83.8 | 0.07 | 9.60 | ||||||||||||||
| M-3 |
0.91 | 118 | 0.07 | 10.5 | ||||||||||||||
| M-4 |
0.46 | 60.7 | 0.07 | 9.80 | ||||||||||||||
| M-5 |
0.44 | 225 | 0.09 | 33.7 | ||||||||||||||
| M-6 |
2017 | 0.45 | 0.15 | 0.07 | 0.00 | |||||||||||||
| M-7 |
1.55 | 394 | 0.07 | 19.2 | ||||||||||||||
| M-8 |
0.65 | 6.57 | 0.11 | 1.10 | ||||||||||||||
| M-9 |
0.97 | 19.8 | 0.12 | 2.30 | ||||||||||||||
| M-10 |
1.85 | 557 | 0.10 | 36.9 | ||||||||||||||
| M-11 |
1.09 | 24.1 | 0.10 | 2.00 | ||||||||||||||
| M-12 |
0.88 | 115 | 0.21 | 26.7 | ||||||||||||||
| Fenn-Gib Project |
Page 94 | |
| NI 43-101 Technical Report and Pre-Feasibility Study |
December 19, 2025 | |
|
|
| Composite ID |
Year | Grades (g/t Au) | Recovery to Gravity Concentrate (%) | |||||||||||||||
| Head (Assay) | Concentrate | Mass | Au | |||||||||||||||
| M-13 |
0.80 | 34.9 | 0.19 | 8.10 | ||||||||||||||
| M-14 |
0.40 | 47.0 | 0.19 | 19.5 | ||||||||||||||
| M-15 |
1.12 | 46.3 | 0.10 | 4.20 | ||||||||||||||
| M-16 |
0.89 | 156 | 0.11 | 19.4 | ||||||||||||||
| M-17 |
0.75 | 97.4 | 0.07 | 8.60 | ||||||||||||||
| M-18 |
1.19 | 233 | 0.10 | 20.1 | ||||||||||||||
| M-19 |
2018 | 0.52 | 41.1 | 0.12 | 8.60 | |||||||||||||
| M-20 |
0.89 | 73.8 | 0.06 | 4.80 | ||||||||||||||
| M-21 |
1.43 | 460 | 0.08 | 34.5 | ||||||||||||||
| M-22 |
0.62 | 43.0 | 0.11 | 7.50 | ||||||||||||||
| M-23 |
0.80 | 164 | 0.08 | 15.9 | ||||||||||||||
| M-24 |
0.98 | 212 | 0.08 | 17.6 | ||||||||||||||
| 13.2.1.2 | Gravity Tailings Cyanidation |
The gravity tailings from the gravity concentration testwork described in Section 13.2.1.1 were rotary pulp split into 1 kg charges based on dry solids. Bottle roll cyanidation tests were performed on these sub-samples at P80 grind targets between 20 to 100 µm to evaluate the relationship between gold recovery and grind size. The test conditions applied for each cyanide leach included 50% solids, pulp pH of 10.5-11.0, six hours of pre-aeration, 0.3 g/L NaCN (sodium cyanide) and a retention time of 48 hours. Solution samples were taken after eight and 24 hours for gold leach kinetic characterization.
The 2014 - 2015 program on four composites considered direct cyanidation only and showed overall gold extractions from 76% to 96%, with NaCN consumption ranging from 0.03 kg/t to 0.17 kg/t and lime (CaO) consumption ranging from 0.53 kg/t to 1.85 kg/t. The 2017 - 2018 program was performed on 14 composites, and showed overall gold extraction from 31 to 93%, with only one sample exceeding 90%. The NaCN consumption ranged from 0.11 kg/t to 0.29 kg/t for all the tests completed and lime consumption ranged from 0.89 kg/t to 2.13 kg/t.
| 13.2.1.3 | Bond Ball Mill Work Index Grindability Tests |
Bond ball mill work index grindability tests were performed on four composites representative of mafic and ultramafic lithologies at a closing screen size of 90 µm during the 2014 - 2015 program. The composites were found to have Bond ball mill work index values ranging from 16.2 to 16.6 kWh/t. The 2024 testwork of ten composite samples, conducted at a closing screen size of 90 µm, yielded a result of 18.2 kWh/t (range 16.5 to 20.5), classifying the samples as hard. These results were not considered for the process design as the tests were not conducted at the standard closing screen size of 150 µm or one equivalent to the design primary grind size (P80 of 106 µm).
| Fenn-Gib Project |
Page 95 | |
| NI 43-101 Technical Report and Pre-Feasibility Study |
December 19, 2025 | |
|
|
| 13.2.1.4 | Pressure Oxidation |
The amenability of samples to flotation followed by acid pressure oxidation (POX) was evaluated through bench scale testwork on five different flotation concentrates: four rougher concentrates generated from samples of mafic and ultramafic lithologies in the 2014-2015 program and one third cleaner concentrate in the 2022 - 2023 program. These POX tests were conducted in a 2 L Parr autoclave to fully oxidize the sulphides and render the gold amenable to cyanidation. The testwork was conducted on “as-is” flotation concentrates at 200°C, with sulphuric acid to remove carbonates.
Cyanide leaching of POX product ranged from 89% to 99% Au extraction was achieved with 72% to 100% sulphide oxidation of flotation concentrate, yielding an overall 73% to 91% Au recovery. The results obtained from flotation followed by POX were essentially comparable to those achieved from flotation, regrinding, and cyanidation. There is no apparent recovery benefit associated with the higher complexity pressure oxidation process when compared to the more conventional rougher flotation, regrind and cyanidation of the rougher concentrate.
| 13.2.1.5 | Locked Cycle Cleaner Flotation |
Seven composites were subjected to locked cycle cleaner flotation testing as part of the 2022 - 2023 program. The primary objectives of the cleaner flotation testing were to maximize the gold recovery and grade to a saleable concentrate. Rougher concentrate was reground to target a P80 of 15-20 µm and split into four equal samples for locked cleaner circuit cycles. The samples were cleaned three times, with 15 g/t each of collector (PAX) and promoter (AERO 3477) added per cleaner stage.
The tests yielded 89 - 95% Au and 91-95% sulphide sulphur- recovery to the third cleaner concentrate with 2.0 - 9.7% mass recovery. These results are equivalent to those obtained with the alternative rougher flotation, with concentrate regrind and cyanidation. Subsequent financial analysis determined that on-site cyanidation offers more favourable economics given the cost implications of concentrate transport and net smelter and refining charges. Evaluation of regrinding and leaching cleaner concentrate showed that the regrinding and leaching rougher concentrate provided better economics.
| 13.2.2 | Pre-Feasibility Study Testwork Program (2023 - 2025) |
The PFS references 2023 to 2025 testwork completed at SGS-Lakefield, with results from earlier programs included as needed to provide additional variability data. Metallurgical variability testing conducted in 2024-2025 included 50 composite samples representing a range of gold grades, sulphur content, lithologies, and mining phases, with an emphasis on material expected during the first seven years of production. This work established baseline criteria for process design, including flotation feed grind size, mass pull, retention time, reagent selection, regrind parameters, and dewatering requirements.
| Fenn-Gib Project |
Page 96 | |
| NI 43-101 Technical Report and Pre-Feasibility Study |
December 19, 2025 | |
|
|
| 13.2.3 | Mineralogical Studies |
Mineralogy studies were conducted on subsamples of flotation products and whole ore leach tailings from the test program at SGS-Lakefield (2022) and PMC-Vancouver (2024-2025). This analysis applied TESCAN TIMA automated scanning electron microscopy (SEM) techniques to determine the mineralogical makeup, gold association and grain size of the materials tested. These mineralogical studies of gold occurrences in residue samples from testwork established the presence of fine free gold, electrum (Au-Ag), petzite (Ag3AuTe2), calaverite (AuTe2). Native gold and tellurides were identified in a rougher concentrate cyanidation residue, all occurring as locked in pyrite and arsenopyrite. The average particle size of the gold minerals was 1.8 µm.
| 13.2.3.1 | Comminution Testing |
Ten composites were subjected to comminution testing in 2024, specifically Bond ball mill work index (BBWi), abrasion index, Bond crusher work index (CWi), SAG Power Index (SPI), and high-pressure grinding roll (HPGR) Static Pressure Tests (SPT). The Bond ball mill work index testing was conducted at a closing screen size equivalent to the design primary grind size P80 of 106 µm. Four composites were subjected to additional SMC Tests and SAG Circuit Specific Energy (SCSE) testing. Table 13-3 shows the tests results. The SMC Axb ranges from 22.0 to 24.6, classifying the material as hard based on the reference set of values in the JK database. The 75th percentile of Axb and BBWi values were 22.7 (classified as hard/competent) and 19.0 kWh/t (classified as hard) respectively. The average abrasion index was 0.335 (classified as medium). The spatial variability of the comminution samples is shown in Figure 13-1.
| Table 13-3: | Comminution Test Results |
| Composite ID |
Principal Lithology |
Abrasion Index |
SMC Axb | BBWi (kWh/t) |
CWi (kWh/t) |
SCSE (kWh/t) |
SPI | SPT (kWh/t) | ||||||||||||||||||||||
| GCC-01 |
0.21 | — | 18.5 | 10.5 | — | 472 | 18.5 | |||||||||||||||||||||||
| GCC-02 |
Mafic | 0.56 | — | 16.5 | 16.5 | — | 176 | 16.5 | ||||||||||||||||||||||
| GCC-03 |
0.15 | 22.0 | 16.7 | 8.4 | 14.31 | 300 | 16.7 | |||||||||||||||||||||||
| GCC-04 |
Intermediate | 0.42 | — | 17.9 | 16.6 | — | 175 | 17.9 | ||||||||||||||||||||||
| GCC-05 |
Sedimentary | 0.10 | 22.7 | 19.4 | 16.9 | 13.3 | 152 | 19.4 | ||||||||||||||||||||||
| GCC-06 |
Mafic | 0.27 | — | 18.4 | 19.1 | — | 141 | 18.4 | ||||||||||||||||||||||
| GCC-07 |
Intermediate | 0.45 | — | 17.5 | 20.7 | — | 134 | 17.5 | ||||||||||||||||||||||
| GCC-08 |
0.25 | 22.7 | 20.5 | 21.6 | 13.1 | 144 | 20.5 | |||||||||||||||||||||||
| GCC-10 |
Mafic | 0.51 | — | 19.1 | 12.9 | — | 234 | 19.1 | ||||||||||||||||||||||
| GCC-12 |
Intermediate | 0.19 | 24.6 | 17.4 | 16.5 | 12.2 | 172 | 17.4 | ||||||||||||||||||||||
| Fenn-Gib Project |
Page 97 | |
| NI 43-101 Technical Report and Pre-Feasibility Study |
December 19, 2025 | |
|
|
| Figure 13-1: | Spatial Variability of Comminution Samples |
Source: Mayfair, 2025
| 13.2.3.2 | Heavy Liquid Separation |
Heavy liquid separation (HLS) amenability testwork was completed on a single composite (#16) in 2024. The testwork applied methylene iodide as the organic medium, with the specific gravity of the liquid phase adjusted from 2.7 to 3.1 using acetone. The sample was screened at 814 µm (20 mesh), and the float fraction was removed at 0.1 specific gravity increments. The float and sink products from each increment were assayed. The testwork demonstrated the material was not amenable to density separation, with no significant gold concentration in either the float or sink products. No additional HLS testwork was pursued on the remaining composites.
| Fenn-Gib Project |
Page 98 | |
| NI 43-101 Technical Report and Pre-Feasibility Study |
December 19, 2025 | |
|
|
| 13.2.3.3 | Rougher Flotation Optimization |
The flotation optimization program, initiated in 2023 and continuing through 2025, focused on improving the recovery of gold associated with sulphides and fine free gold. The testing evaluated the impact of grind size, mass recovery to rougher concentrate, flotation rate kinetics, and reagent schemes to establish parameters for full-scale design.
Figure 13-2 indicates the established trend for gold and sulphide recovery to rougher concentrate relative to flotation feed grind size. The results indicate that a coarser grind size of P80 106 µm results in only a slight reduction of approximately 1% in gold and sulphide recovery compared to P80 75 µm. A primary grind size of P80 106 µm was selected for process design.
| Figure 13-2: | Rougher Concentrate Gold and Sulphide Recovery as a Function of Flotation Feed Grind Size |
Source: Mayfair, 2025
| Fenn-Gib Project |
Page 99 | |
| NI 43-101 Technical Report and Pre-Feasibility Study |
December 19, 2025 | |
|
|
Figure 13-3 indicates the trend between concentrate rougher mass recovery (pull) versus sulphide and gold recovery to concentrate. The results indicate approximately 23 to 25% mass recovery to rougher concentrate is required to achieve 96% gold recovery across a wide range of feed grades. The rougher flotation rate kinetics, summarized in Figure 13-4, demonstrated that 20 minutes is sufficient to achieve required results. A bench scale flotation testwork scale-up factor of 2.5 is applied for equipment sizing.
| Figure 13-3: | Gold and Sulphide Recovery to Rougher Concentrate as a Function Rougher Concentrate Mass Recovery (Pull) |
Source: Mayfair, 2025
| Fenn-Gib Project |
Page 100 | |
| NI 43-101 Technical Report and Pre-Feasibility Study |
December 19, 2025 | |
|
|
| Figure 13-4: | Rougher Flotation Kinetics |
Source: Mayfair, 2025
Flotation testwork completed in 2015 included potassium amyl xanthate (PAX) as the primary collector, and methyl isobutyl carbinol (MIBC) as the frother, at natural pH. Subsequent testwork during 2023-2025 involved the use of secondary collectors that included isobutyl dithiophosphate (Aero-3477) and isoamyl dithiophosphate (Aero-3501) to improve the stability of the froth and to pursue incremental gold recovery. Alternative collectors, including MaxGold and Aerophine 3418A, were evaluated and confirmed as comparable. However, a more brittle froth was noted with these collectors in rougher flotation.
The 2025 variability testing confirmed the optimum conditions to be a natural pH of 8.0 to 8.8, with PAX (45 g/t) as the primary collector, Aero-3477 and Aero-3501 (20 g/t each) as sulphide collection promoters, and MIBC as the frothing agent (60 g/t).
| Fenn-Gib Project |
Page 101 | |
| NI 43-101 Technical Report and Pre-Feasibility Study |
December 19, 2025 | |
|
|
| 13.2.3.4 | Rougher Concentrate Regrinding and Cyanidation |
The regrind and cyanidation of rougher concentrate was considered in the 2022—2025 testwork programs. The concentrate was reground to a grind size P80 of 5-25 µm, with a slurry density of 42% solids by weight, and pH 10.5. Dissolved oxygen levels were maintained at greater than 5 mg/L with sparge air, and cyanide concentration maintained at 1.0 g/L NaCN for 48 hours. Solution subsamples were taken after 4, 8, 12 and 24 hours for gold leach kinetic characterization. The 2025 variability testwork program considered the influence of variable lithologies, with feed grades from 0.2-9.9 g/t Au, 0.3-4.6% sulphide sulphur-, and at a target regrind size P80 of 13 µm.
Figure 13-5 indicates the trend between concentrate regrind size versus residue grades and cyanidation gold extraction. The data suggests Au extraction generally increases with decreasing concentrate grind size. However, the 2025 variability test results, with a target regrind size P80 of 13 µm, show a range of 75% to 99% gold extraction with an actual P80 range of 9 -14 µm. Approximately 25% of the lower extraction is associated with low sample head-grades. The remainder, which represents 15% of all samples tested suggests that a fraction of contained gold is not entirely amenable to cyanidation with gold disseminated at sub-micron grain-size within iron sulphide minerals, or alloyed with other metals (Ag, Te, Bi) causing them to be less cyanide soluble. The updated gold recovery model includes the 2025 variability test data, which confirms a continued favourable response of gold mineralization to flotation, with most of the rougher concentrate from test samples responding well to cyanidation after regrinding.
Figure 13-6 shows the gold extraction achieved after 4, 8, 12, 24 and 48 hours on all variability composites. Results indicate no significant incremental gold extraction after 24 hours, with average reagent consumptions of 1.00 kg/t NaCN and 1.1 kg/t CaO feed measured on leach feed.
| Fenn-Gib Project |
Page 102 | |
| NI 43-101 Technical Report and Pre-Feasibility Study |
December 19, 2025 | |
|
|
| Figure 13-5: | Gold Leach Extraction and Gold Leach Residue as a Function of Grind Size |
Source: Mayfair, 2025
| Fenn-Gib Project |
Page 103 | |
| NI 43-101 Technical Report and Pre-Feasibility Study |
December 19, 2025 | |
|
|
| Figure 13-6: | Rougher Concentrate Leach Extraction as a Function of Time |
Source: Mayfair, 2025
| 13.2.3.5 | Rougher Concentrate-Regrind-Specific Energy Testwork |
A bulk rougher-concentrate sample was prepared from Composite 17 (see Table 13-6) to determine the HIGmill specific grinding energy (kWh/t) required to regrind the concentrate to a series of target product sizes that included P80 grind sizes of 10, 13, 15, and 20 µm. The testwork considered ceramic grinding media (3 mm and 4 mm diameter) at 45% solids and 47% by weight. Figure 13-7 shows the regrind specific energy increase with decreasing product size. Based on the results, an approximate specific grinding energy (SGE) of 22 kWh/t was assumed for the design regrind size of (P80) 13 µm.
Slurry viscosity measurements, summarized in Table 13-4, show a dynamic viscosity of 9.1 mPa-s and constant shear viscosity of 11.9 mPa-s at the expected operating conditions i.e. a slurry temperature of 29°C, 42% by weight, and pH 10.5. No viscosity-related issues are anticipated within the regrind mill operating range of 42% to 47% by weight.
| Fenn-Gib Project |
Page 104 | |
| NI 43-101 Technical Report and Pre-Feasibility Study |
December 19, 2025 | |
|
|
| Figure 13-7: | Concentrate Regrind-HIGmill Specific Grinding Energy kWh/t |
Source: Mayfair, 2025
| Table 13-4: | Concentrate Regrinding—Regrind Mill Slurry Viscosity Measurements |
| Sample |
%Solids (by weight) |
pH | Temp (oC) |
Dynamic Viscosity (mPa-s) |
Constant Shear Viscosity (mPa-s) | |||||
| Regrind Mill Feed |
42 | 7.3 | 21 | 6.2 | 7.0 | |||||
| Regrind Mill Discharge-Natural pH |
42 | 7.3 | 29 | 7.5 | 9.7 | |||||
| Regrind Mill Discharge-pH 10.3 |
42 | 10.5 | 29 | 9.1 | 11.9 |
| Fenn-Gib Project |
Page 105 | |
| NI 43-101 Technical Report and Pre-Feasibility Study |
December 19, 2025 | |
|
|
| 13.2.3.6 | Environmental Acid-Base Accounting Testwork |
The Modified Sobek acid-base accounting (ABA) was conducted on the products of testing from three composites, two in the 2022 - 2023 program and one in the 2024 - 2025 program. The ABA test results quantify the acid generation potential (AP) relative to the oxidation of sulphide sulphur. The method also defines the neutralization potential (NP) by initiating a reaction with excess acid, then titrating to pH 8.3 with sodium hydroxide to determine how much acid was consumed during the reaction. The ratio between NP and AP is an indicator as to the potential of the sample to generate acid rock drainage (ARD).
The results, summarized in Table 13-5, show the rougher tailings neutralizing potential ranged from 63 to 142 tonnes CaCO3/1,000 tonnes, while the AP ranged from 0.3 to 1.3 tonnes CaCO3/1,000 tonnes. The NP/AP ratio varied from 50 to 456, classifying the tailings as non-potentially acid generating (“PAG”).
The flotation concentrates and concentrate cyanidation residues are classified as PAG, with neutralizing potential ranging from 65 to 154 tonnes CaCO3/1,000 tonnes, while the acid generation potential ranged from 25 to 290 tonnes CaCO3/1,000 tonnes. The ratio of NP/AP was low, between 0.5 to 2.6, indicating that the sulphide concentrate is only marginally buffered.
| Table 13-5: | Acid-Base Accounting Test |
| Composite ID/Year |
Description |
pH |
Neutralizing Potential (t CaCO3/1,000 t) |
Acid Generating (Mt CaCO3/1,000 t) |
Ratio NP/ |
Classification | ||||||
| Central Pit Upper/2022 |
Rougher Tailings | 9.2 | 132.0 | 1.3 | 105.6 | non-PAG | ||||||
| Conc CN Residue | 9.0 | 132.0 | 90.6 | 1.5 | PAG | |||||||
| Central Pit Lower/2022 |
Rougher Tailings | 9.2 | 62.9 | 1.3 | 50.3 | non-PAG | ||||||
| Conc CN Residue | 9.1 | 65.3 | 24.7 | 2.6 | PAG | |||||||
| Composite 29/2024 |
Rougher Tailings | 9.2 | 142.0 | 0.3 | 456 | non-PAG | ||||||
| Rougher Conc. | 8.3 | 154.0 | 290.0 | 0.53 | PAG |
| 13.3 | Metallurgical Variability |
The most common mineralization within the Project area consists of quartz-carbonate veins, stringers, and breccias hosted within intensely altered volcanic rocks and granitoid intrusions. A second style is characterized by gold associated with intensely altered sediments, containing variable amounts of fine crystalline pyrite. Gold is the mineral of economic interest, occurring predominantly with pyrite and as fine free gold grains. Significant concentrations of gold mineralization on the Project primarily occur within two overlapping zones (the Main Zone and the Deformation Zone) and a third zone 100 m north of the main zone (Footwall zone). There are five principal lithological units, with four classified based on decreasing silica abundance, namely Felsic, Intermediate, Mafic and Ultramafic. The fifth unit, Sedimentary, is made up of weathered sediments from the other units.
| Fenn-Gib Project |
Page 106 | |
| NI 43-101 Technical Report and Pre-Feasibility Study |
December 19, 2025 | |
|
|
The samples used for metallurgical testing were obtained from several drillholes across the project. Prior to 2023 samples were based on extended interval lengths and potentially included material from multiple drill holes, representing a larger spatial volume. Testwork conducted between 2023 and 2025 considered variability samples as contiguous mineralized intercepts, with each sample typically derived from a single diamond drill hole. Both approaches to composite sample preparation are valid. Additional consideration was given to the preliminary mine production schedule in selecting the 50 composite samples for the variability testwork in the 2024 - 2025 program.
Table 13-6 summarizes the metallurgical sample composite details. These samples cover a range in head grade from 0.2 to 19.1 g/t gold and 0.3 to 8.1% sulphide sulphur-. These grades represent the range of gold grades, sulphide sulphur- content, lithologies, and mining phases in the deposit. Table 13-7 summarizes the subset of samples used for comminution testing.
| Table 13-6: | Metallurgical Sample Details |
| Composite IDs |
Drill Holes |
Interval Depth |
Principal Lithology Grouping |
Head Grades, range |
Test Program Year | |||||||
| Au (g/t) |
S2 - (%) | |||||||||||
| FG-11-05, 08 |
FG-11-05, 08 | 36 - 120 | Mafic | 2.38, 1.33 | 4.02, 2.68 | 2015 | ||||||
| FG-12-13, 29 |
FG-12-13, 29 | 313 - 395 | Ultramafic & Sedimentary | 0.94, 1.98 | 2.58, 1.72 | 2015 | ||||||
| M-1 to 14 |
FG-17-43, 48, 49, 51, 56, 57, 60 & 62 |
195 - 462 | Intermediate, Mafic & Sedimentary |
0.40 - 1.98 | 0.60 - 1.72 | 2017 | ||||||
| M-15 to 17 |
FG-17-72, 88 | 141 - 227 | Intermediate & Mafic | 0.75 - 1.12 | 1.83 - 7.17 | |||||||
| M -18, 22 |
FG-17-93, 105 | 12 - 63 | Intermediate & Mafic | 1.19, 0.62 | 2.76, 2.45 | 2018 | ||||||
| M-19 to 21, 23, 24 |
FG-17-67, 93, 97, 105 | 124 - 268 | Mafic | 0.52 - 1.43 | 0.88 -2.12 | |||||||
| Footwall |
FG-21-158, 161 | 31 - 87 | Mafic | 0.56 | 4.44 | |||||||
| South Pit |
FG-21-147 | 47 - 206 | Intermediate, Mafic, Ultramafic & Sedimentary |
1.56 | 2.42 | |||||||
| Central Pit Upper |
FG-21-152, 155 | 12 - 89 | Intermediate | 1.14 | 3.31 | |||||||
| Central Pit Mid |
FG-21-152, 155 | 88 - 162 | Felsic, Intermediate & Ultramafic | 1.33 | 2.11 | 2022 | ||||||
| Central Pit Lower |
FG-21-152, 155 | 88 - 162 | Mafic & Ultramafic | 1.16 | 0.96 | |||||||
| East Pit |
FG-21-145, 146 | 54 - 140 | Intermediate, Mafic & Sedimentary | 0.80 | 1.62 | |||||||
| FW Underground |
FG-21-139, 140, 146 | 397 - 562 | Mafic | 4.15 | 2.53 | |||||||
| FG-22-254 |
FG-22-254 | 368 - 471 | Intermediate & Ultramafic | 1.28 | 2.41 | |||||||
| Composite 1 to 4 |
FG-22-250 | 13 - 81 | Intermediate & Mafic | 0.47 - 2.22 | 2.53 - 3.52 | |||||||
| Composite 5 to 7 |
FG-22-250 | 86 - 208 | Intermediate & Mafic | 1.10 - 1.30 | 1.50 - 3.56 | |||||||
| Composite 8 to 11 |
FG-22-253 | 11 - 93 | Intermediate & Mafic | 0.46 - 1.58 | 1.94 - 2.96 | 2024 | ||||||
| Composite 12 to 18 |
FG-22-253 | 95 - 355 | Intermediate & Mafic | 0.80 - 4.67 | 1.29 - 2.36 | |||||||
| Composite 19, 20 |
FG-23-310 | 43 - 83 | Mafic & Ultramafic | 0.37, 0.81 | 0.99, 1.73 | |||||||
| Composite 22 |
FG-23-310 | 146 - 153 | Mafic | 0.46 | 1.07 | |||||||
| Fenn-Gib Project |
Page 107 | |
| NI 43-101 Technical Report and Pre-Feasibility Study |
December 19, 2025 | |
|
|
| Composite IDs |
Drill Holes |
Interval Depth |
Principal Lithology Grouping |
Head Grades, range |
Test Program Year | |||||||
| Au (g/t) |
S2 - (%) | |||||||||||
| Composite 23 to 27 |
FG-23-312 | 33 - 100 | Mafic | 0.97 - 19.1 | 0.3 - 2.81 | |||||||
| Composite 28 to 31 |
FG-23-350 | 35 - 88 | Mafic | 1.62 - 2.00 | 1.61 - 3.35 | |||||||
| Composite 32 to 41 |
FG-23-350 | 96 - 350 | Intermediate | 0.56 - 6.32 | 1.51 - 4.94 | |||||||
| Composite 42, 43 |
FG-23-356 | 31 - 83 | Intermediate | 0.59, 0.49 | 1.80, 1.09 | |||||||
| Composite 44, 45 |
FG-23-356 | 116 - 162 | Mafic | 0.78, 1.44 | 2.33, 3.95 | |||||||
| Composite 46, 47, 49 |
FG-23-253, 307, 310 | 34 - 61 | Intermediate, Mafic & Ultramafic | 0.25, 0.18, 0.59 | 1.64, 1.05, 0.52 | |||||||
| Composite 48, 50 |
FG-23-356 | 96 - 116 | Intermediate, Mafic & Ultramafic | 0.22, 0.23 | 1.40, 0.29 | |||||||
Note:
| 1. | Not continuous |
| Table 13-7: | Comminution Testing Sample Details |
| Composite IDs |
Drill Holes |
Interval Depth |
Principal Lithology Grouping |
Test Program Year | ||||
| GCC-01 to 04 | FG-21-137, FG-21-142, FG-22-250, FG-23-312, FG-23-356, GT-23-03 |
14 - 50 | Intermediate & Mafic | 2024 | ||||
| GCC-05, 06 | FG-23-250, GT-23-03 | 92 - 132 | Intermediate & Sedimentary | |||||
| GCC-07, 08 | FG-22-265, FG-22-280 | 27 - 75 | Intermediate & Mafic | |||||
| GCC-09 to 12 | FG-22-265, FG-22-280 | 108 - 185 | Intermediate & Mafic |
Note:
| 1. | Not continuous |
| 13.4 | Deleterious Elements |
Metallurgical testing has not identified any deleterious elements present in significant quantities that would impair the quality of the doré bullion that would be produced. Mercury is present in small concentrations, below detectable limits of the chemical assay. Arsenic is present in low levels, ranging from 1 g/t to 5 g/t. It is not anticipated from the testwork completed that mercury abatement equipment would be required in the elution circuit or gold room. The samples presented low levels of typical deleterious elements.
| 13.5 | Recovery Estimates |
Rougher concentrate gold recovery was determined as a function of the mill feed gold grade, with the maximum realized rougher-flotation gold recovery estimated as 97.0 % gold recovery:
| Flotation Recovery (% Au) = ((f - t) + (t x (C/F)) /f |
|
to a maximum of 97% |
| Fenn-Gib Project |
Page 108 | |
| NI 43-101 Technical Report and Pre-Feasibility Study |
December 19, 2025 | |
|
|
Gold extraction from a reground rougher concentrate is expressed as a function of the mill feed gold grade, with the maximum realized cyanide extractable gold recovery estimated at 96.0%:
Cyanidation %Ext Au = (f +93) to a maximum of 96%
Overall, gold recovery is the outcome from both unit processes, with an assumed constant 23% mass recovery (F/C), and a flotation tailing grade of 0.10 g/t Au (t) resulting in an overall gold recovery of 89.6% Rec Au at 1.50 g/t Au. Details are as follows:
| F | = Mill Feed tonnage |
| C | = Flotation Rougher Concentrate tonnage |
| T | = Flotation Tailing tonnage |
| C/F | = Mass Pull to concentrate |
| f | = Flotation Feed grade |
| c | = Flotation Concentrate grade |
| t | = Flotation Tailings grade |
| Formula 1: |
F = C + T |
tonnage in = tonnage out | ||
| Formula 2: |
Ff = Cc + Tt |
metal in = metal out | ||
| Formula 3 : |
Mass Pull = C/F = (f-t) /(c-t) |
|||
| Formula 4 |
Flotation %Rec Au = Cc/Ff x 100 |
|||
| Formula 5 |
Flotation %Rec Au = ((f-t) + (t x C/F)) /f |
|||
| Formula 6 |
Cyanidation %Extraction Au = (f + 93) |
|||
| Formula 7 |
Overall %Rec Au = (f+93) x ((f-t) + (t x (C/F)) /f |
Overall, Au recovery as a function of gold feed grade for Fenn-Gib mineralization, (>0.2 g/t Au), is then:
Overall %Rec Au = (f + 93) x ((f - 0.10) + (0.10 x 0.23)) /f to a maximum 93%Rec Au
Overall %Rec Au at 1.5 g/t Au = (1.5 + 93) x ((1.5 - 0.10) + (0.10 x 0.23)) /1.5 = 89.6 % Rec Au
A comparison of modelled overall gold recovery to all testwork completed during 2022-2025 is indicated in Figure 13-8. The additional variability test data from 2025 introduced a wider range of sample head grades and provided an opportunity to adjust the associated recovery model for overall gold recovery.
| Fenn-Gib Project |
Page 109 | |
| NI 43-101 Technical Report and Pre-Feasibility Study |
December 19, 2025 | |
|
|
| Figure 13-8: | Modelled Gold Recovery as a Function of Gold Head Grade |
Source: Mayfair, 2025
| Fenn-Gib Project |
Page 110 | |
| NI 43-101 Technical Report and Pre-Feasibility Study |
December 19, 2025 | |
|
|
| 14 | MINERAL RESOURCE ESTIMATES |
| 14.1 | Introduction |
This section presents the MRE for the Project, prepared and disclosed in accordance with the CIM Standards and Definitions for Mineral Resources and Mineral Reserves (CIM Definition Standards) (CIM, 2014) and the CIM Estimation of Mineral Resources & Mineral Reserve Best Practice Guidelines (CIM, 2019). The MRE includes both Indicated and Inferred Resources. QP Tim Maunula, P.Geo., is responsible for the MRE, which has an effective date of September 3, 2024.
The MRE was prepared using Hexagon Mining MinePlan software (HxGN MinePlan 16.2.1) and classified according to the CIM Definition Standards for Mineral Resources and Mineral Reserves (CIM, 2014). The Fenn-Gib block model was estimated using three interpolation methods: nearest neighbour (NN), inverse distance weighting squared (IDW2), and ordinary kriging (OK). Uncapped and capped gold grades were estimated for the OK model. Only capped gold grades were estimated for the NN and IDW2 models.
| 14.2 | Key Assumptions |
The MRE incorporates extensive drill hole data from surface diamond drill programs, combining both historical drilling completed prior to 2017 and Mayfair Gold’s drilling campaign from 2021-2024. The cut-off date for assay data used in the MRE was April 30, 2024. All data received were recorded in NAD 83 UTM coordinates (Zone 17).
The MRE was:
| | prepared using Hexagon Mining’s HxGN MinePlan 16.2.1 (MinePlan) |
| | classified according to the CIM Definition Standards |
| | reported within a constraining resource pit shell at a 0.3 g/t Au cut-off grade, which is amenable to open pit extraction. |
| 14.3 | Data |
The Project MRE is based on drill-hole data consisting of gold assays, geological descriptions, and density measurements. Mayfair Gold provided the data in CSV and DXF file formats, which were imported into MinePlan. The database was additionally verified using the validation tool in MinePlan to determine errors and overlapping or out-of-sequence intervals. Minor errors were noted, and the database was updated.
The MRE used 457 historical drill holes (totalling 145,332.81 m) and 291 Mayfair Gold drill holes (totalling 171, 120.25 m), which together yielded 217,354 assayed intervals, and 20,688 unassayed intervals that were assigned an assay value of 0.
| Fenn-Gib Project |
Page 111 | |
| NI 43-101 Technical Report and Pre-Feasibility Study |
December 19, 2025 | |
|
|
| 14.4 | Geological Models |
The primary gold mineralization for the Project was modelled in three domains: Main Zone, Deformation Zone, and Footwall Zone (including a Footwall Zone High Grade). However, gold mineralization is also contained within the other contiguous geological domains: mafic volcanics, pyroxenite, ultramafic volcanics, and sediments (Figure 14-1). Mayfair Gold modelled the rock-type groups using Datamine Studio EM (Datamine). The QP reviewed and validated these rock-type group wireframes for use in the MRE. Gold grades were estimated separately by rock type within each domain.
| Figure 14-1: | Plan View of Drill Hole Traces and Interpreted Geological Block Models |
Source: TMAC, 2024
The wireframes were used to code the block model and calculate the drill-hole solid intersections to code the assay and composite data. The domain codes assigned are listed in Table 14-1.
| Fenn-Gib Project |
Page 112 | |
| NI 43-101 Technical Report and Pre-Feasibility Study |
December 19, 2025 | |
|
|
| Table 14-1: | Geology Black Model Codes and Descriptions |
| Rock Code |
Domain Code |
Description | ||
| MV |
10 | Mafic Volcanics | ||
| DZ |
20 | Deformation Zone | ||
| MAIN |
30 | Main Zone | ||
| PYX |
40 | Pyroxenite | ||
| UMV |
50 | Ultramafic Volcanics | ||
| SEDS |
60 | Sediments | ||
| DIA |
70 | Diabase | ||
| FWZ |
90 | Footwall Zone | ||
| FWZHG |
95 | Footwall Zone High Grade | ||
| OVB |
99 | Overburden |
| 14.5 | Density Assignment |
Table 14-2 reports the average density values by domain code based on 4,360 individual measurements using standard water-displacement methods. Overburden density was assigned 1.80 g/cm3 and the default density was 2.81 g/cm3.
| Table 14-2: | Assigned Density Values |
| Domain Code |
Lithology |
Count |
Density (g/cm3) | |||
| 10 |
Mafics | 1,266 | 2.90 | |||
| 20 |
Deformation Zone | 570 | 2.69 | |||
| 30 |
Main Zone | 1,034 | 2.81 | |||
| 40 |
Pyroxenite | 368 | 2.90 | |||
| 50 |
Ultramafics | 94 | 2.83 | |||
| 60 |
Metasediments | 426 | 2.74 | |||
| 90 |
Footwall Zone | 602 | 2.86 | |||
|
|
| |||||
| Average |
4,360 | 2.81 | ||||
|
|
| |||||
| 14.6 | Exploratory Data Analysis |
| 14.6.1 | Assays |
The mineral resource model includes only gold assays from drill holes within or near to the interpreted geological wireframes. Exploratory data analysis was conducted on raw drill-hole data selected by mineralization zone or rock type to determine the nature of the gold grade distribution and correlation of grades with individual domains. The gold grade values were evaluated through a combination of descriptive statistics, histograms, probability plots, and box plots.
| Fenn-Gib Project |
Page 113 | |
| NI 43-101 Technical Report and Pre-Feasibility Study |
December 19, 2025 | |
|
|
Figure 14-2 presents a boxplot which graphically illustrates the uncapped gold grade sorted by the domain codes. The highest mean gold grades are associated with the Main Zone (30) and Deformation Zone (20).
| Figure 14-2: | Boxplot of Uncapped Gold Grades (g/t) by Domain Code |
Source: TMAC, 2024
| 14.7 | Grade Capping/Outlier Restrictions |
In mineral deposits with skewed distributions (characterized by a coefficient of variation [CV] greater than two), a small number of high-grade outliers may account for a significant portion of the contained metal content. These high-grade outliers typically show limited spatial continuity.
Capping analysis by domain (Table 14-3) was carried out on assay values using disintegration analysis and log-probability plots.
| Fenn-Gib Project |
Page 114 | |
| NI 43-101 Technical Report and Pre-Feasibility Study |
December 19, 2025 | |
|
|
| Table 14-3: | Capping Analysis Summary |
| Domain Code |
Count |
Uncapped Grades |
Capped Grades | |||||||||||||
| Max (g/t Au) |
Mean (g/t Au) |
CV |
Cap Value (g/t Au) |
No. Capped |
Mean (g/t Au) |
CV | ||||||||||
| 10 |
49,626 | 835.330 | 0.113 | 47.31 | 15.00 | 11 | 0.075 | 5.09 | ||||||||
| 20 |
30,974 | 90.550 | 0.539 | 2.65 | 20.00 | 17 | 0.531 | 2.24 | ||||||||
| 30 |
44,635 | 151.690 | 0.708 | 2.94 | 28.50 | 22 | 0.690 | 2.10 | ||||||||
| 40 |
22,978 | 392.000 | 0.320 | 12.25 | 24.50 | 23 | 0.230 | 4.63 | ||||||||
| 50 |
3,083 | 29.400 | 0.100 | 8.23 | 3.70 | 9 | 0.079 | 3.68 | ||||||||
| 60 |
51,020 | 249.810 | 0.218 | 7.37 | 23.60 | 24 | 0.206 | 4.17 | ||||||||
| 70 |
581 | 4.580 | 0.028 | 7.35 | 0.70 | 4 | 0.021 | 3.71 | ||||||||
| 90 |
25,092 | 3,782.710 | 0.357 | 66.96 | 22.00 | 10 | 0.196 | 4.15 | ||||||||
| 95 |
10,818 | 86.940 | 0.572 | 4.04 | 26.00 | 9 | 0.545 | 3.17 | ||||||||
| 99 |
3,219 | 0.480 | 0.008 | 5.53 | 0.00 | 0 | 0.001 | 0.00 | ||||||||
Disintegration analysis uses a step function (the difference between adjacent samples sorted by grade) to denote the changes in an ordered data set and provides a degree of resolution on the plots to identify the population breaks that can be used for capping. It also provides an overall view of the continuity of the grade data set.
Figure 14-3 and Figure 14-4 illustrate the disintegration analysis for the Deformation Zone and Main Zone, respectively.
| Fenn-Gib Project |
Page 115 | |
| NI 43-101 Technical Report and Pre-Feasibility Study |
December 19, 2025 | |
|
|
| Figure 14-3: | Log Probability Plot, Deformation Zone (Au g/t) |
Source: TMAC, 2024
| Fenn-Gib Project |
Page 116 | |
| NI 43-101 Technical Report and Pre-Feasibility Study |
December 19, 2025 | |
|
|
| Figure 14-4: | Log Probability Plot, Main Zone (Au g/t) |
Source: TMAC, 2024
| Fenn-Gib Project |
Page 117 | |
| NI 43-101 Technical Report and Pre-Feasibility Study |
December 19, 2025 | |
|
|
| 14.8 | Composites |
For purposes of normalizing the assay data for further analysis, both raw and capped assay values were composited to 1.5 m intervals starting from the top of each drill hole. Unassayed intervals were assigned a grade of 0.0 g/t Au. The resulting composite values were then categorized using the majority domain code. Figure 14-5 presents a boxplot illustrating the distribution of capped grades-by domain code.
| Figure 14-5: | 1.5 m Composites Reported by Domain Code, Capped Au (g/t) |
Source: TMAC, 2024
To support model validation, 5 m composites were created for use with the nearest-neighbour (NN) grade interpolation. Figure 14-6 illustrates the grade distribution for the 5 m composites.
| Fenn-Gib Project |
Page 118 | |
| NI 43-101 Technical Report and Pre-Feasibility Study |
December 19, 2025 | |
|
|
| Figure 14-6: | 5 m Composites Reported by Domain Code, Capped Au (g/t) |
Source: TMAC, 2025
| 14.9 | Variography |
Geostatisticians use a variety of tools to analyze and characterize the spatial relationships between data points, particularly how variables relate to each other across different distances (lags) and directions. One of these is the correlogram, which measures the correlation between data values as a function of their separation distance and direction. If we compare samples that are close together, it is common to observe that their values are quite similar and the correlation coefficient for closely spaced samples is near 1.0. As the separation between samples increases, there is likely to be less similarity in the values, and the correlogram tends to decrease toward 0.0. The distance at which the correlogram reaches zero is called the range of correlation, or simply the range. The range of the correlogram corresponds roughly to the more-qualitative notion of the range of influence of a sample; it is the distance over which sample values show some persistence or correlation. The shape of the correlogram describes the pattern of spatial continuity. A very rapid decrease near the origin is indicative of short-scale variability. A more gradual decrease moving away from the origin suggests more short-scale continuity. A plot of “1-correlation” is made so the result looks like the more-familiar variogram plot.
| Fenn-Gib Project |
Page 119 | |
| NI 43-101 Technical Report and Pre-Feasibility Study |
December 19, 2025 | |
|
|
The approach used to develop the variogram models employed SAGE2001 software. Directional sample correlograms were calculated along horizontal azimuths of 0, 30, 60, 120, 150, 180, 210, 240, 270, 300, and 330 degrees. For each azimuth, sample correlograms were also calculated at dips of 30 and 60 degrees in addition to the horizontal (dip 0 degrees). Lastly, a correlogram was calculated for the vertical (dip 90 degrees). Using the 37 sample correlograms, an algorithm determined the best-fit model nugget effect and two-nested structure variance contributions. After fitting the variance parameters, the algorithm then fitted an ellipsoid to the 37 ranges from the directional models for each structure. The anisotropy of the correlation was given by the range along the major, semi-major, and minor axes of the ellipsoids, and the orientations of these axes for each structure. The QP reviewed the fitted variogram and adjusted to reflect the mineralization.
Table 14-4 presents the correlogram parameters for the Project by domain codes.
The rotation convention for the search anisotropy is ZXY:
| | Rotation about Z-axis-left-hand rule (clockwise rotation positive). |
| | Rotation about new X-axis-right-hand rule (anti-clockwise rotation positive). |
| | Rotation about new Y-axis-right-hand rule (anti-clockwise rotation positive). |
| Fenn-Gib Project |
Page 120 | |
| NI 43-101 Technical Report and Pre-Feasibility Study |
December 19, 2025 | |
|
|
| Table 14-4: | Correlogram Parameters |
| Domain |
Type |
C0 |
Structure 1 (C1): SPHERICAL |
Structure 2 (C2): SPHERICAL | ||||||||||||||||||||||||||||
| C1 |
Rot Z |
Rot X |
Rot Y |
Range X |
Range Y |
Range Z |
C2 |
Rot Z |
Rot X |
Rot Y |
Range X |
Range Y |
Range Z | |||||||||||||||||||
| 10 MV |
SPH | 0.45 | 0.45 | 85 | 2 | -22 | 11 | 22 | 11 | 0.10 | -72 | 44 | 32 | 45 | 95 | 150 | ||||||||||||||||
| 20 DZ |
SPH | 0.35 | 0.45 | 70 | 2 | 10 | 15 | 20 | 15 | 0.20 | -1 | -10 | -115 | 250 | 50 | 150 | ||||||||||||||||
| 30 MZ |
SPH | 0.45 | 0.45 | -40 | -30 | 40 | 15 | 15 | 15 | 0.10 | -150 | 80 | -105 | 125 | 250 | 160 | ||||||||||||||||
| 40 PYX |
SPH | 0.10 | 0.85 | -40 | 40 | 40 | 15 | 20 | 10 | 0.05 | 45 | 55 | 35 | 225 | 250 | 100 | ||||||||||||||||
| 50 UMV |
SPH | 0.35 | 0.40 | -65 | 95 | -15 | 15 | 20 | 20 | 0.25 | -75 | 40 | -30 | 50 | 190 | 90 | ||||||||||||||||
| 60 SEDS |
SPH | 0.30 | 0.65 | -25 | 30 | -10 | 25 | 25 | 15 | 0.05 | 60 | 35 | -30 | 115 | 160 | 250 | ||||||||||||||||
| 90 FWZ LG |
SPH | 0.20 | 0.70 | 15 | -50 | 25 | 10 | 10 | 15 | 0.10 | 30 | 0 | 0 | 60 | 150 | 50 | ||||||||||||||||
| 95 FWZ HG |
SPH | 0.10 | 0.80 | -50 | 55 | 80 | 20 | 20 | 25 | 0.10 | -50 | 120 | 75 | 90 | 105 | 125 | ||||||||||||||||
| Fenn-Gib Project |
Page 121 | |
| NI 43-101 Technical Report and Pre-Feasibility Study |
December 19, 2025 | |
|
|
| 14.10 | Block Model Definition |
The block model matrix was designed to capture the geometry of the deposit, characterized by narrow zones of mineralization within the broader lithology, drill data-density, and the selective mining unit (SMU). No rotation was applied to the block models. Table 14-5 summarizes the block model workspace for the Project.
| Table 14-5: | Block Model Workspace |
| Description |
Parameter | |
| Easting |
556,950 m | |
| Northing |
5,374,550 m | |
| Maximum Elevation |
5,400 m | |
| Rotation Angle |
No rotation | |
| Block Size-X, Y, Z |
5 x 5 x 5 m | |
| Number of Blocks in the X Direction |
640 | |
| Number of Blocks in the Y Direction |
390 | |
| Number of Blocks in the Z Direction |
180 |
| 14.11 | Estimation and Interpolation Methods |
The Fenn-Gib block model was estimated using three interpolation methods: nearest neighbor (NN), inverse distance weighting squared (IDW2) and ordinary kriging (OK). Uncapped and capped gold grades were estimated for the OK model. Only capped gold grades were estimated for the NN and IDW2 models.
Table 14-6. provides a comprehensive overview of the interpolation parameters and search ellipses used for NN, IDW2, and OK interpolation methods. All blocks were estimated using a single interpolation pass.
| Table 14-6: | Interpolation Parameters by Domain Code |
| Block Model |
Parameters | |||||||||||||||||||||
| Code |
Grade |
Min # Comp. |
Max # Comp. |
Max #/DH |
Rot Z (o) |
Rot X (o) |
Rot Y (o)’ |
Major (m) |
Minor (m) |
Vertical (m) | ||||||||||||
| 10 | AUC | 1 | 1 | 1 | 90 | 0 | 0 | 150 | 100 | 100 | ||||||||||||
| 20 | AUC | — | — | — | 95 | 0 | 0 | 250 | 150 | 150 | ||||||||||||
| 30 | AUC | — | — | — | 90 | 0 | 0 | 250 | 150 | 150 | ||||||||||||
| AUCNN | 40 | AUC | — | — | — | 90 | 0 | 0 | 250 | 200 | 150 | |||||||||||
| 50 | AUC | — | — | — | 110 | 0 | 0 | 200 | 100 | 100 | ||||||||||||
| 60 | AUC | — | — | — | 90 | 0 | 0 | 250 | 150 | 150 | ||||||||||||
| 90 | AUC | — | — | — | 35 | 0 | 0 | 150 | 100 | 100 | ||||||||||||
| 95 | AUC | — | — | — | 35 | 0 | 0 | 125 | 100 | 100 | ||||||||||||
| Fenn-Gib Project |
Page 122 | |
| NI 43-101 Technical Report and Pre-Feasibility Study |
December 19, 2025 | |
|
|
| Block Model |
Parameters | |||||||||||||||||||||
| Code |
Grade |
Min # Comp. |
Max # Comp. |
Max #/DH |
Rot Z (o) |
Rot X (o) |
Rot Y (o)’ |
Major (m) |
Minor (m) |
Vertical (m) | ||||||||||||
| 10 | AUC | 3 | 12 | 4 | 90 | 0 | 0 | 150 | 100 | 100 | ||||||||||||
| 20 | AUC | — | — | — | 95 | 0 | 0 | 250 | 150 | 150 | ||||||||||||
| 30 | AUC | — | — | — | 90 | 0 | 0 | 250 | 150 | 150 | ||||||||||||
| AUCID |
40 | AUC | — | — | — | 90 | 0 | 0 | 250 | 200 | 150 | |||||||||||
| 50 | AUC | — | — | — | 110 | 0 | 0 | 200 | 100 | 100 | ||||||||||||
| 60 | AUC | — | — | — | 90 | 0 | 0 | 250 | 150 | 150 | ||||||||||||
| 90 | AUC | — | — | — | 35 | 0 | 0 | 150 | 100 | 100 | ||||||||||||
| 95 | AUC | — | — | — | 35 | 0 | 0 | 125 | 100 | 100 | ||||||||||||
| 10 | AUC | 3 | 12 | 4 | 90 | 0 | 0 | 150 | 100 | 100 | ||||||||||||
| 20 | AUC | — | — | — | 95 | 0 | 0 | 250 | 150 | 150 | ||||||||||||
| 30 | AUC | — | — | — | 90 | 0 | 0 | 250 | 150 | 150 | ||||||||||||
| AUCOK |
40 | AUC | — | — | — | 90 | 0 | 0 | 250 | 200 | 150 | |||||||||||
| 50 | AUC | — | — | — | 110 | 0 | 0 | 200 | 100 | 100 | ||||||||||||
| 60 | AUC | — | — | — | 90 | 0 | 0 | 250 | 150 | 150 | ||||||||||||
| 90 | AUC | — | — | — | 35 | 0 | 0 | 150 | 100 | 100 | ||||||||||||
| 95 | AUC | — | — | — | 35 | 0 | 0 | 125 | 100 | 100 | ||||||||||||
| 10 | AU | 3 | 12 | 4 | 90 | 0 | 0 | 150 | 100 | 100 | ||||||||||||
| 20 | AU | — | — | — | 95 | 0 | 0 | 250 | 150 | 150 | ||||||||||||
| 30 | AU | — | — | — | 90 | 0 | 0 | 250 | 150 | 150 | ||||||||||||
| AUOK |
40 | AU | — | — | — | 90 | 0 | 0 | 250 | 200 | 150 | |||||||||||
| 50 | AU | — | — | — | 110 | 0 | 0 | 200 | 100 | 100 | ||||||||||||
| 60 | AU | — | — | — | 90 | 0 | 0 | 250 | 150 | 150 | ||||||||||||
| 90 | AU | — | — | — | 35 | 0 | 0 | 150 | 100 | 100 | ||||||||||||
| 95 | AU | — | — | — | 35 | 0 | 0 | 125 | 100 | 100 | ||||||||||||
Note: AU = uncapped Au g/t; AUC = capped Au g/t; Rot = rotation around axis
Additional interpolation characteristics (Table 14-7) were stored for use in validation and resource classification.
| Table 14-7: | Special Models |
| Method |
Special Model |
Description | ||
| NN | DSTNN | Distance to nearest sample used | ||
| ID | DSTID | Distance to nearest sample used | ||
| OK | DSTOK | Distance to nearest sample used | ||
| OK | NDDH | Number of drill holes used | ||
| OK | NSOK | Number of composites used | ||
| OK | KV | Kriging variance | ||
| OK | NSEC | Number of sectors | ||
| OK | DSTAV | Average distance of composites used | ||
| Fenn-Gib Project |
Page 123 | |
| NI 43-101 Technical Report and Pre-Feasibility Study |
December 19, 2025 | |
|
|
| 14.12 | Block Model Validation |
For quality assurance, both verification and validation of the block model, defined as follows:
| | Verification is a manual check (i.e., visual inspection) or quasi-manual check (i.e., spreadsheet) of the actual procedure used. |
| | Validation is a test for reasonableness using a parallel procedure, which may be manual or computer-based (i.e., different interpolation methods). |
| 14.12.1 | Visual Verification |
Visual inspection of the block model results, both in section and plan view, demonstrated correlation with the drill-hole composite data. As shown in Figure 14-7 (plan view) and Figure 14-8 (section view), the interpolated block grades align well with the composite data, confirming the model’s reliability.
| Fenn-Gib Project |
Page 124 | |
| NI 43-101 Technical Report and Pre-Feasibility Study |
December 19, 2025 | |
|
|
| Figure 14-7: | 5180 Elevation, Composites versus Block Model (Capped Au g/t) |
Source: TMAC, 2024
| Fenn-Gib Project |
Page 125 | |
| NI 43-101 Technical Report and Pre-Feasibility Study |
December 19, 2025 | |
|
|
| Figure 14-8: | East 558500, Composites versus Block Model (Capped Au g/t) |
Source: TMAC, 2024
| 14.12.2 | Statistical Validation |
Statistical review of the block model across all domains demonstrated consistency between the different interpolation methods and the composite grades. Table 14-8 presents the grades for each of the different interpolation methods. While minor variations exist between methods, these are primarily attributed to data density and statistics generated by block count rather than tonnage-weighted calculations-all within expected parameters for this type of interpolation method.
| Table 14-8: | Grade Comparison by Interpolation Method |
| Block Model |
Code |
Count |
Min |
Max |
Mean |
Variance |
SD |
CV | ||||||||
| AUCNN | 10 | 2,240,282 | 0.001 | 5.855 | 0.075 | 0.05 | 0.232 | 3.07 | ||||||||
| AUCNN | 20 | 632,103 | 0.001 | 10.527 | 0.355 | 0.38 | 0.620 | 1.75 | ||||||||
| AUCNN | 30 | 300,033 | 0.001 | 26.430 | 0.518 | 0.64 | 0.803 | 1.55 | ||||||||
| AUCNN | 40 | 546,271 | 0.001 | 9.435 | 0.158 | 0.21 | 0.462 | 2.92 | ||||||||
| AUCNN | 50 | 132,556 | 0.001 | 1.649 | 0.099 | 0.04 | 0.199 | 2.02 |
| Fenn-Gib Project |
Page 126 | |
| NI 43-101 Technical Report and Pre-Feasibility Study |
December 19, 2025 | |
|
|
| Block Model |
Code |
Count |
Min |
Max |
Mean |
Variance |
SD |
CV | ||||||||
| AUCNN | 60 | 2,133,135 | 0.001 | 13.291 | 0.157 | 0.09 | 0.305 | 1.94 | ||||||||
| AUCNN | 90 | 344,172 | 0.001 | 11.914 | 0.175 | 0.19 | 0.433 | 2.48 | ||||||||
| AUCNN | 95 | 84,624 | 0.001 | 11.029 | 0.473 | 1.05 | 1.024 | 2.16 | ||||||||
| AUCID | 10 | 2,946,264 | 0 | 6.500 | 0.100 | 0.02 | 0.100 | 2.41 | ||||||||
| AUCID | 20 | 658,232 | 0 | 12.200 | 0.300 | 0.22 | 0.500 | 1.38 | ||||||||
| AUCID | 30 | 305,769 | 0 | 18.700 | 0.500 | 0.37 | 0.600 | 1.20 | ||||||||
| AUCID | 40 | 638,918 | 0 | 24.100 | 0.100 | 0.12 | 0.300 | 2.38 | ||||||||
| AUCID | 50 | 160,376 | 0 | 1.900 | 0.100 | 0.02 | 0.100 | 1.65 | ||||||||
| AUCID | 60 | 2,780,865 | 0 | 14.200 | 0.100 | 0.06 | 0.200 | 1.90 | ||||||||
| AUCID | 90 | 432,499 | 0 | 10.300 | 0.100 | 0.07 | 0.300 | 1.86 | ||||||||
| AUCID | 95 | 105,199 | 0 | 11.100 | 0.400 | 0.50 | 0.700 | 1.78 | ||||||||
| AUCOK | 10 | 3,277,877 | 0.001 | 4.550 | 0.054 | 0.01 | 0.118 | 2.18 | ||||||||
| AUCOK | 20 | 662,955 | 0.001 | 10.397 | 0.358 | 0.19 | 0.437 | 1.22 | ||||||||
| AUCOK | 30 | 305,807 | 0.002 | 11.426 | 0.511 | 0.26 | 0.509 | 1.00 | ||||||||
| AUCOK | 40 | 642,322 | 0.001 | 8.479 | 0.145 | 0.07 | 0.271 | 1.87 | ||||||||
| AUCOK | 50 | 175,981 | 0.001 | 1.421 | 0.092 | 0.02 | 0.144 | 1.56 | ||||||||
| AUCOK | 60 | 2,953,290 | 0.001 | 11.783 | 0.128 | 0.05 | 0.233 | 1.81 | ||||||||
| AUCOK | 90 | 446,574 | 0.001 | 7.089 | 0.140 | 0.05 | 0.214 | 1.52 | ||||||||
| AUCOK | 95 | 106,186 | 0.001 | 10.218 | 0.396 | 0.36 | 0.604 | 1.52 |
| 14.12.3 | Swath Plots |
Validation of the resource estimation included comprehensive swath plot analysis comparing gold grades across multiple interpolation methods (NN, IDW2, and OK) against composite grades. As shown in Figure 14-9 and Figure 14-10, there is a strong correlation between composite and block model grades for all interpolation methods, demonstrating the robustness of the grade estimation.
| Fenn-Gib Project |
Page 127 | |
| NI 43-101 Technical Report and Pre-Feasibility Study |
December 19, 2025 | |
|
|
| Figure 14-9: | Swath Plot of NN and OK Mean Block Model Gold Grades with Mean Composite Gold Grade (g/t) |
Source: TMAC, 2024
| Fenn-Gib Project |
Page 128 | |
| NI 43-101 Technical Report and Pre-Feasibility Study |
December 19, 2025 | |
|
|
| Figure 14-10: | Swath Plot of IDW2 and OK Mean Block Model Gold Grades with Mean Composite Gold Grade (g/t) |
Source: TMAC, 2024
| 14.13 | Classification of Mineral Resources |
Mineral resources were estimated in accordance with the CIM Definition Standards and CIM Estimation of Mineral Resources and Mineral Reserves Best Practice Guidelines (CIM, 2019). Mineral resources are not mineral reserves and do not have demonstrated economic viability.
The mineral resource classification method followed a rigorous, multi-step approach. Initial classification was based on data density and mineralization continuity, followed by refinement using interpolation statistics and geological continuity assessment. To ensure classification coherence, a grooming algorithm was applied to address isolated blocks.
| Fenn-Gib Project |
Page 129 | |
| NI 43-101 Technical Report and Pre-Feasibility Study |
December 19, 2025 | |
|
|
The nominal spacing for the indicated MREs, based on distance to nearest composite, was 32 m. For inferred MREs, the nominal spacing was 108 m, constrained within a maximum distance of 250 m. No measured mineral resource was defined for the Project.
Table 14-7 summarizes interpolation characteristics stored in the special models.
| 14.14 | Reasonable Prospects for Eventual Economic Extraction |
The cut-off grade used for the MREs is 0.3 g/t Au based on the assumptions outlined in Table 14-9. MREs can be sensitive to the reporting cut-off grade used. To satisfy reasonable prospects for eventual economic extraction, a conceptual constraining resource pit shell was defined using a 50° pit slope based on the assumptions listed in Table 14-9.
| Table 14-9: | Pit Design Criteria |
| Parameter |
Unit |
Assumption | ||
| Gold Price |
US$/oz Au | 2,000 | ||
| Exchange Rate |
C$:US$ | 0.77 | ||
| Payable Metal |
% | 100.00 | ||
| TC/RC/Transport |
C$/oz Au | 6.50 | ||
| Net Gold Price |
C$/oz Au | 2,590 | ||
| Net Gold Price |
C$/g | 83.30 | ||
| OPEX Estimates | ||||
| OP Mining Cost |
C$/t mined | 3.25 | ||
| OP Ore Mining Cost |
C$/t ore mined | 3.25 | ||
| Process Cost |
C$/t processed | 15.50 | ||
| G&A |
C$/t processed | 2.00 | ||
| Recovery and Dilution | ||||
| External Mining Dilution |
% | 0 | ||
| Mining Recovery |
% | 100 | ||
| Process Recovery |
% | 94 | ||
| Other | ||||
| Pit Slope in Rock |
degrees | 50 | ||
| Cut-Off Grade (COG) | ||||
| Reporting COG |
g/t | 0.30 | ||
| Resource Class |
MII | |||
Notes: G&A = general and administrative; OB = overburden; OP = open pit OPEX = operating expenditure; RC = refining costs; TC = treatment costs
| Fenn-Gib Project |
Page 130 | |
| NI 43-101 Technical Report and Pre-Feasibility Study |
December 19, 2025 | |
|
|
| 14.15 | Mineral Resource Statement |
The Project hosts mineral resources at a 0.3 g/t Au cut-off grade comprised of an indicated resource of 181.3 Mt grading 0.74 g/t Au for 4.3 million contained gold ounces plus an additional inferred resource of 8.9 Mt at 0.49 g/t Au containing 141,000 gold ounces. Table 14-10 presents the MRE categorized by resource classification, effective date of September 3, 2024, and reported within a constraining resource pit shell. Mineral resources that are not mineral reserves do not have demonstrated economic viability.
Table 14-10: Mineral Resource Table
| Resource Category |
Cut-Off (Au g/t) |
Tonnes | Au (g/t) |
Au (oz) |
||||||||||||
| Indicated |
0.3 | 181,302,000 | 0.74 | 4,313,000 | ||||||||||||
| Inferred |
0.3 | 8,921,000 | 0.49 | 141,000 | ||||||||||||
Notes:
| 1. | Effective date of this updated MRE is September 3, 2024. The assay cut-off date for drill holes included in the mineral resource was April 30, 2024. |
| 2. | All mineral resources have been estimated in accordance with the CIM Definitions Standards (CIM, 2014), as required under National Instrument (NI) 43-101. Mineral resource statement prepared by QP Tim Maunula, P.Geo. (TMAC) in accordance with NI 43-101. |
| 3. | Mineral resources reported demonstrate reasonable prospect of eventual economic extraction, as required under NI 43-101. Mineral resources are not mineral reserves and do not have demonstrated economic viability. The mineral resources may be materially affected by environmental, permitting, legal, marketing, and other relevant issues. |
| 4. | Mineral resources are reported at a cut-off grade of 0.30 g/t Au for an open-pit mining scenario using a 50° pit slope angle. Cut-off grades are based on a price of US$2,000/oz gold, and an open pit mining cost of $3.25/t, process cost of $15.50/t and G&A $2.00/t. Metallurgical recovery of 94% was used. Densities were assigned based on interpreted lithology. |
| 5. | Troy ounce = tonnes x grade/31.10348. All numbers have been rounded to reflect the relative accuracy of the estimate. |
| 6. | The quantity and grade of reported inferred resources are uncertain in nature and there has not been sufficient work to define these inferred resources as indicated or measured resources. It is reasonably expected that many of the inferred mineral resources could be upgraded to indicated mineral resources with continued exploration. |
| 7. | Tonnages and ounces in the tables are rounded to the nearest thousand. Numbers may not total due to rounding. |
| 14.16 | Factors That May Affect the Mineral Resource Estimate |
Factors that may affect the MRE include the following:
| | Metal price and exchange rate assumptions. |
| | Changes to the assumptions used to generate the gold cut-off grade. |
| | Changes in local interpretations of mineralization geometry and continuity of mineralized zones. |
| | Changes to geological interpretation and geological and grade continuity assumptions. |
| | Density and domain assignments. |
| | Changes to geotechnical, mining, and metallurgical recovery assumptions. |
| Fenn-Gib Project |
Page 131 | |
| NI 43-101 Technical Report and Pre-Feasibility Study |
December 19, 2025 | |
|
|
| | Change to the input and design parameter assumptions that pertain to the conceptual pit constraining the MRE. |
| | Assumptions as to the continued ability to access the site, retain mineral and surface rights titles, maintain environment and other regulatory permits, and maintain the social license to operate. |
There are no other known environmental, legal, title, taxation, socio-economic, marketing, political, or other relevant factors that would materially affect the estimation of mineral resources that are not discussed in this technical report.
| Fenn-Gib Project |
Page 132 | |
| NI 43-101 Technical Report and Pre-Feasibility Study |
December 19, 2025 | |
|
|
| 15 | MINERAL RESERVE ESTIMATES |
| 15.1 | Summary |
The Project is planned as an open pit operation using conventional mining equipment. All estimates are based on the mine plans prepared by AGP for the PFS.
Operating and capital costs over the life of the project have been developed from first principles cost build-ups, incorporating the most current vendor quotations for consumables and capital items, primarily sourced from local suppliers.
Mineral reserves for the Project are derived from the conversion of the indicated mineral resources included in the study mine plan and contained within the ultimate open pit limits. No measured mineral resources occur within the ultimate pit design. The drill-hole data density and the level of confidence in the assumptions applied in the mine planning process provide reasonable support for the direct conversion of Indicated mineral resources to probable mineral reserves.
The total mineral reserve for the Project is shown in Table 15-1.
Table 15-1: Fenn-Gib Proven and Probable Mineral Reserves – December 19, 2025
| Process Feed | Grade | Contained Gold | ||||||||||
| Reserve Class |
(Mt) | Au (g/t) | Moz | |||||||||
| Proven |
— | — | — | |||||||||
| Probable |
25.13 | 1.29 | 1.04 | |||||||||
|
|
|
|
|
|
|
|||||||
| Total Reserves |
25.13 | 1.29 | 1.04 | |||||||||
|
|
|
|
|
|
|
|||||||
Note:
| 1. | This mineral reserve estimate has an effective date of December 19, 2025. |
| 2. | The mineral reserve estimation was completed under the supervision of Gordon Zurowski, P.Eng. of AGP Mining Consultants Inc., who is a QP as defined under NI 43-101. |
| 3. | Mineral reserves are stated within the ultimate design pit based on: |
| a. | US$1,750/ounce gold price |
| b. | Pit Limit corresponds to a pit shell with a revenue factor of 0.55, corresponding to a US$962 /ounce gold price. |
| c. | An elevated cut-off grade of 0.80 g/t Au for all pit phases. |
| d. | Preliminary mining cost assumptions of C$3.24/tonne mined of waste, C$3.23/tonne mined of ore, with an incremental mining cost of C$0.02/tonne/5 m bench mined below the 5,310 m elevation. |
| e. | Preliminary processing cost assumptions of C$14.50/tonne processed, general & administration assumption of C$2.10/tonne processed, and stockpile rehandle cost assumption of C$1.00/tonne processed. |
| f. | Preliminary process recovery assumptions of 92.6% for gold. |
| g. | An exchange rate of C$1.35 equal to US$1.00. |
| h. | The preliminary economic, cost and recovery assumptions used at the time of mine planning and reserve estimation may not necessarily conform to those stated in the economic model. |
| 4. | Pit slope inter-ramp slope angle assumptions ranged from 28 - 65° and overall slope angles ranging from 21 - 51°. |
| Fenn-Gib Project |
Page 133 | |
| NI 43-101 Technical Report and Pre-Feasibility Study |
December 19, 2025 | |
|
|
The QP has not identified any known legal, political, environmental, or other factors that would materially affect the potential development of mineral reserves.
Technical risks identified that could potentially impact the mineral reserves include mining selectivity near the ore-waste contacts, pit slope stability, and the assumed metallurgical recoveries for given rock types. These risks are considered manageable and are expected to be mitigated through additional test work and the application of operating experience as the project advances.
| 15.2 | Key Assumptions/Basis of Estimate |
The parameters used for the estimate are shown in Table 15-2.
Table 15-2: Pit Optimization – General Parameters
| Parameter |
Unit | Value | ||||||
| Metal Price Calculation |
| |||||||
| Exchange Rate |
C$:US$ | 1.35 | ||||||
| Metal Price – Au |
US$/oz | 1,750 | ||||||
| Royalty – Au |
% | 1.0 | ||||||
| Payable |
% | 99.0 | ||||||
| Refining |
US$/oz | 0.40 | ||||||
| Transportation |
US$/oz | 5.00 | ||||||
| Dore Metal Value |
US$/oz | 1,727.10 | ||||||
| Royalty |
US$/oz | 17.27 | ||||||
| Value after Royalty |
US$/oz | 1,709.83 | ||||||
| US$/g | 54.97 | |||||||
| $/g | 74.21 | |||||||
| Cost basis |
||||||||
| Mining | ||||||||
| Base Elevation (5000m + UTM elev.) |
Mine grid elevation (m) | 5310 | ||||||
| Ore Mining – Base |
$/t mined | 3.23 | ||||||
| Waste Mining – Base |
$/t mined | 3.24 | ||||||
| Incremental Mining Cost below Base |
$/t mined /5m vertical | |||||||
| Ore Mining |
$/t mined | 0.020 | ||||||
| Waste Mining |
$/t mined | 0.023 | ||||||
| Rehandle Cost |
$/t mined | 1.00 | ||||||
| Processing and G&A |
||||||||
| Processing Cost |
$/t processed | 14.50 | ||||||
| G&A |
$/t processed | 2.10 | ||||||
| Recoveries |
||||||||
| Fenn-Gib Project |
Page 134 | |
| NI 43-101 Technical Report and Pre-Feasibility Study |
December 19, 2025 | |
|
|
| Parameter |
Unit | Value | ||
| Metallurgical Recovery - Au |
% | 92.6 | ||
| Cut-Off Grades |
||||
| Marginal Cut-off |
Au g/t | 0.24 | ||
| Marginal Cut-off (with rehandle) |
Au g/t | 0.26 | ||
| Mine Schedule-Elevated Cut-off |
Au g/t | 0.80 | ||
| Overall Slope Angles |
||||
| Overburden – all sectors |
degree | 21 | ||
| Sector 1 |
degree | 47 | ||
| Sector 2 |
degree | 47 | ||
| Sector 3 |
degree | 42 | ||
| Sector 4 |
degree | 46 | ||
| Sector 5 |
degree | 51 | ||
| Sector 6 |
degree | 51 | ||
| Sector 7 |
degree | 48 | ||
| Sector 8 |
degree | 40 | ||
| Sector 9 |
degree | 49 | ||
| Boundary Constraints |
||||
| Physical Constraints on pit expansion |
Distance from waterbody | 100 m |
The mining cost estimates are based on the use of 91-tonne class trucks using a preliminary mine design to determine incremental hauls for mineralized material and waste.
The determination of the ore and waste for the Project was defined by elevated gold cutoff to maximize project value.
| 15.3 | Pit Slopes |
Wall slopes for pit optimization were based on provided (InnovExplo, 2023) geotechnical recommendations with the addition of estimated overburden slope angles. Inter-ramp angles varied from 27.8 degrees in overburden and 50 to 65 degrees in rock beneath the overburden. With the inclusion of haul roads and potential geotechnical berms the overall slope angles varied from 21 degrees in overburden to 40 to 51 degrees in the rock.
A total of nine difference sectors were used in the pit slope designs. This is discussed in more detail in Section 16.2.
| 15.4 | Pit Optimization |
A pit limit analysis was conducted to determine the intermediate and final mining limits as well as to understand the sensitivity of these limits to changes in metal prices. The resulting pit shells were used to determine areas of the deposit with the most profitable extraction limits and identify the geometry of the proposed open pit. Inputs for the analysis were confirmed at an early stage of the process to produce a set of nested Lerchs-Grossman (LG) shells which guided the mine design process. A mining sequence (internal pit phases) was determined, focusing on how the intermediate pits would potentially interact and how ore will be operationally accessed.
| Fenn-Gib Project |
Page 135 | |
| NI 43-101 Technical Report and Pre-Feasibility Study |
December 19, 2025 | |
|
|
Within the selected ultimate pit shells, the routine was again run but instead of using Lerchs-Grossman, the older Floating Cone (FC) algorithm was used. The reason behind this was to develop pits with workable bases. The Floating Cone allows a user base specified width (in this case 30 m) to see the impact on the sequencing. As the ultimate pit was not anticipated to be used, this provided greater focus on phase geometry and the economics of each phase and was compared to the LG pit shells visually for any significant changes. This method allows a more practical look at mining value in a pit shell as the LG shells typically have extra value in the bottom of a not practical shape.
As a starting point, a series of nested pit shells was generated using a reference base gold price (RF=1) of US$1,750/oz, with revenue factors ranging from 0.20 to 1.00 in steps of 0.05. This analysis was undertaken to determine the optimal pit limits at the project specified reserves price. Overall slope angles were selected to account for the anticipated inclusion of haul ramps within the pit walls. Pit sectors shown in Table 15-2 were applied in the development of pit wall geometries In addition, a number of strategic scenarios were evaluated based on the preliminary nested pit shells, incorporating variations in selected economic inputs, to guide the selection of the optimal pit size. The pit shell corresponding to an RF of 0.55 (equal to a gold price of US$962/oz) was selected for the PFS pit design and mine planning.
| 15.5 | Mine Dilution |
The mining strategy assumes a skin for dilution of 0.75 m on average for a 5 m bench height in ore zones. An AGP in-house routine was applied to determine the diluted density and diluted metal grades for all blocks in the model. The resulting dilution increases the tonnage by 1.8% and lowers the grade by 1.4%.
| 15.6 | Pit Design |
Based on the pit optimization outcomes and to support practical access to mineralized areas, a set of pit designs were outlined using the selected ultimate pit limit (RF = 0.55) as the basis for sequencing the intermediate mining phases from the higher value pit shells in the center and radiating outwards to the ultimate pit limit. Recommendations for slopes by the geotechnical team were applied to all intermediate pit phase designs.
The proposed preliminary ultimate pit design and intermediate mining phases are shown in Figure 15-1 and Figure 15-2.
| Fenn-Gib Project |
Page 136 | |
| NI 43-101 Technical Report and Pre-Feasibility Study |
December 19, 2025 | |
|
|
Figure 15-1: Fenn-Gib Ultimate Pit Design with Phases
Source: AGP, 2025
| Fenn-Gib Project |
Page 137 | |
| NI 43-101 Technical Report and Pre-Feasibility Study |
December 19, 2025 | |
|
|
Figure 15-2: Ultimate and Intermediate Pit Phase Limits (Representative Cross-section) 7h
Source: AGP, 2025
| 15.7 | Mine Plan |
The selected mine schedule plans to deliver 25.1 Mt of ore grading 1.29 g/t Au for contained gold ounces of 1.04 Moz, over a mine life of 14.5 years. Mineral reserves include no proven ore, only probable ore.
The total waste tonnage in the reserves mine plan is 151.9 Mt and will be delivered to either the TSF for construction of that facility or to the mine rock storage area (MRSA). The overall waste-to-ore strip ratio is 6.0:1. See Figure 15-3 and Table 15-3 for the yearly distribution of ore tonnes in the reserves mine plan.
| Fenn-Gib Project |
Page 138 | |
| NI 43-101 Technical Report and Pre-Feasibility Study |
December 19, 2025 | |
|
|
Figure 15-3: Fenn-Gib Mine Schedule
Source: AGP, 2025
| Fenn-Gib Project |
Page 139 | |
| NI 43-101 Technical Report and Pre-Feasibility Study |
December 19, 2025 | |
|
|
Table 15-3: Production Schedule – Proven and Probable Mineral Reserves
| Description |
Pre- production |
Y1 | Y2 | Y3 | Y4 | Y5 | Y6 | Y7 | Y8 | Y9 | Y10 | Y11 | Y12 | Y13 | Y14 | Y15 | Total | |||||||||||||||||||||||||||||||||||||||||||||||||||||
| Mill Feed |
Ore (Mt) | — | 1.45 | 1.75 | 1.75 | 1.75 | 1.75 | 1.75 | 1.75 | 1.75 | 1.75 | 1.75 | 1.75 | 1.75 | 1.75 | 1.75 | 0.91 | 25.13 | ||||||||||||||||||||||||||||||||||||||||||||||||||||
| Au (g/t) | — | 1.44 | 1.65 | 1.40 | 1.39 | 1.46 | 1.49 | 1.18 | 1.10 | 1.07 | 1.24 | 1.36 | 1.26 | 1.23 | 1.09 | 0.76 | 1.29 | |||||||||||||||||||||||||||||||||||||||||||||||||||||
| Mine Production |
Total Waste (Mt) | 6.21 | 8.55 | 12.25 | 12.25 | 12.25 | 13.25 | 14.25 | 14.25 | 14.25 | 14.25 | 10.03 | 8.81 | 5.12 | 3.39 | 2.44 | 0.32 | 151.87 | ||||||||||||||||||||||||||||||||||||||||||||||||||||
| Overburden (Mt) | 3.38 | 5.78 | 1.76 | 1.98 | 0.17 | 2.96 | 0.30 | — | — | — | — | — | — | — | — | — | 16.32 | |||||||||||||||||||||||||||||||||||||||||||||||||||||
| Rock (Mt) | 2.83 | 2.78 | 10.49 | 10.27 | 12.07 | 10.29 | 13.95 | 14.25 | 14.25 | 14.25 | 10.03 | 8.81 | 5.12 | 3.39 | 2.44 | 0.32 | 135.55 | |||||||||||||||||||||||||||||||||||||||||||||||||||||
| Mine to Mill (Mt) | — | 0.67 | 1.75 | 1.75 | 1.75 | 1.75 | 1.75 | 1.75 | 1.75 | 1.75 | 1.75 | 1.75 | 1.75 | 1.75 | 1.75 | 0.91 | 24.36 | |||||||||||||||||||||||||||||||||||||||||||||||||||||
| Au (g/t) | — | 1.51 | 1.65 | 1.40 | 1.39 | 1.46 | 1.49 | 1.18 | 1.10 | 1.07 | 1.24 | 1.36 | 1.26 | 1.23 | 1.09 | 0.76 | 1.29 | |||||||||||||||||||||||||||||||||||||||||||||||||||||
| Mine to Stockpile (Mt) | 0.77 | — | — | — | — | — | — | — | — | — | — | — | — | — | — | — | 0.77 | |||||||||||||||||||||||||||||||||||||||||||||||||||||
| Au (g/t) | 1.37 | — | — | — | — | — | — | — | — | — | — | — | — | — | — | — | 1.37 | |||||||||||||||||||||||||||||||||||||||||||||||||||||
| Stockpile to Mill (Mt) | — | 0.77 | — | — | — | — | — | — | — | — | — | — | — | — | — | — | 0.77 | |||||||||||||||||||||||||||||||||||||||||||||||||||||
| Au (g/t) | — | 1.37 | — | — | — | — | — | — | — | — | — | — | — | — | — | — | 1.37 | |||||||||||||||||||||||||||||||||||||||||||||||||||||
| Total Ore to Mill (Mt) | 1.45 | 1.75 | 1.75 | 1.75 | 1.75 | 1.75 | 1.75 | 1.75 | 1.75 | 1.75 | 1.75 | 1.75 | 1.75 | 1.75 | 0.91 | 25.13 | ||||||||||||||||||||||||||||||||||||||||||||||||||||||
| Au (g/t) | 1.44 | 1.65 | 1.40 | 1.39 | 1.46 | 1.49 | 1.18 | 1.10 | 1.07 | 1.24 | 1.36 | 1.26 | 1.23 | 1.09 | 0.76 | 1.29 | ||||||||||||||||||||||||||||||||||||||||||||||||||||||
| Strip Ratio (Waste: Ore) | — | 5.91 | 6.99 | 6.99 | 6.99 | 7.56 | 8.13 | 8.13 | 8.13 | 8.13 | 5.72 | 5.03 | 2.92 | 1.94 | 1.39 | 0.36 | 6.04 | |||||||||||||||||||||||||||||||||||||||||||||||||||||
Source: AGP, 2025
| Fenn-Gib Project |
Page 140 | |
| NI 43-101 Technical Report and Pre-Feasibility Study |
December 19, 2025 | |
|
|
| 15.8 | Mineral Reserves Statement |
The mineral reserves for the Project is based on the conversion of Indicated mineral resources in the PFS mine plan, and within the proposed ultimate open pit limits. The estimates were prepared under the supervision of Gordon Zurowski, P.Eng. of AGP, a QP as defined under NI 43-101.
The mineral reserves estimate is based on a design metal price of US$1,750/oz gold and is approximately 25.13 Mt of ore with a gold grade of 1.29 g/t for a contained 1.04 Moz of gold. Mineral reserves for the Project are shown in metric units in Table 15-4. This estimate has an effective date of December 19, 2025.
Table 15-4: Fenn-Gib Proven and Probable Mineral Reserves – December 19th, 2025
| Reserve Class |
Process Feed | Grade | Contained Gold | |||||||||
| (Mt) | Au (g/t) | Moz | ||||||||||
| Proven |
— | — | — | |||||||||
| Probable |
25.13 | 1.29 | 1.04 | |||||||||
|
|
|
|
|
|
|
|||||||
| Total Reserves |
25.13 | 1.29 | 1.04 | |||||||||
|
|
|
|
|
|
|
|||||||
Note:
| 1. | This mineral reserve estimate has an effective date of December 19, 2025. |
| 2. | The mineral reserve estimation was completed under the supervision of Gordon Zurowski, P.Eng. of AGP Mining Consultants Inc., who is a QP as defined under NI 43-101. |
| 3. | Mineral reserves are stated within the ultimate design pit based on: |
| a. | US$1,750/ounce gold price |
| b. | Pit Limit corresponds to a pit shell with a revenue factor of 0.55, corresponding to a US$962 /ounce gold price. |
| c. | An elevated cut-off grade of 0.80 g/t Au for all pit phases. |
| d. | Preliminary mining cost assumptions of C$3.24/tonne mined of waste, C$3.23/tonne mined of ore, with an incremental mining cost of C$0.02/tonne/5 m bench mined below the 5,310 m elevation. |
| e. | Preliminary processing cost assumptions of C$14.50/tonne processed, general & administration assumption of C$2.10/tonne processed, and stockpile rehandle cost assumption of C$1.00/tonne processed. |
| f. | Preliminary process recovery assumptions of 92.6% for gold. |
| g. | An exchange rate of C$1.35 equal to US$1.00. |
| h. | The preliminary economic, cost and recovery assumptions used at the time of mine planning and reserve estimation may not necessarily conform to those stated in the economic model. |
| 4. | Pit slope inter-ramp slope angle assumptions ranged from 28 - 65° and overall slope angles ranging from 21 - 51°. |
Mineral resources outside the pit limits are not considered in the mineral reserves statement. There is currently no plan to extend the mine operation using underground mining methods.
| Fenn-Gib Project |
Page 141 | |
| NI 43-101 Technical Report and Pre-Feasibility Study |
December 19, 2025 | |
|
|
| 15.9 | Factors that May Affect the Mineral Reserves |
The QP has not identified any known legal, political, environmental, or other factors that would materially affect the potential development of mineral reserves.
Technical risks identified that could potentially impact the mineral reserves include mining selectivity at the ore-waste contacts, pit slope stability, and the assumed metallurgical recoveries for the various rock types. These risks are considered manageable and are expected to be mitigated through additional test work and the application of operating experience as the project advances.
| Fenn-Gib Project |
Page 142 | |
| NI 43-101 Technical Report and Pre-Feasibility Study |
December 19, 2025 | |
|
|
| 16 | MINING METHODS |
| 16.1 | Summary |
The PFS mine plan is planned to be an open pit operation using conventional mining equipment. Given current metal prices, and considering the nature of the mineralization, grade tenor, grade distribution and proximity to surface, open pit mining represents the most reasonable development approach.
A large pit with three phases, together with two smaller satellite pits, will provide sufficient open pit feed to sustain a throughput of 4,800 t/d to the processing plant. The larger pit is designed to be mined in three phases. The open pits provide 25.1 Mt of mill feed grading 1.29 g/t Au for contained gold ounces of 1.04 Moz over a mine life of 14.5 years. Waste from this pit will total 151.9 Mt for a strip ratio of 6.0:1.0 (waste tonnes: mill feed tonnes).
The mill feed cut-off used is 0.80 g/t Au. High grade material encountered during pre-stripping operations will be stockpiled (0.8 Mt) and will be reclaimed in Year 1.
The pit phases are scheduled to provide an average of 4,800 t/d of feed to the mill over a 14.5-year mining life following one year of pre-production stripping. The pits are sequenced to minimize initial stripping and provide higher feed grades in the early years of the mine life while assisting in the construction of the tailings management facility.
The primary mining fleet will consist of three 165 mm down-the-hole drills, two 16 m3 diesel hydraulic shovels and one 13 m3 front-end loader. An additional 13 m3 front-end loader will be stationed at the crusher and may be redeployed to the pit as required. The haul truck fleet will be comprised of 92-tonne trucks which will also be used to deliver waste material for tailings facility construction. a smaller auxiliary fleet, consisting of two articulated trucks and two 63-tonne trucks, will support tailings facility maintenance and lift development. The standard complement of dozers, graders, small backhoes, and other ancillary support equipment has been included in the equipment cost estimate.
The pre-production period is the start of major mining activity using the mining equipment and will begin once the initial site infrastructure (roads, pads, and construction laydowns, etc.) is in place. The early mining phases are scheduled to deliver the highest -grade to the processing plant during the first six years of operation.
Waste material from the open pit will be used in the construction of the TSF with excess going into the various overburden stockpiles and mine rock storage area (MRSA). As the MRSA is progressively raised, side slopes will be regraded to enable concurrent reclamation and reduce the visual impact of the facility.
In addition to the main open pit, two satellite pits will be mined and later repurposed for water storage and diversion during the stages of the mine life. The Phase 1N pit will also supply rock material for various mine infrastructure, including haul roads and construction pads as required.
| Fenn-Gib Gold Project |
Page 143 | |
| NI 43-101 Technical Report and Pre-Feasibility Study |
December 19, 2025 | |
|
|
| 16.2 | Geotechnical and Hydrogeological Considerations used in Mine Planning |
| 16.2.1 | Geotechnical Considerations |
Mayfair Gold commissioned InnovExplo Inc. (InnovExplo) to characterize the rock mass of the Project with the ultimate objective of doing stability calculations and recommendations to guide the open pit design at a pre-feasibility level. A field campaign was conducted to collect data through geomechanical drilling, televiewer, hydrogeological analyses, and laboratory testing. A total of seven geomechanical drillholes (3,228 m) were carried out during the months of April through June 2023. Additionally, a total of 11 holes were surveyed using televiewer (5,306 m), and 395 laboratory tests were performed to characterize the rock mass, along with various point load tests (PLT) and other tests.
The geological and geomechanical surveys described eight distinct geomechanical units, including the deformation zone, mafics and sedimentary units which formed most of the walls. These units were based on the lithological model provided by Mayfair Gold from the 2023 MRE (TMAC, 2023).
Hydro-Ressources lnc.’s preliminary findings for the Project reported an average hydraulic conductivity of 3 x 10⁻⁸ m/s and a pre-mining piezometric line depth of approximately 1.5 meters below the surface. Despite excavation, the rock’s low permeability would maintain the water table at a high level within the pit area.
The main joint sets were analysed. A total of 12 sets were listed. They are mostly sub-vertical dipping north-south or sub-horizontal which are somewhat favorable to slope stability. An equivalent average friction angle between 34° and 37° for a 10 m long discontinuity is estimated for all joints sets.
A litho-structural model was realised to assess the different zones of weak rock and faults. In total, 129 weak rock mass zones and 25 faults zones were identified. A main fault zone was identified and found sub vertical and parallel to the main mineralized trend. A secondary fault zone was located north and found along the footwall zone and perpendicular to it. These zones of weaker rock and faults were incorporated in each numerical model for the OSAs.
Laboratory tests, including uniaxial compressive tests, Brazilian tests and triaxial tests, were carried out on all geomechanical units except for the diabase and the ultramafic volcanic. The deformation zone, footwall zone and the pyroxenite showed lower property values than the average of the project while the mafics, main zone and sedimentary yielded the best properties from the laboratory tests with UCS estimated over 100 MPa.
All geomechanical units have, in general, good rock mass quality based on the RMRag, Q-system and GSI classifications, except for the diabase, which has an average Q-value of weak. However, some units were only rarely intercepted during the geomechanical survey campaign, which will require further investigation in the next stage. The rock mass properties seem to be constant within the same unit as the depth varies.
Analyses were carried out on benches and IRAs for each unit. The bench face angles were mostly derived from kinematics analyses from Dips and SWedge software. The most critical mode of failure observed are direct toppling and wedging and they dictated the bench face angle. They vary from 70° to 80°. As for the width of the benches, they were determined based on the assurance that the width of the benches remaining after structural instability can retain the material likely to fall on the bench in 80% of probable situations. The widths vary from 6.5 m to 10.0 m.
| Fenn-Gib Gold Project |
Page 144 | |
| NI 43-101 Technical Report and Pre-Feasibility Study |
December 19, 2025 | |
|
|
The Inter-ramp angles (IRA) were calculated directly from the slope and width of the benches. The IRAs vary from 49° to 61°. Both the bench dimensions and the IRAs were then numerically analysed in Slide2 to ensure stability when considering anisotropic conditions caused by the main joint sets.
The Overall Slope Angle (OSA) of multiple sections were analysed first by Slide2. Then, they were brought into RS2. For the Project, RS2 yielded lower OSAs than Slide2 since the finite elements analysis (RS2) considers behaviors that were not considered in the limit equilibrium analyses (Slide2). Thus, the angles that are recommended are the maximum possible angles that respected the stability criteria for both approaches. The north wall of the pit suggests an OSA of approximately 51° while the south wall is around 47°. The west and east walls resulted in lower angles since they are affected by the weaker rock and fault zones. These yielded in a OSA of 42° for the west wall and 40° for the east wall.
The final recommendations were separated in 16 sectors which are found in Figure 16-1. These sectors were created by separating the different pit wall dip directions based on benches, IRA and OSA results. In the smaller pits, some orientations were grouped together to form a sector since they were exhibiting similar dimensions and proprieties. The final recommendations by sector are shown in Table 16-1.
Following the characterization of the rock mass at the Project and the various analyses performed, recommendations were elaborated with the goal of minimizing the risk related to instabilities that an open pit could generate and increasing the knowledge about the rock mechanics mechanisms found at Fenn-Gib. The main recommendations are principally related to additional data collection. The faults play an important role in the stability of the walls. Thus, more information on the faults needs to be obtained. In addition, more information of certain geomechanical units such as the diabase, the footwall zone and the ultramafic volcanic should be acquired.
Additional geomechanical drilling, testwork and an updated geomechanical mine design are planned to be completed as part of the next phases of the project’s design and development.
| Fenn-Gib Gold Project |
Page 145 | |
| NI 43-101 Technical Report and Pre-Feasibility Study |
December 19, 2025 | |
|
|
Figure 16-1: Sectors for the Design Recommendations
Source: InnovExplo, 2023
| Fenn-Gib Gold Project |
Page 146 | |
| NI 43-101 Technical Report and Pre-Feasibility Study |
December 19, 2025 | |
|
|
Table 16-1: Overall Slope Angle Estimation
| Pit |
Geomechanical Units | Pit | Dominant Pit Wall Dip Direction (*) |
Maximum Slope Height (m) |
Dominant Potential Failure Mode |
Bench Configurations | Inter-Ramp Angle (IRA) Configurations | Maximum Overall Slope Angle (OSA) |
||||||||||||||||||||||||||||||
| Bench Face Angle (*) |
Bench Width (m) |
Estimated IRA (*) |
Geotech Berm Width (m) |
Max IRA Height (m) |
From Numerical Modelling (I) |
|||||||||||||||||||||||||||||||||
| A |
Sedimentary | Main | 0 | 580 | Wedging | 80 | 7.5 | 61 | 25 | 120 | 47 | |||||||||||||||||||||||||||
| Deformation Zone | Fluexural Topping | 70 | 54 | |||||||||||||||||||||||||||||||||||
| B |
Sedimentary | Main | 45 | 580 | Wedging | 80 | 8.5 | 59 | 25 | 120 | 47 | |||||||||||||||||||||||||||
| Deformation Zone | 70 | 10.0 | 49 | |||||||||||||||||||||||||||||||||||
| C |
Deformation Zone | Main | 90 | 560 | Wedging | 70 | 10.0 | 49 | 25 | 120 | 42 | |||||||||||||||||||||||||||
| Footwall Zone | 80 | 8.5 | 59 | |||||||||||||||||||||||||||||||||||
| Mafics | 80 | 7.5 | 61 | |||||||||||||||||||||||||||||||||||
| Main Zone | 75 | 9.0 | 54 | |||||||||||||||||||||||||||||||||||
| D |
Footwall Zone | Main | 135 | 210 | Wedging | 80 | 7.5 | 61 | 25 | 120 | 46 | |||||||||||||||||||||||||||
| Mafics | ||||||||||||||||||||||||||||||||||||||
| Main Zone | 70 | 9.0 | 51 | |||||||||||||||||||||||||||||||||||
| E |
Footwall Zone | Main | 225 | 560 | Wedging | 70 | 9.0 | 51 | 25 | 120 | 51 | |||||||||||||||||||||||||||
| Mafics | 80 | 8.5 | 59 | |||||||||||||||||||||||||||||||||||
| Main Zone | 75 | 9.0 | 54 | |||||||||||||||||||||||||||||||||||
| Pyroxenite | 70 | 6.5 | 55 | |||||||||||||||||||||||||||||||||||
| F |
Deformation Zone | Main | 180 | 580 | Wedging | 75 | 10.0 | 52 | 25 | 120 | 51 | |||||||||||||||||||||||||||
| Mafics | 80 | 7.5 | 61 | |||||||||||||||||||||||||||||||||||
| Pyroxenite | 70 | 6.5 | 55 | |||||||||||||||||||||||||||||||||||
| G |
Deformation Zone | Main | 225 | 340 | Wedging | 75 | 10.0 | 52 | 25 | 120 | 46 | |||||||||||||||||||||||||||
| Diabase | 75 | 8.5 | 55 | |||||||||||||||||||||||||||||||||||
| Fenn-Gib Project |
Page 147 | |
| NI 43-101 Technical Report and Pre-Feasibility Study |
December 19, 2025 | |
|
|
| Pit |
Geomechanical Units | Pit | Dominant Pit Wall Dip Direction (*) |
Maximum Slope Height (m) |
Dominant Potential Failure Mode |
Bench Configurations | Inter-Ramp Angle (IRA) Configurations | Maximum Overall Slope Angle (OSA) |
||||||||||||||||||||||||||||||||
| Bench Face Angle (*) |
Bench Width (m) |
Estimated IRA (*) |
Geotech Berm Width (m) |
Max IRA Height (m) |
From Numerical Modelling (I) |
|||||||||||||||||||||||||||||||||||
| Mafics | 80 | 8.5 | 59 | |||||||||||||||||||||||||||||||||||||
| Pyroxenite | 70 | 6.5 | 55 | |||||||||||||||||||||||||||||||||||||
| H |
Deformation Zone | Main | 270 | 220 | Direct Toppling | 70 | 10.0 | 49 | 25 | 120 | 4 | |||||||||||||||||||||||||||||
| Diabase | Wedging | 75 | 6.5 | 59 | ||||||||||||||||||||||||||||||||||||
| Pyroxenite | Wedging | 70 | 6.5 | 55 | ||||||||||||||||||||||||||||||||||||
| Ultramafic Volcanic | Toppling/Wedging | 75 | 10.0 | 52 | ||||||||||||||||||||||||||||||||||||
| I |
Deformation Zone | Main | 315 | 580 | Wedging | 70 | 7.5 | 54 | 25 | 120 | 49 | |||||||||||||||||||||||||||||
| Diabase | 75 | 6.5 | 59 | |||||||||||||||||||||||||||||||||||||
| Sedimentary | 80 | 7.5 | 61 | |||||||||||||||||||||||||||||||||||||
| J |
Sedimentary | West | 45 | 146 | Wedging | 80 | 8.5 | 59 | N/A | 100 | 58 | |||||||||||||||||||||||||||||
| K |
Ultramafic Volcanic | West | 90 | 146 | Direct Toppling | 70 | 10.0 | 49 | N/A | 125 | 49 | |||||||||||||||||||||||||||||
| L |
Deformation Zone | West | 135-225 | 146 | Wedging | 75 | 10.0 | 52 | 25 | 120 | 58 | |||||||||||||||||||||||||||||
| Ultramafic Volcanic | 80 | 8.5 | 59 | |||||||||||||||||||||||||||||||||||||
| M |
Deformation Zone | West | 270 | 146 | Direct Toppling | 70 | 10.0 | 49 | 25 | 120 | 49 | |||||||||||||||||||||||||||||
| N |
Sedimentary | West | 315-0 | 146 | Wedging | 80 | 7.5 | 61 | 25 | 120 | 61 | |||||||||||||||||||||||||||||
| O |
Mafics | East | 90-225 | 80 | Wedging | 80 | 7.5 | 61 | N/A | N/A | 57 | |||||||||||||||||||||||||||||
| Pyroxenite | 70 | 6.5 | 55 | |||||||||||||||||||||||||||||||||||||
| P |
Deformation Zone | East | 270-45 | 80 | Wedging | 70 | 7.5 | 54 | N/A | N/A | 54 | |||||||||||||||||||||||||||||
| Fenn-Gib Project |
Page 148 | |
| NI 43-101 Technical Report and Pre-Feasibility Study |
December 19, 2025 | |
|
|
| 16.2.2 | Hydrogeological Considerations |
Hydro-Ressources Inc. supported InnovExplo in the evaluation of ground water conditions at the Project. The focus of their work was on the more competent rock beneath the overburden. Water inflow in the overburden was not part of the testing program.
Field tests were done at site between June and October 2023. The investigations performed included; slug tests, injection tests and profile tracer tests. Fourteen holes were drilled by Mayfair either for exploration or geotechnical/hydrogeological purposes. These were also used for the Hydrogeological testing.
Hydro-Ressources lnc.’s preliminary findings for the Project reported an average hydraulic conductivity of 3 x 10⁻⁸ m/s and a pre-mining piezometric line depth of approximately 1.5 m below the surface. Despite excavation, the rock’s low permeability would maintain the water table at a high level within the pit area.
The potential inflow was estimated using Darcy’s equation and with various modifying factors. The expected flow rate would be 250 l/min which Hydro-Ressources considered to be low. With this low calculated inflow, higher pore pressures in the wall are expected.
To reduce pore pressure in the wall, An estimated cost is included for horizontal drain holes to be drilled on an annual basis to assist in pore water pressure reduction in the rock portion of the pit wall.
| 16.2.3 | Geotechnical and Hydrogeological PFS Application |
As noted, the focus on the work by InnovExplo and Hydro-Ressources was on the rock beneath the overburden zone. A significant amount of material is the overburden at the Project. The overburden is expected to have flatter slopes due to the nature of the sandy/silty material. This is also expected to be a source of water inflow of greater significance then the underlying rock.
In the absence of data from the field programs during the course of the PFS, estimates were prepared of the expected slope conditions for use in the mine design.
The slope parameters from InnovExplo were merged with the overburden slope estimate and modifying factors such as roads and berms were added to generate overall slope angles for use in pit optimization and mine design. These modified pit wall slopes and parameters are shown in Table 16-2. For overburden an overall angle of 21° was assumed with an inter-ramp angle of 26.6°, face angle of 55°and 10 m between catch benches.
Table 16-2: Pit Slope Parameters
| Sector |
Units | Overburden | A | B | C | D | E | F | G | H | I | |||||||||||
| Sector (AGP) |
Overburden | 1 | 2 | 3 | 4 | 5 | 6 | 7 | 8 | 9 | ||||||||||||
| Inter-ramp Angle |
deg | 26.6 | 60.4 | 60.4 | 52.5 | 58.3 | 64.9 | 64.9 | 61.5 | 49.9 | 62.6 | |||||||||||
| Face Angle |
deg | 55 | 75 | 75 | 75 | 75 | 75 | 75 | 75 | 75 | 75 | |||||||||||
| Bench Height |
m | 10 | 10 | 10 | 10 | 10 | 10 | 10 | 10 | 10 | 10 |
| Fenn-Gib Gold Project |
Page 149 | |
| NI 43-101 Technical Report and Pre-Feasibility Study |
December 19, 2025 | |
|
|
| Sector |
Units | Overburden | A | B | C | D | E | F | G | H | I | |||||||||||
| Stacked Height |
m | 10.0 | 20.0 | 20.0 | 20.0 | 20.0 | 20.0 | 20.0 | 20.0 | 20.0 | 20.0 | |||||||||||
| Catch Bench Width |
m | 13.00 | 6.00 | 6.00 | 10.00 | 7.00 | 4.00 | 4.00 | 5.50 | 11.50 | 5.00 | |||||||||||
| Haul roads |
number | 1.0 | 3.0 | 3.0 | 3.0 | 3.0 | 3.0 | 3.0 | 3.0 | 3.0 | 3.0 | |||||||||||
| Haul road width |
m | 30.2 | 30.2 | 30.2 | 30.2 | 30.2 | 30.2 | 30.2 | 30.2 | 30.2 | 30.2 | |||||||||||
| Geotech berms |
number | — | 1 | 1 | 1 | 1 | 1 | 1 | 1 | 1 | 1 | |||||||||||
| Geotech berm width |
m | — | 25.0 | 25.0 | 25.0 | 25.0 | 25.0 | 25.0 | 25.0 | 25.0 | 25.0 | |||||||||||
| Slope Height |
m | 50 | 340 | 340 | 340 | 340 | 340 | 340 | 340 | 340 | 340 | |||||||||||
| Overall Angle |
deg | 21 | 47 | 47 | 42 | 46 | 51 | 51 | 48 | 40 | 49 | |||||||||||
| Max Overall Angle |
deg | — | 47 | 47 | 42 | 46 | 51 | 51 | 48 | 40 | 49 |
Estimates of expected water inflows to be managed as part of the operating cost estimate are based on work in 2025 by Knight Piesold together with Geocentric Environmental Inc. for the water balance. The additional flow expected for costing purposes varied from 93 m3/hr in Year -1 to 300 m3/hr in later years depending on the size of the final pit. Various pit sizes and end of period plans were developed for the analysis. For the PFS a peak of 291 m3/hr was estimated to be handled from the open pit as part of the overall site wide water balance.
Further work is required on slope parameters for Feasibility work as well as better understanding of the groundwater regime. That work is ongoing at the time of this report.
| 16.3 | Geologic Model Importation |
The resource model for the 2025 PFS was provided by TMAC. That model has an effective date of September 3, 2024, and is described in detail in Section 14. This model was imported to MinePlan for mine planning work.
The resource model was provided in MinePlan format for open pit mine planning and the QP added additional items for use in that mine planning work. Block The type of block model was a single mineralization whole block model. The grades in each block of the resource model are considered to be an undiluted grade.
Framework details of the different open pit block models are provided in Table 16-3. Resource model item descriptions are shown in Table 16-3 while the open pit mine model items are displayed in Table 16-4. The mining model created includes additional items for mine planning purposes. Hexagon’s MinePlan® software was used for mine planning in the PFS including for pit limit analysis. The pit, MRSA design and mine scheduling tools of Hexagon were used for the PFS.
The mine plan is based on indicated mineral resources, as no measured mineral resources are contained in the resource model. The block SG values provided in the resource model were estimated based on provided density data.
Lidar contours were imported into MinePlan and then merged to create an original ground topography surface for the PFS.
| Fenn-Gib Gold Project |
Page 150 | |
| NI 43-101 Technical Report and Pre-Feasibility Study |
December 19, 2025 | |
|
|
| Table 16-3: | Open Pit Model Framework |
| Framework Description |
Mine Planning Model Value (MinePlan) | |
| Block Model Name |
fgr15.dat | |
| MinePlan® file 10 (control file) |
fg10.dat | |
| MinePlan® file 15 (model file) |
fgr15.dat | |
| X origin (m) |
556,950 | |
| Y origin (m) |
5,374,550 | |
| Z origin (m) (max) |
4,500 | |
| Rotation (degrees clockwise) |
0 | |
| Number of blocks in X direction |
640 | |
| Number of blocks in Y direction |
390 | |
| Number of blocks in Z direction |
180 | |
| X block size (m) |
5 | |
| Y block size (m) |
5 | |
| Z block size (m) |
5 |
| Table 16-4: | Open Pit Model Item Descriptions |
| Field Name |
Min |
Max |
Precision |
Units |
Comments | |||||
| TOPO |
0 | 100 | 0.01 | % | Rock density | |||||
| SG |
0 | 10 | 0.01 | t/m3 | Density assigned by lithology | |||||
| AUCNN |
0 | 100 | 0.001 | g/t | NN Capped Au | |||||
| DSTNN |
0 | 1000 | 0.01 | m | NN Distance to nearest sample | |||||
| AUCID |
0 | 100 | 0.001 | g/t | ID Capped Au | |||||
| DSTID |
0 | 1000 | 0.01 | m | ID Distance to nearest sample | |||||
| NSID |
0 | 20 | 1 | unit | ID Number of samples used | |||||
| AUOK |
0 | 5000 | 0.001 | g/t | OK Uncapped Au | |||||
| AUOCK |
0 | 100 | 0.001 | g/t | OK Capped Au - FINAL MODEL | |||||
| DSTOK |
0 | 1000 | 0.01 | m | OK Distance to nearest sample | |||||
| DSTAV |
0 | 1000 | 0.01 | m | OK Average distance to samples used | |||||
| NSEC |
0 | 8 | 1 | — | OK Number of sectors | |||||
| NSOK |
0 | 20 | 1 | unit | OK Number of samples used | |||||
| NDDH |
0 | 20 | 1 | unit | OK Number of drillholes | |||||
| KV |
0 | 100 | 0.01 | % | OK Kriging variance | |||||
| CLS1 |
0 | 5 | 1 | — | Interim classification | |||||
| CLS2 |
0 | 5 | 1 | — | Interim classification | |||||
| CLS3 |
0 | 5 | 1 | — | Interim classification | |||||
| CLS4 |
0 | 5 | 1 | — | Interim classification |
| Fenn-Gib Gold Project |
Page 151 | |
| NI 43-101 Technical Report and Pre-Feasibility Study |
December 19, 2025 | |
|
|
| Field Name |
Min |
Max |
Precision |
Units |
Comments | |||||
| CLS5 |
0 | 5 | 1 | — | Resource Classification - FINAL MODEL | |||||
| SECT |
0 | 99 | 1 | — | Slope Sector | |||||
| MINE |
0 | 1 | 1 | — | Code used for report 1 Rock 0 Air | |||||
| RSCOD |
0 | 9 | 1 | — | Restriction Code to avoid the Lake | |||||
| RSCO2 |
0 | 9 | 1 | — | Restriction Code to avoid Hwy and Lake | |||||
| DAU |
0 | 99 | 0.001 | g/t | Au grade diluted | |||||
| DDEN |
0 | 10 | 0.01 | g/t | Diluted Density | |||||
| BLOKT |
0 | 999 | 0.01 | tonnes | Insitu Tonnes | |||||
| DTON |
0 | 999 | 0.01 | tonnes | Diluted Tonnes | |||||
| OWFL |
0 | 1 | 1 | — | Code use for Dilution script - Flag Ore/Waste | |||||
| ROUTE |
0 | 1 | 1 | — | Code used for Dilution script | |||||
| SLP |
0 | 100 | 0.01 | % | Slope angle code for Pit Design | |||||
| BERM |
0 | 3 | 1 | m | Berm distance code for Pit Design |
| 16.4 | Dilution Calculation |
The mineral resources are based on a 5 x 5 x 5 m resource model block size. The resource model is a whole block model. To account for mining dilution, contact dilution was modelled into the in-situ geology model. To determine the amount of dilution, and the grade of the dilution, the size of the block in the model was considered. Ore mining would be completed on 5 m benches and the block size within the model was 5 x 5 m in plan view, and 5 m high.
Dilution percentages were calculated for each contact side using an assumed 0.75 m average for the contact dilution skin. This dilution skin thickness was selected based on the spatial nature of the mineralization, the proposed grade control methods, GPS-assisted digging accuracy, and anticipated blast heave.
If the side of a mineralized block above cut-off is in contact with a waste block, then it is estimated that dilution of 15% (0.75 x 5 m/25 m2) by volume would result. This is the dilution for each block side. Each of the four sides of the mineralized material block in plan are considered for adding dilution material, so the maximum dilution would be 60% by volume for an isolated block of mill feed.
All mineralized blocks in the resource model contain grade values. Material outside the mineralized shapes with no grade estimates have been treated as at zero for dilution purposes. The in-situ grade is stored in the block model (for Measured and Indicated resources only) and used as the grade for cut-off application. A cutoff grade of 0.22 g/t gold was used to guide the dilution calculation as the marginal cutoff was 0.22 g/t Au and this cut-off grade was used to flag initial feed and waste blocks. The marginal cut-off grade values represent the preliminary process and site G&A costs.
Using this cut-off grade, the first step was to identify the mill feed and waste blocks in the model and flag them as ore (OWFL=1). The second step was to add dilution mass and metal into the mill feed blocks from the neighbouring waste blocks. The third step was to remove the dilution mass from the contact waste blocks to achieve a mass balance.
| Fenn-Gib Gold Project |
Page 152 | |
| NI 43-101 Technical Report and Pre-Feasibility Study |
December 19, 2025 | |
|
|
An in-house routine by AGP that applies the above three dilution steps to define new items called DDEN for density, as well as the diluted grade item (DAU). The default waste blocks would receive OWFL=0.
In this manner, the contact diluted blocks were included in the tonnage and grade calculation of mill feed tonnes in the mine plan. This results in approximately 1.8% increase in tonnage and 1.4% reduction in gold grade. The average grade of the diluting material was 0.12 g/t.
| 16.5 | Pit Limit Analysis |
In 2023/2024, AGP was retained by Mayfair Gold to prepare several internal mine planning scenarios, that examined combinations of phase designs, ultimate pit designs, and mining and milling production rates. Ultimate Pit and Phase designs prepared during this period were carried forward into this current study. The previous work was verified with the updated resource model.
| 16.5.1 | Methodology |
In accordance with the guidelines of the National Instruments 43-101 on Standards of Disclosure for Mineral Projects, and the Canadian Institute of Mine, Metallurgy and Petroleum Definition Standards for Mineral Resources and Mineral Reserves, only those mineral blocks classified in the Measured and Indicated resource categories are allowed to drive the pit optimizer for a pre-feasibility or feasibility study. No economic value is attributed to Inferred blocks and, as such, these blocks are treated as waste blocks by the pit optimization routine.
Pit limit analysis was carried out using the Lerchs-Grossman and Floating Cone algorithms in the Hexagons MinePlan Software. The pit algorithm is used to produce pit shells that are physical representations of an economical pit shell, assuming a given set of parameters and 3D block model. Using a variety of input parameters such as mining costs, processing costs, process recovery values and pit slopes, the algorithm outputs the pit shell that maximizes the undiscounted value of the deposit. These shells are devoid of geotechnical and operational features such as ramps, proper benching arrangements, and minimum mining width considerations. The pit shell’s purpose is to be used as
| | a limit for reporting mineral resources |
| | a basis for establishing pit limits and guide for the design of an engineered open pit. |
No capital expenses, such as those required for initial equipment purchase or waste pile construction, are considered by the pit optimization tool.
A series of pit shells are produced using a range of revenue factors (reduction factors on selling price) from 20 % to 100 % to produce the industry standard pit-by-pit graph. The revenue factor is used to measure the sensitivity of the pit optimizations to changes in mineral selling prices, as well as to evaluate the effect of the pit size and stripping ratios on the project present value (PV). The analysis produces a series of nested pit shells that prioritizes the mining of the most economic material and progressively increase in size, while less profitable material is mined as the revenue factor increases. The pit optimizations results are subsequently compared based on the estimated PV and calculated undiscounted value and tonnes of potential mill feed material and waste material. From these results, a final pit shell that meets project requirements and maximizes project PV is selected.
| Fenn-Gib Gold Project |
Page 153 | |
| NI 43-101 Technical Report and Pre-Feasibility Study |
December 19, 2025 | |
|
|
| 16.5.2 | Pit Limit Analysis Inputs and Parameters |
The major costs and other parameters used for the pit limit analysis runs are detailed in Table 16-5.
| Table 16-5: | Pit Limit Analysis Parameters |
| Parameter |
Unit |
Value | ||
| Revenue | Reserve | |||
| Metal Price – Au |
US$/oz | 1,750 | ||
| Exchange Rate |
US$:C$ | 1.35 | ||
| Royalty – Au |
% | 1.0 | ||
| Payable |
% | 99.0 | ||
| Refining |
US$/oz | 0.40 | ||
| Transportation |
US$/oz | 5.00 | ||
| Dore Metal Value |
US$/oz | 1,727.10 | ||
| Royalty |
US$/oz | 17.27 | ||
| Value after Royalty |
US$/oz | 1,709.83 | ||
| US$/g | 54.97 | |||
| $/g | 74.21 | |||
| Cost basis |
||||
| Mining | ||||
| Base Elevation (5,000 m + UTM elev.) |
Mine grid elevation (m) | 5,310 | ||
| Ore Mining – Base |
$/t mined | 3.23 | ||
| Waste Mining – Base |
$/t mined | 3.24 | ||
| Incremental Mining Cost below Base |
$/t mined /5 m vertical | |||
| Ore Mining |
$/t mined | 0.020 | ||
| Waste Mining |
$/t mined | 0.023 | ||
| Rehandle Cost |
$/t mined | 1.00 | ||
| Processing and G&A | ||||
| Processing Cost |
$/t milled | 14.50 | ||
| G&A |
$/t milled | 2.10 | ||
| Recoveries | ||||
| Metallurgical Recovery - Au |
% | 92.6 | ||
| Cut-Off Grades | ||||
| Marginal Cut-off |
Au g/t | 0.24 | ||
| Marginal Cut-off (with rehandle) |
Au g/t | 0.26 | ||
| Mine Schedule-Elevated Cut-off |
Au g/t | 0.80 | ||
| Fenn-Gib Gold Project |
Page 154 | |
| NI 43-101 Technical Report and Pre-Feasibility Study |
December 19, 2025 | |
|
|
| Parameter | Unit | Value | ||
| Overall Slope Angles | ||||
| Overburden – all sectors |
degree | 21 | ||
| Sector 1 |
degree | 47 | ||
| Sector 2 |
degree | 47 | ||
| Sector 3 |
degree | 42 | ||
| Sector 4 |
degree | 46 | ||
| Sector 5 |
degree | 51 | ||
| Sector 6 |
degree | 51 | ||
| Sector 7 |
degree | 48 | ||
| Sector 8 |
degree | 40 | ||
| Sector 9 |
degree | 49 | ||
| Boundary Constraints | ||||
| Physical Constraints on pit expansion |
Distance from waterbody (m) | 100 | ||
| 16.5.2.1 | Cut-off Grade |
To classify the material contained within the open pit limits as material for processing or material for waste, the milling cut-off grade is used. This break-even cut-off grade is calculated to cover the costs of processing, general and administrative costs, and selling costs using the economic and technical parameters listed in Table 16-5. Mineral resource material contained within the pit shell and above the cut-off grade is classified as potential mill feed (PMF), while resource material below the cut-off grade is classified as waste.
The cut-off grade is represented by a single gold grade value. The break-even Cut-off Value, based on the parameters in Table 16-5 is:
| | marginal cut-off grade of 0.22 g/t Au |
To assist in improving the Project economics and for mine design and planning purposes, an elevated cut-off grade of 0.80 g/t Au was selected for the mine schedule.
| 16.5.3 | Pit Limit Analysis Results |
The pit limit analysis process results in a series of nested pit shells, each corresponding to a Revenue Factor (RF). The revenue factor scales the metal prices only, and no costs are factored by the RF. The RF 1 corresponds to the selling prices listed in Table 16-5.
Table 16-6 and Figure 16-2 summarize the nested pit shell results for the Fenn-Gib deposit at a selection of revenue factors. The shells run used the Floating Cone algorithm and the marginal cutoff. For this reason, the cumulative tonnages do not match later schedules as they provided guidance on location of the most economic pits, but the mining schedule with the elevated cutoff dramatically reduces the processing tonnage with the material between the marginal cutoff and the elevated cutoff treated as waste.
| Fenn-Gib Gold Project |
Page 155 | |
| NI 43-101 Technical Report and Pre-Feasibility Study |
December 19, 2025 | |
|
|
The shells associated with RF=0.55 were used as guidance for the ultimate pit design as they meet the criteria of between 10 and 20 years of mining with a 4,800 t/d production rate. As noted, the tonnages available at much lower grades are significant, but are currently assumed to be stockpiled as Mineralized Waste. The project would benefit from a higher production rate, but the use of the elevated cutoff allowed for the accelerated development of a high-margin operation while preserving optionality for future growth.
The break point at RF=0.55 provided 63% of the RF=1 revenue with the need to move only 21% of the waste material.
| Table 16-6: | Nested Pit Shell Results |
| Revenue Factor (RF) |
Gold Price US$/oz |
Cumulative Net Profit $ M |
Cumulative % Waste |
Cumulative % Revenue |
Cumulative Waste (Mt) |
Cumulative Ore (Mt) |
Gold grade (g/t) |
Cumulative Strip Ratio |
Processing Years | |||||||||
| 0.20 |
$350 | 324.4 | 1% | 10% | 3.2 | 6.0 | 0.72 | 0.54 | 4 | |||||||||
| 0.25 |
$437 | 796.1 | 2% | 24% | 11.1 | 18.4 | 0.59 | 0.60 | 11 | |||||||||
| 0.30 |
$525 | 1,130.0 | 3% | 34% | 17.8 | 29.1 | 0.55 | 0.61 | 17 | |||||||||
| 0.35 |
$612 | 1,344.1 | 5% | 40% | 25.6 | 37.0 | 0.52 | 0.69 | 22 | |||||||||
| 0.40 |
$700 | 1,480.0 | 6% | 44% | 33.0 | 42.5 | 0.49 | 0.78 | 25 | |||||||||
| 0.45 |
$787 | 1,529.4 | 7% | 46% | 36.5 | 44.7 | 0.48 | 0.82 | 26 | |||||||||
| 0.50 |
$875 | 1,885.0 | 14% | 56% | 74.7 | 62.4 | 0.41 | 1.20 | 36 | |||||||||
| 0.55 |
$962 | 2,119.7 | 21% | 63% | 107.5 | 76.0 | 0.37 | 1.41 | 44 | |||||||||
| 0.60 |
$1,050 | 2,556.6 | 37% | 76% | 192.4 | 102.2 | 0.32 | 1.88 | 59 | |||||||||
| 0.65 |
$1,138 | 2,746.5 | 46% | 82% | 241.0 | 115.2 | 0.31 | 2.09 | 66 | |||||||||
| 0.70 |
$1,225 | 2,845.3 | 52% | 85% | 268.7 | 122.4 | 0.30 | 2.20 | 70 | |||||||||
| 0.75 |
$1,313 | 3,116.1 | 74% | 93% | 386.2 | 142.2 | 0.27 | 2.72 | 82 | |||||||||
| 0.80 |
$1,400 | 3,178.2 | 79% | 95% | 408.9 | 149.2 | 0.27 | 2.74 | 86 | |||||||||
| 0.85 |
$1,488 | 3,251.8 | 86% | 97% | 446.3 | 156.6 | 0.26 | 2.85 | 90 | |||||||||
| 0.90 |
$1,575 | 3,327.7 | 96% | 99% | 501.1 | 166.2 | 0.25 | 3.02 | 95 | |||||||||
| 0.95 |
$1,663 | 3,347.7 | 100% | 100% | 517.0 | 169.5 | 0.25 | 3.05 | 97 | |||||||||
| 1.00 |
$1,750 | 3,350.3 | 100% | 100% | 519.4 | 170.2 | 0.25 | 3.05 | 98 |
| Fenn-Gib Gold Project |
Page 156 | |
| NI 43-101 Technical Report and Pre-Feasibility Study |
December 19, 2025 | |
|
|
| Figure 16-2: | Pit-by-Pit Graph |
Source: AGP 2025
| 16.6 | Pit Design Parameters |
| 16.6.1 | Bench Design |
The terminology for the pit design slope is described in Figure 16-3.
| Fenn-Gib Gold Project |
Page 157 | |
| NI 43-101 Technical Report and Pre-Feasibility Study |
December 19, 2025 | |
|
|
| Figure 16-3: | Pit Slope Design Terminology |
Source: AGP, 2025
The benching parameters were established following the geotechnical parameter recommendations presented Table 16-2. Working benches were designed for 30 to 40 m minimum mining width on pushbacks.
| 16.6.2 | Haul Ramp Design |
The haul ramp design is based on the largest truck planned for project. For the level study, the largest haul truck planned is a 92-tonne rigid frame truck.
Figure 16-4 and Figure 16-5 illustrate the typical haul ramp profile. Table 16-7 summarizes the haul ramp width calculation that has been used in the pit and phase designs. The widest truck of that class was used for the ramp width calculation for flexibility in the future.
| Fenn-Gib Gold Project |
Page 158 | |
| NI 43-101 Technical Report and Pre-Feasibility Study |
December 19, 2025 | |
|
|
| Figure 16-4: | Haul Ramp Design Section, Double Lane |
Source: AGP 2025
| Figure 16-5: | Haul Ramp Design Section, Single Lane |
Source: AGP 2025
| Fenn-Gib Gold Project |
Page 159 | |
| NI 43-101 Technical Report and Pre-Feasibility Study |
December 19, 2025 | |
|
|
| Table 16-7: | Haul Ramp Width Calculation |
| Haul Truck Parameters |
Units |
Value | ||
| Payload (T, Heaped 2:1)) |
92 tonnes | |||
| Operating Width, W |
m | 6.9 | ||
| Width Factor (of Truck Width) |
||||
| Double Lane |
3x | |||
| Single Lane |
2x | |||
| Running Surface Double Lane |
m | 20.7 | ||
| Running Surface Single-Lane |
m | 13.8 | ||
| Tire Type |
27.00 R49 | |||
| Tire Overall Diameter |
m | 2.7 | ||
| Factor (of Tire Size) |
0.75x | |||
| Berm Height (Calculated) |
m | 2.0 | ||
| Slope |
degrees | 37 | ||
| Berm Width |
m | 6.1 | ||
| Additional Allowance |
m | 0.0 | ||
| Road Berm Allowance |
m | 6.1 | ||
| Drainage Ditch Depth |
m | 0.83 | ||
| Slope (H:V) |
1.5:1 | |||
| Ditch Width |
m | 2.5 | ||
| Total Ramp Width Double Lane |
m | 29.3 | ||
| Total Ramp Width Single Lane |
m | 22.4 | ||
| Ramp Gradient |
% | 10 |
| 16.6.3 | Pit and Phase Selection |
Pit designs were developed for the main pit as well as the two small satellite pits to the north (Phase 1N) and east (Phase 1E) using a 10 m bench height. Each of the satellite pits are a single phase. The main pit has been divided into three phases with phase 3 being the ultimate pit. Pit limit analysis shells had been used to guide the ultimate pit were also used to outline areas of higher value for targeted early mining and phase development.
Geotechnical parameters presented in Table 16-2 were applied to pit designs.
| 16.6.4 | Pit Designs |
The Ultimate Pit Design for the Project is shown in Figure 16-6. This is showing the main pit area which represents the bulk of the mining material. A cross section of the ultimate pit with Phase 1E is shown in Figure 16-7 against the RF=0.55 pit shell to show it closely matching the design guidance.
| Fenn-Gib Gold Project |
Page 160 | |
| NI 43-101 Technical Report and Pre-Feasibility Study |
December 19, 2025 | |
|
|
| Figure 16-6: | Ultimate Pit Design |
Source: AGP, 2025
| Fenn-Gib Gold Project |
Page 161 | |
| NI 43-101 Technical Report and Pre-Feasibility Study |
December 19, 2025 | |
|
|
| Figure 16-7: | Ultimate Pit Design against RF=0.55 Pit Shell (Section View) |
Source: AGP, 2025
The volumetrics within the final pit design and phases are shown in Table 16-8. The numbers are reported from the mining block model and thus deemed to include mining dilution and loss.
| Table 16-8: | Fenn-Gib Pit Inventory (By Phase) |
| Material |
Units |
Phase 1 | Phase 2 | Phase 3 | Phase 1N | Phase 1E | Total | |||||||
| Mill Feed | ||||||||||||||
| Ore |
K tonnes | 3,308.6 | 10,268.0 | 11,240.0 | 44.5 | 268.5 | 25,129.5 | |||||||
| Gold grade |
g/t | 1.58 | 1.32 | 1.16 | 1.24 | 2.07 | 1.29 | |||||||
| Contained gold |
K oz | 168.3 | 436.0 | 417.8 | 1.8 | 17.8 | 1,041.7 | |||||||
| Waste Material | ||||||||||||||
| Overburden |
K tonnes | 2,963.3 | 4,593.2 | 5,403.8 | 424.7 | 2,934.3 | 16,319.3 | |||||||
| Rock |
K tonnes | 4,940.2 | 40,843.1 | 86,666.4 | 674.9 | 2,421.8 | 135,546.4 | |||||||
| Total Waste Material |
K tonnes | 7,903.5 | 45,436.3 | 92,070.2 | 1,099.6 | 5,356.1 | 151,865.7 | |||||||
| Grand Total |
K tonnes | 11,212.1 | 55,704.3 | 103,310.2 | 1,144.1 | 5,624.6 | 176,995.2 | |||||||
| Strip Ratio (waste to ore) |
W:O | 2.39 | 4.43 | 8.19 | 24.74 | 19.95 | 6.04 | |||||||
| Fenn-Gib Gold Project |
Page 162 | |
| NI 43-101 Technical Report and Pre-Feasibility Study |
December 19, 2025 | |
|
|
| 16.6.5 | Phases |
The main pit area is comprised of three phases and the two satellite pits are single phases each. They have been shown together in their proper locations in Figure 16-8 and individually in Figure 16-9 to Figure 16-13.
| Figure 16-8: | Fenn-Gib Phases |
Source: AGP, 2025
| Fenn-Gib Gold Project |
Page 163 | |
| NI 43-101 Technical Report and Pre-Feasibility Study |
December 19, 2025 | |
|
|
| Figure 16-9: | Phase 1 |
Source: AGP, 2025
| Fenn-Gib Gold Project |
Page 164 | |
| NI 43-101 Technical Report and Pre-Feasibility Study |
December 19, 2025 | |
|
|
| Figure 16-10: | Phase 2 |
Source: AGP, 2025
| Fenn-Gib Gold Project |
Page 165 | |
| NI 43-101 Technical Report and Pre-Feasibility Study |
December 19, 2025 | |
|
|
| Figure 16-11: | Phase 3 |
Source: AGP, 2025
| Fenn-Gib Gold Project |
Page 166 | |
| NI 43-101 Technical Report and Pre-Feasibility Study |
December 19, 2025 | |
|
|
| Figure 16-12: | Phase 1N |
Source: AGP, 2025
| Fenn-Gib Gold Project |
Page 167 | |
| NI 43-101 Technical Report and Pre-Feasibility Study |
December 19, 2025 | |
|
|
| Figure 16-13: | Phase 1E |
Source: AGP, 2025
Phase 1 is the first phase mined in the schedule and targets the highest value in the main pit. A small pod of high value material is located behind the wall that was targeted for early extraction with a slot cut and sink into the floor. Phase 1 starts in Year -1. The final level in Phase 1 is 5,210 m.
Phase 2 pushes the ramp system to the north of the Phase 1 access driving deeper and expanding the pit. This phase is started in Year 1. The phase 2 bottom elevation is 5,080 m.
| Fenn-Gib Gold Project |
Page 168 | |
| NI 43-101 Technical Report and Pre-Feasibility Study |
December 19, 2025 | |
|
|
Phase 3 of the main pit area is the ultimate pit. It is initiated in Year 3. This further shifts the ramp system to the southwest providing better access for waste material to the waste storage facilities. The higher strip ratio of this phase makes it important to keep waste haulage efficient. Phase 3’s bottom elevation is 4,965 m.
Phase 1N is a slot cut north of the current highway. It is targeting a high value target but also provides fill material for pads and roads due to its minimal amount of overburden. Because of this need for early rock, it is mined starting in Year -1. The base elevation for Phase 1N is 5,270 m.
Phase 1E is a satellite pit targeting another high value zone. Its single phase has the ramp starting on the northwest side to avoid interference with the main pit area. The phase starts in Year 1 and is finished in Year 2. The base elevation for Phase 1E is 5,210 m.
Phase 1N and 1E may be used as water storage facilities later in the mine life as part of the overall water control system.
| 16.7 | Mine Rock Storage Areas |
Waste rock material generated from the open pit will be stockpiled in the following locations:
| | Overburden material suitable for reclamation purposes will be stockpiled separately in three locations. |
| | Waste rock material from the open pit will be used in the wall construction of the TSF or in mine rock storage locations to the east of the TSF. |
The overburden is stored in the North, Central and South locations. The tailings construction is assumed to occur in two major stages. Remaining waste material is stored in the main waste storage facility in two large lifts.
The volumetrics are shown in Table 16-9. Sufficient capacity is available for all the overburden and waste material. A small amount of material is also used to construct the high-grade stockpile foundation and the ROM pad.
| Table 16-9: | Waste Material Storage Locations and Designed Volumes |
| Waste Material |
Volume (LCM) | |
| Overburden – North |
5,000,000 | |
| Overburden – Central |
1,524,000 | |
| Overburden - South |
3,242,000 | |
| TSF – Stage 1 |
680,000 | |
| TSF – Stage 2 |
7,000,000 | |
| MRSA – Stage 1 |
11,100,000 | |
| MRSA – Stage 2 |
48,320,000 | |
| HG Stockpile/ROM Pad |
545,000 | |
|
| ||
| Total |
77,411,000 | |
|
|
| Fenn-Gib Gold Project |
Page 169 | |
| NI 43-101 Technical Report and Pre-Feasibility Study |
December 19, 2025 | |
|
|
| 16.8 | Life-of-Mine (LOM) Schedule |
The mine production schedule produces of 25.1 Mt of mill feed grading 1.29 g/t Au. This provides a mine life of 14.5 years at a processing rate of 4,800 t/d or 1.75 Mt/a. Mine overburden and rock waste tonnage totals 151.9 Mt and will be placed in the TSF and MSRA in addition to overburden stockpiles. The overall pit strip ratio (waste: ore) will be 6.0:1.
The mining production schedule includes a pre-production period followed by 14.5 years of processing. High-grade material encountered during pre-stripping operations will be stockpiled (0.8 Mt) and will be reclaimed in Year 1.
The LOM production schedule for the open pit has been prepared using the MinePlan Schedule Optimizer (MPSO) tool in the HexagonTM MinePlan 3D software. Provided with economic input parameters and operational constraints such as phase sequencing, maximum bench sink rates, and mining and milling capacities, the software determines the optimal mining sequence and stockpiling strategy, which maximizes the value of the mine production plan.
The overall objective of the mine scheduling and planning process is to maximize project value while achieving the processing plant objectives and targets.
A mine production schedule was developed based on the following assumptions and criteria:
| | Average 4,800 t/d mill feed throughput. |
| | A maximum sink rate of 10 x 5 m benches (50 m) per year was implemented with only one year at 13 x 5 m benches (65 m). |
| | Ore stockpiles were only considered in preproduction and of sufficient capacity to not exceed the 4,800 t/d processing capacity when consumed. |
The mine plan has been developed to meet plant feed requirements according to general best open pit mine practices such as equipment fleet smoothing and maximizing net present value (“NPV”).
A one-year pre-production stripping period at the Project was considered. Table 16-10 tabulates the LOM production plan and Figure 16-14 to Figure 16-16 graphically show the LOM production plan.
| Fenn-Gib Gold Project |
Page 170 | |
| NI 43-101 Technical Report and Pre-Feasibility Study |
December 19, 2025 | |
|
|
Table 16-10: LOM Production Schedule
| Description |
Y-1 | Y1 | Y2 | Y3 | Y4 | Y5 | Y6 | Y7 | Y8 | Y9 | Y10 | Y11 | Y12 | Y13 | Y14 | Y15 | Total | |||||||||||||||||||
| Mill Feed |
Ore (Mt) | — | 1.45 | 1.75 | 1.75 | 1.75 | 1.75 | 1.75 | 1.75 | 1.75 | 1.75 | 1.75 | 1.75 | 1.75 | 1.75 | 1.75 | 0.91 | 25.13 | ||||||||||||||||||
| Au (g/t) | — | 1.44 | 1.65 | 1.40 | 1.39 | 1.46 | 1.49 | 1.18 | 1.10 | 1.07 | 1.24 | 1.36 | 1.26 | 1.23 | 1.09 | 0.76 | 1.29 | |||||||||||||||||||
| Mine Production |
Total Waste (Mt) | 6.21 | 8.55 | 12.25 | 12.25 | 12.25 | 13.25 | 14.25 | 14.25 | 14.25 | 14.25 | 10.03 | 8.81 | 5.12 | 3.39 | 2.44 | 0.32 | 151.87 | ||||||||||||||||||
| Overburden (Mt) | 3.38 | 5.78 | 1.76 | 1.98 | 0.17 | 2.96 | 0.30 | — | — | — | — | — | — | — | — | — | 16.32 | |||||||||||||||||||
| Rock (Mt) | 2.83 | 2.78 | 10.49 | 10.27 | 12.07 | 10.29 | 13.95 | 14.25 | 14.25 | 14.25 | 10.03 | 8.81 | 5.12 | 3.39 | 2.44 | 0.32 | 135.55 | |||||||||||||||||||
| Mine to Mill (Mt) | — | 0.67 | 1.75 | 1.75 | 1.75 | 1.75 | 1.75 | 1.75 | 1.75 | 1.75 | 1.75 | 1.75 | 1.75 | 1.75 | 1.75 | 0.91 | 24.36 | |||||||||||||||||||
| Au (g/t) | — | 1.51 | 1.65 | 1.40 | 1.39 | 1.46 | 1.49 | 1.18 | 1.10 | 1.07 | 1.24 | 1.36 | 1.26 | 1.23 | 1.09 | 0.76 | 1.29 | |||||||||||||||||||
| Mine to Stockpile (Mt) | 0.77 | — | — | — | — | — | — | — | — | — | — | — | — | — | — | — | 0.77 | |||||||||||||||||||
| Au (g/t) | 1.37 | — | — | — | — | — | — | — | — | — | — | — | — | — | — | — | 1.37 | |||||||||||||||||||
| Stockpile to Mill (Mt) | — | 0.77 | — | — | — | — | — | — | — | — | — | — | — | — | — | — | 0.77 | |||||||||||||||||||
| Au (g/t) | — | 1.37 | — | — | — | — | — | — | — | — | — | — | — | — | — | — | 1.37 | |||||||||||||||||||
| Total Ore to Mill (Mt) | 1.45 | 1.75 | 1.75 | 1.75 | 1.75 | 1.75 | 1.75 | 1.75 | 1.75 | 1.75 | 1.75 | 1.75 | 1.75 | 1.75 | 0.91 | 25.13 | ||||||||||||||||||||
| Au (g/t) | 1.44 | 1.65 | 1.40 | 1.39 | 1.46 | 1.49 | 1.18 | 1.10 | 1.07 | 1.24 | 1.36 | 1.26 | 1.23 | 1.09 | 0.76 | 1.29 | ||||||||||||||||||||
| Strip Ratio (Waste: Ore) | — | 5.91 | 6.99 | 6.99 | 6.99 | 7.56 | 8.13 | 8.13 | 8.13 | 8.13 | 5.72 | 5.03 | 2.92 | 1.94 | 1.39 | 0.36 | 6.04 |
| Fenn-Gib Project |
Page 171 | |
| NI 43-101 Technical Report and Pre-Feasibility Study |
December 19, 2025 | |
|
|
| 16.9 | LOM Plan Sequence |
The open pit progression by year is illustrated in Figure 16-17 through Figure 16-28.
A description of mining activity is discussed below:
| | Year -1: Mining is initiated in Phase 1 and Phase 1N. Phase 1N will assist in providing rock for ROM pads and additional rock needed for the TSF construction. In this period, a total of 6.2 Mt of waste material is moved as the Project ramps up. As the processing plant is not yet operational, 0.77 Mt of material grading 1.37 g/t Au is stockpiled. Phase 1 mines from 5,315 m to 5,280 m. Waste material will be directed to TSF. Phase 1N starts at 5,310 m and finishes the year at 5,280 m. |
| | Year 1: Mining continues in Phase 1 until 5,265 m and Phase 1N is completed. Phase 1E starts at 5,310 m and by end of year is at 5,270 m. Phase 2 also starts from 5,315 m and finishes the year at 5,300 m. The processing plant is operational with 1.45 Mt of material grading 1.44 g/t Au, including high-grade stockpile material, fed to the plant. A total of 8.55 Mt of waste is mined. Waste material is routed to the construction of the TSF as needed with excess to the MRSA or overburden stockpiles. |
| | Year 2: Mining continues in Phase 1 and 2 descending to 5,240 m and 5,275 m respectively. Feed of 1.75 Mt grading 1.65 g/t Au is processed, and 12.25 Mt of waste is mined. Phase 1E is completed. Waste goes to the TSF and MRSA as required. |
| | Year 3: Mining continues in Phases 1 and 2 and Phase 3 starts. The satellite pits are completed. The final elevations for Phases 1, 2 and 3 are 5,240, 5,245 and 5,305 m respectively. Feed of 1.75 Mt grading 1.40 g/t Au is processed, and 12.25 Mt of waste is mined. Phase 1 is completed this year. |
| | Year 4: Mining continues in Phase 2 until 5,205 m and in Phase 3 until 5,305 m. Phase 2 is the primary phase this year. Feed of 1.75 Mt grading 1.39 g/t Au is processed, and 12.25 Mt of waste is mined. |
| | Year 5: Mining continues in Phases 2 and 3 descending to 5185 m and 5285 m. Feed of 1.75 Mt grading 1.46 g/t Au is processed. Waste material totalling 13.25 Mt highlights the increased stripping in Phase 3. |
| | Year 6: Mining continues in Phase 2 and 3 and descends to the 5,160 and 5,265 m elevations. Feed of 1.75 Mt grading 1.49 g/t Au is processed. Waste material totalling 14.25 Mt again highlighting the increased stripping in Phase 3. |
| | Year 7: Mining proceeds in Phase 2 and 3. Feed of 1.75 Mt grading 1.18 g/t is processed, and 14.25 Mt of waste is mined. The feed grade from Year 7 onwards is lower than the initial six years and stripping requirements remain elevated to drive Phase 3 deeper. |
| | Year 8 - 15: Mining continues in Phase 2 until Year 9 finishing at the 5,080 m elevation. Phase 3 from Year 9 onwards is the only phase mined. Feed to the mill remains at 1.75 Mt/a for each year except Year 15 where only 0.91 Mt is available to finish Phase 3. |
| Fenn-Gib Project |
Page 174 | |
| NI 43-101 Technical Report and Pre-Feasibility Study |
December 19, 2025 | |
|
|
| Figure 16-18: | End-of-Year Progression Plan - Year 1 |
Source: AGP, 2025
| Fenn-Gib Project |
Page 176 | |
| NI 43-101 Technical Report and Pre-Feasibility Study |
December 19, 2025 | |
|
|
| Figure 16-19: | End-of-Year Progression Plan, Year 2 |
Source: AGP, 2025
| Fenn-Gib Project |
Page 177 | |
| NI 43-101 Technical Report and Pre-Feasibility Study |
December 19, 2025 | |
|
|
| Figure 16-20: | End-of-Year Progression Plan, Year 3 |
Source: AGP, 2025
| Fenn-Gib Project |
Page 178 | |
| NI 43-101 Technical Report and Pre-Feasibility Study |
December 19, 2025 | |
|
|
| Figure 16-21: | End-of-Year Progression Plan, Year 4 |
Source: AGP, 2025
| Fenn-Gib Project |
Page 179 | |
| NI 43-101 Technical Report and Pre-Feasibility Study |
December 19, 2025 | |
|
|
| Figure 16-22: | End-of-Year Progression Plan, Year 5 |
Source: AGP, 2025
| Fenn-Gib Project |
Page 180 | |
| NI 43-101 Technical Report and Pre-Feasibility Study |
December 19, 2025 | |
|
|
| Figure 16-23: | End-of-Year Progression Plan, Year 6 |
Source: AGP, 2025
| Fenn-Gib Project |
Page 181 | |
| NI 43-101 Technical Report and Pre-Feasibility Study |
December 19, 2025 | |
|
|
| Figure 16-24: | End-of-Year Progression Plan, Year 7 |
Source: AGP, 2025
| Fenn-Gib Project |
Page 182 | |
| NI 43-101 Technical Report and Pre-Feasibility Study |
December 19, 2025 | |
|
|
| Figure 16-25: | End-of-Year Progression Plan, Year 8 |
Source: AGP, 2025
| Fenn-Gib Project |
Page 183 | |
| NI 43-101 Technical Report and Pre-Feasibility Study |
December 19, 2025 | |
|
|
| Figure 16-26: | End-of-Year Progression Plan, Year 9 |
Source: AGP, 2025
| Fenn-Gib Project |
Page 184 | |
| NI 43-101 Technical Report and Pre-Feasibility Study |
December 19, 2025 | |
|
|
| Figure 16-27: | End-of-Year Progression Plan, Year 10 |
Source: AGP, 2025
| Fenn-Gib Project |
Page 185 | |
| NI 43-101 Technical Report and Pre-Feasibility Study |
December 19, 2025 | |
|
|
| Figure 16-28: | End-of-Year Progression Plan, Year 15 (Ultimate Pit) |
Source: AGP, 2025
| 16.10 | Blasting and Explosives |
Mining will be on 10 m benches in waste and 5 m benches in ore. Blasting will be to the 10 m bench height. Blast patterns have been estimated for the purposes of generating a PFS level equipment plan and cost estimate. Waste drill and blast patterns have been estimated at 5.0 x 4.5 m (spacing x burden) and ore patterns are 4.7 x 4.3 m (spacing x burden). Holes will be 10 m long plus an additional 0.9 m for sub-drill for a total length of 10.9 m using a 165 mm bit.
| Fenn-Gib Project |
Page 186 | |
| NI 43-101 Technical Report and Pre-Feasibility Study |
December 19, 2025 | |
|
|
Powder factors are estimated at 0.32 kg/t for waste material and 0.33 kg/t for ore material using bulk emulsion explosives. It is recommended to use emulsion due to the expected wet conditions.
It has been assumed that wall control drill and blast methods will be required for final walls. For purposes of this study, the Pre-shear method has been assumed. Pre-shear holes will be 10 m deep, spaced 2.00 m apart and be separated from production blasts by 2.3 m. The powder charge will be 24 kg/hole in a decoupled manner.
| 16.11 | Mining Equipment |
This section outlines the fleet requirements estimated to support the open pit mine production plan, including indicative parameters for drilling, blasting, loading, and hauling. The purpose of the equipment selection at this study level is to provide a cost estimate appropriate for a PFS, rather than to design an optimized mining fleet.
For purposes of estimating typical fleet requirements, all equipment is assumed to be owned, operated, and maintained by Mayfair Gold. The mining fleet is planned as a diesel only to minimize the site’s electrical demand.
Open pit mine operations are based on 365 days/a, operating two 12-hour shifts/day, seven days/week, with an average of three operating days lost annually due to inclement weather.
Drilling will be carried out using 165 mm down the hole hammer (DTH) drills. This allows fro drilling 10 m bench heights, however, additional steel must be added from the drill carousel.
The primary loading units will be two 16 m3 diesel hydraulic shovels. Additional loading will be completed by two 13 m3 front-end loaders. It is expected that one of the loaders will be at the primary crusher for most of its operating time. The haulage trucks will be conventional 92-tonne rigid body trucks.
The support equipment fleet will be responsible for the usual road, pit, and dump maintenance requirements, but due to the climatic conditions expected, the support equipment will have a larger role in snow removal and water management. Snowplows and additional graders have been included in the fleet. In addition, smaller road maintenance equipment is included to keep drainage ditches open and sedimentation ponds functional. A separate TSF maintenance fleet of articulated trucks, quarry trucks and compactors has been included as part of the overall mining fleet.
| 16.12 | Grade Control |
Grade control will be conducted using a dedicated reverse circulation (RC) drill rig. In areas of known mineralization drilling will follow a 10 x 5 m pattern, with 1 m samples collected from each hole inclined at 60°.
In areas of low-grade mineralization or waste, the spacing will increase to 20 x 10 m with samples taken every 6 m to identify any previously undiscovered veinlets or mineralized zones.
These grade control holes serve to define the mill feed grade and mineralization contacts.
All samples will be sent to the assay laboratory for analysis and incorporated into the short-range mining model.
| Fenn-Gib Project |
Page 187 | |
| NI 43-101 Technical Report and Pre-Feasibility Study |
December 19, 2025 | |
|
|
Blasthole sampling will also be included in the initial grade control program to determine the most effective method for the planned Fenn-Gibb operations.
| Fenn-Gib Project |
Page 188 | |
| NI 43-101 Technical Report and Pre-Feasibility Study |
December 19, 2025 | |
|
|
| 17 | RECOVERY METHODS |
| 17.1 | Overview |
The process flowsheet for the Project is based on the metallurgical test work discussed in Section 13. Based on the PFS metallurgical testwork program results, the process flowsheet selected includes crushing and grinding, followed by flotation, regrind and cyanide leaching of the rougher concentrate. Gravity concentration is included in the process design as a provisional allowance; however, the gravity circuit will not be included in the initial project. Provision for this circuit will be incorporated into the process and construction designs to allow for future installation as part of sustaining capital, should the presence of sufficient coarse free gold suitable for gravity concentration be confirmed.
| 17.2 | Process Design Criteria |
Table 17-1 presents a summary of process design criteria for the Fenn-Gib process plant.
| Table 17-1: | Process Design Criteria |
| Parameter |
Units | Value | ||
| Plant capacity |
Mt/a | 1.8 | ||
| t/d | 4,800 | |||
| Life of mine |
years | 15 | ||
| Gold head grade, design |
g/t | 1.65 | ||
| Silver head grade, design |
g/t | 0.5 | ||
| Gravity concentration gold recovery |
% | 10 | ||
| Flotation gold recovery |
% | 96 | ||
| Leach gold recovery |
% | 90 | ||
| Crushing availability |
% | 67 | ||
| Grinding availability |
% | 92 | ||
| JK AxB, design |
— | 22.7 | ||
| Bond crushing work index (CWi), design |
kWh/t | 30.9 | ||
| Bond ball work index (BBWi), design |
kWh/t | 19.0 | ||
| Bond rod mill work index (BRWi), design |
kWh/t | 21.9 | ||
| Bond abrasion index (Ai), design |
g | 0.335 | ||
| Specific gravity, design |
— | 2.77 | ||
| Ore moisture |
% by weight | 5 | ||
| Crushing feed size, F80 |
mm | 370 | ||
| Crushing product size, P80 |
mm | 12 | ||
| Ball mill recirculating load, design |
% | 350 |
| Fenn-Gib Project |
Page 189 | |
| NI 43-101 Technical Report and Pre-Feasibility Study |
December 19, 2025 | |
|
|
| Parameter |
Units | Value | ||||
| Grinding product size, P80 |
µm | 106 | ||||
| Primary cyclone overflow density |
% solids by weight | 35 | ||||
| ILR gold recovery |
% | 10 | ||||
| Rougher flotation mass pull, design |
% | 29 | ||||
| Rougher flotation laboratory bench test residence time |
minutes | 20 | ||||
| Rougher flotation residence time, scale up factor |
— | 2.5 | ||||
| Gold concentrate thickener settling rate |
t/m2/h | 0.5 | ||||
| Flotation tailings thickener settling rate |
t/m2/h | 0.5 | ||||
| Regrind product size, P80 |
µm | 13 | ||||
| Regrind specific energy |
kWh/t | 22.3 | ||||
| Pre-Aeration/Leach/CIL total residence time |
h | 27 | ||||
| Pre-Aeration/Leach/CIL tanks |
No. | |
8 (1 x pre-aeration, 1 x leach, 6 x CIL) |
| ||
| Leach sodium cyanide addition, design |
kg/t | 0.90 | ||||
| Leach lime addition, design |
kg/t | 0.85 | ||||
| Elution column capacity |
t | 2 | ||||
| Cyanide detoxification thickener settling rate |
t/m2/h | 0.3 | ||||
| Cyanide detoxification underflow density target |
% solids by weight | 55 | ||||
| Cyanide detoxification residence time |
hours | 1.5 | ||||
| Number of cyanide detoxification tanks |
— | 2 | ||||
| Cyanide detoxification equivalent SO2 addition, design |
g equivalent SO2/g CNWAD |
7.5 | ||||
| Cyanide detoxification lime addition, design |
g/g SO2 | 5 | ||||
| Cyanide detoxification CuSO4 addition, design |
mg/L Cu2+ | 25 | ||||
| Discharge CNWAD concentration target, design |
mg/LCNWAD | 5 | ||||
| 17.3 | Process Plant Description |
The process flowsheet consists of the following circuits:
| | Three-stage crushing of run-of-mine (ROM) ore. |
| | A waste diverter chute to allow for crushing of aggregate material for use on site. |
| | A crushed ore stockpile to provide buffer capacity (24 hours) ahead of the grinding circuit. |
| | Ball mill with trommel screen and cyclone classification. |
| | Provision for future installation of gravity concentration and intensive leaching of the gravity concentrate. |
| | Trash screening and rougher flotation. |
| Fenn-Gib Project |
Page 190 | |
| NI 43-101 Technical Report and Pre-Feasibility Study |
December 19, 2025 | |
|
|
| | Flotation concentrate handling and regrind. |
| | Leach and carbon adsorption (L/CIL) of reground flotation concentrate. |
| | Acid washing of loaded carbon and AARL type elution followed by electrowinning and smelting to produce doré. |
| | Carbon regeneration by rotary kiln. |
| | Cyanide destruction of tailings using the SO2/air process. |
| | Tailings disposal. |
| 17.3.1 | Process Flowsheet |
The overall process flow diagram for the Project is provided in Figure 17-1 and is further discussed in subsequent sections.
Figure 17-1: Overall Process Flow Diagram
Source: Ausenco, 2025
| Fenn-Gib Project |
Page 191 | |
| NI 43-101 Technical Report and Pre-Feasibility Study |
December 19, 2025 | |
|
|
| 17.3.2 | Plant Design |
| 17.3.2.1 | Crushing Circuit |
The crushing circuit consists of three-stage crushing that reduces ROM ore from a feed 80% passing size (F80) of 370 mm to a product 80% passing size (P80) of 12 mm.
ROM ore is hauled from the mine to the ROM pad and subsequently rehandled by loader(s)into a ROM feed bin. The ROM bin discharges onto a vibrating grizzly feeder, from which the oversize reports to the primary jaw crusher. The primary crushing area is designed to accommodate for waste and aggregate crushing during the construction period and during downstream cone crusher maintenance periods. The vibrating grizzly feeder undersize bypasses the crusher and discharges directly onto the primary crusher discharge conveyor. The combined product passes through a waste crushing diverter, which discharges the material onto the secondary screen feed conveyor or onto the waste take-off conveyor for aggregate use, depending on the feed.
Material sent to the secondary screen feed conveyor is transferred to the secondary screen where it is screened using a vibrating double deck screen. The top deck oversize is conveyed to the secondary crushing circuit, the bottom deck oversize is conveyed to the tertiary crushing circuit, and the undersize is conveyed directly to the crushed ore stockpile. All crushed material from the secondary and tertiary circuits is recycled to the secondary screen feed conveyor to ensure the target crush size is maintained. All crushed ore is then conveyed to the crushed ore stockpile.
The crushing circuit has been designed with additional capacity in the primary crusher to accommodate waste material. These waste products will be used for the TSF construction and other operational requirements. Crushed waste material will be stockpiled for subsequent processing as required for the end-use application as needed.
Major equipment in this area includes:
| | one ROM feed bin |
| | one vibrating grizzly feeder |
| | one primary jaw crusher (C150 or equivalent, 162 kW) |
| | one diverter and waste take-off conveyor |
| | one secondary screen |
| | one screen feed conveyor |
| | two crusher feed conveyors |
| | two crusher vibrating pan feeders |
| | two cone crushers (HP350e Cone Crusher or equivalent, 286 kW) |
| | one fines transfer conveyor |
| Fenn-Gib Project |
Page 192 | |
| NI 43-101 Technical Report and Pre-Feasibility Study |
December 19, 2025 | |
|
|
| | one crushed ore stockpile feed conveyor |
| | covered crushed ore stockpile. |
| 17.3.2.2 | Grinding Circuit |
The grinding circuit consists of a ball mill with cyclone classification circuit to produce a P80 of 106 µm.
Two reclaim feeders withdraw crushed ore from the crushed ore stockpile to feed the ball mill with the ball mill feed conveyor. The ball mill discharge passes through a trommel screen, with undersize reporting to the cyclone feed pumpbox, whereas the oversize is removed from the circuit as scats. The mill discharge is diluted and pumped to the primary cyclone cluster. Cyclone overflow is sent to the rougher flotation circuit while the underflow returns to the ball mill feed chute. An allowance has been made to install a split on the cyclone underflow to send approximately one third of this material to a gravity circuit should future testwork determine it to provide incremental economic benefit.
Major equipment in this area includes:
| | two reclaim feeders |
| | one ball mill feed conveyor |
| | one ball mill (6.10 m dia. x 8.23 m EGL, 5.5 megawatt (“MW”)) |
| | one primary cyclone cluster. |
| 17.3.2.3 | Rougher Flotation and Regrind |
The cyclone overflow is discharged to a conditioning tank ahead of the rougher flotation circuit. The rougher flotation circuit consists of a single train of conventional tank cells. Frother, two gold specific collector-promoters, and a sulphide collector are added to the conditioning tank prior to flotation. The concentrate from each flotation cell is collected and pumped to the concentrate thickener to achieve an underflow density of 50% solids by weight ahead of the regrind mill. The concentrate thickener underflow is pumped to the regrind mill to achieve a regrind P80 of 13 µm. The discharge from the regrind mill is then sent to the leach-CIL circuit for gold leaching. Tailings from the flotation circuit are collected in a rougher tails pumpbox and pumped to the flotation tailings thickener, where a density of 55% solids by weight slurry density is achieved prior to tailings disposal.
Major equipment in this area includes:
| | one conditioning tank |
| | five rougher flotation cells |
| | one flotation concentrate thickener |
| | one concentrate regrind mill (1,600 kW) |
| | one flotation tailings thickener. |
| Fenn-Gib Project |
Page 193 | |
| NI 43-101 Technical Report and Pre-Feasibility Study |
December 19, 2025 | |
|
|
| 17.3.2.4 | Gravity and Intensive Leach (provision included for future installation) |
The gravity circuit is fed by the cyclone cluster underflow via gravity through the gravity circuit scalping screen. The undersize of the scalping screen is fed to the gravity concentrator, whereas the oversize is combined with the gravity concentrator tailings and returned to the cyclone feed pumpbox. The concentrate from the gravity concentrator is then transferred to the intensive leach reactor (ILR) where sodium hydroxide, sodium cyanide, and leach aid are added to leach the concentrate, creating a pregnant solution. The pregnant solution is pumped to a pregnant solution tank, where it feeds the ILR electrowinning cell located in the gold room. ILR tailings are pumped to the concentrate regrind mill feed pumpbox to enter the leach-CIL circuit to recover remaining gold
Major equipment in this area includes:
| | one gravity scalping screen |
| | one gravity concentrator |
| | one intensive leach reactor. |
| 17.3.2.5 | Leach and Adsorption |
The discharge from the regrind mill is fed to the leach and adsorption circuit, which consists of eight tanks; a pre-aeration tank, leach tank, and six carbon in leach (CIL) tanks. The regrind mill discharge is fed into the pre-aeration tank while barren carbon is introduced to the final CIL tank. The carbon advances counter current to the main process flow via carbon slurry transfer pumps, increasingly loading with gold until the carbon reaches the first CIL tank. Loaded carbon is removed from this tank and washed over a recovery screen, where oversize carbon is forwarded to the elution circuit and washed slurry is returned to the leach tank. Tailings slurry from the final adsorption tank flows by gravity to the cyanide detoxification circuit.
Air is added into the pre-aeration tank, leach tank, and the first three CIL tanks to promote the gold loading, lime is used in the pre-aeration tank, leach tank, and the first and third CIL tanks to control the pH of the leach solution, while sodium cyanide is added to the leach tank and the first two CIL tanks to dissolve gold into solution.
Major equipment in this area includes:
| | one pre-aeration tank |
| | one leach tank |
| | six CIL tanks |
| | one loaded carbon screen. |
| 17.3.2.6 | Acid Wash, Elution, Regeneration, and Electrowinning |
Carbon from the lead CIL tank is processed using an acid wash, Anglo American Research Laboratories (AARL) elution and carbon regeneration circuit.
| Fenn-Gib Project |
Page 194 | |
| NI 43-101 Technical Report and Pre-Feasibility Study |
December 19, 2025 | |
|
|
The oversize from the loaded carbon screen reports to the acid wash column to first be washed with a nitric acid (HNO3) solution to remove alkaline metals and salts, improving elution efficiency and reducing the potential for fouled carbon surfaces. Washed carbon is then transferred to the elution column where it is soaked in a solution of sodium hydroxide
(NaOH) and sodium cyanide (NaCN) heated to 120°C. After the soak, solution is transferred to the pregnant solution tank, the carbon is eluted with water heated to 120°C. Eluate from this part of the strip is also forwarded to the pregnant solution tank.
The stripped carbon is hydraulically transferred from the elution column to a regeneration kiln via a dewatering screen where the surface is reactivated at a temperature of 700°C. Regenerated carbon is quenched and pumped, along with fresh carbon added to replenish losses, to the carbon sizing screen where the undersized fragments are screened out before the carbon is added to the last tank in the CIL circuit.
There are dedicated electrowinning cells for both the carbon elution pregnant solution and (possible future) ILR pregnant solution. Pregnant solution from carbon elution is pumped through respective electrowinning cells where gold sludge is generated at the cathodes. The gold sludge from each cell is then filtered, dried, and smelted into gold bars.
Major equipment in this area includes:
| | one acid washing column |
| | one elution column |
| | one strip solution tank |
| | one elution pregnant solution tank |
| | one ILR pregnant solution tank (future possible) |
| | one carbon dewatering screen |
| | one carbon regeneration kiln |
| | one carbon sizing screen |
| | two electrowinning cells |
| | one gold sludge filter press |
| | one gold smelting furnace. |
| 17.3.2.7 | Cyanide Detoxification |
The cyanide destruction circuit consists of a cyanide detoxification thickener, two agitated tanks operating in parallel, and one carbon safety screen. The discharge from the CIL circuit is sent to the cyanide detoxification thickener prior to the detox tanks. This is designed to allow for potential recirculation of cyanide in the thickener overflow for use within the leach-CIL circuit. Residual cyanide in the thickener underflow is destroyed using the SO2/air process in the cyanide detox tanks. Discharge from these tanks flows over the carbon safety screen to remove carbon prior to tailings deposition. Captured carbon can be manually transferred for re-use or disposal.
| Fenn-Gib Project |
Page 195 | |
| NI 43-101 Technical Report and Pre-Feasibility Study |
December 19, 2025 | |
|
|
Sodium metabisulphite (SMBS) the SO2 source, lime, and air are introduced in each tank to carry out cyanide destruction, with copper sulphate (CuSO4) added as a catalyst. SMBS and air are required reactants in the destruction reaction, and lime is used to provide pH control.
Major equipment in this area includes:
| | cyanide detoxification thickener |
| | two cyanide detoxification tanks |
| | one carbon safety screen. |
| 17.3.2.8 | Tailings Management |
The TSF receives two streams of tailings from the i) undersize of the carbon safety screen and the ii) underflow from the flotation tailings thickener in separate pipelines. Tailings are deposited collected in the TSF facility and water is retrieved and sent to a collection pond prior to being treated in the water treatment plant and discharged to environment. Reclaim water will be recovered from the TSF for use in the processing plant.
| 17.4 | Reagent Handling and Storage |
The reagent handling system includes unloading, storage, mixing, and distribution equipment for each of the required reagents. Respective reagents are situated in a containment area to prevent mixing of incompatible reagents and to avoid any unintended release. Appropriate ventilation, fire, safety protection, eyewash stations, and safety data sheet (SDS) will be situated within the reagent mixing and handling areas. Sumps pumps are located within each containment area for solution capture and control.
Reagents will be delivered in various forms including intermediate bulk containers (IBC), one-tonne semi bulk bags, 25 kg bags, and as bulk deliveries as described in Table 17-2.
| Fenn-Gib Project |
Page 196 | |
| NI 43-101 Technical Report and Pre-Feasibility Study |
December 19, 2025 | |
|
|
| Table 17-2: | Reagent Requirements, Purpose and Consumption |
| Reagent |
Preparation Method |
Use |
Consumption (t/a) | |||
| Hydrated lime |
Received as powder via truck; diluted with raw water and transferred to a storage tank; distributed to concentrate leach and cyanide detox circuits |
pH control | 1,633 | |||
| AERO3501 |
Received as solution in IBC); transferred to a storage tank; distributed to rougher flotation circuit |
Promoter | 35 | |||
| AERO3477 |
Received as solution in IBC; transferred to a storage tank; distributed to rougher flotation circuit |
Promoter | 35 | |||
| Potassium amyl xanthate (PAX) |
Received as powder in bulk bags; mixed with non-cyanide contact process water and transferred to a storage tank; distributed to rougher flotation circuit |
Collector | 79 | |||
| Methyl Isobutyl Carbinol (MIBC) |
Received as solution in IBC; stored in tank; distributed to rougher flotation circuit |
Frother | 105 | |||
| Flocculant |
Received as powder in bulk bags; mixed with raw water and transferred to a storage tank; distributed to concentrate thickener, tailings thickener, and cyanide detoxification thickener |
Settling aid | 5.5 | |||
| Sodium cyanide |
Received as powder in bulk bags; mixed with process water; distributed to ILR, leach, and CIL tanks and elution column |
Leaching agent | 1,203 | |||
| Sodium hydroxide |
Received as liquid in tote; transferred to a storage tank; distributed to elution, pregnant solution tanks, and ILR |
pH control | 114 | |||
| Sodium metabisulphite |
Received as powder in bulk bags; mixed with cyanide contact process water; distributed to cyanide detoxification |
Cyanide destruction agent |
606 | |||
| Copper sulphate |
Received as powder in bags on pallet; mixed with cyanide contact process water; distributed to cyanide detoxification | Arsenic precipitation catalyst |
9 | |||
| Nitric acid |
Received as solution in IBC; transferred to a storage tank; distributed to elution |
Carbon washing | 92 | |||
| Activated carbon |
Received as solids; batch transfer to leach/CIL circuit for gold adsorption |
Gold adsorbent | 13 | |||
| Fluxes |
Received as solids; used in gold room to produce slag and capture metal impurities |
Slag formation in refining |
60 |
| 17.5 | Plant Services |
| 17.5.1 | Water requirements |
| 17.5.1.1 | Process Water |
Process water is stored in two tanks, a cyanide contact water tank and a non-cyanide contact water tank.
The cyanide contact water tank receives water from the raw water intake and the cyanide detoxification thickener overflow and is used for dilution of the regrind mill feed hopper, loaded carbon, carbon safety and carbon sizing screen washes, as well as in the preparation of SMBS, CuSO4, and NaCN reagents.
The non-cyanide contact water tank receives water from the flotation concentrate thickener overflow, flotation tailings thickener overflow, and tailings water reclaim, and is used for grinding dilution, rougher flotation usage, PAX mixing and dilution, and for gland water.
| Fenn-Gib Project |
Page 197 | |
| NI 43-101 Technical Report and Pre-Feasibility Study |
December 19, 2025 | |
|
|
| 17.5.1.2 | Gland Water |
Gland seal water for the plant is sourced from the non-cyanide contact water tank and pumped to the various users across the plant site.
| 17.5.1.3 | Raw Water |
Raw water is supplied to the plant and stored in a raw water tank where it is distributed to the various users across the site such as reagent preparation, elution, ILR, process water makeup, and potable water. Water requirements were estimated at 43.76 m3/h or 0.21 m3/t processed for operation, with the majority going towards process water makeup demand.
| 17.5.1.4 | Fire Water |
Fire water for the process plant is stored in a dedicated volume within the raw water tank. A dedicated pump skid consisting of an electrical pump, jockey pump, and diesel pump supplies water from the fire water reserve volume to the distribution system.
| 17.5.1.5 | Potable Water |
Potable water is produced by an on-site potable water plant which processes water from the raw water tank. Processed potable water is stored in a dedicated storage tank before being distributed to the various end users in the process plant.
| 17.5.2 | Power requirements |
The total installed load for the process plant is estimated at 15.1 MW with a breakdown per area summarized in Table 17-3. The facility, excluding non-processing ancillary services, has an estimated power consumption of 42 kWh/t with a nominal operating demand of 9.5 MW. The gravity circuit will demand an additional 81 kW and 0.4 kWh/t.
| Table 17-3: | Power Requirement by Plant Area |
| Plant Area |
Installed (kW) | |||
| Crushing |
1,309 | |||
| Grinding |
6,062 | |||
| Flotation and Regrind |
2,496 | |||
| Leach and Adsorption |
265 | |||
| Desorption |
605 | |||
| Goldroom |
283 | |||
| Detox and Tailings |
421 | |||
| Reagents |
156 | |||
| Process Plant Services |
1,657 | |||
| Ancillaries |
1,874 | |||
|
|
|
|||
| Total |
15,248 | |||
|
|
|
|||
| Fenn-Gib Project |
Page 198 | |
| NI 43-101 Technical Report and Pre-Feasibility Study |
December 19, 2025 | |
|
|
| 17.5.3 | Compressed Air |
High pressure air at 750 kPa is produced by compressors on site to meet plant air requirements. The high-pressure air supply is dried and used to satisfy both plant air and instrument air demand. Dried air is distributed via the air receivers located throughout the plant.
Low pressure air for flotation is provided by dedicated air blowers, headers and automated air control valves on each flotation cell.
| Fenn-Gib Project |
Page 199 | |
| NI 43-101 Technical Report and Pre-Feasibility Study |
December 19, 2025 | |
|
|
| 18 | PROJECT INFRASTRUCTURE |
| 18.1 | Introduction |
Facilities and infrastructure required for the Project include the following:
| | Open pit. |
| | Process facilities (process plant, crusher facilities, crushed ore stockpile, process plant warehouse and workshop). |
| | Mine maintenance facilities (truckshop, mine workshop and warehouse, mine dry, and miscellaneous facilities). |
| | Material stockpiles and mine rock storage area (MRSA). |
| | Overburden storage areas to be used with progressive closure and active mine closure activities. |
| | Grid connection for electricity supply. |
| | Fuel storage facility in accordance with technical standards and safety association requirements (diesel for mobile equipment, propane or compressed natural gas for heating). |
| | Temporary waste storage until disposed off-site at licensed facility. |
| | Runoff and seepage collection systems. |
| | Water management ponds. |
| | Tailings storage facility. |
| | Domestic water well and potable water treatment plant. |
| | Dewatering well(s)/interception wells around open pits. |
| | Seepage collection wells around the TSF. |
| | Domestic sewage disposal system. |
| | Water treatment plant (WTP) and effluent discharge point in accordance with MECP and ECCC requirements (base case option is a discharge pipeline to Pike River, consultation is planned). |
| | Site haul roads including interconnections and relocation of Highway 101. |
| | Explosives storage facility (manufacturing facility under evaluation). |
| Fenn-Gib Project |
Page 200 | |
| NI 43-101 Technical Report and Pre-Feasibility Study |
December 19, 2025 | |
|
|
| Figure 18-1: | Preliminary Facilities and Infrastructure Layout |
Source: Mayfair, 2025
| Fenn-Gib Project |
Page 201 | |
| NI 43-101 Technical Report and Pre-Feasibility Study |
December 19, 2025 | |
|
|
| Figure 18-2: | Infrastructure Plan for the Fenn-Gib Project |
Source: Mayfair, 2025
| Fenn-Gib Project |
Page 202 | |
| NI 43-101 Technical Report and Pre-Feasibility Study |
December 19, 2025 | |
|
|
| 18.2 | Site Access |
The Fenn-Gib property is located near the town of Matheson and 80 km east of Timmins. The primary access to the site is via Highway 101, which connects with the Trans-Canada Highway at Matheson 20 km to the west, and the project site is connected to Highway 101 via an access road. These routes are well-maintained in all seasons.
The Ontario Northland Rail Line, with interchanges with CN at North Bay and Rouyn-Noranda, passes through the town of Matheson providing rail access for passengers and cargo. The Timmins Victor M. Power Airport, located approximately an hour drive away in Timmins, is a regional hub that offers multiple flights a day to major Ontario cities, including Toronto’s Pearson International Airport. Carriers serving this airport include Air Canada, Porter, and Air Creebec.
There is an existing Hydro One power line running alongside Highway 101 that will be upgraded to provide the required construction power for the project. A new power line will need to be constructed to provide the full project power requirements.
There are multiple site access methods for personnel and equipment outside the project region and additional local supplies, labour, and service providers are available in the town of Matheson and other neighbouring towns and communities. For the Construction and Operation phases of the Project, it is expected that personnel working on the site will be employed and contracted from points of hires within Ontario and Quebec, regionally from the Timmins, Kirkland Lake, Rouyn-Noranda, Cochrane and other regional and local communities. The Project is expected to use regional bussing to coordinate construction labour to the Project Site. Materials (such as reagents) will be transported to site via Highway 101 and the Trans-Canada Highway.
Development plans for the pits will require a 5 km segment of Highway 101 to be re-routed to maintain a safe setback from the ultimate open pit footprint. The alternative alignments (Figure 18-2) will be reviewed with the Ministry of Transportation (MTO) and Ministry of Natural Resources (MNR), as well as third party landowners.
| 18.3 | Built Infrastructure |
| 18.3.1 | Process Plant Earthworks |
The typical method of clearing, topsoil removal, and excavation will be employed, incorporating drains, safety bunds, and backfilling with granular material and aggregates for road structure. Access roads to the project site from Highway 101 will be constructed. It is expected that forest clearing and topsoil removal will be required to allow the process plant and other buildings and facilities to be constructed.
Civil work for the process plant and crushing area includes designs for the following infrastructure:
| | Light vehicle and heavy equipment roads. |
| | Access roads. |
| Fenn-Gib Project |
Page 203 | |
| NI 43-101 Technical Report and Pre-Feasibility Study |
December 19, 2025 | |
|
|
| | Ore and MRSAs. |
| | Mine facility platforms and process facility platforms. |
| 18.3.2 | Buildings |
The project plans to construct only essential infrastructure and buildings on the project site with non-essential facilities, such as services for light vehicle maintenance, hospital and emergency care, long-term storage and warehousing will be in Matheson. The project buildings are summarized below in Table 18-1.
| Table 18-1: | Project Building List |
| Description |
Location | Building Construction |
Length (m) |
Width (m) |
Height (m) |
Area (m2) |
||||||||||||||
| Primary, Secondary and Tertiary Crusher Building |
Crushing | Fabric | 36 | 20 | 16 | 720 | ||||||||||||||
| Secondary Screen Building |
Crushing | Fabric | 18 | 15 | 16 | 270 | ||||||||||||||
| Stockpile Cover Building |
Plant | Fabric | 60 | 60 | 22 | 3,600 | ||||||||||||||
| Process Plant Building |
Plant | Pre-Engineered | 80 | 30 | 25 | 2,400 | ||||||||||||||
| Reagent Warehouse |
Plant | Fabric | 24 | 14 | 4 | 336 | ||||||||||||||
| Truck Shop & Warehouse |
Plant | Fabric | 48 | 35 | 17 | 1,680 | ||||||||||||||
| Truck Wash |
Plant | Fabric | 24 | 24 | 12 | 576 | ||||||||||||||
| Plant Warehouse and Maintenance Building |
Plant | Fabric | 42 | 24 | 10 | 1,008 | ||||||||||||||
| Security Gatehouse |
Plant | Modular Building | 7 | 3 | 4 | 21 | ||||||||||||||
| Mine Office and Change Rooms |
Plant | Modular Building | 29 | 18 | 4 | 522 | ||||||||||||||
| Process Plant Main Electrical Room |
Plant | Integrated E-Room | 30 | 6 | 4 | 171 | ||||||||||||||
| Leaching E-Room |
Plant | Integrated E-Room | 15 | 6 | 4 | 86 | ||||||||||||||
| Crushing E-Room |
Crushing | Integrated E-Room | 15 | 6 | 4 | 86 | ||||||||||||||
| 18.3.3 | Accommodation |
The construction phase of the Project will include a construction camp for the regional labour that is outside the daily drive limit. The construction camp will have an allowance for an expected capacity of approximately 400 individuals. The camp is planned to be needed for 24 months. The Camp and its services will be housed off the Project site (within the municipal boundaries of Matheson) and are expected to be owned and operated by a third party.
Personnel will travel to the project site in crew vans and buses to minimize traffic to the extent practical.
As it is planned to employ workers from local communities as much as possible, there is no operations accommodations camp anticipated at this time.
| Fenn-Gib Project |
Page 204 | |
| NI 43-101 Technical Report and Pre-Feasibility Study |
December 19, 2025 | |
|
|
| 18.4 | Waste Rock and Other Mine Stockpiles |
| 18.4.1 | Run-of-Mine and Mine Rock Storage |
The ROM ore stockpile and coarse ore stockpile areas will consist of granular fill pads constructed from non-PAG mine rock. The ROM ore stockpile will be an active storage area for recently mined ore prior to delivery to the primary crusher. The coarse ore stockpile will include a covered storage area for crushed ore prior to delivery to the process plant.
The ROM ore stockpile has been sized for temporary storage of approximately 400,000 t.
Mine rock will be rock removed to access the ore zones; this material will not be processed but will be stored on surface once excavated. An estimated 152 Mt (77 Mm3) of mine rock will be produced over the mine life. It is anticipated that approximately 22 Mt (11 M m3) of non-PAG mine rock will be used for site construction purposes pending detailed design. Included in this quantity is 17 Mt (8 Mm3) of mine rock that will be used for TSF embankment construction. Mine rock that is not used for construction will be stored in the MRSA.
Geochemical characterization of the mine rock is currently in progress. The waste management strategy includes for up to 25 Mt of potentially acid generating (PAG) mine rock over the mine life. The TSF arrangement includes for storage of approximate 7 Mt of PAG mine rock during the first nine years of the mine. If required, the remainder of the PAG mine rock will be stored in designated areas for the MRSA. The PAG mine rock within the MRSA will be capped with silt and/or clay fill and organic soils at closure to impede infiltration of surface water and minimize the potential for PAG conditions to develop.
Surface water runoff from the ROM ore stockpile, coarse ore stockpile and MRSA will be directed to the open pit by a series of runoff water management ditches or collected in sumps and transferred to the water management pond (WMP). Water that reports to the open pit will be transferred to the Plant Site Pond.
| 18.4.2 | Overburden |
Overburden stockpiles will provide storage for organic material and soils including glacial till, silt and clay, sand, and gravel removed from the open pit area during site preparation and pit stripping. These stockpiles will be graded and vegetated with non-invasive vegetation to minimize erosion and preserve soil fertility until the material is used for progressive and final rehabilitation purposes.
Surface water management ditches will be installed around the overburden stockpiles. Collected water will be transferred from collection sumps and ponds to the plant site pond or the water management pond.
| 18.5 | Tailings and Storage Facilities |
| 18.5.1 | Tailings Storage Facility |
The TSF will function as an integrated waste management facility, providing co-disposal capacity for both tailings and PAG mine rock. The facility will be sized to accommodate approximately 25 Mt of tailings for the 15 year mine life and
| Fenn-Gib Project |
Page 205 | |
| NI 43-101 Technical Report and Pre-Feasibility Study |
December 19, 2025 | |
|
|
7 Mt of PAG mine rock during the first half of the mine life. Approximately 27 Mt (equivalent to 13 Mm3) of non-PAG mine rock, earth fill, and processed or imported aggregate will be used to construct the TSF perimeter embankments. The perimeter embankments will consist of zoned rockfill embankments, a geosynthetic liner system to minimize seepage through the embankments. The embankments will be raised using downstream construction methods. Silt and clay from the open pit stripping will be placed over the base of the TSF basin to limit seepage from within the basin. Internal separation berms may be constructed using PAG mine rock to manage tailings deposition and maintain a designated water reclaim area within the TSF as part of the integrated waste management strategy. The TSF arrangement is shown on Figure 18-3 and the typical embankment section is illustrated on Figure 18-4.
A series of ditches and seepage collection sumps will be located around the perimeter of the TSF to collect surface water runoff from the perimeter embankments and near surface seepage. Collected water will be pumped back into the TSF from the collection sumps or conveyed to the WMP.
The TSF will include an operating pond with sufficient capacity to supply reclaim water to the Process Plant. Temporary storage capacity will be included in the impoundment and manage stormwater resulting from the Environmental Design Flood (EDF) event. The TSF will include additional freeboard and an Emergency Overflow Spillway to safely manage stormwater from the Inflow Design Flood (IDF) event.
Tailings will be pumped and deposited into the TSF as slurry via HDPE pipelines. Supernatant water, comprising of process water plus meteoric inputs, will be reclaimed to the Process Plant to provide most of the process water and to manage storm water inputs.
| Fenn-Gib Project |
Page 206 | |
| NI 43-101 Technical Report and Pre-Feasibility Study |
December 19, 2025 | |
|
|
| Figure 18-3: | Site General Arrangement |
Source: KP, 2025
| Fenn-Gib Project |
Page 207 | |
| NI 43-101 Technical Report and Pre-Feasibility Study |
December 19, 2025 | |
|
|
| Figure 18-4: | Typical TSF Embankment Section |
Source: KP, 2025
It is anticipated that two tailings’ streams will be delivered to the TSF: a rougher flotation tailings slurry (non-PAG tailings) and a leach tailings slurry (PAG tailings). The leach tailings will be treated through a cyanide destruction circuit prior to tailings slurry being pumped to the TSF. The rougher tailings slurry (non-PAG) will be deposited subaerially along the upstream side of the TSF perimeter embankments to promote settling and maximize the settled dry density of the solids. This will also facilitate the development of tailings beaches along the perimeter of the facility, which will enhance tailings storage and water recovery (including minimizing water lock-up due to freezing during winter months). The leach tailings slurry (PAG) will be deposited sub-aqueously towards the center of the impoundment.
During tailings slurry deposition, discharge points will be re-located to maximize the size of the wetted surface to mitigate fugitive dust. Industry standard tailings additives such as hydroseed tackifiers will be added to tailings slurry when needed to agglomerate tailings solids, thereby preventing entrainment by wind. PAG mine rock will be identified and managed in a designated area within the co-disposal facility that is ultimately encapsulated by tailings to mitigate the risk of ML/ARD.
The TSF will be constructed in stages during the life of the mine on an as needed basis to provide sufficient capacity for tailings and water management. The estimate TSF filling schedule is shown on Figure 18-5. The Hazard Potential Classification for the dams will be determined in accordance with the Lakes and Rivers Improvement Act and in consultation with MEM and MNR. A determination will be made regarding whether dams are “offline” or “online” dams. Dams will be constructed, operated, maintained and monitored in accordance with most recent guidance from Mining Association of Canada, and Canada Dam Association (CDA) guidelines.
| Fenn-Gib Project |
Page 208 | |
| NI 43-101 Technical Report and Pre-Feasibility Study |
December 19, 2025 | |
|
|
| Figure 18-5: | TSF Filling Schedule |
Source: KP, 2025
| 18.6 | Water Management and Diversion Structures |
Site water management practices will be refined following the PFS and will be designed to meet regulatory compliance and environmental stewardship needs. Sumps, ditches, and ponds will be designed and constructed to manage contact water from the site for up to a 100-year 24-hour storm event. The system will include intercepting and/or diverting off-site no-contact water from the site contact water; and capturing, holding and pumping mine impacted water for recycling and/or treatment prior to discharging offsite. The following describes some design considerations for the Site Water Management System:
| | Processing Plant will utilize reclaimed and recycled water from the TSF and the Plant Site Pond. |
| | Fresh water will be needed for specific uses in the process circuit such as gland seal water and potentially coolant water for heat exchangers. This water will be pumped from the Plant Site Pond. |
| Fenn-Gib Project |
Page 209 | |
| NI 43-101 Technical Report and Pre-Feasibility Study |
December 19, 2025 | |
|
|
| | Based on benchmarking of settled tailings properties from similar operations in the region, water losses to interstitial space in tailings solids are anticipated to be approximately 1,690 m3/day when the processing plant is operating at capacity. |
| | Groundwater seepage into the active Pit is expected to be approximately 1,400 m3/day during the early years of operations, up to 3,700 m3/day as Pit development nears completion. |
| | While not included in the current designs, cut-off wells will be considered for operational water control systems for the open pit. |
| | Seepage and runoff from the MRSA and other mine contact water will be collected in ditches, sumps and ponds. The excess water will be pumped to a designated collection facility and/or Water Treatment Plant for potential treatment prior to being discharged. |
| | Water discharge is expected to be primarily driven by precipitation and will be proportional to flow in the surrounding environment. This will be further evaluated in detail once the hydrogeologic model to predict groundwater seepage into the mine is refined. |
A preliminary water balance for the Project during Year 4 of operations is presented in Figure 18-6, while Figure 18-7 illustrates the anticipated water balance by Year 16. These figures reflect the evolving nature of site hydrology and infrastructure as the Project matures.
| Fenn-Gib Project |
Page 210 | |
| NI 43-101 Technical Report and Pre-Feasibility Study |
December 19, 2025 | |
|
|
Figure 18-6: Preliminary Water Balance at Year 4 of Operations
Source: KP, 2025
| Fenn-Gib Project |
Page 211 | |
| NI 43-101 Technical Report and Pre-Feasibility Study |
December 19, 2025 | |
|
|
| Figure 18-7: | Preliminary Water Balance at Year 16 of Operations |
Source: KP, 2025
| Fenn-Gib Project |
Page 212 | |
| NI 43-101 Technical Report and Pre-Feasibility Study |
December 19, 2025 | |
|
|
| 18.6.1 | Water Management |
The following provides a summary of the preliminary site water management strategy including anticipated water takings and water treatment. Designs will be updated as engineering advances. Potable water will be delivered to site during the construction phase, and it is expected that a water well will be installed to provide domestic water to the Project Site (office, dry) during operations.
| 18.6.2 | Groundwater |
Where feasible, dewatering well(s) may be strategically placed surrounding the Pit to intercept groundwater before it enters the Pit. This will reduce contact water, potential water treatment and discharge volumes, as well as sustain flow in proximal watercourses to mitigate potential impacts from watershed truncation and mine dewatering. The intercepted water is considered non-impacted as it will be collected prior to contact with mine operations and will be discharge directly to proximal creeks under the appropriate permits. The exact discharge location is under assessment and yet to be determined. This approach is designed to:
| | minimize the volume of water requiring treatment and controlled discharge |
| | sustain base flows in nearby watercourses, helping to mitigate potential impacts from watershed truncation and mine dewatering |
| | support the long-term hydrological balance and ecological health in the surrounding environment. |
| 18.6.3 | Surface Water Takings |
Temporary freshwater intake may be required for the Process Plant commissioning and other initial operations. There is an area north of the Pit which is planned to be excavated as a quarry for clean mine rock for use in site construction, this will become the Plant Site Pond and provide a source of clean water for commissioning.
This will reduce water treatment and discharge volumes, as well as sustain flow in proximal watercourses to mitigate potential impacts from watershed truncation and mine dewatering.
| 18.6.4 | Water Treatment and Disposal Requirements |
The site wide water balance (Figure 18-6 and Figure 18-7) summarizes the water management strategy and will be further detailed as design work is advanced to support permit applications including water discharge requirements for the Project. The water treatment requirements are not fully understood at this time. The baseline water quality data, geochemical testing and analyses will be used to assess the sources terms for water quality modeling. Along with the site water balance, design information (as it considers changes to, or additions to, the site water management plan) will be used to predict the expected future water quality and treatment requirements. An assimilative capacity study of the treated effluent discharge will be required, to derive discharge limits. Then effluent discharge strategies and alternatives will be evaluated in consultation with Indigenous communities, MECP and MNR. Currently, a water discharge pipeline to the Pike River is proposed for the Project.
| Fenn-Gib Project |
Page 213 | |
| NI 43-101 Technical Report and Pre-Feasibility Study |
December 19, 2025 | |
|
|
| 18.7 | Waste Disposal and Management Systems |
An Environmental Management Plan will be developed to minimize waste produced from suppliers and other consumables. It is planned to recycle all materials where possible. Waste will be managed in accordance with the Environmental Protection Act.
| 18.7.1 | Solid Waste |
Solid, non-hazardous waste (e.g. containers, packaging) will be deposited in dedicated bins that are supplied and transported by a licensed carrier in accordance with their Waste Management System Environmental Compliance Approval and disposed of at an approved off-site disposal facility (i.e. third party owned landfill).
Bulk products such as water treatment reagents and petroleum products will be obtained in returnable containers. Where returnable containers are not practical, products will be procured in metal containers to the maximum extent practical. Separate bins will be kept at the Project Site in order to recycle scrap metal and other material (e.g. fluorescent bulbs, batteries) as is practical. Used 20 L petroleum product pails will be returned to suppliers or recycled off-site.
Used equipment batteries will be recycled at an approved recycling facility.
Non-merchantable wood waste will be ground up (or otherwise re-used) and/or utilized as fuelwood in accordance with provincial MECP and MNR requirements. Hydrocarbon spills will be encapsulated using an appropriate clean-up product and rendered inert. The recovered spill clean-up material will be tested in accordance with O. Reg. 347 (as amended) to confirm the waste is not a leachate toxic waste. Spill clean-up residue that is deemed to be non-leachate toxic will be disposed of with solid, non-hazardous waste. Spill clean-up residue that is deemed to be a leachate toxic waste will be disposed of at an approved off-site disposal facility, in accordance with Environmental Protection Act requirements.
Mayfair will consult MECP regarding the establishment of a small landfill (<40,000 m3 capacity) for solid non-hazardous waste within the TSF or alternate suitable location at the Project Site that meets the criteria specified in applicable MECP guidance documents.
| 18.7.2 | Recyclable Materials |
The management of recyclable material at the Site will uphold the 4 R’s of waste management: reduce, reuse, recycle and recover. Procedures will be prepared to identify how materials are sorted, handled and disposed. Recyclable waste will be recovered and transferred to an offsite recycling facility.
| 18.7.3 | Liquid Waste |
Liquid wastes that require off-site disposal will be stored in 205 L drums and/or 1,000 L cubes. Drums/cubes will be located in a designated intermodal shipping container and within secondary containment. There will be no underground waste storage tanks at the Project Site. Wastes will be disposed of in accordance with the Environmental Protection Act and using a Generator Registration Number for the project site.
| Fenn-Gib Project |
Page 214 | |
| NI 43-101 Technical Report and Pre-Feasibility Study |
December 19, 2025 | |
|
|
| 18.7.4 | Hazardous Waste |
Hazardous liquid waste that is generated will be removed and disposed of by a licensed carrier and receiver under a Generator Registration Number on a regular basis so that the Project site is not a waste transfer site under the Environmental Protection Act. Used oil filters will be crushed and completely drained prior to recycling with scrap metal.
Contractors will be responsible for managing hazardous materials in accordance with applicable government legislation. Mayfair will arrange for proper disposal of hazardous waste generated by contractors while working on-site and waste will be disposed of using the Generator Registration Number for the Project Site.
| 18.7.5 | Sanitary Waste |
Sanitary waste (i.e., sewage and grey water) generated in the site preparation phase will be collected in portable infrastructure for offsite disposal at an existing, provincially approved sewage disposal facility.
For the operational phase of the mine, an on-site sewage/grey water disposal bed will be designed and constructed in accordance with Provincial building and environmental codes/regulations. It is also likely that some portion of the sanitary waste generated on site during operations will be collected in portable infrastructure for offsite disposal at an existing, provincially approved sewage disposal facility.
| 18.8 | Power and Electrical |
| 18.8.1 | Facility Power Supply |
The overall project site power requirement of 16 MW is based on the electrical engineering work completed for the processing plant and the broader site infrastructure. Refer to Figure 18-10 for a single line diagram (SLD) illustrating the power connection and site distribution for the Project.
For the purposes of the PFS capital cost estimate, the selected power supply alternative utilizes the existing Hydro One
(HONI) 27.6 kV distribution line originating at the Ramore Transmission Station (TS). To accommodate the additional load, an additional new 115/27.6 kV transformer will be installed at the Ramore TS. From this station a new three-phase circuit will be strung on the existing or modified HONI poles, following the already permitted HONI power corridor along Tamarack Road South, which currently supports the Holtyre Township, Hislop Mine and Black Fox Mine.
At the intersection of Tamarack Road and Highway 101 (Hwy 101), the existing single-phase line currently serving local communities to the east will be upgraded to a three-phase 27.6 kV line. This upgraded line will extend 6 km along Hwy 101 right-of-way (ROW) to project site and will supply construction power. For the 16 MW mine power a separate three phase circuit will run from Ramore to Site utilizing the existing HONI distribution corridor. Refer to Figure 18-9 for the modified 27.6 kV power supply route to the Project, which extends over a total distance of 17 km.
Several alternatives were evaluated for providing electrical power to the Fenn-Gib site, located approximately 17 km east of Matheson, Ontario, and accessible via Hwy 101 and local roads. The objective of the study was to identify the most cost-effective, reliable, and timely solution to meet the Project’s anticipated power requirements for construction and operation.
| Fenn-Gib Project |
Page 215 | |
| NI 43-101 Technical Report and Pre-Feasibility Study |
December 19, 2025 | |
|
|
Four potential hydro-power transmission line routes were analyzed, each with five voltage and ownership configurations (refer to Figure 18-8).
| Figure 18-8: | Power Supply Alternatives Study Routes to the Fenn-Gib Gold Project Site |
Source: TWD, 2025
In addition, two natural-gas-based alternatives were considered; Compressed Natural Gas (CNG) and a dedicated natural gas pipeline. Both natural gas alternatives necessitate installation of an on-site gas-fired power generation facility, which significantly increases capital cost, project complexity, and execution risk. Consequently, these alternatives were deemed economically and logistically unfavorable compared to a direct hydro connection.
| Fenn-Gib Project |
Page 216 | |
| NI 43-101 Technical Report and Pre-Feasibility Study |
December 19, 2025 | |
|
|
The overall analysis considered cost, schedule, technical feasibility, and implementation risk, as well as construction and emergency power needs. Following completion of all evaluations, the preferred alternative for permanent power supply to the Fenn-Gib site is the hydroelectric transmission connection to the provincial grid. The two most suitable configuration options are as follows:
| | 27.6 kV Option: Installation of an additional transformer at the HONI Ramore TS, where 115 kV power along Hwy 11 is stepped down to 27.6 kV. A three-phase distribution line already extends approximately two-thirds of the distance to the Fenn-Gib site. |
| | 115 kV Option: Construction of a new 115 kV transmission line primarily following the existing HONI corridor and Ministry of Transportation (MTO) allowances. |
| | Should the availability or timing of the HONI Ramore TS limit Mayfair Gold’s project schedule, the company will also evaluate, in parallel, the construction of a new 115 kV/27.6 kV transformer station near Ramore. This alternative would utilize the existing HONI right-of-way (ROW) and upgraded pole structures to deliver power to the Fenn-Gib site. |
Under the 115 kV alternative, Mayfair Gold would own the transmission and distribution infrastructure, allowing greater control over schedule, cost, and reliability; however, a new ROW would be required for this alignment and installation. Under the 27.6 kV alternative, HONI would own the facilities but have the advantage of having no extensive environmental assessment (“EA”), as it would be installed within the current ROW.
Although the 115 kV alternative offers lower operating and capital costs, and greater capacity for future expansion, the 27.6 kV power line alternative is used in this PFS.
Construction power demand is estimated at approximately 3 MW, and the current additional capacity at Ramore TS is approximately 3 MW. To support this demand, the existing single-phase line along Hwy 101 will be upgraded to a three-phase 27.6 kV line prior to construction. Operational emergency or standby power (< 1 MW) will be provided by an on-site 600 V diesel generator. The powerline upgrade to supply 3 MW power to the Fenn-Gib site is currently scheduled to be completed in time for the start of construction. However, should the schedule slip for any reason, Mayfair Gold has the option to deploy up to 20 MW of natural gas generators as a bridging capacity until hydro power becomes available.
Ongoing discussions with HONI to confirm connection feasibility, initiate permitting activities if any, and refine capital estimates during the next phase of study. The independent electricity system operator (“IESO”) is currently commissioned to conduct a systems impact assessment (“SIA”), after which HONI will do a Connection Impact Assessment (“CIA”) to confirm the Mayfair Gold requirements and design.
| 18.8.2 | Site Power Reticulation |
Site-wide power distribution to the process plant and maintenance facilities will be via the 4.16 kV overhead powerline using wood pole structures.
| Fenn-Gib Project |
Page 217 | |
| NI 43-101 Technical Report and Pre-Feasibility Study |
December 19, 2025 | |
|
|
| Figure 18-9: | Proposed 27.6kV Power Supply Line from Ramore TS to the Fenn-Gib Gold Project Site |
Source: Ecometrix, 2025
| Fenn-Gib Project |
Page 218 | |
| NI 43-101 Technical Report and Pre-Feasibility Study |
December 19, 2025 | |
|
|
| Figure 18-10: | Fenn-Gib Gold Project Site Single Line Diagram |
Source: Ausenco,, 2025
| Fenn-Gib Project |
Page 219 | |
| NI 43-101 Technical Report and Pre-Feasibility Study |
December 19, 2025 | |
|
|
| 18.8.3 | Power and Electrical Contingency Planning |
If Hydro One (HONI) or the IESO cannot implement the additional infrastructure required following the SIA or CIA, or if the overall electrical project schedule cannot be achieved prior to construction completion, the following contingency measures will be considered:
| | Temporary On-Site Generation: Deploy modular diesel generator sets to provide essential construction and commissioning power. Units will be sized to meet critical loads and comply with applicable environmental and safety standards. |
| | Natural Gas-Based Alternatives: Reassess previously evaluated options such as compressed natural gas (CNG) or a dedicated natural gas pipeline for on-site generation. While these were deemed less favorable during the PFS, they remain viable interim solutions if grid connection is delayed beyond the end of the Project commissioning phase. |
| | Regulatory and Permitting: Prepare contingency permitting documentation for temporary power installations to avoid delays in implementation. |
These measures will be refined during subsequent engineering phases and incorporated into the Project Execution Plan to ensure continuity of operations under unforeseen circumstances. The Power and electrical contingency plans are not included in the PFS costing but designs will be advanced for risk management.
| 18.9 | Highway 101 Relocation |
The Project is located approximately 80 km east of Timmins and 17 km east of Matheson, Ontario. The Project has good regional infrastructure and direct access via Highway 101, which traverses the property. To support mine development and ensure adequate separation between the provincial highway and planned mining infrastructure, a realignment of Highway 101 has been included in Project sustaining capital for 2 years following the initial construction. Evaluation of alternative timing for highway relocation will be considered based on Ministry of Transport, Ontario (MTO) interactions and approvals. Refer to Figure 18-11.
King’s Highway 101 is a regional transportation corridor connecting to the Trans-Canada Highway (Highway 11), linking several northeastern Ontario communities, and providing access to the Province of Quebec. According to the MTO Functional Classification Map - Ontario (October 2024) and subsequent confirmation from the MTO, Highway 101 within the project area is classified as a Rural Collector Undivided Highway with a design speed of 100 km/h (RCU100) and a posted speed of 80 km/h.
The study advanced a route feasibility study for the proposed Highway 101 realignment in support of the Project. The study evaluated alternative routes that maintain adequate separation from proposed infrastructure while satisfying MTO geometric and safety design standards.
Development and assessment of realignment alternatives involved a multidisciplinary approach to ensure consistency with mine infrastructure plans, provincial design criteria, and environmental considerations.
| Fenn-Gib Project |
Page 220 | |
| NI 43-101 Technical Report and Pre-Feasibility Study |
December 19, 2025 | |
|
|
Three preliminary alignment options were developed north of the existing Highway 101, avoiding mine facilities and mining operations while maintaining safe geometric standards, minimizing environmental impacts, and optimizing earthworks. Factors such as terrain, wetlands, watercourses, property boundaries, and environmental features were incorporated into the route refinement process.
| Figure 18-11: | Highway 101 Realignment Alternatives |
Source: TBT Engineering, 2025
Objective evaluation criteria were established to compare the three alternatives based on engineering design, constructability, cost, environmental impact, and compatibility with mine expansion. Class ‘D’ level cost estimates were prepared for each alignment. As the project advances through detailed design stages, cost estimates will be further refined.
| | Alternative 1 (Middle Alignment, 5.02 km): A balanced option with moderate construction complexity. Crosses two watercourses, traverses shallow rock and swamp areas. |
| Fenn-Gib Project |
Page 221 | |
| NI 43-101 Technical Report and Pre-Feasibility Study |
December 19, 2025 | |
|
|
| | Alternative 2 (Southmost Alignment, 4.42 km): The shortest and least costly option, the simplest to construct and has minimal impact on lands not currently covered by Company claims. The design crosses three watercourses and passes primarily through organic/swamp terrain. |
| | Alternative 3 (Northmost Alignment, 5.20 km): The longest and most expensive option, providing the greatest separation from mine infrastructure. Involves minimal watercourse crossings and the lowest potential fisheries and wetland impacts. |
All proposed alternatives meet MTO design standards and provide improvements over the existing highway in terms of safety and roadway geometry. The highway relocation study confirms that all three alignments are technically and environmentally feasible. Alternative 2 has been selected as the preferred alignment for this PFS, based on its lower cost, shorter length, and ease of construction, and will be advanced into subsequent engineering design and permitting phases.
| 18.10 | Fuel |
Fuel will be delivered to site and stored in dedicated, purpose-built tanks for fuel (diesel, gasoline, and DEF) and lubricants. These installations are expected to be owned and supplied by the fuel vendor at no additional cost to the Project, with their availability maintained for the duration of the supply agreement. The greater Timmins area is well serviced by several fuel suppliers. Fuel cost and consumption for the construction and operating phase are included in the cost and economic analysis.
| 18.11 | Hazard Considerations |
There are no unique environmental hazards outside the typical considerations for the greater Timmins Camp. Typical hazard conditions in Northern Ontario would include forest fires, winter storms and localized flooding.
| 18.12 | Comments on Project Infrastructure |
The proposed infrastructure layouts and locations are considered suitable to support inclusion in the PFS, based on the status of environmental approvals. It is acknowledged that further geotechnical investigations may result in modifications to the siting and design of certain structures. Similarly, as the power supply to site and the proposed highway realignment remain subject to regulatory approval, these components may be revised pending outcomes of the permitting process. The design of the water treatment plant is currently pending completion of geochemical characterization and site-wide water balance studies, which will inform treatment requirements and discharge volumes. Alignment of the discharge pipeline is also subject to further engineering design and regulatory approvals and may be adjusted as these elements progress.
| Fenn-Gib Project |
Page 222 | |
| NI 43-101 Technical Report and Pre-Feasibility Study |
December 19, 2025 | |
|
|
| 19 | MARKET STUDIES AND CONTRACTS |
| 19.1 | Market Studies |
Gold is a freely traded commodity with deep, liquid international markets, and therefore marketability of production from the Fenn Gib Project is not considered a risk. Once in operation, the doré bars will be refined and sold through established channels, with pricing determined transparently by the London Bullion Market Association (LBMA) and other recognized exchanges. No dedicated market study has been commissioned, as such studies are not typically required for precious metals; however, the QP notes that the global gold market is supported by a broad range of buyers, including refiners, central banks, and investment institutions. Metallurgical testwork completed to date and the anticipated recovery methods leading to production of doré bars have not identified deleterious elements that would restrict saleability or result in penalties, and the risk of off specification product is not anticipated. Accordingly, the QP concludes that gold produced from the Fenn Gib mill will be readily marketable, with no material restrictions anticipated.
| 19.2 | Gold Price Projections |
The following gold price assumptions below were compiled and provided by CIBC Global Mining Group (“CIBC”) and are the November 2025 Consensus Commodity Price Estimates and Consensus Trading Comps.
| Table 19-1: | November 2025 Consensus Commodity Price |
| Date |
Firm |
2025 | 2026 | 2027 | 2028 | Long Term | ||||||||||||||||
| 29-Oct-25 |
Cormark | $ | 3,330 | $ | 4,000 | $ | 4,000 | $ | 4,000 | $ | 4,000 | |||||||||||
| 28-Oct-25 |
CIBC | $ | 3,400 | $ | 4,500 | $ | 4,500 | $ | 4,250 | $ | 3,300 | |||||||||||
| 28-Oct-25 |
Morgan Stanley | $ | 3,398 | — | — | — | $ | 2,500 | ||||||||||||||
| 26-Oct-25 |
Deutsche Bank | $ | 3,352 | $ | 3,683 | $ | 3,768 | — | $ | 3,854 | ||||||||||||
| 24-Oct-25 |
JPMorgan | $ | 3,345 | — | — | — | $ | 3,750 | ||||||||||||||
| 23-Oct-25 |
Macquarie | $ | 3,450 | $ | 4,314 | $ | 4,403 | $ | 3,454 | $ | 2,500 | |||||||||||
| 22-Oct-25 |
Canaccord | $ | 3,449 | $ | 4,315 | $ | 4,464 | $ | 4,643 | $ | 4,745 | |||||||||||
| 22-Oct-25 |
Stifel | $ | 3,450 | $ | 4,000 | $ | 4,200 | $ | 4,200 | $ | 3,000 | |||||||||||
| 21-Oct-25 |
HSBC | $ | 3,455 | $ | 4,300 | $ | 4,300 | $ | 3,330 | $ | 2,350 | |||||||||||
| 21-Oct-25 |
National Bank | $ | 3,402 | $ | 4,000 | $ | 4,000 | $ | 3,500 | $ | 2,750 | |||||||||||
| 21-Oct-25 |
UBS | $ | 3,325 | $ | 3,825 | $ | 3,650 | $ | 3,547 | $ | 3,251 | |||||||||||
| 20-Oct-25 |
BMO | $ | 3,377 | $ | 4,400 | $ | 4,075 | $ | 3,675 | $ | 3,000 | |||||||||||
| 20-Oct-25 |
BNP Paribas | $ | 3,245 | $ | 3,300 | $ | 3,000 | — | — | |||||||||||||
| 20-Oct-25 |
BofA | $ | 3,352 | $ | 4,329 | $ | 3,569 | $ | 3,213 | $ | 2,500 | |||||||||||
| 20-Oct-25 |
Desjardins | $ | 3,366 | $ | 4,019 | $ | 4,146 | $ | 4,284 | $ | 4,284 | |||||||||||
| Fenn-Gib Project |
Page 223 | |
| NI 43-101 Technical Report and Pre-Feasibility Study |
December 19, 2025 | |
|
|
| Date |
Firm |
2025 | 2026 | 2027 | 2028 | Long Term | ||||||||||||||||
| 20-Oct-25 |
RBC | $ | 3,266 | $ | 3,931 | $ | 4,100 | $ | 3,500 | $ | 2,600 | |||||||||||
| 20-Oct-25 |
TD | $ | 3,377 | $ | 3,900 | $ | 3,800 | $ | 3,700 | $ | 3,500 | |||||||||||
| 18-Oct-25 |
Jefferies | $ | 3,348 | $ | 3,800 | $ | 3,600 | $ | 3,200 | $ | 2,800 | |||||||||||
| 15-Oct-25 |
H.C. Wainwright | $ | 3,000 | $ | 3,000 | $ | 3,000 | $ | 3,000 | $ | 3,000 | |||||||||||
| 15-Oct-25 |
Ventum | $ | 3,297 | $ | 3,550 | — | $ | 3,400 | $ | 3,400 | ||||||||||||
| 14-Oct-25 |
Berenberg | $ | 3,362 | $ | 3,950 | $ | 3,800 | $ | 3,500 | $ | 2,750 | |||||||||||
| 14-Oct-25 |
Cantor | $ | 3,450 | $ | 3,600 | $ | 3,000 | — | $ | 3,000 | ||||||||||||
| 14-Oct-25 |
Haywood | $ | 3,161 | $ | 3,250 | $ | 3,000 | $ | 3,000 | $ | 3,000 | |||||||||||
| 10-Oct-25 |
Barclays | $ | 3,338 | $ | 3,950 | $ | 4,000 | $ | 3,750 | $ | 3,000 | |||||||||||
| 09-Oct-25 |
Paradigm | $ | 3,042 | $ | 3,594 | $ | 3,647 | $ | 4,027 | $ | 2,650 | |||||||||||
| 09-Oct-25 |
Raymond James | $ | 3,326 | $ | 3,500 | — | — | $ | 2,900 | |||||||||||||
| 01-Oct-25 |
Scotia | $ | 3,250 | $ | 3,200 | $ | 2,800 | $ | 2,300 | $ | 2,300 | |||||||||||
| Average |
$ | 3,330 | $ | 3,848 | $ | 3,775 | $ | 3,594 | $ | 3,103 | ||||||||||||
| Median |
$ | 3,352 | $ | 3,931 | $ | 3,800 | $ | 3,500 | $ | 3,000 | ||||||||||||
| Max |
$ | 3,455 | $ | 4,500 | $ | 4,500 | $ | 4,643 | $ | 4,745 | ||||||||||||
| Min |
$ | 3,000 | $ | 3,000 | $ | 2,800 | $ | 2,300 | $ | 2,300 | ||||||||||||
The economic analysis uses the average long-term consensus as the basis for the selected gold price of US$3,100/oz.
| 19.3 | Foreign Exchange Assumptions |
The following USD/CAD exchange rate assumptions below were compiled and provided by CIBC’s and are the November 2025 Consensus Commodity Price Estimates and Consensus Trading Comps.
| Table 19-2: | November 2025 Consensus Foreign Exchange Assumptions |
| Foreign Exchange Assumptions |
2025 | 2026 | 2027 | 2028 | Long Term | |||||||||||||||
| USD/CAD |
C$ | 1.39 | C$ | 1.37 | C$ | 1.36 | C$ | 1.35 | C$ | 1.34 | ||||||||||
| 19.4 | Contracts |
At the time of this Technical Report, the project does not have any significant contracts in place for the project including mining or mining related services, service supplies, contracting, refining, or shipment of product, etc. At this stage of development, formal agreements are not expected to be in place.
No marketing contracts are required for gold, as it is a freely traded commodity with established global markets. The anticipated doré production will be refined and sold through accredited channels, with pricing determined by the London Bullion Market Association (LBMA) and other recognized exchanges.
| Fenn-Gib Project |
Page 224 | |
| NI 43-101 Technical Report and Pre-Feasibility Study |
December 19, 2025 | |
|
|
With respect to social and Indigenous undertakings, the issuer has initiated engagement with AAN the proximal First Nation communities and is advancing discussions toward formal agreements that will address employment, training, and business participation opportunities. These discussions are ongoing and are expected to progress in parallel with project development milestones.
No hedging, streaming, or forward sales contracts have been entered into at this stage. The issuer may evaluate such arrangements in the future as part of project financing strategies, but no commitments currently exist.
Following completion of the PFS, the Company anticipates executing contracts to advance detailed engineering for the plant, site and off-site infrastructure, tailings, and water management systems. In parallel, separate contracts will be established to define the scope of work and consulting services required to progress environmental design and permitting activities. It is expected that the Company will continue to engage the incumbent firms that supported the PFS in carrying forward these next phases of work.
In summary, the project is at a stage where no binding contracts are needed. Future agreements covering detailed engineering and design services, construction management, construction execution, equipment supply, operational maintenance, blasting services, gold shipment, off-site infrastructure and Indigenous participation will be negotiated as the Project advances toward construction and production.
| 19.5 | Comments on Market Studies and Contracts |
The QP has reviewed the long-term metal prices provided by CIBC’s research. Based on this review, the QP considers that the information and conclusions presented in these studies reasonably support the assumptions made in this Technical Report regarding commodity pricing.
At the time of writing, no critical contracts are in place related to the project.
No significant characteristics have been identified that would restrict market access or reduce product attractiveness.
Risks associated with price volatility for the assumed commodity price or selling the production have been identified and are discussed further in Section 25 of this technical report.
| Fenn-Gib Project |
Page 225 | |
| NI 43-101 Technical Report and Pre-Feasibility Study |
December 19, 2025 | |
|
|
| 20 | ENVIRONMENTAL STUDIES, PERMITTING, AND SOCIAL OR COMMUNITY IMPACT |
| 20.1 | Environmental Studies |
| 20.1.1 | Baseline Environmental Studies |
Extensive baseline environmental studies have been conducted since 2021 to characterize aquatic and terrestrial ecosystems, groundwater, air quality, noise, and cultural heritage resources within, and in the general vicinity of the project site. Initial studies have also been completed to characterize the geochemical nature of mine wastes and additional targeted geochemical studies are ongoing to further refine the understanding of the geochemical behaviour of mine wastes.
A surface water monitoring program has been ongoing since 2021, with measurements of both water quality and quantity (hydrology) at a network of survey location within the Project footprint and at locations in downstream areas they could be affected by Project activities. For water quality, initial results indicate the concentrations of most water quality parameters are at or below relevant water quality objectives for the protection of aquatic life, with occasional exceptions for iron, aluminium, and phosphorus. Hydrometric stations fitted with continuous data loggers have been established at key locations. Flows measured in streams and larger rivers in the area reflect a typical hydrograph for the region, consistent with regional long-term records from regional Water Survey of Canada monitoring stations.
Aquatic environment surveys have been ongoing on and around the Project site seasonally since 2023 and continued in 2025. Surveying has included fish habitat assessment, fish community assessment, fish spawning assessment, fish tissue metal burden analysis and the characterization of benthic invertebrate communities targeting local streams, rivers and lakes. Headwater areas of local streams provide limited seasonal habitat for forage fish species; whereas the bigger streams, rivers and lakes provide habitat for cool- and cold-water forage and sportfish that are common in the area.
Terrestrial ecosystem characterization studies have been completed including vegetation and Ecological Land Classification (ELC), avifauna (birds), bats, mammals, basking turtles, and amphibian surveys. Studies have also been completed to identify critical wildlife habitat features and the occurrence of protected species (species at risk (“SAR”); individuals and habitats). The vegetation and wildlife communities of the Project site and surrounding area is typical of the boreal forest region of northeastern Ontario. Potential habitat for SAR has been identified on and around the Site, but no protected species have been observed during baseline surveys completed to date.
Groundwater and the groundwater environment have been characterized through advancement of a series of monitoring wells and boreholes installed in 2024 and 2025. Development of a conceptual hydrogeological site model of the area has been supported by assessment of hydraulic conductivity of the soils and bedrock hydrostratigraphic units, regular water level measurements across the groundwater monitoring well network and short-term pumping tests. This information is being used to establish a regional 3D hydrogeological model including the Project site. Groundwater quality within the overburden and bedrock at the site has been characterized and shows in most cases that constituent concentrations are below relevant guideline levels with occasional exceedances reflecting naturally occurring mineralized waters.
| Fenn-Gib Project |
Page 226 | |
| NI 43-101 Technical Report and Pre-Feasibility Study |
December 19, 2025 | |
|
|
Air quality, noise, and dustfall monitoring commenced in 2025, with a full one-year ambient monitoring program planned for 2026 to define existing pre-construction conditions. The Project is located in a rural forested area located approximately 17 km east of Matheson; existing local sources of air emissions include road traffic, existing and closed mining operations, and exploration drilling on site.
Cultural heritage assessments have been initiated. A Stage 1 desktop-based archeological resource assessment was conducted for the Project site and the associated transmission line (WHNE, 2025). Stage 2 archaeological survey work was initiated in 2024 and is continuing through 2025. To date no archaeological sites have been identified within the Study area.
| 20.1.2 | Geochemical Characterization Studies |
Geochemical characterization studies completed to date indicate that a portion of mine rock is classified as potentially acid generating (PAG) that will require appropriate segregation and management. A preliminary estimate of 25 Mt of PAG rock has been assumed out of the total 152 Mt mine rock to be mined, as discussed in Section 18.4.1. The current assessment is based on drill-core samples collected as part of a Phase 1 characterization program, representing a range of lithologies and alteration styles. While many of these samples are located proximally to the anticipated pit shell, not all are definitively within the current pit design, and results should therefore be considered preliminary pending completion of additional spatially representative sampling.
Based on available static test results, mine rock generally exhibits a clear separation between PAG and non-PAG classifications, with relatively few samples exhibiting marginal neutralization potential ratios. Both carbonate-based neutralization potential and modified Sobek methodologies show good agreement, reflecting a mineralogical framework dominated by pyrite as the primary sulphide mineral and calcite as the principal neutralizing carbonate, with subordinate dolomite and ankerite.
Shake-flask extraction (SFE) testing and kinetic testing of mine rock has been completed with additional testing planned within a Phase 2 assessment program. This test work is planned to support ongoing evaluation of loading and weathering behaviour across representative lithologies and to support refinement of management and mitigation strategies.
Tailings characterization indicates that the flotation tailings, comprising approximately 77% of the plant feed material, are generally expected to present a low acid rock drainage risk based on available testing. The flotation concentrate, representing approximately 23% of the ore feed, is anticipated to contain elevated sulphide content and cyanidation residues and is therefore expected to be potentially acid generating. This material is planned for subaqueous deposition and appropriate cover within the TSF, consistent with industry-standard practices. Additional tailings test work is ongoing to further refine these conclusions. In summary, no information has been collected as part of the environmental studies competed to date that have identified critical environmental constraints in consideration of implementation of industry standard management and mitigation strategies that would prevent mine development.
| Fenn-Gib Project |
Page 227 | |
| NI 43-101 Technical Report and Pre-Feasibility Study |
December 19, 2025 | |
|
|
Data collection is ongoing and these data will be assessed on an ongoing basis to evaluate how mine development elements such as PAG material handling, TSF design, and water treatment requirements, as well as regulatory timelines for permits and approvals may be affected and could thereby influence the mine plan, capital and operating costs, and overall project schedule.
| 20.2 | Environmental Management Considerations |
This section describes management of tailings, mine rock, overburden and contact and non-contact water during all mine phases. Planned monitoring activities both on-site and in the environment are also described.
| 20.2.1 | Tailings, Mine Rock and Overburden Disposal and Monitoring |
As described in Section 18, a TSF will be constructed for storage of tailings generated from ore processing in the processing plant. Also as noted in Section 18, two tailings streams will be delivered to the TSF - the rougher tailings slurry that is non-PAG will be deposited subaerially along the upstream side of the TSF perimeter embankments to promote settling and maximize the settled dry density of the solids and the leach tailings slurry that is PAG will be deposited sub-aqueously towards the center of the impoundment facility to mitigate ML/ARD.
PAG mine rock will be stored in a designated co-disposal area in the TSF and a designated area within the MRSA. The PAG mine rock stored in the TSF would ultimately by encapsulated by tailings and stored below the ambient water elevation to limit oxygen ingress and mitigate ML/ARD. The TSF will be subject to continuous monitoring for structural integrity, seepage, and water quality. Runoff and seepage collection systems will be equipped with sampling points for routine analysis. Water associated with the TSF will be diverted into the site water management system and treated to meet appropriate discharge criteria before being released in a controlled manner from the site (see Section 20.2.2).
As described in Section 18, non-PAG mine rock that is not used to develop site infrastructure will be placed in the Mine Rock Storage Area (MRSA) which is located to the south of the open pit. PAG mine rock will be stored within a designated area within the MRSA and capped with silt and/or clay at closure to impede surface water infiltration. The MRSA will be subject to monitoring for structural integrity, seepage, and water quality. Runoff and seepage collection systems will be equipped with sampling points for routine analysis. Water associated with the MRSA will be diverted into the site water management system and treated (if required) to meet appropriate discharge criteria before being released in a controlled manner from the site (see Section 20.2.2). A standard water treatment circuit for contact water has been assumed pending detailed geochemistry results.
Several small overburden (OVB) stockpiles will be located around the site. As with the other material stockpiles, the overburden stockpiles will be subject to continuous monitoring for structural integrity, seepage, and water quality. Runoff and seepage collection systems will be equipped with sampling points for routine analysis. Water associated with the OVB stockpiles will be diverted into the site water management system and treated (if required) to meet appropriate discharge criteria before being released in a controlled manner from the site (see Section 20.2.2).
| Fenn-Gib Project |
Page 228 | |
| NI 43-101 Technical Report and Pre-Feasibility Study |
December 19, 2025 | |
|
|
| 20.2.2 | Water Management |
Effective water management is essential for ensuring environmental protection throughout the life of the Project and maintaining compliance with statutory requirements under Ontario and federal regulations. Water management during the operations and closure phases is described below.
| 20.2.2.1 | Operations |
During operations, water management at the site will involve the collection of contact water from mine facilities, maximizing reuse of contact water in processing, and discharge of surplus water via a water management pond to the nearby Pike River. Preliminary water balance schematics for Years 4 and 16 are presented in Section 18.6.
Runoff from OVB stockpiles will be allowed to runoff locally to infiltrate the ground without discharging directly to a nearby waterbody.
Clean, non-contact water from surrounding catchments will be intercepted and diverted around the site using engineered diversion channels to mitigate effects on local existing surface water drainage areas and minimize water management capacity needs.
Pit dewatering will be a significant component of water management, with groundwater inflows expected to range from approximately 200 m3/day in year 1 of operations to 3,700 m3/day near completion. Dewatered water will be pumped to the Plant Site Pond, with excess water pumped to the Water Management Pond as necessary.
The TSF will incorporate reclaim systems to recycle supernatant water back to the process plant, reducing freshwater demand. Perimeter embankments will include low-permeability zones and seepage collection systems to minimize seepage and prevent uncontrolled releases, with collected seepage pumped back to the TSF or conveyed to the Water Management Pond. A site-wide water balance will be maintained and updated regularly to manage inflows, reclaim water from the TSF, and ensure sufficient freeboard for storm events up to the Inflow Design Flood (IDF).
Geochemical characterization necessary to predict the quality of contact water to be discharged from the water management pond is ongoing. Treatment will be designed to meet effluent discharge criteria as derived consistent with Provincial water quality policy pursuant to the Environmental Protection Act and the Ontario Water Resources Act and in keeping with Provincial Procedure B-1-5 (Deriving Receiving Water Based Point Source Effluent Requirements for Ontario Waters). Such derived criteria will be integrated into the Project’s Environmental Compliance Approval (ECA) as appropriate. Discharge from the site will also be subject to the federal Metal and Mining Diamond Mine Regulations (MDMER) that prescribe effluent discharge criteria for select constituents and require environmental effects monitoring to be carried out.
| 20.2.2.2 | Closure |
Water management during mine closure will focus maintaining control of Site contact water while remediation activities are completed. Water management infrastructure will be maintained during this period as necessary but will be decommissioned once the Site has been reclaimed per end land uses specified in the Closure Plan. The majority of the site contact water will be directed to the open pit during site closure to facilitate flooding of the open pit.
| Fenn-Gib Project |
Page 229 | |
| NI 43-101 Technical Report and Pre-Feasibility Study |
December 19, 2025 | |
|
|
The TSF will be dewatered, covered with rockfill or non-PAG tailings and growth medium, and seeded/revegetated - during this process runoff will be collected, managed and monitored until water quality meets regulatory standards. The TSF closure cap will include ditches and swales to direct surface water runoff to the open pit.
Any remaining material stockpiles will be re-shaped, covered with growth medium, and seeded/revegetated. During this process runoff will be collected, managed and monitored until water quality meets regulatory standards.
The open pit will be allowed to fill naturally. A water balance for the pit lake will be developed prior to site closure to confirm the filling rate and whether it will have a positive or negative water balance and require contingency for outflow (or not) for metals, pH, and cyanide degradation products to confirm compliance with discharge criteria.
Water treatment capability will be maintained on Site for the short-term to confirm that water being managed on the Site is suitable for release to the environment, after which it will be decommissioned. Passive treatment systems may be implemented if required, subject to conditions at that time.
| Fenn-Gib Project |
Page 230 | |
| NI 43-101 Technical Report and Pre-Feasibility Study |
December 19, 2025 | |
|
|
| Figure 20-1: | Closure Arrangement |
Source: KP, 2025
| 20.2.3 | Monitoring during Operations and Closure |
| 20.2.3.1 | Site Monitoring |
During operations, the TSF and material stockpiles will be subject to monitoring for structural integrity, seepage, and water quality and quantity. Runoff and seepage collection infrastructure will be equipped with sampling points for routine analysis to understand contributions from Site aspects to the Site water management system. Water quality analyses will include pH, metals, cyanide, total suspended solids, and nutrients, and/or as required by Site permits, approvals and other statutory requirements.
| Fenn-Gib Project |
Page 231 | |
| NI 43-101 Technical Report and Pre-Feasibility Study |
December 19, 2025 | |
|
|
Treated effluent will be subject to both continuous and periodic (daily, weekly, monthly) monitoring prior to release from the Site to monitor treatment performance and to confirm adherence to regulatory requirements as prescribed by the Provincial ECA and federal MDMER. Characterization of treated effluent will include, flow, toxicity, pH, metals, cyanide, total suspended solids, nutrients and hydrocarbons, and/or others as required by Site permits, approvals and statutory requirements.
On-site monitoring during closure will generally mimic that of the operations phase initially, but reduced extent and frequency of monitoring would be expected as Site remediation progresses. Water elevations and water quality in the open pit will be measured on an appropriate frequency as the open pit fills. Surveillance during closure will serve to verify physical and chemical stability of mine waste facilities and the open pit.
Monitoring programs will include monthly surface water sampling during open-water seasons and seasonal groundwater sampling throughout operations. Parameters will include pH, metals, cyanide, total suspended solids, and nutrients, with continuous water level monitoring at hydrometric stations and monitoring wells. Baseline data indicate occasional natural exceedances for iron, aluminium, and phosphorus; adaptive management protocols will be implemented to ensure these do not worsen due to project activities. Monitoring results will be reported to the Ministry of Environment, Conservation and Parks (MECP) as per ECA permit conditions, and any exceedances will trigger investigation and corrective actions under the site-specific Water Management Plan.
| 20.2.3.2 | Environmental Monitoring during Operations and Closure |
Mayfair will implement comprehensive monitoring programs during operations and closure to ensure compliance with regulatory requirements and environmental commitments. Key programs include the following:
| | Surface Water and Groundwater Monitoring: |
| | An off-site surface water and groundwater monitoring network will be established to track any influence of the Project in downstream/downgradient environments. Monthly sampling of surface water during open-water seasons and seasonal groundwater sampling will continue throughout operations. Parameters will include pH, metals, nutrients, cyanide, and hydrocarbons. Continuous water level monitoring will be maintained at hydrometric stations and monitoring wells to track flow and predict seepage. The extent and frequency of off-site monitoring of surface water and groundwater would both be expected to be reduced commensurate with site remediation activities and demonstration of chemical stability on-site. |
| | Air Quality and Noise Monitoring: |
| | A one-year ambient monitoring program for dustfall and particulate matter will commence prior to construction, followed by operational monitoring at designated receptors. Noise monitoring will be conducted periodically to confirm compliance with MECP guidelines. |
| | Biological Monitoring: |
| | Terrestrial and aquatic monitoring programs will be established to assess potential effects on wildlife, fish habitat, and SAR. Surveys will include breeding bird point counts, bat acoustic monitoring, and aquatic environment surveys (fish and benthic invertebrate) at frequencies defined in permitting conditions and the MDMER. |
| Fenn-Gib Project |
Page 232 | |
| NI 43-101 Technical Report and Pre-Feasibility Study |
December 19, 2025 | |
|
|
| 20.3 | Permitting Considerations and Regulatory Framework |
The Project will require a suite of permits and approvals typical of mine developments of the sort contemplated at Fenn-Gib, primarily under provincial jurisdiction, to support construction, operations, and closure. The Project as contemplated does not trigger a Comprehensive EA (previously referred to as an Individual EA) with the province. Select elements of the Project will require approval through the Provincial Class EA process. The Project is not a Physical Activity as defined in the Physical Activities Regulations under the federal Impact Assessment Act and therefore federal IA is not indicated. An authorization under the federal Fisheries Act may be required in relation to impacts to fish and fish habitat; approvals for storage and use of explosives will be required under the Explosives Act.
Early engagement with regulators has been initiated, and no significant impediments to permitting have been identified. Mayfair is in discussions with the Ontario government regarding entry into the One Project, One Process (“1P1P”) initiative that includes facilitation of all necessary provincial approvals through a dedicated MAPDT.
Further detail as to provincial, federal and other permitting and regulatory considerations is provided below. A list (initial draft) of permits/approvals anticipated for the Project is provided in Table 20-1.
| Table 20-1: | List of Permits/Approvals (Initial Draft) Anticipated for the Project |
| Permit/Authorization |
Agency1 | Permit Required | ||
| Federal Permits/Authorizations | ||||
| Impact Assessment Act — Impact Assessment |
IAA | No | ||
| Fisheries Act — Section 35 |
DFO/ECCC | Yes (likely) | ||
| Fisheries Act — Section 36/Schedule 2 |
DFO/ECCC | No | ||
| Fisheries Act — MDMER |
ECCC | No | ||
| Species at Risk Act Permit |
ECCC | No | ||
| Migratory Birds Conservation Act |
ECCC | No | ||
| Canadian Navigable Waters Act (CNWA) |
TC | No (unlikely) | ||
| Explosive Act |
NRCan | Yes | ||
| Aeronautic Act |
NAVCan | No | ||
| Federal Radio Communication Act |
Industry Canada | No | ||
| Provincial Permits/Authorizations | ||||
| Provincial Environmental Assessment Act — Comprehensive or Class EAs |
MECP | Yes; Class EA for select mine-related components | ||
| Mining Act — Closure Plan |
MEM | Yes | ||
| Environnemental Protection Act — ECA Air/Noise |
MECP | Yes | ||
| Environmental Protection Act - ECA Industrial Sewage Works (ISW) |
MECP | Yes | ||
| Permit to Take Water |
MECP | Yes | ||
| Fenn-Gib Project |
Page 233 | |
| NI 43-101 Technical Report and Pre-Feasibility Study |
December 19, 2025 | |
|
|
| Permit/Authorization |
Agency1 | Permit Required | ||
| Forest Resource License (FRL) or Permit to Remove Forest Resources (PRFR) |
MNRF | Yes | ||
| Crown Land Work/Use Permit |
MNR | TBD (likely) | ||
| Lakes and Rivers Improvement Act (LRIA) Permit |
MNR | Yes | ||
| Endangered Species Act (ESA) — Overall Benefit (OB) Permit |
MECP | TBD (unlikely) | ||
| Environmental Protection Act |
MECP | Yes | ||
| Other — Aggregate Resources Act (for aggregate development), Environmental Protection Act (Landfill) |
MNR, MECP |
No | ||
| Other Government Approvals | ||||
| Conservation Authorities Act Permit |
NA | No | ||
| Official Plan Amendment |
NA | No | ||
| Municipal Building Permit |
NA | No | ||
| Site Plan Control Application |
NA | No | ||
Note:
| 1. | IAA - Impact Assessment Agency, ECCC - Environment and Climate Change Canada, DFO - Fisheries and Oceans Canada, TC - Transport Canada, CNWA - Canadian Navigable Waters Act, NRCan - Natural Resources Canada, NavCan - Nav Canada, MECP - Ministry of Environment, Conservation and Parks, MEM - Ministry of Energy and Mines, MNR/MNRF - Ministry of Natural Resources and Forestry, MTO - Ministry of Transportation, NA - not applicable |
| 2. | Approval duration assumed to be government timeline following submission of permit/approval application documentation submission. |
| 20.3.1 | Provincial EA Requirements |
The Project as contemplated does not trigger a Comprehensive EA with the Province.
The Project is anticipating progressing the Class EA processes listed below, as may be amended in the future by the Ontario provincial government.
| | Class EA for Resource Stewardship and Facility Development, in accordance with MNR (2003), in advance of issuing permits for harvesting Crown owned timber, water crossings larger with a watershed area greater than 5 km2, road construction on Crown owned surface rights, online dams, water diversions and development of Crown owned aggregate. |
| | Class EA for any land tenure decisions, administered by Ministry of Mines. |
| | Class EA process required by Ministry of Transportation (MTO) for the re-alignment of an approximately 5 km segment of Highway 101). |
| | The Project is assuming the HONI 27.6 kV right of way for the power line will be utilized with no EA coverage needed, however, in the event the Project connects to the 115 kV grid, a Category B Class EA is required under the Electricity Projects Regulation (O. Regulation 116/01) will be advanced. |
Various provincial permits/approvals will be required. The most critical approval is the Closure Plan (CP) under Ontario Regulation 35/24 of the Mining Act, which will be filed in phases to allow early works and later amended for full mine development. Financial assurance will be required to cover the turnkey implementation of rehabilitation and monitoring measures, and the amount will be confirmed with the Ministry of Energy and Mines (MEM) during pre-submission consultation.
| Fenn-Gib Project |
Page 234 | |
| NI 43-101 Technical Report and Pre-Feasibility Study |
December 19, 2025 | |
|
|
Additional provincial permits include Environmental Compliance Approvals (ECA) for sewage works and air emissions under the Environmental Protection Act. Initial ECAs will focus on site preparation and construction water management, followed by amendments for full life-of-mine operations. A Permit to Take Water (PTTW) will be necessary for water takings exceeding 50,000 L/day, including pit dewatering and process water supply. Approvals under the Lakes and Rivers Improvement Act (LRIA) may be required for tailings dam construction. Other provincial authorizations will cover blasting, fuel storage, waste disposal, and sanitation systems.
Permits on the critical path include the Closure Plan, PTTW, and ECAs for water and air, as these are prerequisites for major construction and commissioning activities. A detailed permitting schedule (through 1P1P) will be developed to align with engineering and procurement timelines, ensuring regulatory compliance without impacting the project schedule.
| 20.3.2 | Federal Impact Assessment Requirements |
The Project is not a Physical Activity as defined in the Physical Activities Regulations under the federal Impact Assessment Act and therefore federal IA is not indicated. Specifically, the production rates contemplated for the Project are below the mine and mill thresholds per Section 2, Item 18 of the Physical Activities Regulations, as summarized below:
| | Maximum ore production capacity of the mine is above 5,000 t/d. |
| | Maximum ore input capacity to the mill is above 5,000 t/d. |
Based on the current understanding of the Project, it is understood that an authorization under the federal Fisheries Act may be required. The authorization would be in relation to the prohibition on harmful alteration, disruption or destruction of fish habitat per Section 35. There is no indication at this time that authorization would be needed in relation to Section 36 of the Fisheries Act and the MDMER associated with the disposal of mine waste into waters frequented by fish.
Approvals for storage and use of explosives will be required under the Explosives Act.
| 20.3.3 | Other Approval Requirements |
Municipal or other (e.g., Conservation Authorities Act) approval requirements are not expected to be required for on-site activities. The Site is not within Municipal township boundaries and there is no Conservation Authority whose jurisdiction extends to watersheds potentially affected by the development of the Project.
| Fenn-Gib Project |
Page 235 | |
| NI 43-101 Technical Report and Pre-Feasibility Study |
December 19, 2025 | |
|
|
Project-related infrastructure will be located within the Town of Matheson though such infrastructure is anticipated to be owned and operated by third parties. This infrastructure may require building permits and other municipal approvals.
| 20.4 | Social and Community Considerations |
The Project is located within Treaty 9 and the traditional territory of Apitipi Anicinapek Nation. Mayfair Gold has an active Exploration Agreement with AAN and has maintained ongoing engagement since the early stages of the Project. Throughout 2024 and 2025, Mayfair held multiple meetings with AAN’s leadership, lands and resources staff, and technical advisors to review baseline studies, preliminary site layouts, and potential impacts on traditional land use. These sessions also included interactions on the Project Definition and permitting strategy. Mayfair continues to prioritize transparent communication and collaboration as the Project advances beyond the PFS and into the permitting phase.
In March 2025, the Ministry of Energy and Mines formally directed Mayfair to include additional Indigenous communities in the consultation process: Beaverhouse First Nation, Matachewan First Nation, Taykwa Tagamou Nation, and the Métis Nation of Ontario. Engagement with these communities will continue through permitting and development phases, with opportunities for input on Project design, environmental management, and socio-economic benefits.
Mayfair has also initiated early engagement with the Town of Black River-Matheson and regional stakeholders to introduce the Project and outline its potential benefits and impacts. Initial discussions have focused on employment opportunities, traffic management, and community investment priorities. No significant concerns have been raised to date, but feedback emphasized the importance of clear communication and minimizing disruption during construction. Additional public consultations are planned as part of the permitting and approvals processes, including public information sessions, and as incorporated into regulatory filings as appropriate.
To support local economic development, Mayfair anticipates developing certain off-site infrastructure within Matheson, such as accommodations for construction personnel and warehousing for non-essential spares. A “good neighbour” agreement is expected to be established with the Town of Matheson to outline commitments related to local hiring, procurement, traffic management, and community programs. This agreement will ensure the Project contributes positively to the social and economic well-being of the community while maintaining transparency and open communication throughout development and operations.
| 20.5 | Closure and Reclamation Plans |
The Closure Plan for the Project will be developed in accordance with Ontario Regulation 35/24 and the Mine Rehabilitation Code of Ontario. The primary objective is to return the site to a physically and chemically stable condition that supports acceptable post-mining land uses, such as wildlife habitat, while minimizing long-term environmental risks and risk of harm to members of the public. The Closure Plan will be filed in phases and refined through consultation with AAN specifically, as well as the identified regional Indigenous communities, and stakeholders to ensure alignment with traditional and end land use objectives.
| Fenn-Gib Project |
Page 236 | |
| NI 43-101 Technical Report and Pre-Feasibility Study |
December 19, 2025 | |
|
|
Given the stage of the Project, a conceptual closure strategy has been developed that will guide development of the Closure Plan. The envisioned closure strategy is illustrated on Figure 20-1. Key elements of the closure strategy include:
| | removal of infrastructure, machinery and equipment |
| | remediation of disturbed areas via scarification and grading, remediation of contaminated soils, and placement of growth medium to promote revegetation using native species |
| | contouring and stabilization of slopes of the TSF and remaining material stockpiles (mine rock, overburden) for long-term integrity, with growth medium application to promote revegetation using native species |
| | implementing measures to mitigate ML/ARD risks to ensure long-term chemical stability of the TSF and remaining material stockpiles, that could include for example encapsulation of PAG material and, if necessary, engineered covers or passive treatment systems |
| | securing the open pit with perimeter boulder fencing to restrict public access while the pit is allowed to fill with water for the final closure condition |
| | decommissioning decant structures and water management sumps |
| | stabilizing water management courses and site drainage, and implementing short-term water management measures |
| | execution of monitoring programs for physical and chemical stability to verify performance of the closure measures and compliance with discharge limits once implemented |
| | project management, engineering, and contract administration will be incorporated to oversee and coordinate the closure activities. |
| Fenn-Gib Project |
Page 237 | |
| NI 43-101 Technical Report and Pre-Feasibility Study |
December 19, 2025 | |
|
|
| Figure 20-2: | Closure Arrangement |
Source: KP, 2025
| Fenn-Gib Project |
Page 238 | |
| NI 43-101 Technical Report and Pre-Feasibility Study |
December 19, 2025 | |
|
|
As noted in Section 20.2.2.2, water management will continue in the closure phase, focusing on maintaining control of Site contact water while remediation activities are completed. Water management infrastructure associated with site aspects will be maintained during this period as necessary but will be decommissioned once the Site has been reclaimed per end land uses specified in the Closure Plan and on-site water quality meets Closure Plan objectives. Water treatment capability will be maintained on Site as remediation is completed to confirm that water being managed on the Site is suitable for release to the environment, after which it will be decommissioned. Passive treatment systems may be implemented if required, subject to conditions a that time.
| 20.5.1 | Closure Cost Estimates |
The closure costs have been developed and deemed appropriate for the level of this technical report. Costs have been estimated based on the conceptualized scope of closure measures contemplated (i.e., the Closure Plan has not been finalized) and similar regional Closure Plan costs in the area. The estimate is included in the Section 21 and 22 and has been provided inclusive of all considerations associated with Ontario Regulation 35/24 and the Mine Rehabilitation Code of Ontario.
| 20.6 | Comments on Environmental Studies, Permitting and Social and Community Considerations |
Extensive baseline environmental studies have been conducted since 2021, covering terrestrial and aquatic ecosystems (including SAR), groundwater, air quality, noise, and cultural heritage resources. No significant impediments to the granting of environmental or operating permits have been identified. Baseline studies completed to date indicate that environmental conditions are typical of northern Ontario, and no critical constraints have been reported that would prevent mine development. Known considerations include management of potentially acid-generating (PAG) material and cyanidation residues, which will require engineered containment and monitoring, but these are standard practices in Ontario and addressed in the project design.
The Project does not currently hold the required permits for construction and operations, as the Project is at pre-feasibility stage; however, there is a reasonable expectation that the necessary permits will be obtained. This assessment is supported by the fact that similar mining projects in Ontario have successfully secured comparable approvals, and Mayfair has initiated early engagement with regulatory authorities to confirm permitting pathways. The permitting strategy includes phased filing of the Closure Plan under O. Reg. 35/24, Environmental Compliance Approvals for water and air, and a Permit to Take Water for pit dewatering and process water supply. These permits are considered achievable within the regulatory framework and consistent with current jurisdictional requirements. Importantly, the Project expects to apply for the Ontario 1P1P process, which provides a standardized framework for that facilitation of required provincial approvals. This 1P1P approach is intended to streamline regulatory review and ensure alignment with provincial expectations for mine development.
Social and community engagement is ongoing and proactive. The project is located within Treaty 9 and the traditional territory of Apitipi Anicinapek Nation, with an active Exploration Agreement in place. Mayfair will also initiate consultation with Beaverhouse First Nation, Matachewan First Nation, Taykwa Tagamou Nation, and the Métis Nation of Ontario, as directed by the Ministry of Energy and Mines. Engagement with local stakeholders, including the Town of Matheson, is underway, and a “good neighbour” agreement is anticipated to address local employment, procurement, and community investment.
| Fenn-Gib Project |
Page 239 | |
| NI 43-101 Technical Report and Pre-Feasibility Study |
December 19, 2025 | |
|
|
The conceptualized Closure Plan appears reasonable and aligned with the Mine Rehabilitation Code of Ontario. It includes removal of infrastructure, machinery and equipment, geotechnical and geochemical stabilization of tailings and MRSAs, pit flooding, and revegetation of disturbed areas using native species. Financial assurance will be provided to cover the full cost of closure and long-term monitoring, including contingencies for water treatment and ARD/metal leaching mitigation as may be appropriate.
Finally, it is noted that Mayfair has committed to implementing an Environmental, Health, and Safety (EHS) management system for the project. While detailed EHS plans have not yet been finalized, the approach is expected to meet provincial regulatory requirements and incorporate best practices consistent with international standards for environmental management and worker safety.
| Fenn-Gib Project |
Page 240 | |
| NI 43-101 Technical Report and Pre-Feasibility Study |
December 19, 2025 | |
|
|
| 21 | CAPITAL AND OPERATING COSTS |
| 21.1 | Introduction |
The capital and operating cost estimates presented in this PFS provide substantiated costs that can be used to assess the economics of the Project. The estimates are based on an open pit mining operation; the construction of a process plant; associated tailings storage and management facility, and infrastructure; as well as Owner’s costs and provisions.
The estimates conform to Class 4 guidelines for a PFS-level estimate with a ±25% accuracy according to the Association for the Advancement of Cost Engineering International.
| 21.2 | Capital Costs |
| 21.2.1 | Overview |
A summary of the project capital costs and operating costs are presented in Table 21-1 below.
| Table 21-1: | Capital Cost Estimate |
| WBS Description |
Initial Capital Cost ($M) | Sustaining Cost ($M) | Total Cost ($M) | |||||||||
| Mining |
31.4 | 24.4 | 55.8 | |||||||||
| Crushing |
21.6 | 1.1 | 22.7 | |||||||||
| Process Plant |
114.7 | 1.4 | 116.1 | |||||||||
| On Site Infrastructure |
72.4 | 14.6 | 87.0 | |||||||||
| Off Site Infrastructure |
15.6 | 13.3 | 28.9 | |||||||||
|
|
|
|
|
|
|
|||||||
| Total Direct Costs |
255.8 | 54.7 | 310.5 | |||||||||
| Project Preliminaries |
35.9 | 0.0 | 35.9 | |||||||||
| Project Delivery |
30.7 | 2.5 | 33.3 | |||||||||
| Owner’s Costs |
61.7 | 3.7 | 65.3 | |||||||||
|
|
|
|
|
|
|
|||||||
| Total Indirect Costs |
128.3 | 6.2 | 134.5 | |||||||||
|
|
|
|
|
|
|
|||||||
| Total Direct + Indirect Costs |
384.1 | 60.9 | 444.9 | |||||||||
| Contingency |
65.9 | 0.0 | 65.9 | |||||||||
|
|
|
|
|
|
|
|||||||
| Total Capital Cost |
450.0 | 60.9 | 510.9 | |||||||||
|
|
|
|
|
|
|
|||||||
| Fenn-Gib Project |
Page 241 | |
| NI 43-101 Technical Report and Pre-Feasibility Study |
December 19, 2025 | |
|
|
| 21.2.2 | Basis of Estimate |
| 21.2.2.1 | Capital Cost Estimate Base Date |
The estimate’s base date is Q3 2025. The Project capital cost estimate start date is January 1, 2026. All non-operating costs required to complete project handover and close-out also form part of capital costs. Project completion is end of plant commissioning.
| 21.2.2.2 | Estimate Accuracy |
The accuracy of the capital cost estimate for the project meets the Association for the Advancement of Cost Engineering (AACE) Feasibility Study Class 4 guidelines and is within ±25% accuracy (note: AACE classification: low: -5% to -20% and high: +10% to +30%) for final project costs with contingency.
| 21.2.2.3 | Currency and Commodity Rates |
Vendors and contractors were requested to provide quotes in native currency. Pricing has been converted to the base currency of Canadian dollars using the exchange rates listed in Table 21-2.
| Table 21-2: | Estimate Exchange Rates |
| Abbreviation |
Symbol |
Currency |
Exchange Rate | |||
| AUD | AU$ | Australian Dollar | 0.9161 | |||
| EUR | | Euro | 1.6190 | |||
| USD | US$ | United States Dollar | 1.3500 | |||
| CAD | $ | Canadian Dollar | 1.00 | |||
| ZAR | R | South African Rand | 0.0810 |
| 21.2.3 | Estimate Methodology |
| 21.2.3.1 | Overview |
Working with the consultants defined in Section 1.1, the capital and operating cost estimates were developed with a standard methodology, as follows:
| | confirm the scope of work |
| | define the estimate base date |
| | define the estimate reporting currency |
| | define the estimate by WBS |
| Fenn-Gib Project |
Page 242 | |
| NI 43-101 Technical Report and Pre-Feasibility Study |
December 19, 2025 | |
|
|
| | collect various data sets, including: |
| | discipline MTOs |
| | pricing from budgetary/firm price bids, budgetary/firm RFP, quotes, databases, and benchmarking |
| | direct labour wages. |
| | develop the labour rates |
| | determine the installed equipment and material costs |
| | determine the indirect costs |
| | determine foreign exchange content |
| | determine the estimate contingency value through a deterministic analysis |
| | complete internal reviews. |
Source data that was used in the development of the estimate includes the following:
| | Scopes of Work |
| | equipment lists |
| | material take-offs (MTOs) |
| | design criteria |
| | layouts and general arrangements |
| | process flow diagrams (PFDs) |
| | mass and water balance engineering calculations |
| | geotechnical investigation |
| | project execution plan |
| | equipment pricing and budget quotes |
| | material and labour rates, budgetary pricing |
| | construction installation rates |
| | mine plan |
| | plant ramp-up plan |
| | project schedule. |
| Fenn-Gib Project |
Page 243 | |
| NI 43-101 Technical Report and Pre-Feasibility Study |
December 19, 2025 | |
|
|
The direct cost portion of the capital cost estimate was reviewed for completeness and consistency against the project description, and indirect costs were added to the direct cost estimates to complete the estimate.
| 21.2.3.2 | Work Breakdown Structure |
The capital cost estimate was structured on the WBS and the cost coding structure defined for the project. The WBS was developed during the PFS and has been maintained through the study as required. The first 2 levels of the WBS are shown in Table 21-3.
| Table 21-3: | WBS Level 2 |
| WBS Level 1/Level 2 |
Item | |
| 1000 | Mining | |
| 1100 | Geology and Mine Design | |
| 1200 | Waste Dump and Haul Roads | |
| 1300 | Open Pit Mining Equipment | |
| 1400 | Mine Services - Dewatering, Dispatch, Engineering Office, Truck Shop fit-out | |
| 1500 | Mine Infrastructure and Services - Open Pit Communication | |
| 2000 | Crushing | |
| 2100 | Primary Crushing | |
| 2200 | Secondary Crushing | |
| 2300 | Tertiary Crushing | |
| 2400 | Crushing Utilities | |
| 3000 | Process Plant | |
| 3100 | Grinding | |
| 3200 | Gravity | |
| 3300 | Flotation & Regrind | |
| 3400 | Leach and Adsorption | |
| 3500 | Desorption | |
| 3600 | Goldroom | |
| 3700 | Detox Thickening, Detox, and Tailings Pumping | |
| 3800 | Reagents | |
| 3900 | Process Plant Services and Common | |
| 4000 | On-Site Infrastructure | |
| 4100 | Bulk Earthworks | |
| 4200 | Tailings Storage Facility | |
| 4300 | HV Power Switchyard and Power Distribution | |
| 4400 | Fuel Storage | |
| 4500 | Water Services | |
| 4600 | Infrastructure Buildings | |
| Fenn-Gib Project |
Page 244 | |
| NI 43-101 Technical Report and Pre-Feasibility Study |
December 19, 2025 | |
|
|
| WBS Level 1/Level 2 |
Item | |
| 4700 | Site Wide Water Management | |
| 4800 | Mobile Equipment | |
| 5000 | Off-Site Infrastructure | |
| 5100 | Main Access Road | |
| 5200 | Water Supply | |
| 5300 | Power Supply | |
| 5400 | Highway Realignment | |
| 6000 | Project Preliminaries | |
| 6100 | Temporary Construction Facilities and Services | |
| 6200 | Construction Camp | |
| 6300 | Miscellaneous Distributable Cost | |
| 6400 | Commissioning Reps and Assistance | |
| 6500 | Spares | |
| 6600 | First Fills & Initial Charges | |
| 7000 | Project Delivery | |
| 7100 | Engineering Services | |
| 7200 | Commissioning Services | |
| 8000 | Owner’s Cost | |
| 8100 | Owner’s Costs and Pre-Stripping | |
| 8200 | Closure/Reclamation Costs | |
| 9000 | Provisions | |
| 9100 | Contingency | |
| 21.2.3.3 | Material Take-off and Estimate Quantities |
Material take-offs (MTO’s) were provided in a structured and traceable manner in appropriate formats. The preparation and review of the MTO’s followed standard engineering practices.
MTOs are based on neat quantities, with factors for waste and details. No design growth factor was applied to these quantities. There is a specific provision for design growth as outlined in Section 21.2.8.5. Before an MTO was issued to estimating, a review of the area was undertaken to ensure all scope is captured. The MTO responsibilities of the engineering consultants are as follows:
| | Ausenco - Developed MTO’s for the process plant and select infrastructure (except as noted in the subsequent sections) |
| | KP - Developed MTO’s for the TSF and site water management structures. |
| Fenn-Gib Project |
Page 245 | |
| NI 43-101 Technical Report and Pre-Feasibility Study |
December 19, 2025 | |
|
|
| | AGP - Jointly developed MTO’s for site bulk earthworks with Mayfair (i.e., access roads, haul roads, etc.) and developed MTOs for the mine services area and pit dewatering water management infrastructure. |
| 21.2.4 | Area 1000 - Mine Capital Costs |
| 21.2.4.1 | Overview |
The mining capital cost estimate is grouped into various categories. These include:
| | 1200 - Waste Dumps and Haul Roads |
| | 1300 - Open Pit Mining Equipment |
| | 1400 - Mine Services—Dewatering, Dispatch, Engineering Office, Truck Shop |
| | 1500 - Mine Infrastructure - Open pit Power and Communication. The cost breakdown summary has been shown in Table 21-4. |
| Table 21-4: | Mining Capital Costs |
| Mining Capital Category |
Initial Cost Estimate ($M) |
Sustaining Cost Estimate ($M) |
Total Capital Cost Estimate ($M) |
|||||||||
| 1200 - Waste Dumps and Haul Roads |
6.3 | 1.0 | 7.3 | |||||||||
| 1300 - Open Pit Mining Equipment |
15.3 | 10.4 | 25.7 | |||||||||
| 1400 - Mine Services - Dewatering, Dispatch, Engineering Office, Truck Shop Fitout |
5.1 | 13.0 | 18.1 | |||||||||
| 1400 - Truck Shop |
4.3 | — | 4.3 | |||||||||
| 1500 - Mine Infrastructure - Open Pit Communication |
0.4 | — | 0.4 | |||||||||
| Total Mining Capital Estimate |
31.4 | 24.4 | 55.8 | |||||||||
| 21.2.4.2 | 1200 - Waste Dumps and Haul Roads |
The cost in this category covers the development of initial mine roads, waste dump foundation and pit area preparation (clearing and grubbing) and the initial water ponds and ditching system. The sustaining capital cost represents upgrading of the ditch and pond system in Year 5 to tie into Phase 1E and the expanding waste dump footprint.
Initial capital is estimated at $6.3 million with sustaining capital adding another $1 million in Year 5 for a total of $7.3 million over the LOM.
| 21.2.4.3 | 1300 - Open Pit Mining Equipment |
The mining equipment capital costs reflect the use of financing of the major equipment and most support equipment. Equipment prices for major equipment are based on current quotations from local vendors. A 10% down payment is included in the capital cost for those units financed. The remaining cost is included in operating costs discussed later in Section 21.3.3. An allowance for the cost for the base fleet management system on each piece of equipment to properly track mill feed, and waste types is included in this category.
| Fenn-Gib Project |
Page 246 | |
| NI 43-101 Technical Report and Pre-Feasibility Study |
December 19, 2025 | |
|
|
Initial capital cost requirements are estimated at $15.3 million with sustaining (new and replacement equipment) estimated at $10.4 million.
The cost of spare truck boxes, loader buckets, and dozer blades are included in the capital cost for the major equipment cost estimate.
The distribution of capital costs is completed using the number of units required within a period. If new or replacement units are needed, that number of units and using the unit cost applied against them (10% of that for major equipment) is used to determine the capital cost in that period. There is no allowance for escalation in any of these costs.
The balancing of equipment units based on operating hours is completed for each major piece of mine equipment. The smaller equipment was based on number of units required, based on operational experience. This includes such things as pickup trucks (dependent on the field crews), lighting plants, mechanics trucks, etc. Additional support equipment for snow removal and site water control was included to accommodate the expected climatic conditions.
The most significant piece of major mine equipment is the haulage trucks. At the peak of mining, 8 - 91 t units are necessary to maintain mine production. This happens in Year 9. The maximum hours/truck/year are set at 6,000. There are periods where the maximum hours per unit are below what the maximum possible can be. In those situations, increasing the maximum on the number of trucks still leaves residual hours required to complete the material movement, therefore, the number of total trucks is unchanged. In these cases, the hours required are distributed evenly across the number of trucks on site and available. The other major mine equipment is determined in the same manner.
With a mine life of 14.5 years the major equipment will require a replacement cycle. Support equipment is replaced within the mine life. The support equipment is usually replaced on a specified time interval. For example, pickup trucks are replaced every three years, with the older units possibly being passed down to other departments on the mine site, but for capital cost estimating new units are considered for mine operations, engineering, and geology.
The number of pieces of major equipment required by year are shown in Table 21-5: Mine Equipment on Site.
| Table 21-5: | Mine Equipment on Site |
| Equipment |
YEAR -1 |
YEAR 1 |
YEAR 2 |
YEAR 3 |
YEAR 4 |
YEAR 5 |
YEAR 6 |
YEAR 7 |
YEAR 8 |
YEAR 9 |
YEAR 10+ | |||||||||||
| Production Drill-165 mm |
2 | 2 | 2 | 3 | 3 | 3 | 3 | 3 | 3 | 3 | 3 | |||||||||||
| Production Loader |
1 | 1 | 1 | 1 | 1 | 1 | 1 | 1 | 1 | 1 | 1 | |||||||||||
| Hydraulic Shovel (Diesel) |
— | 1 | 2 | 2 | 2 | 2 | 2 | 2 | 2 | 2 | 2 | |||||||||||
| Haulage Truck (91 t) |
4 | 4 | 5 | 5 | 6 | 6 | 6 | 7 | 7 | 8 | 8 | |||||||||||
| Crusher Loader |
1 | 1 | 1 | 1 | 1 | 1 | 1 | 1 | 1 | 1 | 1 | |||||||||||
| Support Excavator |
1 | 1 | 1 | 1 | 1 | 1 | 1 | 1 | 1 | 1 | 1 | |||||||||||
| Track Dozer |
3 | 4 | 4 | 4 | 4 | 4 | 4 | 4 | 5 | 5 | 4 | |||||||||||
| Grader |
2 | 2 | 2 | 2 | 2 | 2 | 2 | 2 | 2 | 2 | 2 |
| Fenn-Gib Project |
Page 247 | |
| NI 43-101 Technical Report and Pre-Feasibility Study |
December 19, 2025 | |
|
|
The smaller production drills, production excavator and haulage trucks (70 t) are used in the construction of the tailings facility, roads and maintenance of the water diversion system.
The expected equipment life is:
| |
production drill (165 mm) |
= 25,000 h | ||
| |
diesel hydraulic shovel (16 m3) |
= 50,000 h | ||
| |
production loader (13 m3) |
= 35,000 h | ||
| |
haulage truck (92 t) |
= 50,000 h | ||
| |
track dozer |
= 35,000 h | ||
| |
grader |
= 25,000 h | ||
| |
support excavator |
= 10 years. | ||
Expected life for other support equipment is normally determined in number of years and varies by its duty in the mine. Light plants for example are replaced every four years. The integrated tool carrier for site support is purchased once at the Project start and is not replaced over the mine life.
| 21.2.4.4 | 1400 - Mine Services - Dewatering, Dispatch, Engineering Office, Truck Shop Fit out |
The bulk of the cost is the dewatering capital cost and ongoing horizontal drain hole program. Initial dewatering costs include pumps and piping. Sustaining costs include replacement of those items at regular intervals. Initial costs for the dewatering are $1.4 million with sustaining costs of $8.2 million over the 14.5 year mine life
Other initial costs include the engineering office equipment including survey equipment, software, dispatch servers and initial truck shop equipment.
Initial costs in this category total $5.1 million with sustaining costs of $13 million.
| 21.2.4.5 | 1400 - Additional Mining Infrastructure |
Ausenco supported with additional mining infrastructure, including a truck shop with warehousing and truck washing facilities. The truck shop cost was developed based on a pricing received from major construction contracts budgetary pricing, and include pricing for the fabric buildings, foundations and structural steel. The initial capital costs for this infrastructure totals $4.3 million.
| Fenn-Gib Project |
Page 248 | |
| NI 43-101 Technical Report and Pre-Feasibility Study |
December 19, 2025 | |
|
|
| 21.2.4.6 | 1500 - Mine Infrastructure - Open Pit Communication |
The communication system is for general communication as well as data from the equipment for use in the dispatch system. An allowance of $0.4 million has been included in this category.
| 21.2.5 | Area 2000 and 3000 - Process Plant Capital Costs |
The process plant and crushing capital cost estimate is summarized in Table 21-6.
| Table 21-6: | Capital Cost Estimate Summary - Process Plant |
| WBS Description |
Initial Capital Cost ($M) |
Sustaining Cost ($M) |
Total Cost ($M) |
|||||||||
| Primary Crushing |
15.6 | 1.1 | 16.6 | |||||||||
| Secondary Crushing |
2.8 | 0.0 | 2.8 | |||||||||
| Tertiary Crushing |
3.1 | 0.0 | 3.1 | |||||||||
| Crushing Utilities |
0.2 | 0.0 | 0.2 | |||||||||
| Grinding |
32.8 | 0.0 | 32.8 | |||||||||
| Gravity |
0.1 | 1.4 | 1.5 | |||||||||
| Flotation & Regrind |
17.8 | 0.0 | 17.8 | |||||||||
| Leach and Adsorption |
17.1 | 0.0 | 17.1 | |||||||||
| Desorption |
8.4 | 0.0 | 8.4 | |||||||||
| Goldroom |
1.4 | 0.0 | 1.4 | |||||||||
| Detox Thickening, Detox, and Tailings Pumping |
13.3 | 0.0 | 13.3 | |||||||||
| Reagents |
8.1 | 0.0 | 8.1 | |||||||||
| Process Plant Services and Common |
15.6 | 0.0 | 15.6 | |||||||||
| Total Direct Costs |
136.3 | 2.5 | 138.8 | |||||||||
The process equipment requirements were based on process flowsheets and process design criteria, as defined in Section 17. All major equipment was sized based on the process design criteria to derive a mechanical equipment list. Mechanical scopes of work were developed and sent for budgetary pricing to equipment suppliers. For mechanical equipment costs, 84% of the value was sourced from budgetary quotes; the remainder was sourced through benchmarking against other recent North American gold doré mining projects and studies.
Similarly, sizing of major electrical equipment was based on the project’s equipment list. Scopes of work were developed to receive budgetary pricing from equipment suppliers. For the electrical equipment, 91% of the value was sourced from budgetary quotations. The remainder was sourced by benchmarking against other recent North American gold doré mining projects and studies.
| Fenn-Gib Project |
Page 249 | |
| NI 43-101 Technical Report and Pre-Feasibility Study |
December 19, 2025 | |
|
|
To support the major installation construction contracts, engineering for the process plant and infrastructure was completed to a PFS level of definition. After deriving the bulk material quantities (concrete, steel, piping, etc.) for the process plant and surface infrastructure areas, major construction contracts were formed and sent to the market for supply and installation rates.
| 21.2.6 | Area 4000 - On-Site Infrastructure Capital Costs |
The on-site infrastructure capital cost estimate is summarized in Table 21-7 below.
| Table 21-7: | On-Site Infrastructure Capital Costs |
| WBS Level 2 |
WBS Description | Initial Capital Cost ($M) |
Sustaining Cost ($M) |
Total Cost ($M) | ||||
| 4100 |
Bulk Earthworks | 4.1 | 0.0 | 4.1 | ||||
| 4200 |
Tailings Storage Facility | 19.8 | 0.0 | 19.8 | ||||
| 4300 |
HV Power Switchyard and Power Distribution | 12.7 | 0.0 | 12.7 | ||||
| 4400 |
Fuel Storage | 0.2 | 0.0 | 0.2 | ||||
| 4500 |
Water Services | 16.1 | 12.2 | 28.3 | ||||
| 4600 |
Infrastructure Buildings | 6.4 | 0.0 | 6.4 | ||||
| 4700 |
Site Wide Water Management | 10.7 | 0.0 | 10.7 | ||||
| 4800 |
Mobile Equipment | 2.4 | 2.4 | 4.8 | ||||
| Total Direct Costs |
72.4 | 14.6 | 87.0 | |||||
| 21.2.6.1 | Areas 4200 and 4700 - Tailings Storage Facility and Side Wide Water Management |
The MTOs for the earthworks scope associated with the TSF and water management structures were developed by KP based on the PFS level engineering design and the site investigations (including sub-surface material properties and hydrogeological modeling) completed to-date. Unit rates applied to these quantities were derived from budgetary quotations provided by suppliers and local contractors familiar with the regional conditions and scope requirements. To ensure reliability, these unit costs were validated against benchmarks from similar projects executed under comparable site and climatic conditions, providing confidence in the accuracy and applicability of the estimate.
The Owner’s fleet will operate in coordination with the contractor’s equipment to support the downstream bulk material placement at the TSF during Year -1. Future TSF dam raises (to be completed in sustaining capital) have been costed based on a strategy where contractors perform the upstream construction, with the Owner’s mining fleet executing the placement of the downstream bulk material.
| 21.2.6.2 | Area 4100, 4300, 4400, 4500, 4600, and 4800 - On-Site Infrastructure |
The on-site infrastructure equipment requirements were based on process flowsheets and process design criteria, as defined in Section 17. All major equipment was sized based on the process design criteria to derive a mechanical equipment list. Mechanical scopes of work were developed and sent for budgetary pricing to equipment suppliers. For mechanical equipment costs, 84% of the value was sourced from budgetary quotes; the remainder was sourced through benchmarking against other recent North American gold doré mining projects and studies.
| Fenn-Gib Project |
Page 250 | |
| NI 43-101 Technical Report and Pre-Feasibility Study |
December 19, 2025 | |
|
|
Similarly, sizing of major electrical equipment was based on the project’s equipment list. Scopes of work were developed to receive budgetary pricing from equipment suppliers. For the electrical equipment, 91% of the value was sourced from budgetary quotations. The remainder was sourced by benchmarking against other recent North American gold doré mining projects and studies.
To support the major installation construction contracts, engineering for the process plant and infrastructure was completed to a PFS level of definition. After deriving the bulk material quantities (earthworks, concrete, steel, piping, etc.) for the process plant and surface infrastructure areas, major construction contracts were formed and sent to the market for supply and installation rates.
| 21.2.7 | Area 5000 - Off-Site Infrastructure Capital Costs |
The off-site infrastructure capital cost estimate is summarized in Table 21-8 below
| Table 21-8: | Off-Site Infrastructure Capital Costs |
| WBS Level 2 |
WBS Description | Initial Capital Cost ($M) |
Sustaining Cost ($M) |
Total Cost ($M) | ||||
| 5300 |
Power Supply | 13.6 | 0.0 | 13.6 | ||||
| 5400 |
Highway Realignment | 2.0 | 13.3 | 15.3 | ||||
| Total Direct Costs |
15.6 | 13.3 | 28.9 |
The high-voltage powerline cost is based on a study provided by Mayfair. Ausenco reviewed the study, with the included cost estimate, and found it to be accurate and acceptable for this study. The high voltage power line includes 17 km of new towers and a conductor, as well as a new substation.
The highway realignment cost is based on a study provided by Mayfair. Ausenco reviewed the study, with the included cost estimate, and found it to be accurate and acceptable for this study. The highway realignment includes 4.42 km in length of new highway, running north of the existing Highway 101 corridor, and is intended to be installed in year 1 of operations. An allowance for a conveyor pass-through for the initial construction of the facility has been accounted for in the construction phase.
| 21.2.8 | Areas 6000, 7000, 8000 & 9000 - Indirect Capital Costs |
The indirect capital cost estimate is summarized in Table 21-9 below.
| Fenn-Gib Project |
Page 251 | |
| NI 43-101 Technical Report and Pre-Feasibility Study |
December 19, 2025 | |
|
|
| Table 21-9: | Indirect Capital Costs |
| WBS Level 2 |
WBS Description |
Initial Capital Cost ($M) |
Sustaining Cost ($M) |
Total Cost ($M) | ||||
| 6100 |
Temporary Construction Facilities and Services | 3.0 | 0.0 | 3.0 | ||||
| 6200 |
Construction Camp | 16.9 | 0.0 | 16.9 | ||||
| 6300 |
Miscellaneous Distributable Cost | 8.7 | 0.0 | 8.7 | ||||
| 6400 |
Commissioning Reps and Assistance | 1.6 | 0.0 | 1.6 | ||||
| 6500 |
Spares | 4.6 | 0.0 | 4.6 | ||||
| 6600 |
First Fills & Initial Charges | 1.0 | 0.0 | 1.0 | ||||
| 7100 |
Engineering Services | 12.1 | 0.9 | 13.0 | ||||
| 7200 |
Commissioning Services | 18.6 | 1.6 | 20.3 | ||||
| 8100 |
Owner’s Costs | 53.4 | 0.0 | 53.4 | ||||
| 8200 |
Closure Bond Carrying Costs | 8.3 | 3.7 | 12.0 | ||||
| Total Indirect Costs | 128.3 | 6.2 | 134.5 | |||||
| 9100 |
Contingency | 65.9 | 0.0 | 65.9 |
| 21.2.8.1 | Area 6000 - Project Preliminaries |
Temporary construction facilities and construction services include facilities and services for the EPCM team and have been factored as an allowance based on total process plant and infrastructure direct costs. Project field indirects are calculated at $3.0 million and captured in WBS 6100.
The Camp costs was estimated to be rental facilities (owned and operated by a third party) located within the town of Matheson, ON. The construction camp costs were developed from a budgetary quote for the rental of a camp (including mobilization/demobilization, lease, and installation) for a 400-person capacity camp. Operational costs for the camp were developed from reference per person per day camp operational costs and applied to an estimated loading histogram. Mining construction personnel were provided from the AGP mining cost estimate and were assumed to be 50% local resources not requiring camp accommodations. Process plant and other infrastructure were estimated to have a peak load of 180 personnel, and a ramp up/ramp down histogram over the two-year construction schedule was estimated to develop the operational costs. 25% of the process plant and other infrastructure personnel were assumed to be local and not require camp accommodations. Total costs for the construction camp were calculated at $16.9 million and captured in WBS 6200.
Heavy lift crane costs tabulated to $8.4 million, and were provided by the chosen SMPP contractor, considering a high-level lifting plan to suit the construction schedule. Crane costs consider rental rates including operators and are captured in WBS 6300. Additionally, the SMPP contractor provided fuel consumption quantities, which were applied to a fuel cost. Fuel costs were calculated at $0.3 million and captured in WBS 6300.
| Fenn-Gib Project |
Page 252 | |
| NI 43-101 Technical Report and Pre-Feasibility Study |
December 19, 2025 | |
|
|
Vendor representative costs during commissioning and construction include vendor representative support during the installation of the purchased equipment. Vendor representative costs have been factored based on the equipment supply price and benchmarked against Ausenco’s in-house database of projects. Vendor representative costs were calculated at $1.6 million and captured in WBS 6400.
Commissioning, operational and capital/insurance spare quantities were recommended and priced by equipment suppliers. If vendors did not provide a cost for spares, a factored allowance was included based on the equipment supply price and benchmarked against Ausenco’s in-house database of projects. Total initial spares were calculated at $4.6 million and captured in WBS 6500.
First fills include the costs for the initial construction first fills for installed equipment and commissioning first fills which consist of chemicals, fuels and lubricants etc. First fills have been factored based on the equipment supply price and benchmarked against Ausenco’s in-house database of projects. Total first fills were calculated at $1.0 million and captured in WBS 6600.
| 21.2.8.2 | Area 7000 - Project Delivery |
Engineering, Procurement, and Construction Management (“EPCM”) costs for the process plant have been factored based on a percentage of the total direct costs for the process plant. The factor was estimated by benchmarking against Ausenco’s in-house database of projects.
EPCM costs for the mining area have been factored based on a percentage of the total direct costs for the mine development.
EPCM costs for the TSF and water management mining area have been factored based on a percentage of the total direct costs for the TSF and water management areas.
Total EPCM costs have been tabulated at $30.3 million and captured in WBS 7000.
| 21.2.8.3 | Area 8000 - Owner’s Costs |
| 21.2.8.3.1 | 8100 - Pre-Stripping |
Mining activity commences in advance of the process plant achieving commercial production. This includes the movement of 6.2 Mt of waste and placement of 0.8 Mt of mill feed material in a stockpile adjacent to the primary crusher. The mine operating costs associated with this time period are included in the capital cost estimate and expected to cost $42.3 million. This cost covers all associated management, drilling, blasting, loading, hauling, support, engineering and geology departments labour, grade control costs and financing costs.
| 21.2.8.3.2 | 8100 and 8200 - General and Administrative |
The remainder of the owner’s costs consist of G&A activities incurred during the pre-production phase, as well as the ongoing carrying costs related to Closure and Reclamation bonding.
| Fenn-Gib Project |
Page 253 | |
| NI 43-101 Technical Report and Pre-Feasibility Study |
December 19, 2025 | |
|
|
| 21.2.8.4 | Area 9000 - Contingency |
Contingency accounts for the difference between the estimated and actual costs of materials and equipment. The level of contingency varies depending on the nature of the contract and the client’s requirements. Due to uncertainties at the time the capital cost estimate was developed (in terms of the level of engineering definition, basis of the estimate, schedule development, etc.), it is essential that the estimate includes a provision to cover the risk from these uncertainties.
A contingency rate of 15% to 20% has been used based on the standards for a Class 4 AACE estimate and the level of definition of the project scope. To develop the contingency value, a deterministic contingency analysis was carried out during which a ranging workshop was held internally to evaluate the major cost components in terms of pricing confidence and quantity basis. The analysis provided input ranges for potential underrun/overrun that were in turn applied as percentages to the base estimate. No contingency has been included for project-specific risks or for management reserve.
The following contingency percentages were applied:
| | Process plant and site infrastructure - 18.4%. |
| | Mining Equipment - 5%. |
| | Mining Infrastructure and Pre-production - 20%. |
| | Highway Realignment - 30%. |
| | Incoming Power Supply - 34%. |
| | TSF and Water Management - 20%. |
| | Owner - 10%. |
| 21.2.8.5 | Growth |
A growth allowance has been allocated to each line item in the capital cost estimate to reflect the level of design definition and pricing strategy. The allowance provides for additional costs that will be recognized in future project phases as engineering is advanced.
Estimate growth:
| | intends to account for items that cannot be quantified based on current engineering status but are empirically known to appear |
| | represents the accuracy of quantity take-offs and engineering lists based on the level of engineering and design undertaken at a feasibility study level |
| Fenn-Gib Project |
Page 254 | |
| NI 43-101 Technical Report and Pre-Feasibility Study |
December 19, 2025 | |
|
|
| | represents pricing growth for the likely increase in cost due to development and refinement of specifications as well as re-pricing after initial budget quotations and after finalization of commercial terms and conditions to be used on the project. |
Growth has been calculated on a line-item level by evaluating the status of the engineering scope definition and maturity and the ratio of the various pricing sources for equipment and materials used to compile the estimate. The growth rate applied was based on guidance aligning to a Class 4 AACE estimate and the level of definition of the project scope.
| 21.2.8.6 | Freight, Logistics, Taxes, and Duties |
Freight costs have been calculated from vendor quotations where available. Where vendors did not provide a cost for freight, a factor was applied. 10.5% freight cost was used for equipment coming from overseas where quoted freight numbers were not provided. A 7% freight cost was used for equipment coming from inland where quoted freight numbers were not provided.
In the procurement process, the source of materials was considered with the impact of duties and tariffs. In the estimate, and in discussions with major suppliers and original equipment manufacturers, there were no significant impacts identified, and taxes and duties are excluded from the CAPEX.
| 21.2.9 | Closure Costs |
Closure costs have been estimated based on preliminary conceptual plans for the Project and are presented in Table 21-10. These concepts were developed without input from government agencies or consultation with affected Indigenous communities. Consequently, the closure cost estimates are subject to revision as design progresses and stakeholder engagement occurs. Closure costs are considered reasonable and representative of the current design, the understanding of the Project and the regulations and permitting generally associated with mine closure.
| Table 21-10: | Closure Costs |
| Description |
Cost ($M) | |
| Mobilization/Demobilization for Closure |
2.8 | |
| TSF Closure |
22.3 | |
| Water Management Pond Closure |
1.5 | |
| Mine Rock Storage Area Closure |
7.0 | |
| Open Pit Closure |
6.7 | |
| Plant Site Closure |
5.6 | |
| ECM for Closure |
3.5 | |
| Closure/Reclamation Costs |
49.4 |
Note: No contingency included in the closure cost estimate
| Fenn-Gib Project |
Page 255 | |
| NI 43-101 Technical Report and Pre-Feasibility Study |
December 19, 2025 | |
|
|
| 21.2.10 | Exclusions |
The following costs and scope will be excluded from the capital cost estimate:
| | Operating costs and revenue generated following project commissioning and prior to commercial production. |
| | Taxes and duties. |
| | Environmental approvals. |
| | Special incentives (schedule, safety or others). |
| | No allowance has been made for loss of productivity and/or disruption due to religious, union, social and/or cultural activities. |
| | Escalation beyond the base date Q3 2025. |
| | Environmental impact assessment and permitting conditions that may increase operating costs. |
| | Future scope changes. |
| | Demolition (included in the closure costs) and salvage of any existing on-site structures. |
| | Lost time due to weather, labour availability and disruption or force majeure events. |
| | Training of operations personnel and operational readiness planning. |
| | Management reserve. |
| | Project financing costs.. |
| 21.3 | Operating Costs |
| 21.3.1 | Overview |
The operating cost estimate is presented in Q3 2025 Canadian dollars ($) and was prepared to a Class 4 estimate with an accuracy of ±25% as defined by the Association for the Advancement of Cost Engineering International. The estimate includes mining, processing, and general and administration (G&A) costs.
The overall operating cost over the life-of-mine of the project is $1,493 million over 15 years, or an average of $59.43/t processed. The operating costs are summarized in Table 21-11 below.
| Table 21-11: | Operating Cost Summary |
| Cost Area |
Total LOM ($M) | $/t Processed | % of Total | |||
| Mining1 |
771 | 30.66 | 52% | |||
| Process |
483 | 19.22 | 32% | |||
| G&A |
171 | 6.82 | 11% | |||
| Refining and Royalties |
68 | 2.73 | 5% | |||
| Total |
1,493 | 59.43 | 100% |
Note:
| 1. | Equivalent to $4.53/t mined |
| Fenn-Gib Project |
Page 256 | |
| NI 43-101 Technical Report and Pre-Feasibility Study |
December 19, 2025 | |
|
|
| 21.3.2 | Basis of Estimate |
Unless otherwise stated, all costs presented in this chapter are in Canadian dollars. The operating costs were calculated based on process and maintenance consumables, workforce and G&A costs.
Common to all operating cost estimates are the following assumptions:
| | Costs are estimated based on Q3 2025 pricing without allowances for inflation. |
| | For material sourced in US dollars, an exchange rate of 1.35 Canadian dollar to 1.00 US dollar was assumed. |
| | Estimated cost for diesel is $1.13/L. |
| | Power costs are calculated using a unit price of $0.11/kWh, provided by Mayfair Gold. |
| 21.3.3 | Mine Operating Costs |
The mine operating costs have been estimated from base principles with vendor quotations for repair and maintenance costs and other suppliers for consumables. Key inputs to the mine cost are fuel and labour. The fuel price quoted for the Project was $1.13/L delivered to the site. The mining fleet and support equipment fleets are diesel powered.
| 21.3.3.1 | Labour |
Labour costs for the various job classifications were obtained from salary surveys in Ontario and other operations. A burden rate of 35% was applied to the various rates. Labour was estimated for both staff and hourly on a 12-hour shift basis utilizing a rotation of either two weeks on/two weeks off or four days on, three days off. Mine staff positions are shown in Table 21-12.
| Table 21-12: | Mine Staffing Requirements included in Labour Cost (Year 4) |
| Position |
Estimated Number of personnel | |
| Mine Maintenance | ||
| Maintenance Shift Supervisor |
2 | |
| Maintenance Planner/Contract Administration |
1 | |
| Clerk |
1 | |
| Subtotal |
4 | |
| Mine Operations | ||
| Fenn-Gib Project |
Page 257 | |
| NI 43-101 Technical Report and Pre-Feasibility Study |
December 19, 2025 | |
|
|
| Position |
Estimated Number of personnel | |
| Mine Operations/Technical Superintendent |
1 | |
| Senior Shift Supervisor |
4 | |
| Road Crew/Services Supervisor |
1 | |
| Clerk |
1 | |
| Subtotal |
7 | |
| Mine Engineering | ||
| Senior Engineer |
1 | |
| Open Pit Planning Engineer |
1 | |
| Geotechnical Engineer |
1 | |
| Blasting/Geotechnical Technician |
1 | |
| Dispatch Technician |
2 | |
| Surveyor/Mining Technician |
2 | |
| Surveyor/Mining Technician Helper |
2 | |
| Clerk |
1 | |
| Subtotal |
11 | |
| Geology |
||
| Senior Geologist |
1 | |
| Grade Control Geologist/Modeler |
1 | |
| Sampling/Geology Technician |
2 | |
| Subtotal |
4 | |
| Total |
26 | |
The mine staff labour remains constant from Year 3 until the end of the mine life. During the pre-production period and Years 1, and 2, there is a trainer position in mine operations.
Hourly employee labour force levels in mine operations and maintenance fluctuate with production requirements. The Year 4 hourly labour requirements are shown in Table 21-13.
| Table 21-13: | Hourly Manpower Requirements included in Labour Cost (Year 4) |
| Position |
Estimated Number of personnel | |
| Mine General | ||
| General Equipment Operator |
8 | |
| Road/Pump Crew |
4 | |
| General Mine Labourer |
4 | |
| Light Duty Mechanic |
1 | |
| Tire Technician |
1 | |
| Lube Truck Driver |
4 | |
| Fenn-Gib Project |
Page 258 | |
| NI 43-101 Technical Report and Pre-Feasibility Study |
December 19, 2025 | |
|
|
| Position |
Estimated Number of personnel | |
| Subtotal |
22 | |
| Mine Operations | ||
| Driller |
8 | |
| Blaster |
1 | |
| Blast Helper |
2 | |
| Loader Operator |
4 | |
| Hydraulic Shovel Operator |
8 | |
| Haul Truck Driver |
24 | |
| Dozer Operator |
10 | |
| Grader Operator |
6 | |
| Crusher Loader Operator |
3 | |
| Snowplow/Water Truck |
4 | |
| Subtotal |
70 | |
| Mine Maintenance | ||
| Heavy Duty Mechanic |
15 | |
| Welder |
13 | |
| Electrician |
1 | |
| Apprentice |
6 | |
| Subtotal |
35 | |
| Total |
127 | |
Labour costs assume an owner operated model, with Mayfair conducting all equipment maintenance using its own personnel. The potential use of an external maintenance and repair contract (MARC) will be evaluated in later phases of the Project. Comprehensive organizational structures will also be developed in subsequent phases.
The mine manager oversees mine operations, maintenance, engineering, and geology. Reporting to this role are mine and maintenance shift supervisors, a senior engineer, and a senior geologist. The mine has four operations crews, each led by a senior shift supervisor. A road crew/services supervisor manages roads, drainage, and pumping, and serves as backup for the senior mine shift supervisor. The training supervisor position is temporary and ends after Year 2.
Engineering reports to one senior engineer, including an open pit engineer and a geotechnical engineer. The blasting technician is part of short-range planning, which also includes two surveyor/mine technicians, two surveyors/mine helpers, and a clerk. The geotechnical engineer oversees wall slopes, waste dumps, and tailings facilities.
The geology department has one senior geologist, a grade control geologist/modeler, two grade control/sampling technicians, and shares a clerk with engineering.
Four mine maintenance shift supervisors, a maintenance planner/contract administrator, and a clerk report to the mine manager.
| Fenn-Gib Project |
Page 259 | |
| NI 43-101 Technical Report and Pre-Feasibility Study |
December 19, 2025 | |
|
|
The hourly labour force will include positions such as the light duty mechanic, tire technicians, and lube truck drivers. These positions will all report to maintenance. There will generally be one of each position per crew. Other general labour will include general mine labourers (1/ crew) and trainees (1/crew) plus two road/pump crew personnel per crew (dayshift only) for water management/snow removal.
The drilling labour force is based on one operator per drill, per crew while operating. This peaks at 12 drillers in Years 5-9 and then drops over time as the drilling hours are diminished.
Shovel and loader operators will peak at 12 in Year 2 and maintain that level until Year 10. Haulage truck drivers will peak at 28 in Year 8 and then drop off to the end of the mine life.
Maintenance factors are used to determine the number of heavy-duty mechanics, welders and electricians that are required and are based on the number of equipment operators. Heavy duty mechanics work out to 0.25 mechanics required for each drill operator, for example. Welders are 0.25/operator and electricians are 0.05/operator.
The number of loader, truck and support equipment operators is estimated using the projected equipment operating hours. The maximum number of employees is 4/unit to match the mine crews.
| 21.3.3.2 | Equipment Operating Costs |
The vendors provided repair and maintenance (R&M) costs for each piece of equipment selected for the PFS. Fuel consumption rates were estimated from the information supplied and knowledge of the working conditions. The costs for R&M are expressed in $/h form.
Tire costs were also collected from various vendors for the sizes expected to be used. Estimates of tire life are based on AGP’s experience and discussions with the vendors. The operating cost of the tires is also expressed in $/h form. The life of the haulage truck tires is estimated at 5,500 h/tire with proper rotation from front to back. Each truck tire is estimated to cost $17,200 so the cost per hour for tires is $18.73/h for the truck using six tires in the calculation.
Ground engaging tools (GET) costing is estimated from other projects and is an area that would be refined once the Project is operational.
Drill consumables are estimated as a complete drill string using the parts list and component lives provided by the vendor. Drill productivity is estimated at 25.8 m/h for mill feed and waste rock material. The equipment costs used in the estimate are shown in Table 21-14.
| Table 21-14: | Major Equipment Operating Costs - No labour ($/h) |
| Equipment |
Fuel/Power ($/h) |
Lube/Oil ($/h) |
Tires/Undercarriage ($/h) |
Repair & Maintenance ($/h) |
GET/Consumables ($/h) |
Total ($/h) |
||||||||||||||||||
| Production Drill (165 mm) |
56.50 | 5.65 | 3.00 | 164.52 | 125.69 | 355.36 | ||||||||||||||||||
| Production Loader (13 m3) |
101.70 | 15.26 | 33.01 | 82.95 | 25.00 | 257.91 | ||||||||||||||||||
| Hydraulic Shovel (16 m3) |
192.10 | 19.21 | — | 176.96 | 35.00 | 423.27 | ||||||||||||||||||
| Haulage Truck (91 t) |
63.28 | 6.33 | 18.73 | 82.66 | 5.00 | 176.00 | ||||||||||||||||||
| Fenn-Gib Project |
Page 260 | |
| NI 43-101 Technical Report and Pre-Feasibility Study |
December 19, 2025 | |
|
|
| Equipment |
Fuel/Power ($/h) |
Lube/Oil ($/h) |
Tires/Undercarriage ($/h) |
Repair & Maintenance ($/h) |
GET/Consumables ($/h) |
Total ($/h) | ||||||
| Track Dozer |
79.10 | 7.91 | 10.00 | 77.18 | 5.00 | 179.19 | ||||||
| Grader |
22.60 | 2.26 | 3.41 | 36.82 | 5.00 | 70.09 |
| 21.3.3.3 | Drilling |
Drilling in the open pit will use down the hole hammer drill rigs with 165 mm bits. The material is designed to be blasted smaller and finer to improve productivity and reduce maintenance costs as well as improve plant performance. The drilling pattern parameters are shown in Table 21-15.
| Table 21-15: | Drill Pattern Specifications |
| Specification |
Unit |
Production Drill | ||||||
| Mill Feed |
Waste |
Pre-shear | ||||||
| Bench Height |
m | 10 | 10 | 10 | ||||
| Sub-drill |
m | 0.9 | 0.9 | 0.0 | ||||
| Blasthole Diameter |
mm | 165 | 165 | 165 | ||||
| Pattern Spacing — Staggered |
m | 4.7 | 5.0 | 2.0 | ||||
| Pattern Burden — Staggered |
m | 4.3 | 4.5 | 2.3 | ||||
The sub-drill is included to allow for caving of the holes in weaker zones, reducing re-drill requirements or short holes that would affect bench floor conditions.
The parameters used to estimate drill productivity are shown in Table 21-16.
| Table 21-16: | Drill Productivity Criteria |
| Drill Activity |
Unit |
Small Drill | ||
| Pure Penetration Rate |
m/min | 0.55 | ||
| Hole Depth |
m | 10.9 | ||
| Drill Time |
min | 19.82 | ||
| Move, Spot and Collar Hole |
min | 3.00 | ||
| Level Drill |
min | 0.50 | ||
| Add Steel |
min | 0.50 | ||
| Pull Drill Rods |
min | 1.50 | ||
| Total Setup/Breakdown Time |
min | 5.50 | ||
| Total Drill Time per Hole |
min | 25.3 | ||
| Drill Productivity |
m/hr | 25.8 |
| Fenn-Gib Project |
Page 261 | |
| NI 43-101 Technical Report and Pre-Feasibility Study |
December 19, 2025 | |
|
|
| 21.3.3.4 | Blasting |
An emulsion product will be used for blasting to provide water protection. With the high rainfall, large snowmelt and working near swampy terrain it is expected that a water-resistant explosive will be required. The powder factors used in the explosive calculation are shown in Table 21-17.
| Table 21-17: | Design Powder Factors |
| Unit |
Production Drill | |||||
| Mill Feed |
Waste | |||||
| Powder Factor |
kg/m3 | 0.94 | 0.83 | |||
| Powder Factor |
kg/t | 0.33 | 0.32 | |||
The blasting cost is estimated using quotations from a local explosive vendor. The mine will be responsible for guiding the loading process, including placement of boosters/Nonels, and stemming and firing the shot.
The explosives vendor will also lease the explosives and accessories for a monthly cost. A service charge for the vendors pickup trucks, pumps, labour, and cost of the explosives plant are included.
| 21.3.3.5 | Loading |
Loading costs for both mill feed and waste are based on the use of diesel hydraulic shovels and front-end loaders. The shovels will be the primary diggers with the front-end loaders as backup/support units. The average percentage of each material type that the various loading units are responsible for is shown in Table 21-18. This highlights the focus of the shovels over the loaders.
| Table 21-18: | Loading Equipment Parameters |
| Unit |
Diesel Hydraulic Shovel |
Front End Loader | ||||
| Bucket Capacity |
m3 | 16 | 13 | |||
| Truck Capacity Loaded |
t | 92 | 92 | |||
| Waste Tonnage Loaded |
% | 90 | 10 | |||
| Mill Feed Tonnage Loaded |
% | 90 | 10 | |||
| Bucket Fill Factor |
% | 80 | 78 | |||
| Cycle Time |
sec | 38 | 42 | |||
| Trucks present at loading unit |
% | 80 | 80 | |||
| Loading Time |
min | 2.00 | 2.80 |
The trucks present at the loading unit refers to the percentage of time a truck is available to be loaded. To maximize truck productivity and reduce operating costs, it is more efficient to slightly under-truck the loading unit. One of the largest operating cost items is haulage and minimizing this cost by maximizing the truck productivity is crucial to lower operating costs. The value of 80% comes from the standby time shovels typically encounter due to a lack of trucks.
| Fenn-Gib Project |
Page 262 | |
| NI 43-101 Technical Report and Pre-Feasibility Study |
December 19, 2025 | |
|
|
| 21.3.3.6 | Hauling |
Haulage profiles were determined for each pit phase for the primary crusher or the mine rock storage area destinations. Cycle times were generated for the appropriate period tonnage by destination and phase to estimate the haulage costs. Maximum speed on the trucks is limited to 50 km/h for tire life and safety reasons although very few locations in the mine plan offer the truck the opportunity to accelerate to that velocity.
| 21.3.3.7 | Support Equipment |
Support equipment hours and costs are determined on factors applied to various major pieces of equipment. For the PFS some of the factors used are shown in Table 21-19.
| Table 21-19: | Support Equipment Operating Factors |
| Mine Equipment |
Factor | Factor Units | ||
| Track Dozer |
45% | Of haulage hours to maximum of 5 dozers | ||
| Grader |
25% | Of haulage hours to maximum of 2 graders | ||
| Crusher Loader |
35% | Of loading hours to maximum of 1 loader | ||
| Snowplow/Water Truck |
12% | Of haulage hours to maximum of 2 trucks | ||
| Pit Support Backhoe |
4 | Hours/day/unit | ||
| Road Crew Backhoe |
4 | hours/day/unit | ||
| Road Crew Dump Truck |
6 | hours/day/unit | ||
| Road Crew Loader |
6 | hours/day/unit | ||
| Lube/Fuel Truck |
8 | hours/day/unit | ||
| Mechanics Truck |
10 | hours/day/unit | ||
| Blasting Loader |
8 | hours/day/unit | ||
| Blaster’s Truck |
8 | hours/day/unit | ||
| Integrated Tool Carrier |
2 | hours/day/unit | ||
| Light Plants |
12 | hours/day/unit | ||
| Pickup Trucks |
10 | hours/day/unit |
These factors resulted in the need for five track dozers, two graders, and one support backhoe. Their tasks include clean-up of the loader faces, roads, MRSA, TSF and blast patterns. The graders will maintain the crusher and waste haul routes. In addition, snowplows/water trucks have the responsibility for patrolling the haul roads for snow removal and controlling fugitive dust for safety and environmental reasons. The small backhoe and road crew dump trucks will be responsible for cleaning out sedimentation ponds and water ditch repairs.
| Fenn-Gib Project |
Page 263 | |
| NI 43-101 Technical Report and Pre-Feasibility Study |
December 19, 2025 | |
|
|
The hours generated in this manner are applied to the individual operating costs for each piece of equipment. Many of these units are support equipment so no direct labour is allocated to them due to their variable function. The operators come from the General Equipment operator pool.
| 21.3.3.8 | Grade Control |
Grade control will be completed with a reverse circulation (RC) drill rig. It will drill the deposit off on a 10 x 5 m pattern in areas of known mineralization taking samples each meter. The holes will be inclined at 60°.
In areas of low-grade mineralization or waste the pattern spacing will be 20 x 10 m with sampling over 6 m. These holes will be used to find undiscovered veinlets or pockets of mineralization. Over the LOM, a total of 213,600 m of drilling are expected to be completed for grade control work. A total of 234,500 samples will be assayed from that drilling.
These grade control holes serve to define the mill feed grade and contacts.
Samples collected will be sent to the assay laboratory and assayed for use in the short-range mining model.
No additional costing for blasthole sampling has been included. This may be an opportunity when more knowledge has been gained operationally on the gold deportment and applicability of blast hole sampling.
Costs associated with this separate drill program are tracked as a distinct line item for the mining cost. The drill crew is one driller and two helpers with oversight by the Mine Geology department. The cost of this drilling is expected to average just under $2.0 million/a.
| 21.3.3.9 | Dewatering |
Pit dewatering will be an important part of mining. Significant volumes need to be pumped initially to allow the open pit to advance, in addition to the normal rain/snow amounts.
Initial pumping in Year -1 is expected to be 0.8 Mm3. That climbs to 2.5 Mm3/a by Year 15 as the pit drives deeper.
The dewatering will be completed with a set of two pumps in the pit and one pump on the surface to push the water to collection ponds. These pumps will be powered by diesel.
Additional dewatering in the form of horizontal drill holes may be needed and are part of the dewatering costs. These holes will be campaigned and will be part of sustaining mine capital.
Dewatering is expected to cost $18.3 M over the mine life.
| 21.3.3.10 | Leasing |
Leasing of the mine fleet is considered a viable option to reduce initial capital. Various vendors offer this as an option to help select their equipment.
Indicative terms for leasing provided by the vendors are:
| Fenn-Gib Project |
Page 264 | |
| NI 43-101 Technical Report and Pre-Feasibility Study |
December 19, 2025 | |
|
|
| | down payment = 10% of equipment cost |
| | term length = 3-5 years (depending on equipment) |
| | interest rate = CORRA (2.5%) plus a percentage |
| | residual = $0. |
The initial capital, down payments, and annual leasing costs are shown earlier in the capital cost area of this section.
The support equipment fleet is calculated in the same manner as the major mining equipment.
All of the major mine equipment, and the majority of the support equipment where it was considered reasonable, is leased. If the equipment has a life greater than the lease term length, then the following years onward of the lease do not have a lease payment applied. In the case of the mine trucks, with an approximate 10-year working life, the lease would be complete, and the trucks would simply incur operating costs after that time. For this reason, the operating cost would vary annually depending on the equipment replacement schedule and timing of the leases.
Utilizing the leasing option adds $0.12/t moved to the operating cost over the life of mine. On a cost per tonne of mill feed basis, it is $0.83/t mill feed.
| 21.3.3.11 | Total Mine Costs |
The total life of mine operating costs per tonne of material mined, moved (including rehandle) and per tonne of mill feed processed are shown in Table 21-20.
In the “General” category is the cost associated with a crushing plant to make stemming material and road crush. That cost averages approximately $0.3 million/a.
| Table 21-20: | Total Open Pit Mine Operating Cost Estimate - With Leasing |
| Cost Area |
Total ($M) |
$/t mined |
$/t processed |
% of Total | ||||
| General |
116.5 | 0.71 | 4.64 | 15% | ||||
| Drill |
73.7 | 0.45 | 2.93 | 10% | ||||
| Blast |
96.2 | 0.57 | 3.83 | 12% | ||||
| Load |
87.5 | 0.51 | 3.48 | 11% | ||||
| Haul |
141.6 | 0.85 | 5.64 | 18% | ||||
| Support |
184.4 | 1.10 | 7.34 | 24% | ||||
| Grade Control |
29.2 | 0.17 | 1.16 | 4% | ||||
| Dewatering |
20.5 | 0.12 | 0.82 | 3% | ||||
| Subtotal |
749.6 | 4.41 | 29.77 | — | ||||
| Leasing Costs |
20.9 | 0.12 | 0.83 | 3% | ||||
| Total |
770.5 | 4.53 | 30.66 | — |
| Fenn-Gib Project |
Page 265 | |
| NI 43-101 Technical Report and Pre-Feasibility Study |
December 19, 2025 | |
|
|
| 21.3.4 | Process Operating Costs |
The process operating cost estimate includes costs associated with process reagents and consumable consumption, plant maintenance, power use, laboratory costs, process plant labour, waste water treatment plant and process plant mobile equipment. A summary of the process plant operating costs is provided in Table 21-21.
| Table 21-21: | Process Plant Operating Cost Summary |
| Cost Area |
Typical Annual Cost ($M/a) |
LOM Avg. $/t Processed | ||
| Reagents and Consumables |
12.4 | 7.09 | ||
| Plant Maintenance |
2.0 | 1.12 | ||
| Power |
9.0 | 5.13 | ||
| Effluent Treatment |
0.8 | 0.43 | ||
| Laboratory |
1.4 | 0.78 | ||
| Labour (Operations and Maintenance) |
7.6 | 4.52 | ||
| Vehicles (Operations and Maintenance) |
0.2 | 0.14 | ||
| Processing Subtotal |
33.3 | 19.22 |
The process operating costs are estimated at $33.3 million/a, at an average of $19.22/t processed. A detailed breakdown of these costs is described in the following subsections.
| 21.3.4.1 | Reagents and Consumables |
Individual reagent consumption rates were estimated based on the metallurgical testwork results, Ausenco’s in-house database and experience, industry practice, and peer-reviewed literature. Consumables consumption rates were estimated based on engineering calculations, Ausenco’s in-house database and experience, and standard industry practice. Reagent and consumables unit costs are based on recently received Canadian quotes and/or Ausenco’s unit cost database.
The annual and per tonne processed costs for each reagent and consumable is summarized in Table 21-22.
| Table 21-22: | Reagent and Consumables Cost Summary |
| Reagents and Consumables |
Typical Annual Cost ($M/a) |
Unit Cost ($/t processed) | ||
| Reagents |
7.4 | 4.26 | ||
| Hydrated Lime |
0.76 | 0.44 | ||
| Aerophine 3501 |
0.17 | 0.10 | ||
| Aerophine 3477 |
0.17 | 0.10 | ||
| Methyl Isobutyl Carbinol (MIBC) |
0.45 | 0.26 | ||
| Potassium Amyl Xanthate (PAX) |
0.34 | 0.20 | ||
| Flocculant |
0.03 | 0.02 |
| Fenn-Gib Project |
Page 266 | |
| NI 43-101 Technical Report and Pre-Feasibility Study |
December 19, 2025 | |
|
|
| Reagents and Consumables |
Typical Annual Cost ($M/a) |
Unit Cost ($/t processed) | ||
| Sodium cyanide |
4.63 | 2.64 | ||
| Sodium hydroxide |
0.08 | 0.05 | ||
| Sodium metabisulphite |
0.55 | 0.31 | ||
| Copper sulphate |
0.04 | 0.02 | ||
| Nitric acid |
0.11 | 0.06 | ||
| Activated Carbon |
0.12 | 0.07 | ||
| Fluxes |
0.01 | 0.00 | ||
| Consumables | 4.95 | 2.83 | ||
| Jaw crusher cheek & swing jaw set |
0.08 | 0.05 | ||
| Secondary crusher mantle/bowl liner |
0.18 | 0.10 | ||
| Tertiary mantle/bowl liner |
0.18 | 0.10 | ||
| Secondary screen media |
0.15 | 0.09 | ||
| Ball mill grinding media |
3.14 | 1.79 | ||
| Ball mill liner |
0.36 | 0.21 | ||
| Regrind mill grinding media |
0.45 | 0.26 | ||
| Regrind mill liners & spares |
0.39 | 0.22 | ||
| Crucibles |
0.02 | 0.01 | ||
| Total |
12.4 | 7.09 |
| 21.3.4.2 | Plant Maintenance |
Annual maintenance costs have been calculated based on the total installed mechanical equipment cost by area and applying a maintenance factor between 2% and 6%, based on industry benchmarks. The maintenance factor and cost by area is presented in Table 21-23.
| Table 21-23: | Process Plant Maintenance Cost Summary |
| Area |
Maintenance Factor (%) |
Typical Annual Cost ($M/a) |
Unit Cost ($/t processed) | |||
| Crushing |
5.0 | 0.53 | 0.30 | |||
| Grinding |
5.0 | 0.50 | 0.29 | |||
| Flotation and regrind |
4.0 | 0.29 | 0.17 | |||
| Leach and adsorption |
5.0 | 0.23 | 0.13 | |||
| Desorption |
3.0 | 0.15 | 0.08 | |||
| Goldroom |
4.0 | 0.00 | 0.00 | |||
| Detox and tailings |
5.0 | 0.13 | 0.08 | |||
| Reagents |
3.0 | 0.06 | 0.04 | |||
| Process plant services |
2.0 | 0.06 | 0.03 | |||
| Total |
4.3 | 1.96 | 1.12 |
| Fenn-Gib Project |
Page 267 | |
| NI 43-101 Technical Report and Pre-Feasibility Study |
December 19, 2025 | |
|
|
| 21.3.4.3 | Power |
The processing plant power draw is based on the average power utilization of each motor on the electrical load list for the plant. An estimated 81.6 GWh per year is required annually. Installed power and power cost by area is presented in Table 21-24.
Table 21-24: Process Plant Power Cost Summary
| Area |
Installed Power (kW) |
Typical Annual Cost ($M/a) |
Unit Cost ($/t processed) | |||
| Crushing |
1,309 | 0.54 | 0.31 | |||
| Grinding |
6,062 | 4.40 | 2.51 | |||
| Flotation and regrind |
2,496 | 1.71 | 0.98 | |||
| Leach and adsorption |
265 | 0.13 | 0.08 | |||
| Desorption |
605 | 0.35 | 0.20 | |||
| Goldroom |
283 | 0.16 | 0.09 | |||
| Detox and tailings |
421 | 0.13 | 0.07 | |||
| Reagents |
156 | 0.05 | 0.03 | |||
| Process plant services |
1,657 | 0.71 | 0.40 | |||
| Ancillaries |
1,874 | 0.80 | 0.46 | |||
| Total |
15,127 | 8.98 | 5.13 |
| 21.3.4.4 | Effluent Treatment |
Effluent treatment costs have been estimated based on benchmarks from similar Canadian projects. Effluent treatment costs are estimated at $0.76 million/a.
| 21.3.4.5 | Laboratory |
Operating costs associated with laboratory and assay activities were estimated by Ausenco according to the anticipated number of assays per year. These costs are related to sample preparation and assays for processing plant samples, as well as environmental monitoring assays. Mine samples are also included. The total estimated laboratory cost is $1.36 million/a.
| 21.3.4.6 | Labour |
The personnel requirement for the Project was estimated based on benchmarking against similar projects in the same region with access to similar labour pools. The labour costs incorporate personnel requirements for plant operations, such as management, metallurgy, operations, maintenance, site services, assay laboratory, and contractor allowance. The total process plant labour force includes 69 employees.
| Fenn-Gib Project |
Page 268 | |
| NI 43-101 Technical Report and Pre-Feasibility Study |
December 19, 2025 | |
|
|
Individual personnel were divided into their positions and classified as either eight-hour or twelve-hour shift employees. Salaries were estimated using benchmarks for similar projects in similar regions. An organizational staffing plan outlining the labour requirement for the process plant is shown in Table 21-25. Costs include all benefits and bonuses.
| Table 21-25: | Process Plant Staffing Plan included in Labour Cost |
| Position |
Total Persons | |
| Mill Manager |
1 | |
| Operations Superintendent |
1 | |
| Metallurgy Superintendent |
1 | |
| Maintenance Superintendent |
1 | |
| Maintenance Planner |
1 | |
| Senior Metallurgist |
1 | |
| TMF Engineer-in-training |
1 | |
| Shift Supervisor |
4 | |
| Assistant Superintendent |
4 | |
| Crushing Operator |
4 | |
| Grinding Operator |
4 | |
| Leach/Elution Operator |
4 | |
| Equipment Operator |
4 | |
| Control Room Operator |
4 | |
| TMF Labourer |
4 | |
| Mechanical Supervisor |
2 | |
| Millwright |
10 | |
| Apprentice |
2 | |
| Electrical Supervisor |
2 | |
| Electrician |
4 | |
| Instrumentation Technician |
2 | |
| Process Control Technician |
2 | |
|
Metallurgist-in-Training |
1 | |
| Metallurgy technician |
2 | |
| Sample Preparation Labourer |
2 | |
| Goldroom Refiner |
1 | |
| Process Plant Labour Total |
69 |
| Fenn-Gib Project |
Page 269 | |
| NI 43-101 Technical Report and Pre-Feasibility Study |
December 19, 2025 | |
|
|
| 21.3.4.7 | Vehicles |
Vehicle costs are based on a scheduled number of light vehicles and mobile equipment (including fuel, maintenance, spares, times, and annual registration, and insurance fees). Mobile equipment required includes light vehicles, forklifts, front-end loaders, a bulldozer, and a flat-bed truck. The total estimated mobile equipment cost is $0.244 million/a.
| 21.3.5 | General and Administrative Operating Costs |
G&A operating costs are expenses not directly related to the operation of the process plant but required to support safe and effective operation of the facility and satisfy legislative requirements in some cases.
G&A costs include items such as:
| | site administration, maintenance, and security, including subscriptions, memberships, advertisement, office supplied and garbage disposal |
| | human resources, including training, recruiting, and community relations |
| | cost related to travel to the operations from the regional communities |
| | property, including claims and property tax |
| | health and safety, including personal protective equipment, hospital service cost, and first aid |
| | environmental, including water sampling and tailings management facility operating costs |
| | IT & telecommunications, including hardware and support services |
| | contract services, including insurance, consulting, sanitation and cleaning, license fees, and legal fees |
| | mobile equipment, including diesel and maintenance costs, for equipment supporting G&A services such as security, health & safety and others |
| | G&A labour such as administrators, finance, procurement, security, safety, human resources, etc. |
| | power costs associated with supporting G&A services and facilities |
The G&A operating costs are estimated at $11.9 million/a, at an average of $6.82/t processed. The following subsections give a breakdown of the estimated G&A costs
Costs associated with Indigenous Impact and Benefit Agreements (“IBAs”) have not yet been negotiated and, therefore, are not included in the financial cost model. Furthermore, any costs related to IBAs are considered confidential.
| 21.3.5.1 | G&A Expenses |
G&A expenses were estimated based on similar Canadian projects using Ausenco’s in-house database. Expenses are summarized in Table 21-26.
| Fenn-Gib Project |
Page 270 | |
| NI 43-101 Technical Report and Pre-Feasibility Study |
December 19, 2025 | |
|
|
| Table 21-26: | G&A Expenses Summary |
| Area |
Typical Annual Cost ($M/a) |
Unit Cost ($/t processed) | ||
| Labour |
5.3 | 3.05 | ||
| Expenses |
6.4 | 3.66 | ||
| Vehicles |
0.2 | 0.11 | ||
| Total |
11.9 | 6.82 |
| 21.3.5.2 | G&A Labour |
The G&A personnel requirement for the Project was estimated based on benchmarking against similar projects in the same region with access to similar labour pools. The labour costs incorporate personnel requirements for managers, finance, security, safety, environmental services, site services and human resources. The total G&A labour force includes 51 employees.
Individual personnel were divided into their positions and classified as either eight-hour or twelve-hour shift employees. Salaries were estimated using benchmarks for similar projects in similar regions. An organizational staffing plan outlining the labour requirement for the G&A services is shown in Table 21-27. Costs include all benefits and bonuses.
| Table 21-27: | G&A Staffing Plan included in Labour Cost |
| Position |
Total Persons | |
| General Manager |
1 | |
| HSEC Manager |
1 | |
| Admin Asst |
1 | |
| Finance Manager |
1 | |
| HR & Security Manager |
1 | |
| Accounts Payable |
2 | |
| Procurement Superintendent |
1 | |
| Payroll |
2 | |
| Buyers |
2 | |
| Warehouse Supervisor |
2 | |
| Warehouse Techs |
4 | |
| Main Gate |
4 | |
| Patrol |
4 | |
| Security Superintendent |
1 | |
| Security Logistics |
1 | |
| Goldroom Security |
1 | |
| Safety Officers |
2 |
| Fenn-Gib Project |
Page 271 | |
| NI 43-101 Technical Report and Pre-Feasibility Study |
December 19, 2025 | |
|
|
| Position |
Total Persons | |
| Trainer |
2 | |
| Supervisor |
2 | |
| Technicians |
4 | |
| Engineer |
2 | |
| Site Support |
4 | |
| Cleaners |
4 | |
| Human Resources Generalist |
2 | |
| Total |
51 |
| 21.3.5.3 | G&A Vehicles |
Vehicle costs are based on a scheduled number of light vehicles and mobile equipment (including fuel, maintenance, spares, times, and annual registration, and insurance fees). Mobile equipment required includes light vehicles, and a fire trailer. The total estimated mobile equipment cost is $0.188 million/a.
| 21.4 | Comments on Capital and Operating Costs |
Costs associated with Indigenous agreements have not been negotiated as of yet and are not included in the current cost evaluations. These will be assessed and incorporated into future technical reports as appropriate.
| Fenn-Gib Project |
Page 272 | |
| NI 43-101 Technical Report and Pre-Feasibility Study |
December 19, 2025 | |
|
|
| 22 | ECONOMIC ANALYSIS |
| 22.1 | Forward-Looking Information |
The results of the economic analyses discussed in this chapter represent forward-looking information as defined under Canadian securities law. The results depend on inputs that are subject to known and unknown risks, uncertainties, and other factors that may cause actual results to differ materially from those presented here. Information that is forward-looking includes the following:
| | Mineral Resource Estimates |
| | assumed commodity prices and exchange rates |
| | proposed mine production plan |
| | projected mining and process recovery rates |
| | assumptions regarding mining dilution and estimated future production |
| | sustaining costs and proposed operating costs |
| | assumptions regarding closure costs and closure requirements |
| | assumptions regarding environmental, permitting, and social risks. Additional risks to the forward-looking information include the following: |
| | changes to costs of production from what is assumed |
| | unrecognized environmental risks |
| | unanticipated reclamation expenses |
| | unexpected variations in quantity of mineralized material, grade, or recovery rates |
| | accidents, labour disputes, and other risks of the mining industry |
| | geotechnical or hydrogeological considerations during mining being different from what was assumed |
| | failure of mining methods to operate as anticipated |
| | failure of plant, equipment, or processes to operate as anticipated |
| | changes to assumptions as to the availability of electrical power, and the power rates used in the operating cost estimates and financial analysis |
| Fenn-Gib Gold Project |
Page 273 | |
| NI 43-101 Technical Report and Pre-Feasibility Study |
December 19, 2025 | |
|
|
| 22 | ECONOMIC ANALYSIS |
| 22.1 | Forward-Looking Information |
The results of the economic analyses discussed in this chapter represent forward-looking information as defined under Canadian securities law. The results depend on inputs that are subject to known and unknown risks, uncertainties, and other factors that may cause actual results to differ materially from those presented here. Information that is forward-looking includes the following:
| | Mineral Resource Estimates |
| | assumed commodity prices and exchange rates |
| | proposed mine production plan |
| | projected mining and process recovery rates |
| | assumptions regarding mining dilution and estimated future production |
| | sustaining costs and proposed operating costs |
| | assumptions regarding closure costs and closure requirements |
| | assumptions regarding environmental, permitting, and social risks. |
Additional risks to the forward-looking information include the following:
| | changes to costs of production from what is assumed |
| | unrecognized environmental risks |
| | unanticipated reclamation expenses |
| | unexpected variations in quantity of mineralized material, grade, or recovery rates |
| | accidents, labour disputes, and other risks of the mining industry |
| | geotechnical or hydrogeological considerations during mining being different from what was assumed |
| | failure of mining methods to operate as anticipated |
| | failure of plant, equipment, or processes to operate as anticipated |
| | changes to assumptions as to the availability of electrical power, and the power rates used in the operating cost estimates and financial analysis |
| Fenn-Gib Project |
Page 274 | |
| NI 43-101 Technical Report and Pre-Feasibility Study |
December 19, 2025 | |
|
|
| | changes to site access, use of water for mining purposes, and to time to obtain environment and other regulatory permits |
| | ability to maintain the social licence to operate |
| | changes to interest rates |
| | changes to tax rates. |
| 22.2 | Methodologies Used |
The project was evaluated using a discounted cash flow analysis based on a 5% discount rate. The elements of the economic model principally consist of gold production and revenues, royalty agreements, operating costs, capital costs, sustaining capital, closure and reclamation costs, taxation and net Project cash flow.
The economic analysis is carried out in real terms (i.e., without inflation factors) in Q3 2025 Canadian dollars without any project financing but inclusive of equipment financing, and costs for closure bonding. The economic results are calculated as of the beginning of Year -3, which corresponds to the start of the pre-production CAPEX period (over 12 quarters), including engineering and procurement, with all prior costs treated as sunk costs but considered for the purposes of taxation calculations. The economic results such as the NPV and IRR are calculated on an annual basis.
| 22.3 | Financial Model Parameters |
The economic analysis assumes a gold price of US$3,100/oz, which was based on long-term consensus analyst estimates. The forecasts are meant to reflect the average metals price expectation over the life of the project. No price inflation or escalation factors were considered. Commodity prices can be volatile, and there is the potential for deviation from the forecast. The economic analysis also used the following assumptions:
| | A pre-production period of 36 months including an initial 12-month detailed engineering period followed by 24-month construction and commissioning period |
| | mine life of 14.3 years |
| | 100% ownership |
| | exchange rate of 1.35 C$/US$ based on a review of current long-term consensus |
| | capital cost funded with 100% equity (no financing cost assumed other than for mining equipment leases) |
| | cash flows that are discounted to the start of construction using an end-period discounting convention |
| | metal products are sold in the same year they are produced |
| | project revenues are derived from the sale of gold doré |
| | no contractual arrangements for refining exist |
| | costs associated with Indigenous IBAs have not yet been negotiated and, therefore, are not included in the financial model. |
| Fenn-Gib Project |
Page 275 | |
| NI 43-101 Technical Report and Pre-Feasibility Study |
December 19, 2025 | |
|
|
| 22.3.1 | Taxes |
The project has been evaluated on an after-tax basis to provide an approximate value of the potential economics. The after-tax results assume of a taxable Canadian entity with tax calculated based on the tax rules in Ontario and Canada. The calculations reflect the estimated benefit of any historical tax positions held by Mayfair Gold as of December 31, 2024 and the projected tax basis distribution at construction start for depreciation calculations. The Ontario mining tax, federal income tax and provincial income tax during the LOM is estimated at $575 million.
| 22.3.2 | Working Capital |
A high-level estimate of working capital has been incorporated in the cash flow, based on accounts receivable (30 days), inventory (30 days), and accounts payable (30 days).
| 22.3.3 | Closure Costs |
Closure costs are estimated at $49 million for site closure and rehabilitation. Additionally, carrying costs for the bonds related to closure are estimated at $12 million over the LOM.
| 22.3.4 | Royalties |
Based on the royalties described in Section 4.8, total undiscounted royalty payments over the LOM are approximately $64 million.
| 22.4 | Economic Analysis |
The economic analysis was performed at a 5% discount rate with no inflation (constant dollar basis). On a pretax basis, the NPV discounted at 5% is $981 million; the internal rate of return (IRR) is 28.8%, and payback period is 2.6 years. On a post-tax basis, the NPV discounted at 5% is $652 million; the IRR is 24.1%, and the payback period is 2.7 years.
A summary of project economics is shown in Table 22-1 and illustrated in Figure 22-1. The analysis was done on an annual cashflow basis; the cashflow output is presented in Table 22-2.
Table 22-1: Economic Analysis Summary Table
| Description |
Unit | PFS Base Case Life-of-Mine Total/Average |
||||||
| General Assumptions |
||||||||
| Discount Rate |
% | 5 | ||||||
| Gold Price |
US$/oz | 3,100 | ||||||
| Exchange Rate |
C$/US$ | 1.35 | ||||||
| Fenn-Gib Project |
Page 276 | |
| NI 43-101 Technical Report and Pre-Feasibility Study |
December 19, 2025 | |
|
|
| Description |
Unit | PFS Base Case Life-of-Mine Total/Average |
||||||
| Production |
||||||||
| Mine Life |
years | 14.3 | ||||||
| Total Waste Tonnes Mined1 |
kt | 151,866 | ||||||
| Total Mill Feed Tonnes |
kt | 25,130 | ||||||
| Mill Head Grade (Au) |
g/t | 1.29 | ||||||
| Mill Gold Recovery Rate |
% | 88.3 | ||||||
| Total Mill Ounces Recovered |
koz | 920 | ||||||
| Total Average Annual Production |
koz | 64 | ||||||
| Transport, Refining, Royalties |
||||||||
| Gold Payable |
% | 99.95 | ||||||
| Refining & Transport Cost |
US$/oz Au | 5.00 | ||||||
| NSR Royalty |
% | Varies | (LOM Avg. 1.7%) | |||||
| Operating Costs |
||||||||
| Mining Cost |
$/t mined | 4.53 | ||||||
| Mining Cost |
$/t processed | 30.66 | ||||||
| Processing Cost |
$/t processed | 19.22 | ||||||
| G&A Cost |
$/t processed | 6.82 | ||||||
| Refining and Royalties |
$/t processed | 2.73 | ||||||
| Total Operating Cost |
$/t processed | 59.43 | ||||||
| Cash Costs1 |
US$/oz Au | 1,203 | ||||||
| All-In Sustaining Cost (AISC) |
US$/oz Au | 1,292 | ||||||
| Capital Expenditures |
||||||||
| Initial Capital Cost |
$M | 450.0 | ||||||
| Sustaining Capital Cost |
$M | 60.9 | ||||||
| Closure Capital Cost |
$M | 49.4 | ||||||
| Economics |
||||||||
| Pre-Tax NPV @ 5% |
$M | 980.5 | ||||||
| Pre-Tax IRR |
% | 28.8 | % | |||||
| Pre-Tax Payback |
years | 2.6 | ||||||
| Post-Tax NPV @ 5% |
$M | 651.7 | ||||||
| Post-Tax IRR |
% | 24.1 | % | |||||
| Post-Tax Payback |
years | 2.7 | ||||||
Notes:
| 1. | Total waste includes overburden, mineralized waste and waste material |
| Fenn-Gib Project |
Page 277 | |
| NI 43-101 Technical Report and Pre-Feasibility Study |
December 19, 2025 | |
|
|
Figure 22-1: After-Tax Cash Flow
Source: Ausenco, 2025
| Fenn-Gib Project |
Page 278 | |
| NI 43-101 Technical Report and Pre-Feasibility Study |
December 19, 2025 | |
|
|
Table 22-2: Cashflow Statement on an Annualized Basis
| Production |
Unit | Total1 | Y-3 | Y-2 | Y-1 | Y1 | Y2 | Y3 | Y4 | Y5 | Y6 | Y7 | Y8 | Y9 | Y10 | Y11 | Y12 | Y13 | Y14 | Y15 | Y16 | |||||||||||||||||||||||||||||||||||||||||||||||||||||||||||||||
| Ore Tonnes Mined |
kt | 25,130 | 0 | 0 | 773 | 674 | 1,752 | 1,752 | 1,752 | 1,752 | 1,752 | 1,752 | 1,752 | 1,752 | 1,752 | 1,752 | 1,752 | 1,752 | 1,752 | 906 | 0 | |||||||||||||||||||||||||||||||||||||||||||||||||||||||||||||||
| Overburden Mined |
kt | 16,319 | 0 | 2,500 | 883 | 5,776 | 1,756 | 1,976 | 174 | 2,959 | 295 | 0 | 0 | 0 | 0 | 0 | 0 | 0 | 0 | 0 | 0 | |||||||||||||||||||||||||||||||||||||||||||||||||||||||||||||||
| Mineralized Waste Mined2 |
kt | 27,367 | 0 | 0 | 560 | 680 | 2,194 | 2,004 | 3,484 | 1,927 | 1,632 | 1,420 | 1,585 | 1,059 | 1,691 | 3,033 | 2,599 | 2,106 | 1,323 | 69 | 0 | |||||||||||||||||||||||||||||||||||||||||||||||||||||||||||||||
| Waste Tonnes Mined |
kt | 108,180 | 0 | 0 | 2,270 | 2,096 | 8,298 | 8,268 | 8,591 | 8,362 | 12,320 | 12,828 | 12,663 | 13,189 | 8,337 | 5,779 | 2,520 | 1,285 | 1,118 | 256 | 0 | |||||||||||||||||||||||||||||||||||||||||||||||||||||||||||||||
| Total Waste Mined |
kt | 151,866 | 0 | 2,500 | 3,713 | 8,553 | 12,248 | 12,248 | 12,248 | 13,248 | 14,248 | 14,248 | 14,248 | 14,248 | 10,027 | 8,813 | 5,119 | 3,391 | 2,441 | 325 | 0 | |||||||||||||||||||||||||||||||||||||||||||||||||||||||||||||||
| Total Tonnes Mined |
kt | 176,995 | 0 | 0 | 6,986 | 9,227 | 14,000 | 14,000 | 14,000 | 15,000 | 16,000 | 16,000 | 16,000 | 16,000 | 11,779 | 10,565 | 6,871 | 5,143 | 4,193 | 1,231 | 0 | |||||||||||||||||||||||||||||||||||||||||||||||||||||||||||||||
| Strip Ratio |
w:o | 6.0 | 4.80 | 12.69 | 6.99 | 6.99 | 6.99 | 7.56 | 8.13 | 8.13 | 8.13 | 8.13 | 5.72 | 5.03 | 2.92 | 1.94 | 1.39 | 0.36 | ||||||||||||||||||||||||||||||||||||||||||||||||||||||||||||||||||
| Tonnes Processed |
kt | 25,130 | 0 | 0 | 0 | 1,447 | 1,752 | 1,752 | 1,752 | 1,752 | 1,752 | 1,752 | 1,752 | 1,752 | 1,752 | 1,752 | 1,752 | 1,752 | 1,752 | 906 | 0 | |||||||||||||||||||||||||||||||||||||||||||||||||||||||||||||||
| Gold Head Grade |
g/t | 1.29 | 0.00 | 0.00 | 0.00 | 1.44 | 1.65 | 1.40 | 1.39 | 1.46 | 1.49 | 1.18 | 1.10 | 1.07 | 1.24 | 1.36 | 1.26 | 1.23 | 1.09 | 0.76 | 0.00 | |||||||||||||||||||||||||||||||||||||||||||||||||||||||||||||||
| Recovery |
% | 88.3 | 0.0 | 0.0 | 0.0 | 85.8 | 88.4 | 89.2 | 89.2 | 89.5 | 89.6 | 88.0 | 87.5 | 87.3 | 88.4 | 89.0 | 88.5 | 88.4 | 87.4 | 84.3 | 0.0 | |||||||||||||||||||||||||||||||||||||||||||||||||||||||||||||||
| Recovered Gold |
k oz | 920 | 0.0 | 0.0 | 0.0 | 57.3 | 82.1 | 70.4 | 69.8 | 73.3 | 75.1 | 58.2 | 54.2 | 52.7 | 61.5 | 68.4 | 63.0 | 61.4 | 53.7 | 18.7 | 0.0 | |||||||||||||||||||||||||||||||||||||||||||||||||||||||||||||||
| Cash Flow Summary |
| |||||||||||||||||||||||||||||||||||||||||||||||||||||||||||||||||||||||||||||||||||
| Gross Revenue |
$M | 3,848 | 0.0 | 0.0 | 0.0 | 239.7 | 343.3 | 294.5 | 292.0 | 306.7 | 314.1 | 243.6 | 226.8 | 220.3 | 257.3 | 286.1 | 263.4 | 256.9 | 224.6 | 78.0 | 0.0 | |||||||||||||||||||||||||||||||||||||||||||||||||||||||||||||||
| Mining Cost |
$M | (771 | ) | 0.0 | 0.0 | 0.0 | (47.3 | ) | (56.4 | ) | (54.3 | ) | (57.8 | ) | (55.3 | ) | (61.2 | ) | (62.9 | ) | (64.7 | ) | (70.9 | ) | (58.8 | ) | (57.7 | ) | (44.5 | ) | (37.5 | ) | (29.9 | ) | (11.3 | ) | 0.0 | |||||||||||||||||||||||||||||||||||||||||||||||
| Processing Cost |
$M | (483 | ) | 0.0 | 0.0 | 0.0 | (28.9 | ) | (33.3 | ) | (33.3 | ) | (33.3 | ) | (33.3 | ) | (33.3 | ) | (33.3 | ) | (33.3 | ) | (33.3 | ) | (33.3 | ) | (33.3 | ) | (33.3 | ) | (33.3 | ) | (33.3 | ) | (20.9 | ) | 0.0 | |||||||||||||||||||||||||||||||||||||||||||||||
| G&A Costs |
$M | (171 | ) | 0.0 | 0.0 | 0.0 | (10.8 | ) | (11.9 | ) | (11.9 | ) | (11.9 | ) | (11.9 | ) | (11.9 | ) | (11.9 | ) | (11.9 | ) | (11.9 | ) | (11.9 | ) | (11.9 | ) | (11.9 | ) | (11.9 | ) | (11.9 | ) | (6.2 | ) | 0.0 | |||||||||||||||||||||||||||||||||||||||||||||||
| Royalties & Refining Costs |
$M | (69 | ) | 0.0 | 0.0 | 0.0 | (4.4 | ) | (6.1 | ) | (5.1 | ) | (5.0 | ) | (5.5 | ) | (5.6 | ) | (4.3 | ) | (3.9 | ) | (3.7 | ) | (5.1 | ) | (5.5 | ) | (4.9 | ) | (4.5 | ) | (3.8 | ) | (1.3 | ) | 0.0 | |||||||||||||||||||||||||||||||||||||||||||||||
| Total Operating Costs |
$M | (1,493 | ) | 0.0 | 0.0 | 0.0 | (91.4 | ) | (107.6 | ) | (104.6 | ) | (108.0 | ) | (106.0 | ) | (112.0 | ) | (112.4 | ) | (113.8 | ) | (119.8 | ) | (109.2 | ) | (108.3 | ) | (94.6 | ) | (87.2 | ) | (78.9 | ) | (39.7 | ) | 0.0 | |||||||||||||||||||||||||||||||||||||||||||||||
| EBITDA |
$M | 2,354 | 0.0 | 0.0 | 0.0 | 148.3 | 235.7 | 189.9 | 184.0 | 200.7 | 202.2 | 131.2 | 113.0 | 100.6 | 148.2 | 177.8 | 168.8 | 169.7 | 145.7 | 38.3 | 0.0 | |||||||||||||||||||||||||||||||||||||||||||||||||||||||||||||||
| Initial Capital |
$M | (450 | ) | (93.1 | ) | (188.3 | ) | (168.6 | ) | 0.0 | 0.0 | 0.0 | 0.0 | 0.0 | 0.0 | 0.0 | 0.0 | 0.0 | 0.0 | 0.0 | 0.0 | 0.0 | 0.0 | 0.0 | 0.0 | |||||||||||||||||||||||||||||||||||||||||||||||||||||||||||
| Sustaining Capital |
$M | (68 | ) | 0.0 | 0.0 | 0.0 | (12.7 | ) | (6.1 | ) | (6.1 | ) | (7.2 | ) | (8.0 | ) | (6.8 | ) | (4.5 | ) | (4.7 | ) | (2.8 | ) | (1.4 | ) | (2.2 | ) | (3.2 | ) | (0.9 | ) | (0.9 | ) | (0.7 | ) | 0.0 | |||||||||||||||||||||||||||||||||||||||||||||||
| Change in Working Capital |
$M | 0 | 0.0 | 0.0 | 0.0 | (12.2 | ) | (7.2 | ) | 3.8 | 0.5 | (1.4 | ) | (0.1 | ) | 5.8 | 1.5 | 1.0 | (3.9 | ) | (2.4 | ) | 0.7 | (0.1 | ) | 2.0 | 8.8 | 3.1 | ||||||||||||||||||||||||||||||||||||||||||||||||||||||||
| Closure Costs |
$M | (49 | ) | 0.0 | 0.0 | 0.0 | 0.0 | 0.0 | 0.0 | 0.0 | 0.0 | 0.0 | 0.0 | 0.0 | 0.0 | 0.0 | 0.0 | 0.0 | 0.0 | 0.0 | 0.0 | (49.4 | ) | |||||||||||||||||||||||||||||||||||||||||||||||||||||||||||||
| Pre-Tax Cash Flow |
$M | 1,786 | (93.1 | ) | (188.3 | ) | (168.6 | ) | 123.5 | 222.4 | 187.5 | 177.2 | 191.3 | 195.2 | 132.6 | 109.8 | 98.8 | 142.9 | 173.2 | 166.3 | 168.7 | 146.8 | 46.4 | (46.2 | ) | |||||||||||||||||||||||||||||||||||||||||||||||||||||||||||
| Taxes (Mining, Provincial, Federal) |
$M | (576 | ) | 0.0 | 0.0 | 0.0 | 0.0 | (14.0 | ) | (13.5 | ) | (53.9 | ) | (59.4 | ) | (60.0 | ) | (38.2 | ) | (34.6 | ) | (30.8 | ) | (46.9 | ) | (57.0 | ) | (54.1 | ) | (54.5 | ) | (47.0 | ) | (11.9 | ) | 0.3 | ||||||||||||||||||||||||||||||||||||||||||||||||
| After-Tax Cash Flow |
$M | 1,211 | (93.1 | ) | (188.3 | ) | (168.6 | ) | 123.5 | 208.4 | 174.1 | 123.4 | 131.9 | 135.3 | 94.4 | 75.2 | 68.0 | 95.9 | 116.1 | 112.2 | 114.2 | 99.8 | 34.5 | (45.9 | ) | |||||||||||||||||||||||||||||||||||||||||||||||||||||||||||
Note:
| 1 | Totals may not sum due to rounding |
| 2 | Mineralized waste is not processed in the PFS mine plan. This material falls below the elevated cut-off grade used for plant feed but remains above the economic cut-off grade. The material stockpiled in a designated area within the MRSA and has an average grade of 0.51 g/t |
| Fenn-Gib Project |
Page 279 | |
| NI 43-101 Technical Report and Pre-Feasibility Study |
December 19, 2025 | |
|
|
| 22.5 | Sensitivity Analysis |
A sensitivity analysis was conducted on the base case post-tax payback, NPV and IRR of the project using the following variables: gold price, exchange rate, initial capital costs and operating costs. After-tax sensitivity results are shown in Table 22-3.
Table 22-3: After-Tax Sensitivity Analysis
| OPEX Sensitivity | ||||||||||||||||||||||||||||
| After-Tax Results |
-30% | -15% | 0% | 15% | 30% | |||||||||||||||||||||||
| NPV 5% (M C$) |
826 | 739 | 652 | 564 | 476 | |||||||||||||||||||||||
| IRR (%) |
27.7 | % | 25.9 | % | 24.1 | % | 22.1 | % | 20.0 | % | ||||||||||||||||||
| Payback (yrs) |
2.4 | 2.5 | 2.7 | 2.9 | 3.2 | |||||||||||||||||||||||
| CAPEX Sensitivity | ||||||||||||||||||||||||||||
| After-Tax Results |
-30% | -15% | 0% | 15% | 30% | |||||||||||||||||||||||
| NPV 5% (M C$) |
773 | 713 | 652 | 591 | 530 | |||||||||||||||||||||||
| IRR (%) |
34.2 | % | 28.4 | % | 24.1 | % | 20.7 | % | 17.8 | % | ||||||||||||||||||
| Payback (yrs) |
1.9 | 2.3 | 2.7 | 3.1 | 3.6 | |||||||||||||||||||||||
| FX Sensitivity | ||||||||||||||||||||||||||||
| After-Tax Results |
1.25 | 1.30 | 1.35 | 1.40 | 1.45 | |||||||||||||||||||||||
| NPV 5% (M C$) |
536 | 594 | 652 | 710 | 767 | |||||||||||||||||||||||
| IRR (%) |
21.4 | % | 22.7 | % | 24.1 | % | 25.4 | % | 26.6 | % | ||||||||||||||||||
| Payback (yrs) |
3.0 | 2.8 | 2.7 | 2.6 | 2.5 | |||||||||||||||||||||||
| Gold Price Sensitivity (USD/oz) | ||||||||||||||||||||||||||||
| After-Tax Results |
1,600 | 2,100 | 2,600 | 3,100 | 3,600 | 4,100 | 4,600 | |||||||||||||||||||||
| NPV 5% (M C$) |
-141 | 144 | 399 | 652 | 903 | 1,155 | 1,405 | |||||||||||||||||||||
| IRR (%) |
0.0 | % | 10.3 | % | 17.9 | % | 24.1 | % | 29.4 | % | 34.3 | % | 38.6 | % | ||||||||||||||
| Payback (yrs) |
14.5 | 5.2 | 3.5 | 2.7 | 2.2 | 1.9 | 1.7 | |||||||||||||||||||||
| Fenn-Gib Project |
Page 280 | |
| NI 43-101 Technical Report and Pre-Feasibility Study |
December 19, 2025 | |
|
|
| 23 | ADJACENT PROPERTIES |
The Fenn–Gib property is surrounded by claims or leases held by other exploration companies. The most active of the neighbouring adjacent companies are STLLR Gold Inc. (formerly Moneta Gold Inc.) to the east and Onyx Gold to the north.
STLLR Gold’s combined Golden Highway and Garrison areas are collectively called the Tower Gold Project, which currently hosts a MRE primarily within sedimentary host rocks along the Destor–Porcupine fault corridor (Raponi et al., 2022). The MRE combines nine deposits, which have been classified as structurally controlled orogenic gold deposits in an Archean greenstone belt setting.
InnovExplo, a member of Norda Stelo, updated the Tower Gold Project mineral resources with an effective date of May 2, 2025 (STLLR, 2025). The combined MRE for all nine deposits includes:
| | a total of 3,656,400 oz of gold in open pit indicated mineral resources contained within 135,230 Kt at 0.84 g/t Au, and 4,133,600 oz of open pit inferred mineral resources contained within 157,837 Kt at 0.81 g/t Au, at a cut-off grade of 0.30 g/t Au. |
| | a total of 345,800 oz of underground indicated mineral resources contained within 5,194 Kt at 2.07 g/t Au, and 2,827,100 oz of underground inferred mineral resources within 42,456 Kt at 2.07 g/t Au, using variable cut-off grades based on mining method, ranging from 1.3 to 2.09 g/t Au. |
The QP did not independently verify the information STLLR Gold (2025) provided. The mineralization for the Tower Gold Project is not necessarily indicative of the mineralization present at the Fenn–Gib property.
Onyx Gold is an exploration-stage company that is exploring the Munro-Croesus Gold Project is located approximately 75 km east of Timmins, Ontario along Highway 101. Their land package includes the past-producing Croesus Mine. The geology is proximal to the Porcupine-Destor Deformation Fault Zone and Pipestone Fault and located approximately 3 km northwest and along trend of the Fenn-Gib gold deposit. The QP has not verified this information and the information provided on the mineralization for the Munro-Croesus Gold Project is not necessarily indicative of the mineralization present at the Fenn–Gib property.
| Fenn-Gib Project |
Page 281 | |
| NI 43-101 Technical Report and Pre-Feasibility Study |
December 19, 2025 | |
|
|
| 24 | OTHER RELEVANT DATA AND INFORMATION |
| 24.1 | Overview |
This section summarizes additional information considered relevant to the Technical Report but not captured in preceding sections. It also outlines conceptual opportunities that, while not currently incorporated into the mine plan or economic analysis, may represent potential upside under future conditions.
| 24.2 | Project Execution Plan (PEP) |
The project will be executed under an EPCM framework, providing flexibility in contractor selection, integration of owner oversight, and phased mobilization of critical resources. This structure ensures that engineering and procurement activities are closely aligned with construction sequencing, while maintaining transparency and accountability across all phases.
Early contractor engagement will be key of the execution strategy. Strategic contractors will be brought into the project during the early engineering and planning stages to contribute practical input on constructability, scheduling, and resource deployment. This proactive involvement is expected to reduce execution risks, improve cost certainty, and enhance alignment between design intent and field implementation. By engaging contractors early, the project will benefit from optimized methodologies and improved readiness for mobilization.
The early works program will be initiated as soon as site approvals are available to ensure timely readiness for full construction mobilization. Sequencing will begin with site preparation, including clearing, grading, and establishment of access roads, followed by overburden removal to expose competent and non-PAG waste material for foundations and to generate waste rock for construction activities. Concurrently, construction water management systems will be developed to provide reliable control of runoff and dewatering during earthworks.
The primary crusher will be commissioned early in the construction phase, enabling waste rock generated from site preparation and overburden removal to be processed and utilized directly for infrastructure requirements, including road building and the critical development of the TSF. Advancing these early works in a structured sequence reduces schedule risk, supports efficient resource deployment, and establishes the foundation for construction program.
A critical element of the plan is the early mobilization of the mining fleet, subject to ground conditions and the use of the smaller contractor fleet for initial site development. Advancing fleet deployment will accelerate pre stripping and early access to waste and ore. This strategy intends to expose and deliver the waste rock required for key construction activities, particularly the critical development of the TSF. The owner’s mining team will be embedded within the construction management team to provide operational expertise, continuity, and direct oversight of mining activities, ensuring seamless integration between engineering, construction, and operations.
Given the relative size of the plant and equipment, the execution plan also contemplates modularization of certain plant components. Modular construction offers the potential to reduce onsite labour requirements, shorten the
| Fenn-Gib Project |
Page 282 | |
| NI 43-101 Technical Report and Pre-Feasibility Study |
December 19, 2025 | |
|
|
construction schedule, and lower overall project costs by shifting portions of fabrication and assembly to controlled off site environments. This approach is expected to improve quality assurance, reduce weather related risks, and enhance efficiency during site installation.
To support the EPCM framework, a dedicated project management office (PMO) will be established off site. The PMO will provide centralized support services, including project controls, scheduling, cost management, procurement oversight, and stakeholder reporting. This structure will allow the site team to focus on execution while ensuring governance, compliance, and performance monitoring are maintained at a high standard with limiting the site labour loading.
Engineering and PEP will advance in parallel with the environmental approvals process and ongoing AAN engagement to ensure alignment across regulatory and stakeholder requirements. By the time approvals are secured, the engineering design for the process plant is expected to be 75–95% complete, providing a robust basis for procurement and construction readiness. In tandem, the TSF design drawings will be issued “Issued for Construction” (IFC), enabling earthworks to be advanced sufficiently to support full execution of the works. This integrated approach ensures that technical progress, permitting milestones, and stakeholder engagement remain synchronized, minimizing schedule risk and supporting a seamless transition into construction.
The complete PEP for the Fenn Gib project will be developed in the next phases of the work. This document serves as the central roadmap for delivering the Project’s development in a structured, compliant, and stakeholder aligned manner. It defines the project’s objectives, scope, and deliverables while establishing governance, team responsibilities, and decision making frameworks suited to the Ontario mining context.
The execution strategy emphasizes advancing engineering and design in parallel with environmental approvals and AAN engagement, ensuring regulatory compliance and stakeholder trust are embedded throughout. The PEP integrates procurement and contracting strategies for this region and will consider contractors based locally, regionally and nationally for the construction, modular construction opportunities, and operational readiness planning, all supported by a milestone driven schedule that highlights critical path activities such as permitting, civil works, plant installation, and commissioning. Risk management, quality, safety, and sustainability commitments are integral into the plan, alongside financial controls and reporting protocols to ensure accountability.
| 24.3 | Project Schedule Overview |
The project execution schedule is structured to advance through a series of defined phases, beginning with a six month front-end engineering design (“FEED”) program. This will be followed by approximately 12 months of detailed engineering, during which procurement activities will be initiated under a two-phase purchase order (PO) strategy. Early POs will be issued for long lead and critical equipment items to ensure timely delivery and to mitigate schedule risks.
Construction is planned over an 18 to 24 month period, with commissioning activities commencing during the latter stages of construction and extending for approximately four to six months. Importantly, the primary crusher will be commissioned early in the construction phase, enabling efficient utilization of equipment to support site development and construction activities.
| Fenn-Gib Project |
Page 283 | |
| NI 43-101 Technical Report and Pre-Feasibility Study |
December 19, 2025 | |
|
|
Following commissioning, the project will advance through a structured production ramp up period of approximately six months, culminating in the achievement of commercial production. This phased approach is designed to balance engineering, procurement, and construction execution while maintaining flexibility to adapt to ground conditions, contractor availability, and equipment delivery schedules.
| 24.3.1 | Integrated Project Schedule |
| | Front-End Engineering Design (FEED) |
| | Duration: six to nine months |
| | Develop process plant and TSF design basis |
| | Advance engineering to approximately 30–40% completion |
| | Issue design packages for vendor input |
| | Early engagement with regulators and AAN |
| | Detailed Engineering (DE) |
| | Duration: 9–12 months (following FEED) |
| | Progress plant engineering to 75–95% completion |
| | Issue IFC drawings for TSF and major civil works |
| | Finalize equipment specifications and layouts |
| | Procurement Strategy – 2-Phase Purchase Orders (POs) |
| | Phase 1 POs (timing: TBD, potentially during FEED or early DE): |
| | Secure vendor drawings for integration into DE |
| | Place orders for long-lead items (mills, crushers, electrical gear) |
| | Mining fleet selection and early deposits (construction fleet) |
| | Note: Timing of long-lead item procurement will be aligned with delivery timing and construction scheduling |
| | Phase 2 POs (late DE): |
| | Critical equipment procurement and setting production-slot timing (pumps, flotation cells, instrumentation) |
| Fenn-Gib Project |
Page 284 | |
| NI 43-101 Technical Report and Pre-Feasibility Study |
December 19, 2025 | |
|
|
| | Confirm delivery schedules aligned with construction |
| | Mining fleet procurement. |
| | Early Works |
| | Duration: six to nine months (timing pending on permitting) |
| | Site clearing, grading, access roads and construction laydown areas |
| | Early mining of overburden |
| | Transmission line and power infrastructure |
| | Temporary facilities and off-site camp setup |
| | TSF and site earthworks initiated with IFC drawings |
| | Establishing construction power. |
| | Major Construction |
| | Duration: 18 to 24 months |
| | Mining to support waste rock for construction and ore exposure and stockpiling for operation |
| | Civil works: foundations, structural concrete, TSF starter embankments |
| | Early Installation of Primary Crusher to be used throughout the construction project |
| | Civil, Structural and Architectural: including building construction and key building closure to allow for efficient winter construction |
| | Mechanical installation: mills, crushers, flotation circuits |
| | Electrical installation: substations, distribution, controls |
| | Modular construction opportunities integrated to compress schedule |
| | Note: the relocation of Highway 101 is currently planned to be after the initial Construction phase; this will be reconsidered pending timing of the approvals for this portion of the work. |
| | Commissioning |
| | Duration: four to six months (overlapping link to end- Major Construction) |
| | Systems integration and testing |
| | Initial ore feed and process optimization |
| | Workforce onboarding, training and operational readiness. |
| | Ramp-Up to Commercial Production |
| Fenn-Gib Project |
Page 285 | |
| NI 43-101 Technical Report and Pre-Feasibility Study |
December 19, 2025 | |
|
|
| | Duration: approximately six months |
| | Progressive increase in plant throughput |
| | Optimization of recovery and plant performance |
| | Transition to steady-state operations and full departure of construction and commissioning personnel. |
| | Critical Path Highlights |
| | FEED ® DE ® Phase 1 POs (vendor drawings, long-leads) ® Early Works ® Civil Works ® Mechanical/Electrical Installation ® Commissioning ® Ramp-Up. |
| | Long-lead equipment procurement and TSF earthworks are the most schedule-sensitive elements. |
| | This schedule assumes a 24-month period for the Ontario permitting approvals process |
| | The high-level schedule identifies permitting and approvals as the critical path to a construction decision. Activities in the linked schedule prior to major construction will be adjusted as necessary to align with permitting and approval timelines |
Figure 24-1: High-Level Schedule from FEED through to Commercial Production
Source: Mayfair, 2025
| Fenn-Gib Project |
Page 286 | |
| NI 43-101 Technical Report and Pre-Feasibility Study |
December 19, 2025 | |
|
|
| 24.4 | Operational Readiness Planning |
Operational readiness planning (ORP) will be advanced in parallel with the construction project to ensure a seamless transition from project delivery into steady state operations. This process will encompass the early development of operating procedures, training programs, maintenance strategies, and supply chain logistics, all aligned with the evolving construction schedule. By initiating readiness activities during construction, the project team can identify and address potential gaps in workforce capability, equipment reliability, and material availability before commissioning.
The integration of the ORP with construction execution will also facilitate early recruitment and onboarding of key operations personnel, enabling them to participate in commissioning and ramp up activities. This approach ensures that the operating team is fully familiar with the plant, equipment, and systems prior to handover, reducing start up risks and accelerating the achievement of nameplate capacity. Advancing readiness in parallel with construction provides a structured pathway to operational excellence, while reinforcing safety, compliance, and performance objectives from the outset.
| 24.5 | Potential Upside Opportunities Outside of the PFS |
These opportunities are contingent on factors such as metal price improvements, permitting pathways, technical validation, and strategic alignment. Each concept described below is preliminary in nature and does not imply a commitment to advance or develop. Rather, they are presented to highlight areas where future evaluation may yield additional value.
The following upside opportunities have been identified for potential consideration and are not currently considered within the scope of the current PFS:
| 24.5.1 | Processing Plant and Mine Plan Concepts |
| 24.5.1.1 | Incremental Increase in Plant Throughput to Feed Mineralized Waste Material |
An opportunity may exist to improve operational efficiency and accommodate incremental plant feed without increasing the mining rate. This concept would involve a modest reduction in the cut-off grade (COG), while maintaining the current mining plan. Implementation would require approval to exceed the existing operating throughput limits and some minor additional capital investment. At this stage, the potential remains subject to further validation and regulatory review, and permitting impacts are anticipated to be minimal if the overall scale of the operation remains unchanged. If future studies confirm feasibility, this initiative could result in modest throughput increases offering potential incremental upside to the current production profile.
| 24.5.1.2 | Processing of Mineralized Waste Material at the End of the Mine Life |
A further opportunity exists to process mineralized waste material at the end of the mine life, once primary ore reserves have been exhausted. This approach would involve lowering the cutoff grade to the economic threshold and rehandling stockpiled mineralized waste that had previously been excluded from the mine plan. As the mining fleet would be no longer used for primary operation, it would be simply rehandling mineralized waste for primary plant
| Fenn-Gib Project |
Page 287 | |
| NI 43-101 Technical Report and Pre-Feasibility Study |
December 19, 2025 | |
|
|
feed. This scenario would rely solely on existing plant infrastructure, with minimal additional capital requirements beyond sustaining expenditures. Permitting impacts are expected to be limited, as the overall footprint would remain unchanged, though additional tailings capacity would be required depending on volumes processed as defined by metal prices at that time. This strategy provides a potential means of extending the production profile, improving overall resource utilization, and maximizing value recovery from the deposit in the final years of operation.
| 24.5.1.3 | Staged Increase Plant Throughput to Feed Mineralized Waste Material |
A potential opportunity exists to enhance project economics by increasing plant throughput through targeted capital investment, while maintaining the current mining rate and mine plan. This would involve lowering the cut-off grade to the economic threshold and feeding the mineralized waste material, thereby allowing additional material to be processed without altering the mining sequence or pit design. Implementation would require capital upgrades to the processing plant to accommodate higher throughput volumes, subject to engineering validation and regulatory approval. As the mining footprint remains unchanged, permitting impacts are expected to be manageable. However, it would necessitate additional tailings storage capacity, which would need to be evaluated in future planning stages. If approved, and subject to the results of incremental economic analysis, this initiative has the potential to increase plant throughput by approximately 50% to 100% relative to current capacity. Such an expansion could translate into an incremental gold production increase over the existing production profile.
| 24.5.1.4 | Scaled Operations to Exploit a Greater Extend of the Mineral Resource |
A longer-term conceptual opportunity exists to develop a new-scale operation at Fenn-Gib designed to fully exploit the mineral resource beyond the scope of the current mine plan. This would involve a comprehensive redesign of the processing and infrastructure footprint, including construction of a new plant with significantly higher throughput capacity, tailored to the full resource potential. The mining rate would be scaled accordingly, with phased pit expansions and potential satellite development to support sustained feed. Lowering the cut-off grade to the economic threshold would enable broader resource utilization. This scenario would require substantial capital investment, a new permitting framework, and detailed engineering studies to validate feasibility. Additional tailings storage capacity, water management infrastructure, and power supply upgrades would be essential components of the plan. While preliminary in nature, this concept represents a transformative opportunity to unlock the full value of the Fenn-Gib deposit under favourable market and regulatory conditions.
| 24.5.2 | Potential Future Toll Milling Agreements at the Fenn-Gib Mill |
Once constructed, the Fenn-Gib mill will represent a regional processing facility with the capacity to support not only internal ore feed but also potential third-party arrangements. Given the concentration of advanced exploration and development projects in the Timmins–Kirkland Lake corridor, there is a clear opportunity to evaluate toll milling agreements with nearby operators who may not have immediate access to their own processing infrastructure.
The ability to accept toll milling feed would provide several strategic advantages. For Mayfair, it offers the potential to generate incremental revenue streams and improve mill utilization during periods when internal mine production is
| Fenn-Gib Project |
Page 288 | |
| NI 43-101 Technical Report and Pre-Feasibility Study |
December 19, 2025 | |
|
|
ramping up or undergoing sequencing adjustments. For counterparties, toll milling provides a cost-effective solution to monetize resources without the capital burden of constructing standalone processing facilities.
From a regional perspective, the establishment of a toll milling framework at Fenn Gib could strengthen collaborative relationships among operators, support local employment, and enhance overall resource extraction in the district. Such agreements would need to be carefully structured to ensure alignment with environmental permits, metallurgical compatibility, and commercial terms that protect the interests of the Company while maintaining operational efficiency.
As an example, the historical Croesus mine, located less than 5 km from the Fenn-Gib site and boasting some of the highest grades in the geological belt, exemplifies the type of small but rich resource that may not justify standalone plant development yet could offer rational synergies through toll milling arrangements.
While the primary focus remains on processing ore from the Fenn Gib deposit, the flexibility to accommodate toll milling agreements represents a potential upside that could materially enhance the economic profile of the mill and reinforce its role as a hub for regional development.
| 24.5.3 | South Block Exploration Potential |
The South Block represents a highly prospective area within the broader Fenn-Gib property, situated directly on the Porcupine–Destor Fault Zone (PDFZ), a major regional structural corridor that is host to numerous significant gold deposits. The geological setting and mineralization style observed here show strong similarities to other large, longlife gold systems along the PDFZ, including the Hollinger, Dome, and other Timmins-regional deposits, as well as the more recent STLLR discoveries, underscoring the potential for meaningful resource expansion.
Although the South Block is situated within a favourable geological setting, it has seen limited historical exploration. The absence of outcrop and the lack of surface exposure beneath overburden, combined with restricted road and trail access, have constrained both drilling programs and surface work in the area. Preliminary indications and broad geophysics signatures suggest good potential for gold bearing system into this block, but the area has yet to benefit from the level of modern exploration applied to the core deposit.
Future work programs will consider additional drilling, geophysical surveys, and targeted sampling to better define mineralization trends and grade distribution. If successful, the South Block could provide additional feed for the planned mill and materially enhance project economics by extending mine life and improving pit design flexibility. The combination of its strategic location on the PDFZ, geological similarity to both historical and emerging deposits, and underexplored status highlights the South Block as a significant upside opportunity for the project.
| 24.5.4 | Regional Growth Opportunities |
A strategic opportunity exists to position the Fenn Gib Project as a central processing hub capable of supporting additional satellite deposits within the surrounding district. It is unknown that this model would be considered valid with the current plant and infrastructure design, however; under this hub and spoke model, the planned Fenn Gib mill would serve as the core facility, with incremental feed (assumed to be at a higher-grade than the current Fenn-Gib
| Fenn-Gib Project |
Page 289 | |
| NI 43-101 Technical Report and Pre-Feasibility Study |
December 19, 2025 | |
|
|
reserves) sourced from nearby properties that could be acquired or joint ventured. This approach leverages the scale and infrastructure of the central operation while reducing the need for standalone processing facilities at satellite sites.
Implementation of a hub and spoke strategy would require evaluation of regional geology, logistics, and permitting considerations, as well as potential agreements with property owners. The concept offers the potential to enhance project economics by increasing mill feed grade and produced gold ounces, extending mine life, and consolidating regional resources under a single operating framework. While conceptual in nature, this opportunity highlights the potential for Fenn Gib to evolve into a district scale operation, subject to favorable Indigenous community support, exploration success, property acquisition, and regulatory approvals.
| Fenn-Gib Project |
Page 290 | |
| NI 43-101 Technical Report and Pre-Feasibility Study |
December 19, 2025 | |
|
|
| 25 | INTERPRETATION AND CONCLUSIONS |
| 25.1 | Introduction |
The QPs note the following interpretations and conclusions in their respective areas of expertise, based on the review of data available for this Report.
| 25.2 | Mineral Tenure, Surface Rights, Water Rights, Royalties and Agreements |
Mayfair Gold holds a 100% interest in the Project in northeast Ontario, comprising 21 patented properties, 145 unpatented mining claims, and 6 mining leases totaling 1,877.8 ha. The project was acquired from LSG under an asset purchase agreement dated June 8, 2020. A third-party review of land tenure completed in June 2024 using Ontario’s Mining Lands Administration System identified no known title disputes or litigation. The QPs relied on information provided by Mayfair Gold and did not independently verify land title or the legality of third-party agreements. Mayfair Gold has confirmed that there are no known legal disputes or litigation affecting the project. There are no property agreements or obligations beyond those required to maintain claims and leases in good standing.
Mayfair Gold owns both surface and mineral rights on all patented properties and holds sufficient surface rights on mining leases for mining and exploration activities. For unpatented claims, surface access is limited to that permitted under the Ontario Mining Act. The Company has adequate surface rights for current and anticipated exploration programs.
Water use in Ontario is regulated under the Ontario Water Resources Act. Current exploration activities do not require water-taking permits; however, appropriate permits will be obtained as development advances.
The project is subject to a 1% NSR royalty held by Metalla Royalty and Smelting Ltd., a Barrick Gold Corporation back-in right to acquire a 51% interest upon delineation of ≥5 Moz of gold (expiring August 18, 2032), and a 5% Net Profit Royalty on portions of the property, which does not apply to any current mineral resources or reserves.
| 25.3 | Geology and Mineralization |
The Project contains three mineralized zones (Main Zone, Deformation Zone, and Footwall Zone) with distinct geological controls and mineralization characteristics. The Main Zone represents broad disseminated mineralization within altered volcanics; the Deformation Zone represents higher-grade, structurally-controlled mineralization; and the Footwall Zone represents north-northeast-trending mineralized corridors within footwall mafic volcanics. The spatial association with the Contact Fault, interpreted as a splay of the Porcupine–Destor Fault Zone, combined with the presence of gold-bearing fluids channeled through this structure, supports interpretation of a structurally-controlled deposit model typical of major gold deposits in the southern Abitibi. The mineralization style, with quartz-carbonate veins and associated alteration, is characteristic of metamorphic fluid systems. The persistence of mineralization over 1.5+ km of strike and continuity at depth, combined with the discovery of multiple mineralized zones, indicates a substantial and productive mineralizing system. The zones remaining open at depth and along strike present significant expansion potential.
| Fenn-Gib Project |
Page 291 | |
| NI 43-101 Technical Report and Pre-Feasibility Study |
December 19, 2025 | |
|
|
| 25.4 | Exploration and Drilling |
Exploration and diamond drilling conducted by Mayfair Gold since 2021 has successfully advanced the Project from an advanced-stage exploration property to a project with a substantial delineated resource base suitable for PFS evaluation. The systematic drilling program, supported by geochemical and geophysical surveys, has defined three main mineralized zones (Main Zone, Deformation Zone, and Footwall Zone) and expanded the known mineralization beyond the boundaries of previous resource estimates. The mineralization remains open in multiple directions, indicating potential for resource growth through continued exploration drilling.
| 25.5 | Metallurgical Testwork |
The metallurgical definition and development test program concluded the most viable process to be crushing and grinding, followed by flotation, concentrate regrinding, and cyanidation of the rougher concentrate to produce doré bullion at site.
The target primary grind size was determined to be a P80 of 106 µm, with a 23 to 29% rougher flotation mass pull, yielding 97% Au recovery to a rougher concentrate. The concentrate regrind target P80 selected was 13 µm, achieving a maximum 96% Au extraction for an estimated 89.6 % Au recovery at 1.5 g/t Au.
Metallurgical testing was conducted on composite samples over a range in head grade from 0.2 to 19.1 g/t Au and 0.3 to 8.1% S2-. Composite sample selection is considered to be representative of the range in gold grade, sulphide content, and lithology with a focus on the life-of-mine open pit phases
| 25.6 | Mineral Resource Estimate |
Table 25-1 presents the MRE reported within a constraining resource pit shell and categorized by resource classification. The MRE has an effective date of September 3, 2024, and was prepared by QP Tim Maunula, P.Geo. Mineral resources that are not mineral reserves do not have demonstrated economic viability.
| Table 25-1: | Mineral Resource Table |
| Resource Category |
Cut-Off (Au g/t) |
Tonnes | Au (g/t) |
Au (oz) |
||||||||||||
| Indicated |
0.3 | 181,302,000 | 0.74 | 4,313,000 | ||||||||||||
| Inferred |
0.3 | 8,921,000 | 0.49 | 141,000 | ||||||||||||
Notes:
| 1. | Effective date of this updated MRE is September 3, 2024. The assay cut-off date for drill holes included in the mineral resource was April 30, 2024. |
| 2. | All mineral resources have been estimated in accordance with the CIM Definitions Standards (CIM, 2014), as required under National Instrument (NI) 43-101. Mineral resource statement prepared by QP Tim Maunula, P.Geo. (TMAC) in accordance with NI 43-101. |
| 3. | Mineral resources reported demonstrate reasonable prospect of eventual economic extraction, as required under NI 43-101. Mineral |
| Fenn-Gib Project |
Page 292 | |
| NI 43-101 Technical Report and Pre-Feasibility Study |
December 19, 2025 | |
|
|
| resources are not mineral reserves and do not have demonstrated economic viability. The mineral resources may be materially affected by environmental, permitting, legal, marketing, and other relevant issues. |
| 4. | Mineral resources are reported at a cut-off grade of 0.30 g/t Au for an open-pit mining scenario using a 50° pit slope angle. Cut-off grades are based on a price of US$2,000/oz gold, and an open pit mining cost of $3.25/t, process cost of $15.50/t and G&A $2.00/t. Metallurgical recovery of 94% was used. Densities were assigned based on interpreted lithology. |
| 5. | Troy ounce = tonnes x grade/31.10348. All numbers have been rounded to reflect the relative accuracy of the estimate. |
| 6. | The quantity and grade of reported inferred resources are uncertain in nature and there has not been sufficient work to define these inferred resources as indicated or measured resources. It is reasonably expected that many of the Inferred mineral resources could be upgraded to indicated mineral resources with continued exploration. |
| 7. | Tonnages and ounces in the tables are rounded to the nearest thousand. Numbers may not total due to rounding. |
| 25.7 | Factors That May Affect the Mineral Resource Estimate |
Factors that may affect the MRE include:
| | metal price and exchange rate assumptions |
| | changes to the assumptions used to generate the gold grade cut-off |
| | changes in local interpretations of mineralization geometry and continuity of mineralized zones |
| | changes to geological and mineralization shape and geological and grade continuity assumptions |
| | density and domain assignments |
| | changes to geotechnical, mining, and metallurgical recovery assumptions |
| | changes to the input and design parameter assumptions that pertain to the conceptual pit and stope designs constraining the estimates |
| | assumptions as to the continued ability to access the site, retain mineral and surface rights titles, maintain environmental, and other regulatory permits, and maintain the social license to operate. |
There are no other known environmental, legal, title, taxation, socioeconomic, marketing, political or other relevant factors that would materially affect the estimation of mineral resources that are not discussed in this technical report.
| 25.8 | Mineral Reserve Estimate |
The reserves for the Project are based on the conversion of the Indicated mineral resources in the study mine plan within the ultimate open pit limits. No Measured mineral resources are within the ultimate pit design. The level of information from drill holes and degree of certainty on assumptions used by the mine plan estimates provides reasonable support to classify Indicated mineral resources conversion directly to probable reserves.
The total mineral reserve for the Project is shown in Table 25-2.
| Fenn-Gib Project |
Page 293 | |
| NI 43-101 Technical Report and Pre-Feasibility Study |
December 19, 2025 | |
|
|
Table 25-2: Fenn-Gib Proven and Probable Mineral Reserves
| Process Feed | Grade | Contained Gold | ||||||||||
| Reserve Class |
(Mt) | Au (g/t) | Moz | |||||||||
| Proven |
— | — | — | |||||||||
| Probable |
25.13 | 1.29 | 1.04 | |||||||||
| Total Reserves |
25.13 | 1.29 | 1.04 | |||||||||
Note:
| 1. | This mineral reserve estimate has an effective date of December 19, 2025. |
| 2. | The mineral reserve estimation was completed under the supervision of Gordon Zurowski, P.Eng. of AGP Mining Consultants Inc., who is a QP as defined under NI 43-101. |
| 3. | Mineral reserves are stated within the ultimate design pit based on: |
| a. | US$1,750/ounce gold price |
| b. | Pit Limit corresponds to a pit shell with a revenue factor of 0.55, corresponding to a US$962 /ounce gold price. |
| c. | An elevated cut-off grade of 0.80 g/t Au for all pit phases. |
| d. | Preliminary mining cost assumptions of C$3.24/tonne mined of waste, C$3.23/tonne mined of ore, with an incremental mining cost of C$0.02/tonne/5 m bench mined below the 5,310 m elevation. |
| e. | Preliminary processing cost assumptions of C$14.50/tonne processed, general & administration assumption of C$2.10/tonne processed, and stockpile rehandle cost assumption of C$1.00/tonne processed. |
| f. | Preliminary process recovery assumptions of 92.6% for gold. |
| g. | An exchange rate of C$1.35 equal to US$1.00. |
| h. | The preliminary economic, cost and recovery assumptions used at the time of mine planning and reserve estimation may not necessarily conform to those stated in the economic model. |
| 4. | Pit slope inter-ramp slope angle assumptions ranged from 28-65° and overall slope angles ranging from 21-51°. |
The QP has not identified any known legal, political, environmental, or other risks that would materially affect the potential development of mineral reserves.
Technical risks that have been identified as potentially affecting the mineral reserves include mining selectivity near the ore contacts, slope stability, and assumed process recoveries for given rock types. These are considered manageable risks that will be mitigated with testing and operational experience.
| 25.9 | Mining Methods |
The PFS mine plan is based on open pit mining.
A main pit with three phases together with two smaller satellite pits will provide the open pit feed material necessary to maintain the process plant feed rate at 4,800 t/d while operational. The mine will produce 25.1 Mt of mill feed grading 1.29 g/t Au over a 14.5-year mining life after one year of pre-stripping. Waste from this pit will total 151.9 Mt for a strip ratio of 6.0:1.0 (waste: mill feed).
The mill feed cut-off grade used for the Study is 0.80 g/t Au. During the mine operation minimal material will be stockpiled (0.8 Mt) and only at the beginning of the mine life when ore is encountered during the pre-stripping operation. This will be reclaimed in Year 1.
| Fenn-Gib Project |
Page 294 | |
| NI 43-101 Technical Report and Pre-Feasibility Study |
December 19, 2025 | |
|
|
The main fleet will consist of three 165 mm down the hole drills, two 16 m3 diesel hydraulic shovels and one 13 m3 front end loader. Another 13 m3 loader will be at the crusher and can be used in the pit as needed. The truck fleet will total 8 – 92-tonne trucks at the peak of mining. They will deliver waste material for tailings facility construction. There is also a smaller fleet of two articulated trucks and two 63-tonne trucks for tailings facility maintenance and lift development. The usual assortment of dozers, graders, small backhoes, and other support equipment is considered in the equipment cost estimate.
Year -1 is the start of major mining activity using the mining equipment and the site infrastructure (roads, highway relocation, pads, etc.) are in place. The early phases will provide the highest grade to the mill in the first six years in the schedule. The open pit will be in operation until the middle of Year 15.
Waste material from the pit will be used in the construction of the TSF with excess going into the various MRSAs and overburden stockpiles. As the MRSA advances upwards, re-sloping of the sides will be occurring to allow for concurrent reclamation and reducing the visual impact of the facility.
In addition to the main open pit, two satellite pits will be mined and these will be used for water storage and diversion later in the mine life. The Phase 1N pit will be used to provide rock material for various mine infrastructure including haul roads, and pads as needed.
The mine equipment fleet is anticipated to be financed to lower initial capital requirements. The LOM operating cost, during the production period, is estimated at $4.53/t mined. This includes equipment financing of $0.12/t mined.
Pre-production stripping costs are estimated at $42.3 million, including capitalized operating costs and equipment leasing costs during pre-production period. Other initial mine capital including equipment is $15.3 million and $11.8 million for additional earthworks, road construction, water management and miscellaneous capital. Sustaining capital is estimated at $24.4 million.
| 25.10 | Process Plant |
The selected flowsheet consists of conventional mineral processing unit operations, with additional unit processes compared to a typical gold plant to provide greater gold recoveries. No significant elements of technological innovation are used in this flowsheet as conventional comminution, gravity, flotation, and leaching circuits are employed. Previous studies, coupled with available test work results and financial evaluations, were used to develop the resulting flowsheet.
The process flowsheet consists of the following circuits:
| | Three-stage crushing of ROM ore. |
| | A waste diverter chute to allow for crushing of aggregate material for use on site. |
| | A crushed ore stockpile to provide buffer capacity (24 h) ahead of the grinding circuit. |
| | Ball mill with trommel screen and cyclone classification. |
| Fenn-Gib Project |
Page 295 | |
| NI 43-101 Technical Report and Pre-Feasibility Study |
December 19, 2025 | |
|
|
| | Provision for possible future installation of a gravity concentration and intensive leaching of the gravity concentrate. |
| | Trash screening and rougher flotation. |
| | Flotation concentrate handling and regrind. |
| | Leach and carbon adsorption (L/CIL) of reground flotation concentrate. |
| | Acid washing of loaded carbon and AARL type elution followed by electrowinning and smelting to produce doré. |
| | Carbon regeneration by rotary kiln. |
| | Cyanide destruction of tailings using the SO2/air process. |
| | Tailings disposal. |
The overall plant availability is 92%, with the crushing circuit operating at 67% availability.
Reagents used in the selected flowsheet include hydrated lime, AERO® promoters, PAX collector, MIBC frother, flocculant, sodium cyanide, sodium hydroxide, sodium metabisulphite, copper sulphate, nitric acid, leach aid, coconut shell as activated carbon and typical flux reagents. The reagents are well known within the minerals processing industry and are stored in accordance with the manufacturers’ guidelines and specifications.
| 25.11 | Infrastructure |
Site investigations are scheduled to be completed during 2026 to confirm foundation conditions along the east side of the TSF and within the footprint of the MRSA. The TSF and MRSA arrangements may be revised pending the site investigation findings and confirmation of geotechnical design parameters
Site investigations are scheduled to be completed during the first quarter of 2026 to confirm geotechnical parameters for the silt and clay overburden within the open pit area. The excavation slopes within the silt and clay and volume of overburden to be removed will be further assessed following confirmation of geotechnical design parameters.
Groundwater dewatering during construction and operations carries risks of inaccurate prediction of seepage rates, excessive groundwater inflows, elevated pore pressures, and unintended drawdown or water quality impacts beyond the mine footprint. Higher-than-expected seepage can compromise slope stability, increase pumping and treatment requirements. Groundwater numerical modelling studies are currently being completed to evaluate any potential impacts and seepage rates. Detailed sensitivity analysis will be completed to assess a wide range of aquifer properties and operational conditions to inform potential risks elements.
Contingency planning using groundwater interceptor wells will be assessed, if applicable, as a proactive control by allowing targeted capture of groundwater along high-permeability structures or between the mine and sensitive receptors. Pre-permitted, trigger-based activation of interceptor wells supports adaptive management and reduces operational, environmental, and geotechnical risk if actual conditions deviate from predictions. The Project intends to include excess water discharge to the Pike River. Studies related to baseline water quality data, geochemical testing
| Fenn-Gib Project |
Page 296 | |
| NI 43-101 Technical Report and Pre-Feasibility Study |
December 19, 2025 | |
|
|
and analyses and assimilative capacity are in progress and/or planned to be completed to determine effluent discharge strategies in consultation with Indigenous communities and government agencies.
| 25.12 | Markets and Contracts |
The QP acknowledges that gold is a freely traded commodity with deep, liquid international markets, and therefore marketability of production from the Fenn Gib Project is not considered a risk.
| | The QP has reviewed the long-term metal prices provided by CIBC’s research. Based on this review, the QP considers that the information and conclusions presented in these studies reasonably support the assumptions made in this Technical Report regarding commodity pricing. |
| 25.13 | Environmental, Permitting and Social Considerations |
QP has reviewed the available data and supporting studies related to environmental, permitting, social, and closure considerations for the Project. Based on this review, the following conclusions are provided:
| | Environmental Studies and Baseline Conditions |
| | Extensive baseline environmental studies have been completed since 2021 to characterize aquatic and terrestrial ecosystems, groundwater, air quality, noise, and cultural heritage resources within, and in the general vicinity of the Project site. Results indicate that environmental conditions are typical of northern Ontario, with no critical constraints identified that would prevent mine development. |
| | Initial geochemical characterization studies have been completed and additional targeted geochemical studies to further refine the understanding of the geochemical behaviour of mine wastes are ongoing. Geochemical characterization confirms that most mine rock and tailings are non-potentially acid generating (non-PAG), with a portion classified as PAG requiring engineered containment and subaqueous deposition within the TSF. These measures are standard practice and incorporated into the project design. |
| | Permitting and Regulatory Framework |
| | The Project does not currently hold permits for construction or operations, as it remains at the pre-feasibility stage. The Project will require a suite of permits and approvals typical of mine developments of the sort contemplated at Fenn-Gib, primarily under provincial jurisdiction. Select elements of the Project will require approval through the Provincial Class EA process. The Project is not a Physical Activity as defined in the Physical Activities Regulations under the federal Impact Assessment Act and therefore federal IA is not indicated though an authorization under the federal Fisheries Act may be required. |
| | Early engagement with regulators has been initiated, and no significant impediments to permitting have been identified. Mayfair is in discussions with the Ontario government regarding entry into the 1P1P initiative that includes facilitation of all necessary provincial approvals which would be expected to streamline regulatory review and allow early works commencement. |
| | Social and Community Engagement |
| Fenn-Gib Project |
Page 297 | |
| NI 43-101 Technical Report and Pre-Feasibility Study |
December 19, 2025 | |
|
|
| | The Project is located within Treaty 9 and the traditional territory of Apitipi Anicinapek Nation. Mayfair Gold maintains an active Exploration Agreement with AAN and has committed to consultation with additional Indigenous communities as directed by the Ministry of Energy and Mines. Engagement with local stakeholders, including the Town of Matheson, is ongoing and proactive. No significant concerns have been raised to date. |
| | Closure and Reclamation |
| | A conceptual closure strategy has been developed that will be the basis of the Closure Plan that will meet the requirements of Ontario Regulation 35/24 and the Mine Rehabilitation Code of Ontario. The plan intends to include, among other things, removal of infrastructure machinery and equipment, stabilization of tailings and mine rock storage areas, pit flooding, and revegetation of disturbed areas using native species. Financial assurance will be provided to cover the full cost of closure and long-term monitoring, including contingencies for water treatment and ARD/metal leaching mitigation. |
| 25.13.1 | Environmental, Permitting and Social Considerations Conclusion |
No material environmental, permitting, or social constraints have been identified that would prevent the advancement of the Project to the next stage of development. Known considerations, such as management of PAG material, cyanidation residues, and regulatory timelines are typical for similar projects in Ontario and are addressed in the Project design and permitting strategy. Continued engagement with Indigenous communities, stakeholders, and regulators will be critical to maintaining schedule and securing social license.
| 25.14 | Capital Cost Estimate |
The capital cost estimate was developed in Q3 2025 CAD dollars based on budgetary quotations for equipment and construction contracts, as well as Ausenco’s in-house database of projects and studies including experience from similar operations.
The estimate conforms to Class 4 guidelines for an PFS-level estimate with a ±25% accuracy according to the Association for the Advancement of Cost Engineering International.
The estimate includes mining, processing, onsite infrastructure, tailings and mine rock storage areas, offsite infrastructure, project indirect costs, project delivery, owners’ costs, and contingency.
The total initial capital cost for the Project is $450 million; and LOM sustaining costs are $110 million inclusive of closure costs.
| 25.15 | Operating Cost Estimate |
The operating cost estimate conforms to AACE Class 4 guidelines (±25%) The operating cost was developed in Q3 2025 Canadian dollars based on recent quotations as well as Ausenco’s in-house database of projects and studies.
The total mining operating cost for the project is $771 million over the life of mine, or 30.66 $/t processed. The total processing and G&A operating cost for the project is $171 million over the life of mine, or 6.82 $/t processed.
| Fenn-Gib Project |
Page 298 | |
| NI 43-101 Technical Report and Pre-Feasibility Study |
December 19, 2025 | |
|
|
Costs associated with Indigenous Impact Benefit Agreements have not been included in the current cost evaluations. These will be assessed and incorporated into future technical reports as appropriate.
| 25.16 | Economic Analysis |
Based on the assumptions in this report, the Project has a positive cash flow. The pre-tax NPV discounted at 5% (NPV5%) is $981 million, the IRR is 28.8%, and the payback period is 2.6 years. On an after-tax basis, the NPV5% is $652 million, the IRR is 24.1%, and the payback period is 2.7 years.
A sensitivity analysis was conducted on the base case after-tax NPV, IRR, and Payback of the Project, using the following variables: gold price, foreign exchange rate, initial capital costs and operating costs. The analysis revealed that the Project is most sensitive to changes in metal prices followed by foreign exchange rate, operating costs and initial capital costs.
| 25.17 | Risks and Opportunities |
Risks to the project include changes to metal price and exchange rate assumptions, interpretation of mineralization geometry and continuity, assumed density and domain assignments, and assumptions regarding continued ability to access the site, retain mineral and surface rights titles, and maintain environmental and other regulatory permits and social license to operate.
| 25.17.1 | Risks |
| 25.17.1.1 | Exploration and Drilling |
Risks to the drilling and exploration program include the interpretation of mineralization geometry and continuity at depth and along strike, potential changes in drilling productivity and costs, and continued access to the property for drilling operations.
| 25.17.1.2 | Metallurgical Testwork & Recovery Methods |
The following are risks regarding the metallurgical testwork and recovery methods:
| | A small number of samples underwent competency testwork. The Axb parameter is being informed by five samples, one of which is a composite. Further competency testwork is recommended ahead of future phases to increase confidence in the comminution circuit design. |
| | Similarly, the Bond Work Index tests were performed on 10 samples at a P80 of 106 µm, four of which are composites. Additional testwork is recommended on variability samples to ensure the ball mill is adequately sized for the entirety of the deposit. |
| | The concentrate thickener and tailings thickener were sized based on the solids settling rates of similar materials at similar particle size distributions as no dynamic settling tests were performed for the PFS. Dynamic settling tests and vendor-specific dewatering tests are recommended ahead of the next phase. |
| Fenn-Gib Project |
Page 299 | |
| NI 43-101 Technical Report and Pre-Feasibility Study |
December 19, 2025 | |
|
|
| | Evaluate the inclusion of a PumpCell CIL or CIP circuit that can be located indoors instead of a conventional CIL circuit, that is located outdoors with a cover structure. |
| | Similarly, no rheology testwork was performed, which poses a risk to the tailings lines and tailings pumps. |
| | No cyanide destruction testwork was performed for the PFS. The design criteria for this circuit were selected conservatively based on operating data of mills in the area with similar cyanide dosages in the leach circuit. |
| 25.17.1.3 | Mining Methods |
| | Overburden Slopes: Flatter slopes may be required in overburden due to poor overburden quality. Additional geotechnical drilling to accurately estimate expected slopes could mitigate the risk. |
| | PAG/non-PAG characterization: Further understanding of the rock properties may show PAG material present that could result in reduced NAG material for TSF construction. Additional geochemical testwork to improve material characterization could mitigate the risk. |
| | Water inflows: Additional pumping requirements and site discharge to environment. Additional hydrogeological drilling/modelling to better understand water inflows could mitigate the risk. |
| 25.17.1.4 | Environmental, Permitting and Social Considerations |
| Table 25-3: | Risks – Environmental, Permitting, and Social Considerations |
| Category |
Risks | |
| Environmental | PAG material and cyanidation residues require engineered containment to prevent ARD/ML. | |
| Existing background water quality exceedances (iron, aluminum, phosphorus) could worsen due to project activities. | ||
| TSF structural failure or seepage could cause contamination and penalties. | ||
| Permitting | Regulatory timelines for Closure Plan, PTTW, and ECAs may delay construction and increase costs. | |
| A ‘Bump-up’ request from a stakeholder will delay the provincial EA timelines and could add compliance obligations. | ||
| Social | Indigenous/community consultation outcomes may require design changes, impacting schedule/cost. | |
| Lack of transparent engagement could lead to opposition or legal challenges. | ||
| 25.17.1.5 | Operating Cost Estimate |
Operating cost estimates were based on recent quotes that may or may not reflect prices at the time of project execution. These costs should be updated as market conditions change.
Reagent and consumable consumption rates were estimated based on available testwork and may change as additional testwork becomes available throughout the project development phases.
| Fenn-Gib Project |
Page 300 | |
| NI 43-101 Technical Report and Pre-Feasibility Study |
December 19, 2025 | |
|
|
| 25.17.2 | Opportunities |
| 25.17.2.1 | Exploration and Drilling |
The current MRE demonstrates a robust deposit containing 4.3 Moz of gold in the Indicated classification category. The opportunity exists to expand the mineral resource for the Fenn-Gib Deposit, including the Footwall Zone, as the mineralized zones remain open at depth and along strike to both the east and west.
| 25.17.2.2 | Metallurgical Testwork & Recovery Methods |
The following lists opportunities available for the metallurgical testwork and recovery methods:
| | Confirm feasibility and economics of gravity gold circuit. Additional testwork required: flotation and leach tests should be performed on identical samples with and without gravity gold recovery to evaluate differences in grades and recoveries. The inclusion would marginally impact the project’s initial and/or sustaining capital costs to account for the installation of the gravity gold and ILR circuits. No benefits in recovery from the gravity circuit have been included in the gold recovery model. |
| | Evaluate deferral or deletion of cyanide detoxification thickener. The main purpose of this thickener is to recirculate the cyanide-bearing water to minimise cyanide consumption within the leach circuit. |
| 25.17.2.3 | Mining Methods |
| | Overburden: Steeper slopes would help reduce waste movement. Additional geotechnical drilling to accurately estimate expected slopes would be required to assess potential opportunity. |
| | Density Analysis: Better understanding of material densities could result in better sized truck beds and shovel dippers. This testing could help improve carrying capacity and overall mining fleet productivity. |
| | Phase 1N: Use of rock from this phase may be used to help with the highway relocation and reduce quarry needs for the highway foundation construction. |
| 25.17.2.4 | Environmental, Permitting and Social Considerations |
| Table 25-4: | Opportunities – Environmental, Permitting, and Social Considerations |
| Category |
Opportunities | |
| Environmental | Progressive reclamation and water recycling reduce liabilities and improve sustainability | |
| Passive treatment systems post-closure minimizes costs while meeting compliance standards | ||
| Permitting | Early regulator engagement and Ontario 1P1P process can streamline permitting and reduce delays | |
| Phased Closure Plan filing allows early works commencement and flexibility | ||
| Social | Respectful relationships with Indigenous communities enhance social license and reduce risk of delays | |
| “Good neighbour” agreement and local infrastructure development foster community support with the Town of Matheson | ||
| Fenn-Gib Project |
Page 301 | |
| NI 43-101 Technical Report and Pre-Feasibility Study |
December 19, 2025 | |
|
|
| 25.17.2.5 | Infrastructure |
Geotechnical characterization work completed to date indicates that sand and gravel till deposits with the open pit will be suitable TSF embankment construction including bedding, transition and downstream fill zones. Non-PAG Mine rock from the open pit development will be used to construct the downstream fill zones for the embankment raises. There is an opportunity to further integrate the TSF and MRSA to reduce the overall footprint of the facilities.
If excess water is encountered, there is an opportunity to employ a Managed Aquifer Recharge (MAR) strategic option to manage groundwater from pit dewatering systems or seasonal inflows. This water is part of the natural hydrologic system, not a waste product and there may be an opportunity to view it as a nature-integrated asset. Routing excess groundwater through standard methods and passive low risk management options such as constructed wetlands and/or managed aquifer recharge systems (infiltration basins, trenches, or recharge wells.
| Fenn-Gib Project |
Page 302 | |
| NI 43-101 Technical Report and Pre-Feasibility Study |
December 19, 2025 | |
|
|
| 26 | RECOMMENDATIONS |
| 26.1 | Introduction |
The Project demonstrates positive economics, as shown by the results presented in this Study. Table 26-1 summarizes the proposed budget to advance the project work and designs to develop a construction control estimate allowing the Company to advance to a Construction Decision.
| Table 26-1: | Recommended Work Program |
| Program Component |
Estimated Total Cost ($M) |
|||
| Drilling |
5.7 | |||
| Mining and Geology |
2.0 | |||
| Plant Design |
11.0 | |||
| Metallurgical Testwork |
1.0 | |||
| Tailings and Water Management Designs |
4.5 | |||
| Geotechnical and Site Investigations |
4.6 | |||
| Infrastructure Designs |
2.0 | |||
| Environmental Studies, Project Approvals and Community Engagement |
5.0 | |||
| Construction Control Estimate |
0.2 | |||
|
|
|
|||
| Total |
36.0 | |||
|
|
|
|||
| 26.2 | Drilling |
| | Advance resource confidence drilling, similar to grade control drilling, to improve certainty in the resource model. |
| | Complete condemnation diamond drilling to ensure key infrastructure is not located over potential future mine reserves. |
| 26.3 | Mining and Geology |
| | Consider advancing a bulk-sample program and conduct a blasting study to refine explosives requirements and material fragmentation properties. |
| | Collaborate with vendors to optimize bucket and truck bed sizing, considering wet material and density variations to minimize carryback and maximize productivity. |
| | Perform detailed overburden characterization and hydrogeological testing. |
| Fenn-Gib Project |
Page 303 | |
| NI 43-101 Technical Report and Pre-Feasibility Study |
December 19, 2025 | |
|
|
| | Undertake tests to validate joint set and structural properties critical to stability. |
| | Implement grade control drilling to define operational ore/waste contacts. |
| | Conduct geotechnical drilling to confirm open-pit slope design parameters. |
| | Advance geological investigations to improve lithological and structural delineation, deepen understanding of grade distribution, and characterize waste-rock units and their geo-metallurgical attributes. |
| 26.4 | Plant Design |
| | Complete front-end engineering design (FEED) and detailed plant engineering. |
| | Within the FEED evaluate modular construction options to reduce schedule risk and capital intensity. |
| | Identify required vendor drawings to advance designs. |
| | Assess long-lead equipment procurement needs and potential down payments to secure production slots aligned with construction timelines. |
| | Develop a construction control estimate to support the Company’s decision-making. |
| 26.5 | Metallurgical Testwork |
| | Perform additional competency and Bond Work Index tests, focusing on deposit variability. |
| | Conduct leach tests with and without gravity gold recovery to assess its value in the circuit. |
| | Execute flotation tests across variability samples to confirm flowsheet performance. |
| | Carry out cyanide detoxification tests to determine optimal reagent dosages for compliance with environmental discharge standards. |
| | Complete dynamic settling and rheology tests on flotation and detoxification tailings. |
| 26.6 | Tailings Storage Facility and Water Management |
| | Advance TSF designs to issued-for-construction (IFC) status |
| | Complete site investigations to support IFC designs. |
| | Develop an integrated water balance and water management strategies for both construction and operational phases. |
| | Implement an integrated approach to water management and earthworks to enhance sustainability and reduce environmental impact. |
| | Implement an Independent Tailing Review Panel prior to construction of the TSF. |
| Fenn-Gib Project |
Page 304 | |
| NI 43-101 Technical Report and Pre-Feasibility Study |
December 19, 2025 | |
|
|
| 26.7 | Geotechnical and Site Investigations |
| | Conduct geotechnical drilling to validate pit slope stability, including joint set and structural properties. |
| | Characterize overburden and perform hydrogeological testing. |
| | Investigate foundation conditions near the TSF and MRSA footprint, as well as silt and clay overburden within the pit. |
| | Expand rock geomechanical characterization along pit walls. |
| | Drill additional hydrogeological test holes and obtain water chemistry profiles to identify water-bearing faults and predict quality issues. |
| | Develop a groundwater flow simulation model to forecast inflows and piezometric surface changes during operations. |
| 26.8 | Infrastructure Design |
| | Advance engineering for power supply options, transmission routing, and HONI/IESO processes. |
| | Develop contingency plans for power supply during operations. |
| | Progress highway 101 relocation engineering and coordinate with MTO for approvals. |
| | Design all site and off-site infrastructure to support operations. |
| | Plan construction camp requirements and optimize logistics for readiness. |
| 26.9 | Environmental Studies, Project Approvals and Community Engagement |
| | Continue baseline environmental studies to support provincial EA and permitting. |
| | Advance geomechanical characterization and hydrogeological modeling for dewatering strategies. |
| | Progress geochemistry work related to metal leaching and acid rock drainage |
| | Support Class EA processes and integrate with Ontario’s “One Project, One Process” framework. |
| | Initiate stakeholder consultations with AAN and other Ministry-identified communities. |
| 26.10 | Construction Control Estimate |
| | Compile all work and designs to develop a Construction control estimate to allow for the Company to advance to a Construction Decision. |
| 26.11 | Estimated Total Cost |
The total recommended budget for the next phase of work is approximately $36 million.
| Fenn-Gib Project |
Page 305 | |
| NI 43-101 Technical Report and Pre-Feasibility Study |
December 19, 2025 | |
|
|
| 27 | REFERENCES |
Aurora Geosciences Ltd. (2023). Fenn–Gib North Block Soil Sampling MMI Results, Au ppb. SGS Laboratories, Burnaby, B.C.
Bath, A. C. (1990). Mineral occurrences, deposits, and mines of the Black River-Matheson area. Open File Report 5735. Ontario Geological Survey.
Berger, B. (2002). Geological Synthesis of the Highway 101 Area, East of Matheson, Ontario. Open File Report 6091, 149 p.6. Ontario Geological Survey
Berger, B., & Amelin, Y. (1998). Project Unit 97-024. Geological investigations along Highway 101; Guibord, Michaud and Garrison townships. In J. A. Ayer, C. L. Baker, J. C. Ireland, R. I. Kelly, & P. C. Thurston (Eds.), Summary of field work and other activities 1998 (Miscellaneous Paper 169, pp. 25–32). Ontario Geological Survey.
Brace, T., Campbell, I., Koch, R., & Mancini, L. (2017, October 17). 2017 Summary Report on 2017 Work Activities Fenn–Gib Project. MPH Consulting Ltd.
Brown, J., & Sutherland, D. (2022, December 1). Mayfair Gold Corp. Fenn–Gib SGH Surveys. Activation Laboratories Ltd.
Brown, P. (2001, June). Report on Geological Potential, Fenn–Gib property. Pangea Goldfields Inc.
Brown, P. (2002). Fenn Gib Drilling Report. March/April 2002. Assessment report. Pangea Goldfields Inc.
Buford, C. (2025). “Mayfair Gold Electrical Power Supply Project Pre-Feasibility Study”. Internal. TWD Technologies Ltd.
CIM Standing Committee on Reserve Definitions. (2014). CIM Definition Standards for Mineral Resources and Mineral Reserves. Canadian Institute of Mining, Metallurgy and Petroleum.
Crary, T., & Jackman, R. (2015). An Investigation into Gold Recovery from the Fenn–Gib Deposit. SGS Lakefield Inc.
Cregheur, P. (1996, August). In House Prefeasibility Study, Fenn–Gib Project. Pangea Goldfield Inc.
Daezali, A., Dietrich, J., Elfen, S., & Meintjes, T. (2020, May 28). Pan American Silver Fenn–Gib Due Diligence. Ausenco on behalf of Henney Capital.
Dagbert, M., & Desharnais, G. (2011, November 17). Fenn–Gib Resource Estimate Technical Report, Timmins Ontario. SGS Lakefield Inc.
Dubé, B., & Mercier-Langevin, P. (2020). Gold Deposits of the Archean Abitibi Greenstone Belt, Canada. In R. H. Sillitoe, R. J. Goldfarb, F. Robert, & S. F. Simmons (Eds.), Geology of the World’s Major Gold Deposits and Provinces (pp. 669-708). Society of Economic Geologists.
| Fenn-Gib Project |
Page 306 | |
| NI 43-101 Technical Report and Pre-Feasibility Study |
December 19, 2025 | |
|
|
Dyck, D., & Sparling, J. (1997, April). Environmental studies Report Barton Creek and Little Pike River Watersheds. Agra Earth & Environmental Ltd.
G Mining Services Inc. (2025, June). Preliminary Economic Assessment NI 43-101 Technical Report, Tower Gold Project, Ontario, Canada. Prepared for STLLR Gold Inc.
Hennessey, B., & Gowans, R. (2019, February). A Mineral Resource Estimate for the Golden Highway Project, Michaud and Garrison Townships, Black River–Matheson Area, Northeastern Ontario. Micon International Limited prepared for Moneta Porcupine Mines Inc.
Hobbs, L. G. (1986, February). A Report on the 1978 Exploration project on the Wood–Croesus gold mines property. Wood-Croesus Gold Mines.
Jelenic, A. (2023). Fenn–Gib Project 2022-2023 Geophysics—North Block IP Surveys Field Report. Aurora Geosciences Ltd.
Kirkham, G., Makarenko, M., & Crowie, T. (2021, February). NI 43-101 Technical Report Fenn–Gib Project, Ontario, Canada. JDS Energy & Mining Inc. Prepared for Mayfair Gold Corp.
Live, P. (2005, January). Fenn–Gib Gold Project Open Pit Economics Evaluation Briefing Report (Report Nº 5686001-001). Breton, Blainville & Associates.
Mancini, L., & Conquer, S. (2012, May). Summary of Work Report for the Diamond Drill Program on the Fenn–Gib property, Guibord Township. Lake Shore Gold Corp.
Mancini, L. (2014, June). Spring 2014 Assessment Report for Fenn–Gib property Claims 4272132 and 4258968. Lake Shore Gold Corp.
Mancini, L. (2018, October). Diamond Drilling on the Fenn–Gib property 2017. Prepared for the Ministry of Northern Development and Mines Ladner Lake Mining Division, Northeastern Ontario. Lake Shore Gold Corp.
Marchand, K. (1996, August). Summary of Exploration work 1993 to 1996, Fenn–Gib property, Munro and Guibord Townships. Pangea Goldfields Inc.
Maunula, T. (2023, July). Mayfair Gold National Instrument 43-101 Technical Report, Fenn–Gib Project, Ontario, Canada. Prepared by T. Maunula & Associates Consulting Inc.
Maunula, T. (2025, October). Mayfair Gold National Instrument 43-101 Technical Report, Fenn–Gib Project, Ontario, Canada. Prepared by T. Maunula & Associates Consulting Inc.
Mayfair Gold Corp. (2021, February). Fenn–Gib Core Logging Procedures. Internal document.
Mayfair Gold Corp. (2022, May). Fenn–Gib QAQC Protocol. Internal document.
| Fenn-Gib Project |
Page 307 | |
| NI 43-101 Technical Report and Pre-Feasibility Study |
December 19, 2025 | |
|
|
Mayfair Gold Corp. (2022, October 18). Mayfair Gold Increases Fenn–Gib Open Pit Indicated Resource by 47% to 3.06 M Ounces and Inferred Resource by 315% to 0.31 M Ounces [Press release]. https://financialpost.com/globe-newswire/mayfair-gold-increases-fenn-gib-open-pit-indicated-resource-by-47-to-3-06m-ounces-and-inferred-resource-by-315-to-0-31m-ounces
Mayfair Gold Corp. (2023, July). Fenn–Gib Drillhole Related Protocols. Internal document.
McElhanney Ltd. (2022, October). Fenn–Gib LiDAR and Orthophoto.
MPH Consulting Limited. (1994, June). Assessment Report on the Fenn and Gib Projects, Guibord and Munro Townships, Larder Lake Mining Division, Ontario for Pangea Goldfields Inc. Volume VII. Prepared for Pangea Goldfields Inc.
Munro, S. (2021, April 28). Heli-GT Three-Axis Magnetometer Gradiometer Survey, Fenn–Gib Project, Matheson, Ontario. SHA Geophysics Ltd.
Poehlman, T. (2024): Mayfair Gold Land Report, 23 April 2024. Report Generated on Mining Lands Administration System by In Good Standing Corporation.
Province of Ontario. (1990). Mining Act. R.S.O. 1990, Chapter M.14. June 5, 2025, Version. https://www.ontario.ca/laws/statute/90m14.
Raponi, T. R., Elfen, S., Weston, S, Hasanloo, D., Dufresne, M., Lill, J., & Farmer, N. (2022, September 7). NI 43-101 Report & Preliminary Economic Assessment of the Tower Gold Project, Northeastern Ontario. Prepared by Ausenco Engineering Canada ULC for Moneta Gold Inc. https://minedocs.com/23/Moneta_Gold_Tower_Gold_Project_PEA_09072022.pdf
Rennick, M. W. (2004, May). Report on the Tandem Resources Ltd., Highway 101 Property, Guibord Township, District of Cochrane, Larder Lake Mining District.
Robert, F., & Poulsen, K. H. (1997). World-class Archean gold deposits in Canada: an overview. Australian Journal of Earth Sciences, 44, 329–351.
Rollwagen, D. W., Salter, R. S., & Furey, J. T. (1989). Investigation of the Recovery of Gold from Fenn Project Samples. Submitted to Corona Corporation. Lakefield Research Inc.
Satterly, J. (1951). Geology of Munro Township. Sixtieth Annual Report of the Ontario Department of Mines [Volume LX, Part VII], p. 45. Legislative Assembly of Ontario.
Scobie, B. J. (1995). An Investigation of the Recovery of Gold from Fenn–Gib Bulk Samples. Progress Report No. 2. L.R. 4758. Submitted by Pangea Goldfields Inc. Lakefield Research Inc.
Scobie, B. J. (1996). An Investigation of the Recovery of Gold from Fenn–Gib Bulk Samples. Progress Report No. 3. L.R. 4758. Submitted by Pangea Goldfields Inc. Lakefield Research Inc.
| Fenn-Gib Project |
Page 308 | |
| NI 43-101 Technical Report and Pre-Feasibility Study |
December 19, 2025 | |
|
|
Scobie, B. J. (1997). An Investigation of the Recovery of Gold from Fenn–Gib Bulk Samples. Progress Report No. 4. L.R. 4758. Submitted by Pangea Goldfields Inc. Lakefield Research Inc.
SGS Canada Inc. (2014, August). Gold Recovery from the Fenn–Gib Deposit. Project 13640-01. Prepared by SGS-Lakefield for Lake Shore Gold Corp.
SGS Canada Inc. (2015, January). Gold Recovery from the Fenn–Gib Deposit. Project 13640-01. Prepared by SGS-Lakefield for Lake Shore Gold Corp.
SGS Canada Inc. (2017, December). Gold Recovery for Fenn–Gib Deposit Samples. Project 16116-01. Prepared by SGS-Lakefield for Lake Shore Gold Corp.
SGS Canada Inc. (2018, July). Gold Recovery for Fenn–Gib Deposit Samples. Project 16116-01. Prepared by SGS-Lakefield for Lake Shore Gold Corp.
SGS Canada Inc. (2022, August). The Recovery of Gold from Fenn–Gib Project Samples. Project 18831-01. Prepared by SGS-Lakefield for Lake Shore Gold Corp.
SGS Canada Inc. (2023, March). Recovery of Gold from a Fenn–Gib Project Sample. Project 18831-02. Prepared by SGS-Lakefield for Lake Shore Gold Corp.
Sparling, J. (1997, May). Geotechnical investigation North of Highway 101. Prepared by Agra Earth & Environmental Ltd.
Stalker, M. (2003, September). Report of Work Geological Survey Wood–Croesus Property. Prepared by Croesus Gold Inc.
STLLR Gold Inc. (2025). STLLR Gold Delivers Updated Mineral Resource Estimate and PEA Demonstrating US$1.0 Billion After-Tax NPV5% for the Large-Scale Tower Gold Project in Ontario, Canada. May 15, 2025 [Press release]. https://stllrgold.com/news/stllr-gold-delivers-updated-mineral-resource-estimate-and-pea-demonstrating-us-1-0-billion-after-tax-npv5-for-the-large-scale-tower-gold-project-in-ontario-canada
Talakoski, J. (2025). “Highway 101 Realignment Feasibility Study – Mayfair Gold”. Internal. TBT Engineering Ltd.
| Fenn-Gib Project |
Page 309 | |
| NI 43-101 Technical Report and Pre-Feasibility Study |
December 19, 2025 | |