On October 3, 2023 and again on July 14, 2025, the Fund’s investment strategy changed. Prior to October 3, 2023, the Fund sought to achieve its investment objective by investing all or substantially all of its assets in exchange-traded futures contracts on bitcoin and Collateral Investments. Following October 3, 2023 and prior to July 14, 2025, the Fund sought to achieve its investment objective by investing all or substantially all of its assets in Bitcoin and Ether Futures Contracts and Collateral Investments. Following July 14, 2025 the Fund seeks to achieve its investment objective by investing at least 80% of its net assets (plus borrowings for investment purposes) in Bitcoin and Ether Futures Contracts. For purposes of this investment test, derivative contracts (such as Bitcoin and Ether Futures Contracts) will be valued using their notional value.
Therefore, the Fund’s performance and historical returns shown below are not necessarily indicative of the performance that the Fund would have generated based upon its current strategy.
The bar chart and table below illustrate the annual calendar year returns of the Fund based on net asset value as well as the average annual Fund returns. The bar chart and table provide an indication of the risks of investing in the Fund by showing changes in the Fund’s performance from year-to-year and by showing how the Fund’s average annual total returns based on net asset value compare to those of a broad-based market index. The Fund’s performance information is accessible on the Fund’s website at https://coinshares.com/us/etf/btf/.
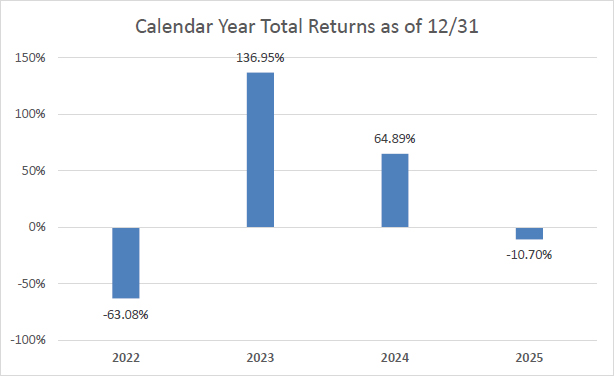
The Fund’s highest quarterly return was 69.66% (quarter ended March 31, 2023) and the Fund’s lowest quarterly return was -59.24% (quarter ended June 30, 2022).
| Average Annual Total Return as of December 31, 2025 | ||
| CoinShares Bitcoin and Ether ETF | 1 Year | Since Inception
(10/21/2021) |
| Return Before Taxes | -10.70% | -1.96% |
| Return After Taxes on Distributions | -32.75% | -12.84% |
| Return After Taxes on Distributions and Sale of Fund Shares | -6.75% | -5.51% |
| S&P 500 Total Return Index (reflects no deduction for fees, expenses or taxes) | 17.88% | 11.87% |
The Fund’s past performance (before and after taxes) is not necessarily an indication of how the Fund will perform in the future.
Returns before taxes do not reflect the effects of any income or capital gains taxes. All after-tax returns are calculated using the historical highest individual federal marginal income tax rates and do not reflect the impact of any state or local tax. Returns after taxes on distributions reflect the taxed return on the payment of dividends and capital gains.
Your own actual after-tax returns will depend on your specific tax situation and may differ from what is shown here. After-tax returns are not relevant to investors who hold Shares in tax-deferred accounts such as individual retirement accounts (IRAs) or employee-sponsored retirement plans.
The bar chart and table below illustrate the annual calendar year returns of the Fund based on net asset value as well as the average annual Fund returns. The bar chart and table provide an indication of the risks of investing in the Fund by showing changes in the Fund’s performance from year-to-year and by showing how the Fund’s average annual total returns based on net asset value compare to those of a broad-based market index. The Fund’s performance information is accessible on the Fund’s website at https://https://coinshares.com/us/etf/wgmi/.
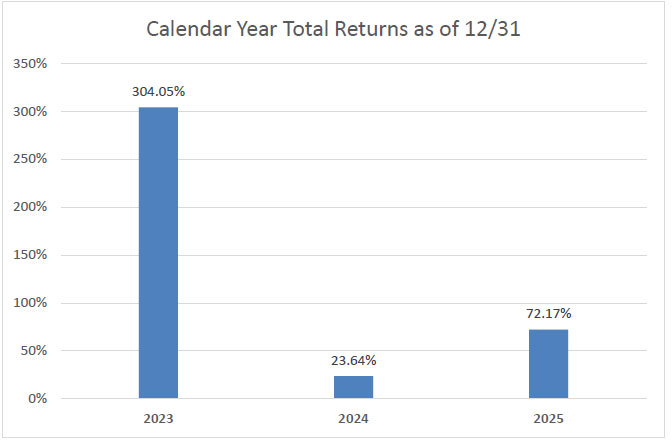
The Fund’s highest quarterly return was 106.97% (quarter ended March 31, 2023) and the Fund’s lowest quarterly return was -42.36% (quarter ended March 31, 2025).
| Average Annual Total Return as of December 31, 2025 | ||
| CoinShares Bitcoin Mining ETF | 1 Year | Since Inception (2/7/2022) |
| Return Before Taxes | 72.17% | 10.36% |
| Return After Taxes on Distributions | 72.17% | 10.30% |
| Return After Taxes on Distributions and Sale of Fund Shares | 42.72% | 8.11% |
| S&P 500 Total Return Index (reflects no deduction for fees, expenses or taxes) | 17.88% | 13.15% |
The Fund’s past performance (before and after taxes) is not necessarily an indication of how the Fund will perform in the future.
Returns before taxes do not reflect the effects of any income or capital gains taxes. All after-tax returns are calculated using the historical highest individual federal marginal income tax rates and do not reflect the impact of any state or local tax. Returns after taxes on distributions reflect the taxed return on the payment of dividends and capital gains.
Your own actual after-tax returns will depend on your specific tax situation and may differ from what is shown here. After-tax returns are not relevant to investors who hold Shares in tax-deferred accounts such as individual retirement accounts (IRAs) or employee-sponsored retirement plans.