The accompanying bar chart and table provide some indication of the risks of investing in the Fund by showing the Fund’s total return for the year ended December 31, 2025, and the performance history of the Center Coast MLP Focus Fund, a series of Investment Managers Series Trust (the “Predecessor Fund”), including by showing how the Fund’s average annual total returns compare with those of the S&P 500 Index, a broad measure of market performance, and with those of additional indices that have investment characteristics similar to those of the Fund. Following the close of business on February 2, 2018, the Fund acquired all of the assets, subject to liabilities, of the Predecessor Fund through a tax-free reorganization (the “Reorganization”). As a result of the Reorganization, shareholders of the Predecessor Fund’s Class A and Class C Shares received Class A and Class C Shares of the Fund, respectively, and shareholders of the Predecessor Fund’s Institutional Class Shares received Class Y Shares of the Fund. In addition, as a result of the Reorganization, the Fund’s Class A and Class C Shares adopted the Predecessor Fund’s Class A and Class C Shares’ performance and accounting history, and the Fund’s Class Y Shares adopted the Predecessor Fund’s Institutional Class Shares’ performance and accounting history. Figures shown in the bar chart reflect the performance history of the Fund’s Class Y Shares (i.e., the Predecessor Fund’s Institutional Class Shares) and do not reflect sales charges. If sales charges were reflected, returns would be less than these shown. The Fund’s Class A and Class C Shares would have substantially similar returns because the shares are invested in the same portfolio of securities, and the returns would differ only to the extent that the classes do not have the same expenses. For periods prior to February 5, 2018, the performance information for the Fund’s Class I Shares reflects the performance history of the Class Y Shares (i.e., the Predecessor Fund’s Institutional Class Shares). On March 25, 2021, the Board, on behalf of the Fund, approved a proposal to close the Fund’s Class I Shares (the “Legacy Class I Shares”). Following the close of business on April 30, 2021, shareholders holding the Legacy Class I Shares had their shares automatically converted (the “Conversion”) into the Fund’s Class Y Shares (the “Legacy Class Y Shares”). Following the conversion, the Fund’s Legacy Class Y Shares were renamed “Class I Shares” (the “new Class I Shares”). As a result of the Conversion, the Fund’s new Class I Shares adopted the Legacy Class Y Shares’ performance and accounting history. Figures shown in the bar chart reflect the performance history of the Fund’s new Class I Shares (i.e., the Legacy Class Y Shares). The Fund’s Legacy Class I Shares and Legacy Class Y Shares had substantially similar returns because (i) the shares were invested in the same portfolio of securities; and (ii) the shares had the same expense structure. For periods prior to April 30, 2021, the performance information for the Fund’s new Class I Shares reflects the performance history of the Legacy Class Y Shares. The Fund’s performance (before and after taxes) is not an indication of how the Fund will perform in the future. Updated performance information is available at https://brookfield.onlineprospectus.net/Brookfield/funds/ or by calling 1-855-244-4859.
Effective September 30, 2025, the Fund changed its principal investment strategies, including the 80% Policy, and intends to invest in a manner that will allow it to be treated as a regulated investment company (rather than a “C” corporation) under the Code, beginning with the tax year that runs from October 1, 2025 through September 30, 2026. The performance information in the bar chart and table prior to September 30, 2025 reflects the Fund’s prior principal investment strategies. The Fund has selected the Alerian Midstream Energy Select Index to replace the Alerian Midstream Energy Index as one of its benchmark indices because it believes that the Alerian Midstream Energy Select Index is more appropriate for comparing the Fund’s performance in light of the changes to the Fund’s principal investment strategies. The returns of the Alerian Midstream Energy Index will be shown for a one-year transition period.
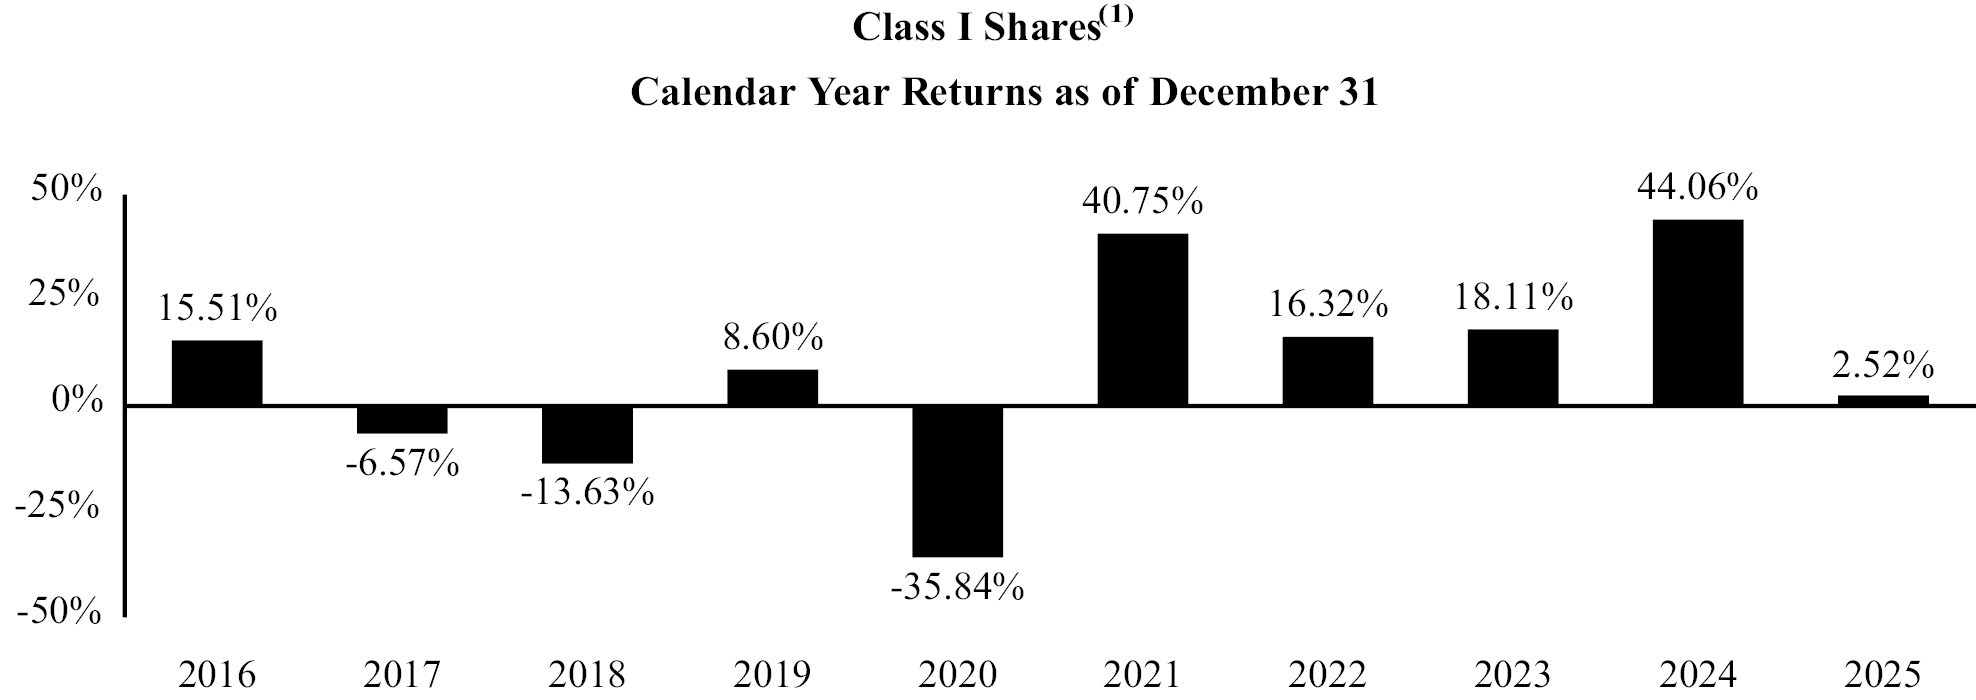
(1)The return shown in the bar chart is for the Legacy Class Y Shares. The Class A Shares and Class C Shares would have substantially similar returns because the shares are invested in the same portfolio of securities, and the returns would differ only to the extent that the classes do not have the same expenses.
During the period of time shown in the bar chart, the highest return for a calendar quarter was 40.62% (quarter ended June 30, 2020) and the lowest return for a calendar quarter was -57.71% (quarter ended March 31, 2020).
| Average Annual Total Returns for the periods ended | ||||
| One | Five | Ten | Since | |
| Class I Shares (Legacy Class Y Shares)(2)(3) | ||||
| Return Before Taxes | 2.52% | 23.35% | 6.37% | 4.98% |
| Return After Taxes on Distributions | 1.23% | 21.55% | 5.45% | 4.33% |
| Return After Taxes on Distributions and Sale of Fund Shares | 2.42% | 18.77% | 4.84% | 3.85% |
| Class A Shares | ||||
| Return Before Taxes | (2.54)% | 21.83% | 5.61% | 4.40% |
| Class C Shares | ||||
| Return Before Taxes | 0.58% | 22.06% | 5.31% | 3.93% |
| Alerian MLP Index(4) | 9.76% | 25.96% | 8.85% | 6.33% |
| Alerian Midstream Energy Select Index(5) | 6.58% | 24.26% | 12.70% | |
| Alerian Midstream Energy Index(6) | 4.98% | 23.82% | ||
| S&P 500 Index(7) | 17.88% | 14.42% | 14.82% | 14.06% |
(1)The Predecessor Fund commenced operations on December 31, 2010.
(2)Returns for Class I Shares prior to February 5, 2018 reflect the performance of the Predecessor Fund’s Institutional Class Shares.
(3)The Predecessor Fund offered Institutional Class Shares. Holders of Institutional Class Shares received Class Y Shares of the Fund in exchange for those Shares.
(4)The Alerian MLP Index, the leading gauge of energy infrastructure Master Limited Partnerships (MLPs), is a capped, float-adjusted, capitalization-weighted index, whose constituents earn the majority of their cash flow from midstream activities involving energy commodities.
(5)The Alerian Midstream Energy Select Index is a capped, float-adjusted, capitalization-weighted index composite of North American energy infrastructure companies, whose constituents are engaged in midstream activities involving energy commodities. Data for the Alerian Midstream Energy Select Index is unavailable prior to its inception date of April 1, 2013.
(6) The Alerian Midstream Energy Index is a capped, float-adjusted, capitalization-weighted index composite of North American energy infrastructure companies, whose constituents earn the majority of their cash flow from midstream activities involving energy commodities. Data for the Alerian Midstream Energy Index is unavailable prior to its inception date of June 25, 2018.
(7) The S&P 500® Index is an unmanaged weighted index of 500 large company stocks that is widely recognized as representative of the performance of the U.S. stock market.
Unless otherwise noted, all indices are Total Return indices (return includes price change + dividends/interest). Indexes are not managed and an investor cannot invest directly in an index.
After tax returns are calculated using the historical highest individual federal marginal income tax rates and do not reflect the impact of state and local taxes. Actual after-tax returns depend on your situation and may differ from those shown. After-tax returns are shown only for Class I Shares (the Legacy Class Y Shares) and after-tax returns for other classes will vary due to the differences in expenses. Furthermore, the after-tax returns shown are not relevant to those who hold their shares through tax-deferred arrangements such as 401(k) plans or individual retirement accounts (“IRAs”). In certain cases, the figures representing “Return After Taxes on Distributions and Sale of Fund Shares” may be higher than other returns for the same period. A higher after-tax return results when a capital loss occurs upon redemption and provides an annual tax deduction that benefits shareholders.