Although the Fund has been in continuous operation since October 1, 2015, the Fund has been registered under the Investment Company Act of 1940, as amended (the “1940 Act”), only since June 17, 2021. The bar chart and Average Annual Total Returns table below show the variability of the Fund’s returns over time, which is some indication of the risks of investing in the Fund. The bar chart shows the performance of Class A Shares (without load) of the Fund for each full calendar year since the Fund’s registration under the 1940 Act. The Average Annual Total Returns table shows how the Fund’s average annual returns compare with those of a broad measure of market performance and a supplemental index.
How the Fund has performed in the past (before and after taxes) is not necessarily an indication of how the Fund will perform in the future. Updated performance information is available at no cost by visiting https://www.atlas-am.com or calling 1 (855) 969-8440.
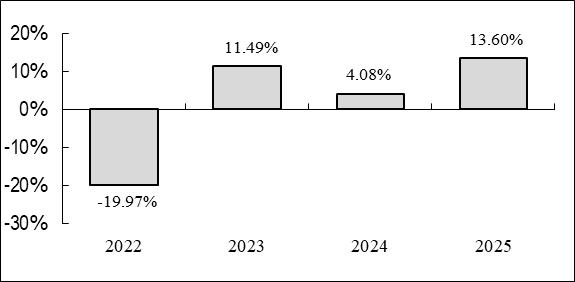
During the periods shown in the bar chart, the best performance for a quarter was 11.54% (for the quarter ended December 31, 2023). The worst performance was -9.80% (for the quarter ended June 30, 2022).
| One Year | Life of Fund* | |
| Class A Shares (with load) | ||
| Return Before Taxes | 9.62% | 0.45% |
| Return After Taxes on Distributions | 7.47% | (1.49)% |
| Return After Taxes on Distributions and Sale of Fund Shares | 5.62% | (0.56)% |
| Class C Shares | ||
| Return Before Taxes | 12.64% | 0.57% |
|
S&P 500® Total Return Index(1) (reflects no deduction for fees, expenses or taxes) |
17.88% | 8.76% |
|
Bloomberg U.S. Aggregate Bond Index(2) (reflects no deduction for fees, expenses or taxes) |
7.30% | (0.07)% |
| * | The Fund’s Class A Shares and Class C shares (the “Class C Shares”) commenced operations on June 17, 2021. |
| (1) | The S&P 500® Total Return Index is a market capitalization-weighted index of 500 widely held common stocks. Investors cannot invest directly in an index or benchmark. | |
| (2) | The Bloomberg U.S. Aggregate Bond Index is an unmanaged index comprised of U.S. investment grade, fixed rate bond market securities, including government, government agency, corporate and mortgage-backed securities. Unlike the Fund’s returns, the index does not reflect any fees or expenses. |