The Fund was reorganized on October 6, 2017, from a series of Northern Lights Fund Trust II, a Delaware statutory trust (the “Predecessor Fund”), to a series of 360 Funds, a Delaware statutory trust (the “Reorganization”). The Fund’s performance may be different than the performance of the Predecessor Fund due to, among other things, differences in principal investment strategies, fees, and expenses. In addition, effective September 28, 2018, the Fund revised its principal investment strategy, and because of this revision, the Fund’s performance may be different on and after September 28, 2018, than it was prior to that date. Effective September 28, 2018, the Fund’s Class A shares and Class I shares were re-designated as the Investor Class shares and Institutional Class shares, respectively. Effective May 29, 2020, the Fund’s Investor Class shares were converted into Institutional Class shares.
In April 2020, Crow Point Partners, LLC, the investment adviser to the Fund since its inception, transferred its management of the Fund to the Adviser. Shareholders of the Fund approved a new investment advisory agreement with the Adviser on June 12, 2020. Mr. David Cleary became the sole portfolio manager of the Fund. The bar chart below shows the Fund’s investment results during the management of the prior investment adviser for periods prior to April 2020.
The bar chart and performance table below show the variability of the Fund’s returns, which is some indication of the risks of investing in the Fund. The bar chart shows the performance of the Predecessor Fund’s Class I shares for each full calendar year since the Predecessor Fund’s inception, as well as the performance of the Fund’s Institutional Class shares after the Reorganization. The Average Annual Total Returns table shows how the Fund’s average annual returns compare with those of a broad measure of market performance. You should be aware that the Fund’s past performance (before and after taxes) may not be an indication of how the Fund will perform in the future. Updated performance information will be available at no cost by calling (877) 244-6235 and on the Adviser’s website at www.timberpointcapital.com.
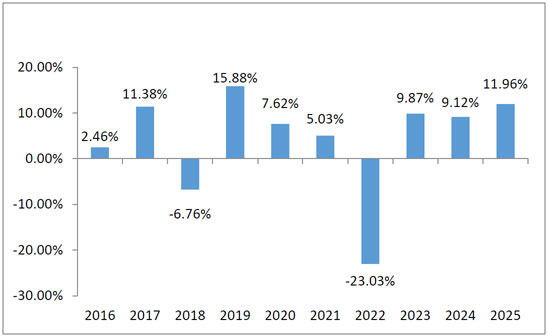
During the periods shown in the bar chart, the best performance for a quarter was 11.75% (for the quarter ended December 31, 2020). The worst performance for a quarter was (16.79)% (for the quarter ended March 31, 2020).
| One Year | Five Years | Ten Years | |
| Institutional Class Return Before Taxes | 11.96% | 1.65% | 3.71% |
| Institutional Class Return After Taxes on Distributions | 11.86% | 1.45% | 3.09% |
| Institutional Class Return After Taxes on Distributions and Sale of Fund Shares | 7.54% | 1.22% | 2.69% |
Bloomberg Barclays Global Aggregate Bond/MSCI ACWI Net Total Return USD 50/50 Index Blend (reflects no deduction for fees, expenses, or taxes) |
15.25% | 5.36% | 7.60% |
S&P 500® Total Return Index (reflects no deduction for fees, expenses, or taxes) |
17.88% | 14.42% | 14.81% |
After-tax returns are based on the highest historical individual federal marginal income tax rates and do not reflect the impact of state and local taxes; actual after-tax returns depend on an individual investor's tax situation and may differ from those shown. If you own shares of the Fund in a tax-deferred account, such as an individual retirement account or a 401(k) plan, this information is not applicable to your investment. A higher after-tax return results when a capital loss occurs upon redemption and translates into an assumed tax deduction that benefits the shareholder.
The Bloomberg Barclays Global Aggregate Bond/MSCI ACWI Net Total Return USD 50/50 Index Blend is a custom benchmark comprised of the Bloomberg Barclays Global Aggregate Bond Index (50%) and the MSCI ACWI Net Total Return Index (50%). The Bloomberg Barclays Global Aggregate Bond Index is a broad-based fixed-income index. The MSCI ACWI Net Total Return Index captures large and mid-cap representation across 23 developed markets and 24 emerging markets countries, covering approximately 85% of the global investable equity market.
The S&P 500® Total Return Index is an unmanaged market capitalization-weighted index of 500 of the largest capitalized U.S. domiciled companies. Index returns assume reinvestment of dividends. Investors may not invest in the indexes directly; unlike the Fund's returns, the indexes do not reflect any fees or expenses.
Current performance of the Fund may be lower or higher than the performance quoted above. Updated performance information may be obtained by calling (877) 244-6235.
The Fund was reorganized on October 6, 2017 from a series of Northern Lights Fund Trust II, a Delaware statutory trust (the “Predecessor Fund”), to a series of 360 Funds, a Delaware statutory trust (the “Reorganization”). While the Fund is substantially similar to the Predecessor Fund and theoretically would have invested in the same portfolio of securities, the Fund’s performance may be different than the performance of the Predecessor Fund due to, among other things, differences in fees and expenses. Effective January 28, 2019, the Fund’s single share class was re-designated as Investor Class, and a new Institutional Class shares was added. Effective May 29, 2020, the Fund’s Investor Class shares were converted to Institutional Class.
In April 2020, Crow Point Partners, LLC, the investment adviser to the Fund since its inception, transferred its management of the Fund to the Adviser. Shareholders of the Fund approved a new investment advisory agreement with the Adviser on June 12, 2020. The bar chart below shows the Fund’s investment results during the management of the prior investment adviser for periods prior to April 2020.
The bar chart and performance table below show the variability of the Predecessor Fund’s returns, which is some indication of the risks of investing in the Fund. The bar chart shows performance of the Predecessor Fund’s single share class period ended October 6, 2017, the Investor Class Shares for the period October 7, 2017 through May 29, 2020, as well as the performance of the Fund’s Institutional Class shares beginning on May 29, 2020. The performance table compares the performance of the Fund’s Institutional Class shares over time to the performance of a broad-based securities market index. You should be aware that the Fund’s past performance (before and after taxes) may not be an indication of how the Fund will perform in the future. Updated performance information will be available at no cost by calling (877) 244-6235 and on the Adviser’s website at www.timberpointcapital.com.
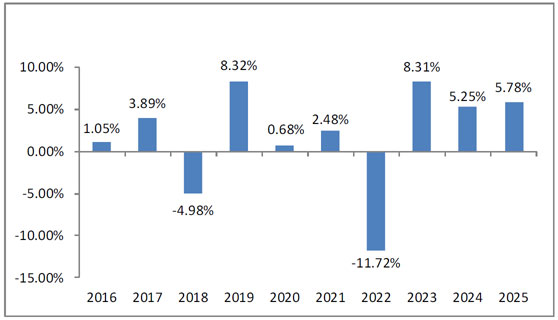
During the periods shown in the bar chart, the best performance for a quarter was 6.28% (for the quarter ended December 31, 2023). The worst performance for a quarter was (9.80)% (for the quarter ended March 31, 2020).
| One Year | Five Years | Ten Years | |
| Returns Before Taxes1 | 5.78% | 1.76% | 1.78% |
| Returns After Taxes on Distributions1 | 4.39% | 0.81% | 1.04% |
| Returns After Taxes on Distributions and Sale of Fund Shares1 | 3.65% | 0.96% | 1.06% |
Bloomberg Barclays U.S. Aggregate Bond Index (reflects no deduction for fees, expenses, or taxes) |
7.30%
|
(0.36)%
|
2.01%
|
HFRX Absolute Return Index2 (reflects no deduction for fees, expenses, or taxes) |
5.56% | 3.25% | 2.65% |
1 For the period before May 29, 2020, the performance shown is of the Predecessor Fund and the Investor Class Shares.
2 The HFRX Absolute Return Index is included because it shows how the Fund’s performance compares with the returns of an index of funds with similar investment objectives.
After-tax returns are based on the highest historical individual federal marginal income tax rates and do not reflect the impact of state and local taxes; actual after-tax returns depend on an individual investor’s tax situation and may differ from those shown. If you own shares of the Fund in a tax-deferred account, such as an individual retirement account or a 401(k) plan, this information is not applicable to your investment. A higher after-tax return results when a capital loss occurs upon redemption and translates into an assumed tax deduction that benefits the shareholder.
The Bloomberg Barclays U.S. Aggregate Bond Index measures the performance of the U.S. investment-grade bond market. The index invests in a wide spectrum of public, investment-grade, taxable, fixed-income securities in the United States – including government, corporate, and international dollar-denominated bonds, as well as mortgage-backed and asset-backed securities, all with maturities of more than one year.
The Bloomberg Barclays Global Aggregate Bond Index is a flagship measure of global investment-grade debt from twenty-four local currency markets. This multi-currency benchmark includes treasury, government-related, corporate, and securitized fixed-rate bonds from both developed and emerging markets issuers.
The HFRX Absolute Return Index is designed to be representative of the overall composition of the hedge fund universe. It is comprised of all eligible hedge fund strategies, including but not limited to convertible arbitrage, distressed securities, equity hedge, equity market neutral, event-driven, macro, merger arbitrage, and relative value arbitrage. As a component of the optimization process, the index selects constituents which characteristically exhibit lower volatilities and lower correlations to standard directional benchmarks of equity market and hedge fund industry performance. Index returns assume reinvestment of dividends. Investors may not invest in the indexes directly; unlike the Fund’s returns, the indexes do not reflect any fees or expenses.
Current performance of the Fund may be lower or higher than the performance quoted above. Updated performance information may be obtained by calling (877) 244-6235.