Capital appreciation.
This table describes the fees and expenses that you may pay if you buy, hold and sell Fund shares. You may pay other fees, such as brokerage commissions and other fees to financial intermediaries, which are not reflected in this table and examples below.
|
(expenses that you pay each year as a percentage of the value of your investment) |
Class Y Shares |
||||||
|
Management Fees |
0.70 |
% |
|||||
|
Distribution (12b-1) Fees |
None |
||||||
|
Other Expenses |
0.47 |
% |
|||||
|
Total Annual Fund Operating Expenses |
1.17 |
% |
|||||
This Example is intended to help you compare the cost of investing in the Fund with the cost of investing in other mutual funds. The Example assumes that you invest $10,000 in the Fund for the time periods indicated and then redeem or hold all of your shares at the end of those periods. The Example also assumes that your investment has a 5% return each year and that the Fund's operating expenses remain the same. The effect of the Fund's fee waivers and expense reimbursements is reflected for only the first year in the below examples.
|
1 Year |
3 Years |
5 Years |
10 Years |
||||||||||||||||
|
Emerging Markets Equity Fund — Class Y Shares |
$ |
119 |
$ |
372 |
$ |
644 |
$ |
1,420 |
|||||||||||
The Fund pays transaction costs, such as commissions, when it buys and sells securities (or "turns over" its portfolio). A higher portfolio turnover rate may indicate higher transaction costs and may result in higher taxes when Fund shares are held in a taxable account. These costs, which are not reflected in annual Fund operating expenses or in the Example, affect the Fund's performance. During the most recent fiscal year, the Fund's portfolio turnover rate was 75% of the average value of its portfolio.
Under normal circumstances, the Emerging Markets Equity Fund will invest at least 80% of its net assets (plus the amount of any borrowings for investment purposes) in equity securities of emerging market issuers. Equity securities include equity-linked securities, common stocks, preferred stock, warrants, participation notes and depositary receipts of all capitalization ranges. The Fund normally maintains investments in at least six emerging market countries, however, it may invest a substantial amount of its assets in issuers located in a
single country or a limited number of countries. Due to the size of its economy relative to other emerging market countries, it is expected that China will generally constitute a significant exposure in the Fund and may include investments in variable interest entities (VIEs). Emerging market countries are those countries that: (i) are characterized as developing or emerging by any of the World Bank, the United Nations, the International Finance Corporation, or the European Bank for Reconstruction and Development; (ii) are included in an emerging markets index by a recognized index provider; or (iii) have similar developing or emerging characteristics as countries classified as emerging market countries pursuant to sub-paragraph (i) and (ii) above, in each case determined at the time of purchase.
SEI Investments Management Corporation, the Fund's adviser (SIMC or the Adviser), directly manages a portion of the Fund's assets. With the remaining assets, the Fund uses a multi-manager approach, relying on one or more sub-advisers (each, a Sub-Adviser and collectively, the Sub-Advisers) with differing investment philosophies to manage Fund assets under the general supervision of SIMC. SIMC and one or more Sub-Advisers may apply a quantitative investment style, which generally involves a systematic or rules-based approach to selecting investments based on specific measurable factors.
The Fund may invest in swaps based on a single security or an index of securities, futures contracts, forward contracts and options to synthetically obtain exposure to securities or baskets of securities or for hedging purposes, including seeking to manage the Fund's currency exposure to foreign securities and mitigate the Fund's overall risk. Swaps may be used to obtain exposure to different foreign equity markets.
The Fund may purchase futures contracts or shares of exchange-traded funds (ETFs) to gain exposure to a particular portion of the market while awaiting an opportunity to purchase securities or other instruments directly. The Fund may also invest a portion of its assets in securities of companies located in developed foreign countries.
The bar chart and the performance table below provide some indication of the risks of investing in the Class Y Shares of the Fund by showing changes in the Fund's performance from year to year for the past ten calendar years and by showing how the Fund's average annual returns for 1, 5 and 10 years, and since the Fund's inception, compare with those of a broad measure of market performance. The performance information shown is based on full calendar years. The Fund's past performance (before and after taxes) is not necessarily an indication of how the Fund will perform in the future. For current performance information, please call 1-800-DIAL-SEI.
|
|
Best Quarter: 20.87% (06/30/2020) Worst Quarter: -25.63% (03/31/2020) |
||||||
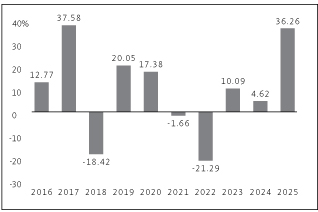
Best Quarter: 20.87% (06/30/2020)
Worst Quarter: -25.63% (03/31/2020)
This table compares the Fund's average annual total returns to those of a broad-based securities market index and an additional index with characteristics relevant to the Fund's investment strategy.
After-tax returns are calculated using the historical highest individual federal marginal income tax rates and do not reflect the impact of state and local taxes. Your actual after-tax returns will depend on your tax situation and may differ from those shown. After-tax returns shown are not relevant to investors who hold their Fund shares through tax-deferred arrangements, such as 401(k) plans or individual retirement accounts.
|
Emerging Markets Equity Fund* |
1 Year |
5 Years |
10 Years |
Since Inception (1/17/1995) |
|||||||||||||||
|
Return Before Taxes |
36.26 |
% |
3.97 |
% |
8.04 |
% |
4.92 |
% |
|||||||||||
|
Return After Taxes on Distributions |
34.78 |
% |
3.21 |
% |
7.59 |
% |
4.35 |
% |
|||||||||||
|
Return After Taxes on Distributions and Sale of Fund Shares |
22.42 |
% |
3.19 |
% |
6.68 |
% |
4.16 |
% |
|||||||||||
|
MSCI ACWI ex-USA Index (net) (reflects no deduction for fees or expenses) |
32.39 |
% |
7.91 |
% |
8.41 |
% |
6.14 |
%** |
|||||||||||
|
MSCI Emerging Markets Index Return (net) (reflects no deduction for fees or expenses) |
33.57 |
% |
4.20 |
% |
8.42 |
% |
|||||||||||||
* The Fund's Class Y Shares commenced operations on December 31, 2014. For periods prior to December 31, 2014, the performance of the Fund's Class F Shares has been used. Returns for Class Y Shares would have been substantially similar to those of Class F Shares and would have differed only to the extent that the classes do not have the same total annual fund operating expenses.
** Benchmark returns since inception do not include the return for the partial month following inception date of the Fund (1/17/1995 – 1/31/1995). Annualization calculation of the inception to date returns is based on the actual inception date (1/17/1995).
† The MSCI Emerging Markets Index Return (net) for the "Since Inception" period is not provided because returns for the MSCI Emerging Markets Index Return (net) are not available prior to 1999.