Jan. 28, 2026
The primary investment objective of the GreenFi Redwood Fund (the “Fund”) is to maximize total return, consisting of capital appreciation and current income.
This table describes the fees and expenses that you may pay if you buy, hold, and sell shares of the Fund. You may pay other fees, such as brokerage commissions and other fees to financial intermediaries, which are not reflected in the tables and example below.
| Shareholder Fees | |
| (fees paid directly from your investment) | |
| Maximum Sales Charge (Load) Imposed on Purchases (as a percentage of offering price) | 0.00% |
| Maximum Deferred Sales Charge (Load) (as a percentage of amount redeemed) | 0.00% |
| Redemption Fee (as a percentage of amount redeemed) | 0.00% |
| Annual Fund Operating Expenses (expenses that you pay each year as a percentage of the value of your investment) | |
| Management Fees | 0.50% |
| Distribution and/or Service (12b-1) Fee1 | 0.01% |
| Other Expenses | 0.79% |
| Total Annual Fund Operating Expenses | 1.30% |
1. Distribution and/or Service (12b-1) Fees are less than 0.01% due to rounding. The Fund has adopted a plan pursuant to Rule 12b-1 promulgated under the Investment Company Act of 1940, as amended, that allows the Fund to pay for distribution and support services. Although the Fund is allowed to pay annual 12b-1 expenses of 0.25% under the plan, the Board of Trustees has only authorized the Fund to pay the amount charged by the Fund’s principal underwriter and distributor and related offerings costs
The Example is intended to help you compare the cost of investing in the Fund with the cost of investing in other mutual funds. This Example assumes that you invest $10,000 in the Fund for the time period indicated and then sell or hold all of your shares at the end of those periods. The Example also assumes that your investment has a 5% return each year and that the Fund’s operating expenses remain the same (The Example reflects applicable waivers and/or reimbursements for the duration of such arrangement(s). Although your actual costs may be higher or lower, based on these assumptions your costs would be:
|
1 Year
|
3 Years
|
5 Years
|
10 Years
|
| $132 |
$412 |
$713 |
$1,568 |
|
1 Year
|
3 Years
|
5 Years
|
10 Years
|
| $132 |
$412 |
$713 |
$1,568 |
The Fund pays transaction costs, such as commissions, when it buys and sells securities (or “turns over” its portfolio). A higher portfolio turnover rate may indicate higher transaction costs and may result in higher taxes when Fund shares are held in a taxable account. These costs, which are not reflected in annual fund operating expenses or in the Example, affect the Fund’s performance. During the most recent fiscal year, the Fund’s portfolio turnover rate was 37.49% of the average value of its assets.
To achieve its investment objective, the Fund invests in, or seeks exposure to, companies that are attractive based on their fundamental valuation profile in addition to
evaluating specific sustainability factors. The Fund invests in equity securities that trade on U.S. securities markets, which may include securities of non-U.S. issuers as well as securities of U.S. issuers. The equity securities in which the
Fund invests include, but are not limited to, dividend-paying securities, common stock, preferred stock, equity securities of real estate investment trusts (“REITS”), shares of investment companies, convertible securities, warrants, and rights. The
Fund may purchase equity securities in an initial public offering (“IPO”) provided that the investment is consistent with the Fund’s investment strategy. The Fund may, but is not required to, use exchange-traded derivative instruments for risk
management purposes or as part of the Fund’s investment strategies. Generally, derivatives are financial contracts with value dependent upon, or derived from, the value of an underlying asset, reference rate, or index, and may relate to stocks,
bonds, interest rates, currencies or currency exchange rates, and related indexes. The derivatives in which the Fund may invest include futures and forward currency agreements. These derivatives may be used for risk management purposes to manage or
adjust the risk profile of the Fund. Futures on currencies and forward currency agreements may also be used to hedge against a specific currency. In addition, futures on indices may be used for investment (non-hedging) purposes to earn income; to
enhance returns; to replace more traditional direct investments; or to obtain exposure to certain markets.
UBS Asset Management (Americas) LLC (the “Sub-Adviser”) bases investment decisions upon price/value discrepancies as identified by the Sub-Adviser’s fundamental valuation
process. In selecting securities for the Fund, the Sub-Adviser focuses on, among other considerations, identifying discrepancies between a security’s fundamental value and its market price. In this context, the fundamental value of a given
security is the Sub-Adviser’s assessment of what a security is worth. The Sub-Adviser will select a security whose fundamental value it estimates to be greater than its market value at any given time. For each stock under analysis, the Sub-Adviser
bases its estimates of value upon economic, industry, and company analysis, as well as upon a company’s management team, competitive advantage and core competencies. The Sub-Adviser then compares its assessment of a security’s value against the
prevailing market prices, with the aim of constructing a portfolio of stocks across industries with attractive relative price/value characteristics.
The Sub-Adviser will employ both a positive and negative screening process in selecting securities for the Fund. The positive screening process seeks to identify securities of
companies that are fundamentally attractive and that have superior valuation characteristics. In addition, the positive screening process will also include material sustainability factors that the Sub-Adviser believes confirm the fundamental
investment case and can enhance the ability to make good investment decisions. The sustainability factors used by the Sub-Adviser in security selection are considered to be material factors that help the Sub-Adviser evaluate and compare the
performance of environmental, social, and governance (“ESG”) criteria relative to industry and/or sector. The Sub-Adviser combines these considerations with additional financial analysis to identify companies that the Sub-Adviser believes will
provide attractively valued and sustainable investment opportunities. The Sub-Adviser believes that the sustainability strategy provides the Fund with a high-quality portfolio and mitigates risk.
The Sub-Adviser also applies a negative screening process that will exclude from the Fund’s portfolio securities with more than 5% of sales in industries such as alcohol,
tobacco, defense, nuclear, GMO (Genetically Modified Organisms), water bottles, gambling and pornography, and will entirely exclude all firearms issuers and companies within the energy sector as defined by MSCI and its Global Industry
Classification Standard (GICS).
From time to time, the Fund may take temporary defensive positions that are inconsistent with the Fund’s principal investment strategies, in attempting to respond to adverse
market, economic, political, or other conditions. For example, the Fund may hold all or a portion of its assets in money market instruments (high quality income securities with maturities of less than one year), securities of money market funds or
U.S. Government repurchase agreements. The Fund may also invest in such investments at any time to maintain liquidity or pending selection of investments in accordance with its policies. As a result, the Fund may not achieve its investment
objective.
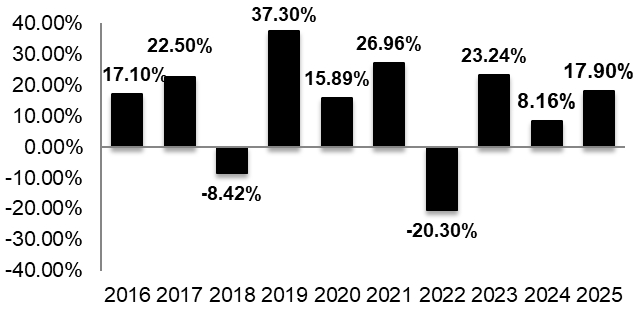
The following bar chart shows how the Fund’s investment results have varied from year to year and the following table shows how the Fund’s average annual total returns compared to that of a broad measure of market performance since the Fund’s inception. This information provides some indication of the risks of investing in the Fund. All figures assume distributions were reinvested. Prior to October 10, 2024, the Fund had a different investment adviser. From the inception of the Fund until October 10, 2024, the Fund paid no management fees to the previous investment adviser. During this period investors in the Fund were required to be clients of the previous investment adviser. Advisory clients had the option to pay the previous investment adviser a fee in the amount they believed to be fair ranging from 0% to 2.00% of the value of the account, directly to the previous investment adviser. On October 10, 2024, the Fund entered into an agreement with the current investment adviser, under which the Fund pays the current investment adviser a management fee of 0.50%. Investors of the Fund are no longer required to be clients of the investment adviser, nor do they pay advisory fees directly to the investment adviser. Returns prior to October 10, 2024 are presented below assuming investors paid the maximum advisory fee of 2.00% and assuming investors paid 0%. Keep in mind that future performance may differ from past performance. Also, shareholder reports containing financial and investment return information will be available to shareholders semi-annually. Updated performance information is available at no cost by calling (800) 683-8529 (toll free) or by visiting funds.greenfi.com.
Calendar Year Returns
(with 0% assumed management fee reduction for periods prior to October 10, 2024)
(with 0% assumed management fee reduction for periods prior to October 10, 2024)
Calendar Year Returns
(with 2.00% assumed management fee reduction for periods prior to October 10, 2024)
| Highest and Lowest Quarterly Returns (assumed with 0% management fee reduction for periods prior to October 10, 2024) | ||
| Highest return for a quarter | 29.65% | Quarter ended June 30, 2020 |
| Lowest return for a quarter | -29.73% | Quarter ended March 31, 2020 |
| Highest and Lowest Quarterly Returns (with assumed 2% management fee reduction for periods prior to October 10, 2024) | ||
| Highest return for a quarter | 27.65% | Quarter ended June 30, 2020 |
| Lowest return for a quarter | -31.73% | Quarter ended March 31, 2020 |
| Average Annual Total Returns Periods Ended December 31, 2025 | One Year | Five Year | Ten Year | Since Inception* |
| GreenFi Redwood Fund – Without maximum contribution reduction (with assumed 0.00% management fee reduction for periods prior to October 10, 2024) | ||||
| Returns Before taxes | 17.90% | 9.71% | 12.75% | 12.12% |
| Returns after taxes on distributions | 14.73% | 7.89% | 10.75% | 10.16% |
| Returns after taxes on distributions and sale of shares | 12.81% | 7.29% | 9.79% | 9.26% |
| GreenFi Redwood Fund – With maximum assumed contribution reduction (with assumed 2.00% management fee reduction for periods prior to October 10, 2024.) | ||||
| Returns Before taxes | 17.90% | 8.49% | 11.60% | 10.99% |
| Returns after taxes on distributions | 14.73% | 6.67% | 9.60% | 9.03% |
| Returns after taxes on distributions and sale of shares | 12.81% | 6.07% | 8.64% | 8.13% |
| S&P 500 Total Return Index (reflects no deductions for fees and expenses) | 17.88% | 14.42% | 14.81% | 14.59% |
* The Fund commenced operations on November 16, 2015.
After-tax returns are calculated using the historical highest individual federal marginal income tax rates and do not reflect the impact of state and local taxes. Actual after-tax returns depend on an investor’s tax situation and may differ from those shown and are not applicable to investors who hold Fund shares through tax-deferred arrangements such as a 401(k) plan or an individual retirement account (IRA).