Performance Management - GreenFi Redwood Fund
Jan. 28, 2026
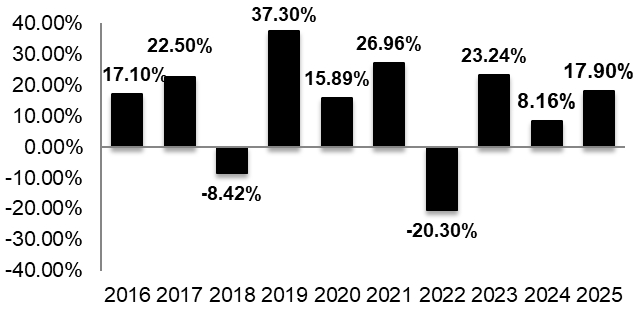
The following bar chart shows how the Fund’s investment results have varied from year to year and the following table shows how the Fund’s average annual total returns compared to that of a broad measure of market performance since the Fund’s inception. This information provides some indication of the risks of investing in the Fund. All figures assume distributions were reinvested. Prior to October 10, 2024, the Fund had a different investment adviser. From the inception of the Fund until October 10, 2024, the Fund paid no management fees to the previous investment adviser. During this period investors in the Fund were required to be clients of the previous investment adviser. Advisory clients had the option to pay the previous investment adviser a fee in the amount they believed to be fair ranging from 0% to 2.00% of the value of the account, directly to the previous investment adviser. On October 10, 2024, the Fund entered into an agreement with the current investment adviser, under which the Fund pays the current investment adviser a management fee of 0.50%. Investors of the Fund are no longer required to be clients of the investment adviser, nor do they pay advisory fees directly to the investment adviser. Returns prior to October 10, 2024 are presented below assuming investors paid the maximum advisory fee of 2.00% and assuming investors paid 0%. Keep in mind that future performance may differ from past performance. Also, shareholder reports containing financial and investment return information will be available to shareholders semi-annually. Updated performance information is available at no cost by calling (800) 683-8529 (toll free) or by visiting funds.greenfi.com.
Calendar Year Returns
(with 0% assumed management fee reduction for periods prior to October 10, 2024)
(with 0% assumed management fee reduction for periods prior to October 10, 2024)
Calendar Year Returns
(with 2.00% assumed management fee reduction for periods prior to October 10, 2024)
| Highest and Lowest Quarterly Returns (assumed with 0% management fee reduction for periods prior to October 10, 2024) | ||
| Highest return for a quarter | 29.65% | Quarter ended June 30, 2020 |
| Lowest return for a quarter | -29.73% | Quarter ended March 31, 2020 |
| Highest and Lowest Quarterly Returns (with assumed 2% management fee reduction for periods prior to October 10, 2024) | ||
| Highest return for a quarter | 27.65% | Quarter ended June 30, 2020 |
| Lowest return for a quarter | -31.73% | Quarter ended March 31, 2020 |
| Average Annual Total Returns Periods Ended December 31, 2025 | One Year | Five Year | Ten Year | Since Inception* |
| GreenFi Redwood Fund – Without maximum contribution reduction (with assumed 0.00% management fee reduction for periods prior to October 10, 2024) | ||||
| Returns Before taxes | 17.90% | 9.71% | 12.75% | 12.12% |
| Returns after taxes on distributions | 14.73% | 7.89% | 10.75% | 10.16% |
| Returns after taxes on distributions and sale of shares | 12.81% | 7.29% | 9.79% | 9.26% |
| GreenFi Redwood Fund – With maximum assumed contribution reduction (with assumed 2.00% management fee reduction for periods prior to October 10, 2024.) | ||||
| Returns Before taxes | 17.90% | 8.49% | 11.60% | 10.99% |
| Returns after taxes on distributions | 14.73% | 6.67% | 9.60% | 9.03% |
| Returns after taxes on distributions and sale of shares | 12.81% | 6.07% | 8.64% | 8.13% |
| S&P 500 Total Return Index (reflects no deductions for fees and expenses) | 17.88% | 14.42% | 14.81% | 14.59% |
* The Fund commenced operations on November 16, 2015.
After-tax returns are calculated using the historical highest individual federal marginal income tax rates and do not reflect the impact of state and local taxes. Actual after-tax returns depend on an investor’s tax situation and may differ from those shown and are not applicable to investors who hold Fund shares through tax-deferred arrangements such as a 401(k) plan or an individual retirement account (IRA).