The following bar chart and table provide some indication of the potential risks of investing in the Fund. The Fund’s past performance (before and after taxes) is not necessarily an indication of how the Fund will perform in the future. Updated performance information is available at destracapital.com or by calling 844-9DESTRA (933-7872). Performance information in the bar chart and table below for the time period prior to October 1, 2016, is that of Destra Flaherty & Crumrine Preferred and Income Fund, a series of Destra Investment Trust II (the “Predecessor Fund”). The Fund is a successor to the Predecessor Fund pursuant to a reorganization that took place on September 30, 2016. The Predecessor Fund was managed by an affiliate of the Adviser and had the same investment objective and investment strategy.
The bar chart below shows the Fund’s performance for Class A shares. The performance of the other share classes will differ due to their different expense structures. The bar chart and highest/lowest quarterly returns that follow do not reflect sales charges; if these charges were reflected, the returns would be less than those shown.
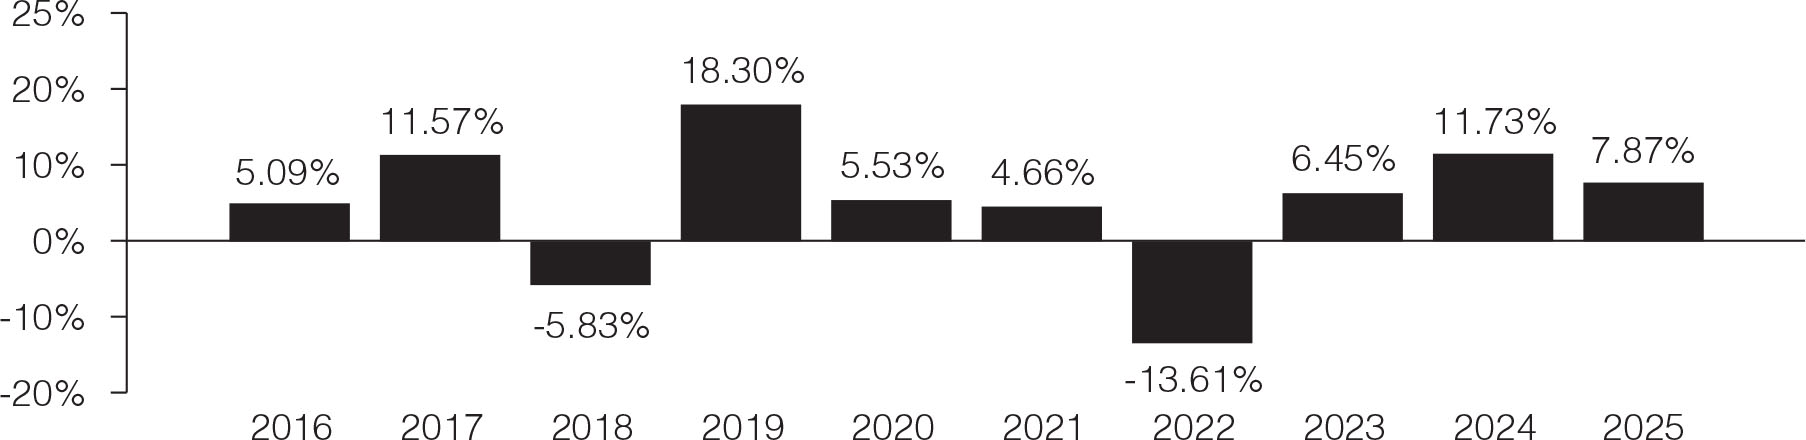
The Fund’s highest and lowest quarterly returns were 11.25% and -15.04%, respectively, for the quarters ended June 30, 2020 and March 31, 2020.
The table below shows the variability of the Fund’s average annual returns and how they compare over the time periods indicated to those of a broad-based market index that seeks to track the performance of the preferred securities market.
All after-tax returns are calculated using the historical highest individual federal marginal income tax rates and do not reflect the impact of state and local taxes. Your own actual after-tax returns will depend on your specific tax situation and may differ from what is shown here. Under certain circumstances, the addition of the tax benefits from capital losses resulting from redemptions may cause the returns after taxes on distributions and sale of Fund shares to be greater than the returns after taxes on distributions or even the returns before taxes. After-tax returns are not relevant to investors who hold Fund shares in tax-deferred accounts such as individual retirement accounts (“IRAs”) or employer-sponsored retirement plans. If the Fund incurs a loss, which generates a tax benefit, the return after taxes on distributions and sale of Fund shares may exceed the Fund’s other return figures.
If you own an IRA or other retirement plan, you must indicate on your redemption request whether the Fund should withhold federal income tax. Unless you elect in your redemption request that you do not want to have federal tax withheld, the redemption will be subject to withholding.
Both the bar chart above and the table below assume that all distributions have been reinvested. Performance reflects fee waivers, if any, in effect during the periods presented. If any such waivers were not in place, returns would be reduced. The returns that follow reflect sales charges.
| Average Annual Total Returns for the Periods Ended December 31, 2025 |
|||||||||
| 1 Year | 5 Years | 10 Years | |||||||
| Class A (returns before taxes) | 3.02% | 2.07% | 4.33% | ||||||
| Class A (returns after taxes on distributions) | 0.91% | 0.28% | 2.38% | ||||||
| Class A (returns after taxes on distributions and sale of Fund shares)(1) | 1.75% | 0.28% | 2.38% | ||||||
| Class C (returns before taxes) | 6.12% | 2.24% | 4.02% | ||||||
| Class C (returns after taxes on distributions) | 4.26% | 1.13% | 2.91% | ||||||
| Class C (returns after taxes on distributions and sale of Fund shares)(1) | 3.59% | 1.48% | 2.91% | ||||||
| Class I (returns before taxes) | 8.18% | 3.27% | 5.07% | ||||||
| Class I (returns after taxes on distributions) | 5.83% | 1.86% | 3.66% | ||||||
| Class I (returns after taxes on distributions and sale of Fund shares)(1) | 4.79% | 2.20% | 3.67% | ||||||
| ICE BofA Merrill Lynch 8% Constrained Core West Preferred & Jr. Subordinated Securities Index (reflects no deduction for fees, expenses or taxes)(2) | 6.11% | 2.53% | 4.71% | ||||||
| (1) | In some cases, the Return After Taxes on Distributions and Sale of Fund Shares may exceed the Return After Taxes on Distributions due to an assumed benefit from any losses on a sale of Fund Shares at the end of the measurement period. |
| (2) | ICE BofAML 8% Constrained Core West Preferred & Jr Subordinated Securities Index tracks the performance of US dollar denominated high grade and high-yield preferred securities and deeply subordinated corporate debt issued in the US domestic market. Qualifying securities must be rated at least B3, based on an average of Moody’s, S&P and Fitch and have a country of risk of either the U.S. or a Western European country. Qualifying preferred securities must be issued as public securities or through a Rule 144A filing, must have a fixed or floating dividend schedule and must have a minimum amount outstanding of $100 million. |