The performance information below provides some indication of the risks of investing in the Fund. The bar chart shows changes in the performance of the Institutional Shares from year to year.
The table shows the average annual returns of the Investor Shares, Institutional Shares (formerly, Select Shares), R6 Shares (formerly, Institutional Shares), A Shares and C Shares for the periods of 1 Year, 5 Years, 10 Years, and Since Inception, as applicable, compared to a broad-based market index.
Visit www.fullerthalerfunds.com for more current performance information.
Past performance, before and after taxes, is not necessarily predictive of future performance.
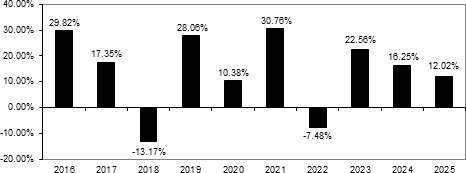
| (1) | The Fund is the accounting successor to a series of Allianz Funds Multi-Strategy Trust, which commenced operations on September 8, 2011, and for which the Adviser served as the sole sub-adviser (the “Predecessor Fund”). In a transaction that was consummated on October 23, 2015 (the “Reorganization”), the Fund acquired the assets and liabilities of: the A, C, and D Classes of the Predecessor Fund, which became the Investor Shares of the Fund; the Class P Shares of the Predecessor Fund, which became the Institutional Shares of the Fund; and the Institutional Shares of the Predecessor Fund, which became the R6 Shares of the Fund. Accordingly, the performance results shown above in the bar chart and the average annual total returns table for periods prior to October 23, 2015 represent the performance of the Predecessor Fund and its classes. The Fund’s performance has not been restated to reflect any differences in expenses paid by the Predecessor Fund and those paid by the Fund. In addition, the Fund’s performance during the periods reflected in the bar chart and table may have been different from that of the Predecessor Fund due to some differences in their principal investment strategies. |
| Highest
and Lowest Quarter Returns (for periods shown in the bar chart) | ||
| Highest | 10/1/2020 – 12/31/2020 | 22.79% |
| Lowest | 1/1/2020 – 3/31/2020 | (26.07)% |
| 1 Year | 5 Years | 10 Years | Since Inception(2) | |||||
| Small-Cap Equity Fund | ||||||||
| Institutional Shares - Before Taxes | 12.02% | 14.06% | 13.70% | 14.29% | ||||
| Institutional Shares - After Taxes on Distributions(3) | 11.88% | 13.28% | 13.26% | 12.78% | ||||
| Institutional Shares - After Tax on Distributions and Sale of Fund Shares(3) | 7.22% | 11.21% | 11.48% | 11.54% | ||||
| Investor Shares - Before Taxes | 11.69% | 13.73% | 13.40% | 14.02% | ||||
| R6 Shares - Before Taxes | 12.14% | 14.19% | 13.83% | 14.43% | ||||
| A Shares - Before Taxes | 5.21% | 12.38% | N/A | 14.32% | ||||
| C Shares - Before Taxes | 11.04% | 13.05% | N/A | 14.61% | ||||
| Russell
1000® Equal Weight Index (reflects no deduction for fees, expenses or taxes)(4) |
11.13% | 8.23% | 10.39% | 11.45% | ||||
| Russell
2000® Index (reflects no deduction for fees, expenses or taxes)(5) |
12.81% | 6.09% | 9.62% | 10.82% |
| (2) | The inception date of the Fund’s Institutional Shares, Investor Shares and R6 Shares is September 8, 2011. The Fund’s A Shares and C Shares commenced operations on December 19, 2018. Returns for A Shares reflect the maximum sales charge. |
| (3) | After-tax returns are estimated using the highest historical individual federal marginal income tax rates and do not reflect the impact of state and local taxes. Actual after-tax returns depend on an investor’s tax situation and may differ from those shown. After-tax returns are not relevant to investors who hold Fund shares through tax-deferred arrangements such as 401(k) plans or individual retirement accounts. After-tax returns are for Institutional Shares only. The Return After Taxes on Distributions and Sale of Fund Shares for a period may be greater than the Return After Taxes on Distributions for the same period if there was a loss realized on the sale of Fund shares. The benefit of the tax loss (to the extent it can be used to offset other gains) may result in a higher return. After-tax returns for other share classes will vary. |
| (4) | The Fund does not intend to deliver similar risk characteristics to the Russell 1000® Equal Weight Index which is a benchmark only for regulatory purposes. The Russell 1000® Equal Weight Index methodology equally weights each industry within the index and then equally weights the companies within each industry. The Russell 1000® Equal Weight Index is re-weighted on a quarterly basis. The Russell 1000® Equal Weight Index is representative of a broader domestic equity market and range of securities than is found in the Fund’s portfolio. Individuals cannot invest directly in an Index; however, an individual can invest in exchange-traded funds or other investment vehicles that attempt to track the performance of a benchmark index. The inception date used for the Russell 1000® Equal Weight Index is September 8, 2011, the inception date of the Fund’s Institutional Shares. |
| (5) | The Russell 2000® Index is a widely recognized unmanaged index of equity securities and is representative of a broader domestic equity market and range of securities than is found in the Fund’s portfolio. The Russell 2000® Index measures the performance of the small cap segment of the US equity universe and is a subset of the Russell 3000® Index. Individuals cannot invest directly in an Index; however, an individual can invest in exchange-traded funds or other investment vehicles that attempt to track the performance of a benchmark index. The inception date used for the Russell 2000® Index is September 8, 2011, the inception date of the Fund’s Institutional Shares. |
The performance information below provides some indication of the risks of investing in the Fund. The bar chart shows changes in the performance of the Institutional Shares from year to year.
The table shows the average annual returns of the Investor Shares, Institutional Shares, R6 Shares, A Shares and C Shares for the periods of 1 Year, 5 Years and Since Inception compared to a broad-based market index, as applicable.
Visit www.fullerthalerfunds.com for more current performance information.
Past performance, before and after taxes, is not necessarily predictive of future performance.
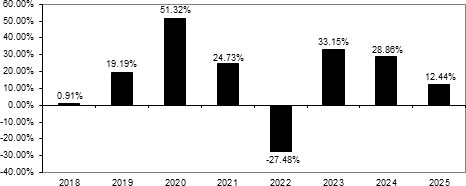
| Highest
and Lowest Quarter Returns (for periods shown in the bar chart) | ||
| Highest | 4/1/2020 – 6/30/2020 | 39.49% |
| Lowest | 10/1/2018 – 12/31/2018 | (25.88)% |
| 1 Year | 5 Years | Since Inception(1) | ||||
| Small-Cap Growth Fund | ||||||
| Institutional Shares - Before Taxes | 12.44% | 11.78% | 15.33% | |||
| Institutional Shares - After Taxes on Distributions(2) | 12.44% | 10.59% | 14.56% | |||
| Institutional Shares - After Tax on Distributions and Sale of Fund Shares(2) | 7.37% | 8.82% | 12.40% | |||
| Investor Shares - Before Taxes | 12.10% | 11.47% | 15.01% | |||
| R6 Shares - Before Taxes | 12.57% | 11.89% | 15.43% | |||
| A Shares - Before Taxes | 5.63% | 10.10% | 16.61% | |||
| C Shares - Before Taxes | 11.50% | 10.86% | 17.02% | |||
| Russell
1000® Equal Weight Index (reflects no deduction for fees, expenses or taxes)(3) |
11.13% | 8.23% | 8.84% | |||
| Russell
2000® Growth Index (reflects no deduction for fees, expenses or taxes)(4) |
13.01% | 3.18% | 7.79% |
| (1) | The inception date of the Fund’s Institutional Shares, Investor Shares and R6 Shares is December 21, 2017. The Fund’s Class A Shares and Class C Shares commenced operations on December 19, 2018. Returns for A Shares reflect the maximum sales charge. |
| (2) | After-tax returns are estimated using the highest historical individual federal marginal income tax rates and do not reflect the impact of state and local taxes. Actual after-tax returns depend on an investor’s tax situation and may differ from those shown. After-tax returns are not relevant to investors who hold Fund shares through tax-deferred arrangements such as 401(k) plans or individual retirement accounts. After-tax returns are for Institutional Shares only. The Return After Taxes on Distributions and Sale of Fund Shares for a period may be greater than the Return After Taxes on Distributions for the same period if there was a loss realized on the sale of Fund shares. The benefit of the tax loss (to the extent it can be used to offset other gains) may result in a higher return. After-tax returns for other share classes will vary. |
| (3) | The Fund does not intend to deliver similar risk characteristics to the Russell 1000® Equal Weight Index which is a benchmark only for regulatory purposes. The Russell 1000® Equal Weight Index methodology equally weights each industry within the index and then equally weights the companies within each industry. The Russell 1000® Equal Weight Index is re-weighted on a quarterly basis. The Russell 1000® Equal Weight Index is representative of a broader domestic equity market and range of securities than is found in the Fund’s portfolio. Individuals cannot invest directly in an Index; however, an individual can invest in exchange-traded funds or other investment vehicles that attempt to track the performance of a benchmark index. The inception date used for the Russell 1000® Equal Weight Index is December 21, 2017, the inception date of the Fund’s Institutional Shares. |
| (4) | The Russell 2000® Growth Index is a widely recognized unmanaged index of equity securities and is representative of a broader domestic equity market and range of securities than is found in the Fund’s portfolio. The Russell 2000® Growth Index measures the performance of those Russell 2000® companies with higher price/book ratios and higher forecasted growth values. Individuals cannot invest directly in an index; however, an individual can invest in exchange traded funds or other investment vehicles that attempt to track the performance of a benchmark index. The inception date used for the Russell 2000® Growth Index is December 21, 2017, the inception date of the Fund’s Institutional Shares. |
The performance information below provides some indication of the risks of investing in the Fund. The bar chart shows changes in the performance of the Institutional Shares from year to year.
The table shows the average annual returns of the Investor Shares, Institutional Shares, R6 Shares, A Shares and C Shares for the periods of 1 Year, 5 Years and Since Inception compared to a broad-based market index, as applicable.
Visit www.fullerthalerfunds.com for more current performance information.
Past performance, before and after taxes, is not necessarily predictive of future performance.
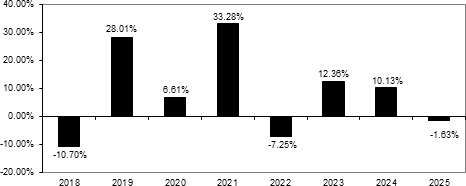
| Highest
and Lowest Quarter Returns (for periods shown in the bar chart) | ||
| Highest | 10/1/2020 – 12/31/2020 | 25.93% |
| Lowest | 1/1/2020 – 3/31/2020 | (32.20)% |
| 1 Year | 5 Years | Since Inception(1) | ||||
| Mid-Cap Value Fund | ||||||
| Institutional Shares - Before Taxes | (1.63)% | 8.52% | 7.83% | |||
| Institutional Shares - After Taxes on Distributions(2) | (2.11)% | 8.03% | 7.46% | |||
| Institutional Shares - After Tax on Distributions and Sale of Fund Shares(2) | (0.68)% | 6.66% | 6.24% | |||
| Investor Shares - Before Taxes | (1.99)% | 8.19% | 7.52% | |||
| R6 Shares - Before Taxes | (1.56)% | 8.62% | 7.93% | |||
| A Shares - Before Taxes(1) | (7.65)% | N/A | 2.40% | |||
| C Shares - Before Taxes(1) | (2.52)% | N/A | 3.46% | |||
| Russell
1000® Equal Weight Index (reflects no deduction for fees, expenses or taxes)(3) |
11.13% | 8.23% | 8.84% | |||
| Russell
Midcap® Value Index (reflects no deduction for fees, expenses or taxes)(4) |
11.05% | 9.83% | 8.14% |
| (1) | The inception date of Fund’s Institutional Shares, Investor Shares and R6 Shares is December 21, 2017. The Fund’s Class A Shares and Class C Shares commenced operations on March 10, 2022. Returns for A Shares reflect the maximum sales charge. |
| (2) | After-tax returns are estimated using the highest historical individual federal marginal income tax rates and do not reflect the impact of state and local taxes. Actual after-tax returns depend on an investor’s tax situation and may differ from those shown. After-tax returns are not relevant to investors who hold Fund shares through tax-deferred arrangements such as 401(k) plans or individual retirement accounts. After-tax returns are for Institutional Shares only. The Return After Taxes on Distributions and Sale of Fund Shares for a period may be greater than the Return After Taxes on Distributions for the same period if there was a loss realized on the sale of Fund shares. The benefit of the tax loss (to the extent it can be used to offset other gains) may result in a higher return. After-tax returns for other share classes will vary. |
| (3) | The Fund does not intend to deliver similar risk characteristics to the Russell 1000® Equal Weight Index which is a benchmark only for regulatory purposes. The Russell 1000® Equal Weight Index methodology equally weights each industry within the index and then equally weights the companies within each industry. The Russell 1000® Equal Weight Index is re-weighted on a quarterly basis. The Russell 1000® Equal Weight Index is representative of a broader domestic equity market and range of securities than is found in the Fund’s portfolio. Individuals cannot invest directly in an Index; however, an individual can invest in exchange-traded funds or other investment vehicles that attempt to track the performance of a benchmark index. The inception date used for the Russell 1000® Equal Weight Index is December 21, 2017, the inception date of the Fund’s Institutional Shares. |
| (4) | The Russell Midcap® Value Index is a widely recognized unmanaged index of equity securities and is representative of a broader domestic equity market and range of securities than is found in the Fund’s portfolio. The Russell Midcap® Value Index measures the performance of those Russell Midcap® companies with lower price/book ratios and lower forecasted growth values. Individuals cannot invest directly in an index; however, an individual can invest in exchange traded funds or other investment vehicles that attempt to track the performance of a benchmark index. The inception date used for the Russell MidCap® Value Index is December 21, 2017, the inception date of the Fund’s Institutional Shares. |
The performance information below provides some indication of the risks of investing in the Fund. The bar chart shows changes in the performance of the Institutional Shares from year to year.
The table shows the average annual returns of the Institutional Shares, R6 Shares, A Shares and C Shares for the periods of 1 Year and Since Inception, as applicable, compared to a broad-based market index. The Fund’s Investor Shares have not yet commenced operations and are not yet available for purchase. Performance information for Investor Shares will be included when the respective share class has been operational for a full calendar year. The Fund’s Investor Shares would have substantially similar annual returns to those classes presented herein because the shares are invested in the same portfolio of securities and the annual returns would differ only to the extent that the classes do not have the same expenses.
Visit www.fullerthalerfunds.com for more current performance information.
Past performance, before and after taxes, is not necessarily predictive of future performance.
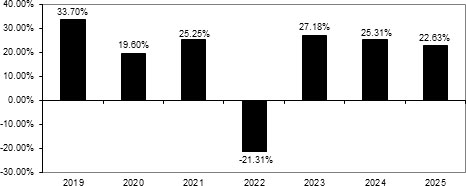
| Highest
and Lowest Quarter Returns (for periods shown in the bar chart) | ||
| Highest | 4/1/2020 – 6/30/2020 | 23.91% |
| Lowest | 1/1/2020 – 3/31/2020 | (25.15)% |
| 1 Year | 5 Years | Since Inception(1) | ||||
| Unconstrained Equity Fund | ||||||
| Institutional Shares - Before Taxes | 22.63% | 14.01% | 17.89% | |||
| Institutional Shares - After Taxes on Distributions(2) | 22.62% | 13.99% | 17.83% | |||
| Institutional Shares - After Tax on Distributions and Sale of Fund Shares(2) | 13.41% | 11.27% | 14.91% | |||
| Investor Shares - Before Taxes(1) | N/A | N/A | N/A | |||
| R6 Shares - Before Taxes | 22.74% | 14.07% | 17.97% | |||
| A Shares - Before Taxes(1) | 15.40% | N/A | 10.02% | |||
| C Shares - Before Taxes(1) | 22.20% | N/A | 11.07% | |||
| Russell
3000® Index (reflects no deduction for fees, expenses or taxes)(3) |
17.15% | 13.15% | 16.88% | |||
| Russell
Midcap® Index (reflects no deduction for fees, expenses or taxes)(4) |
10.60% | 8.67% | 12.98% |
| (1) | The inception date of Fund’s Institutional Shares and R6 Shares is December 26, 2018. The inception date of the Fund’s A Shares and C Shares is May 27, 2021. Returns for A Shares reflect the maximum sales charge. The Fund’s Investor Shares have not yet commenced operations and are not yet available for purchase. The Fund’s Investor Shares will be offered for sale at a later date. Performance for Investor Shares will be included when the share class has been operational for a full calendar year. |
| (2) | After-tax returns are estimated using the highest historical individual federal marginal income tax rates and do not reflect the impact of state and local taxes. Actual after-tax returns depend on an investor’s tax situation and may differ from those shown. After-tax returns are not relevant to investors who hold Fund shares through tax-deferred arrangements such as 401(k) plans or individual retirement accounts. After-tax returns are for Institutional Shares only. The Return After Taxes on Distributions and Sale of Fund Shares for a period may be greater than the Return After Taxes on Distributions for the same period if there was a loss realized on the sale of Fund shares. The benefit of the tax loss (to the extent it can be used to offset other gains) may result in a higher return. After-tax returns for other share classes will vary. |
| (3) | The Russell 3000® Index is a widely recognized unmanaged index of equity securities and is representative of a broader domestic equity market and range of securities than is found in the Fund’s portfolio. The Russell 3000® Index represents the performance of the 3000 largest U.S. publicly traded companies as measured by market capitalization. Individuals cannot invest directly in an index; however, an individual can invest in exchange traded funds or other investment vehicles that attempt to track the performance of a benchmark index. The inception date used for the Russell 3000® Index is December 26, 2018, the inception date of the Fund’s Institutional Shares. |
| (4) | The Russell Midcap® Index is a widely recognized unmanaged index of equity securities and is representative of a broader domestic equity market and range of securities than is found in the Fund’s portfolio. The Russell Midcap® Index measures the performance of the mid-cap segment of the US equity universe. It is a subset of the Russell 1000® Index and includes approximately 800 of the smallest securities based on a combination of their market cap and current index membership. The Russell Midcap® Index represents approximately 27% of the total market capitalization of the Russell 1000® companies, as of the most recent constitution. The Russell Midcap® Index is constructed to provide a comprehensive and unbiased barometer for the mid-cap segment. The index is completely reconstituted annually to ensure larger stocks do not distort the performance characteristics of the true mid-cap opportunity set. Individuals cannot invest directly in an index; however, an individual can invest in exchange traded funds or other investment vehicles that attempt to track the performance of a benchmark index. The inception date used for the Russell Midcap® Index is December 26, 2018, the inception date of the Fund’s Institutional Shares. |
The performance information below provides some indication of the risks of investing in the Fund. The bar chart shows changes in the performance of the Institutional Shares from year to year.
The table shows the average annual returns of the Institutional Shares and A Shares for the periods of 1 Year, 5 Years and Since Inception compared to a broad-based market index, as applicable. The Fund’s C Shares and R6 Shares commenced operations on October 7, 2024. The Fund’s Investor Shares have not yet commenced operations and are not yet available for purchase. Performance information for Investor Shares will be included when the share class has been operational for a full calendar year. The Fund’s Investor Shares would have substantially similar annual returns to those classes presented herein because the shares are invested in the same portfolio of securities and the annual returns would differ only to the extent that the classes do not have the same expenses.
Visit www.fullerthalerfunds.com for more current performance information.
Past performance, before and after taxes, is not necessarily predictive of future performance.
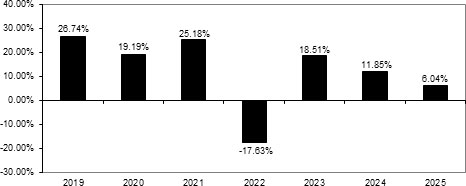
| Highest
and Lowest Quarter Returns (for periods shown in the bar chart) | ||
| Highest | 10/1/2020 – 12/31/2020 | 28.69% |
| Lowest | 1/1/2020 – 3/31/2020 | (31.13)% |
| 1 Year | 5 Years | Since Inception(1) | ||||
| Small-Mid Core Equity Fund | ||||||
| Institutional Shares - Before Taxes | 6.04% | 7.71% | 12.25% | |||
| Institutional Shares - After Taxes on Distributions(2) | 5.88% | 7.21% | 11.75% | |||
| Institutional Shares - After Tax on Distributions and Sale of Fund Shares(2) | 3.69% | 5.96% | 9.85% | |||
| Investor Shares - Before Taxes(1) | N/A | N/A | N/A | |||
| R6 Shares - Before Taxes(1) | 6.18% | N/A | 3.48% | |||
| A Shares - Before Taxes(1) | (0.44)% | N/A | 4.55% | |||
| C Shares - Before Taxes(1) | (0.92)% | N/A | (2.35)% | |||
| Russell
1000® Equal Weight Index (reflects no deduction for fees, expenses or taxes)(3) |
11.13% | 8.23% | 11.82% | |||
| Russell
2500® Index (reflects no deduction for fees, expenses or taxes)(4) |
11.91% | 7.26% | 11.98% |
| (1) | The inception date of Fund’s Institutional Shares is December 26, 2018. The Fund’s A Shares commenced operations on March 10, 2022. Returns for A Shares reflect the maximum sales charge. The Fund’s C Shares and R6 Shares commenced operations on October 7, 2024. The Fund’s Investor Shares have not yet commenced operations, are not yet available for purchase, and will be offered for sale at a later date. Performance for Investor Shares will be included when the share class has been operational for a full calendar year. |
| (2) | After-tax returns are estimated using the highest historical individual federal marginal income tax rates and do not reflect the impact of state and local taxes. Actual after-tax returns depend on an investor’s tax situation and may differ from those shown. After-tax returns are not relevant to investors who hold Fund shares through tax-deferred arrangements such as 401(k) plans or individual retirement accounts. After-tax returns are for Institutional Shares only. The Return After Taxes on Distributions and Sale of Fund Shares for a period may be greater than the Return After Taxes on Distributions for the same period if there was a loss realized on the sale of Fund shares. The benefit of the tax loss (to the extent it can be used to offset other gains) may result in a higher return. |
| (3) | The Fund does not intend to deliver similar risk characteristics to the Russell 1000® Equal Weight Index which is a benchmark only for regulatory purposes. The Russell 1000® Equal Weight Index methodology equally weights each industry within the index and then equally weights the companies within each industry. The Russell 1000® Equal Weight Index is re-weighted on a quarterly basis. The Russell 1000® Equal Weight Index is representative of a broader domestic equity market and range of securities than is found in the Fund’s portfolio. Individuals cannot invest directly in an Index; however, an individual can invest in exchange-traded funds or other investment vehicles that attempt to track the performance of a benchmark index. The inception date used for the Russell 1000® Equal Weight Index is December 26, 2018, the inception date of the Fund’s Institutional Shares. |
| (4) | The Russell 2500™ Index is a widely recognized unmanaged index of equity securities and is representative of a broader domestic equity market and range of securities than is found in the Fund’s portfolio. The Russell 2500™ Index measures the performance of those Russell 2500™ companies with lower price/book ratios and lower forecasted growth values. Individuals cannot invest directly in an index; however, an individual can invest in exchange traded funds or other investment vehicles that attempt to track the performance of a benchmark index. The inception date used for the Russell 2500™ Index is December 26, 2018, the inception date of the Fund’s Institutional Shares. |
The performance information below provides some indication of the risks of investing in the Fund. The bar chart shows changes in the performance of the Institutional Shares from year to year.
The table shows the average annual returns of the Institutional Shares for the periods of 1 Year, 5 Years and Since Inception compared to a broad-based market index. The Fund’s A Shares, C Shares, Investor Shares and R6 Shares have not yet commenced operations and are not yet available for purchase. Performance information for A Shares, C Shares, Investor Shares and R6 Shares will be included when the respective share class has been operational for a full calendar year. The Fund’s A Shares, C Shares, Investor Shares and R6 Shares would have substantially similar annual returns to those classes presented herein because the shares are invested in the same portfolio of securities and the annual returns would differ only to the extent that the classes do not have the same expenses.
Visit www.fullerthalerfunds.com for more current performance information.
Past performance, before and after taxes, is not necessarily predictive of future performance.
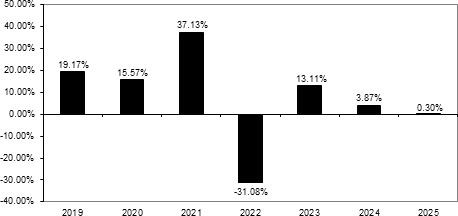
| Highest
and Lowest Quarter Returns (for periods shown in the bar chart) | ||
| Highest | 10/1/2020 – 12/31/2020 | 47.99% |
| Lowest | 1/1/2020 – 3/31/2020 | (44.78)% |
| 1 Year | 5 Years | Since Inception(1) | ||||
| Micro-Cap Equity Fund | ||||||
| Institutional Shares - Before Taxes | 0.30% | 2.18% | 6.36% | |||
| Institutional Shares - After Taxes on Distributions(2) | 0.30% | 1.71% | 5.71% | |||
| Institutional Shares - After Tax on Distributions and Sale of Fund Shares(2) | 0.18% | 1.65% | 4.87% | |||
| Investor Shares - Before Taxes(1) | N/A | N/A | N/A | |||
| R6 Shares - Before Taxes(1) | N/A | N/A | N/A | |||
| A Shares - Before Taxes(1) | N/A | N/A | N/A | |||
| C Shares - Before Taxes(1) | N/A | N/A | N/A | |||
| Russell
1000® Equal Weight Index (reflects no deduction for fees, expenses or taxes)(3) |
11.13% | 8.23% | 11.74% | |||
| Russell
Microcap® Index (reflects no deduction for fees, expenses or taxes)(4) |
22.99% | 7.33% | 11.36% |
| (1) | The inception date of Fund’s Institutional Shares is December 28, 2018. The Fund’s Class A Shares, Class C Shares, Investor Shares and R6 Shares have not yet commenced operations and are not yet available for purchase. The Fund’s A Shares, Class C Shares, Investor Shares and R6 Shares will be offered for sale at a later date. Performance for A Shares, C Shares, Investor Shares and R6 Shares will be included when the respective share class has been operational for a full calendar year. |
| (2) | After-tax returns are estimated using the highest historical individual federal marginal income tax rates and do not reflect the impact of state and local taxes. Actual after-tax returns depend on an investor’s tax situation and may differ from those shown. After-tax returns are not relevant to investors who hold Fund shares through tax-deferred arrangements such as 401(k) plans or individual retirement accounts. After-tax returns are for Institutional Shares only. The Return After Taxes on Distributions and Sale of Fund Shares for a period may be greater than the Return After Taxes on Distributions for the same period if there was a loss realized on the sale of Fund shares. The benefit of the tax loss (to the extent it can be used to offset other gains) may result in a higher return. After-tax returns for other share classes will vary. |
| (3) | The Fund does not intend to deliver similar risk characteristics to the Russell 1000® Equal Weight Index which is a benchmark only for regulatory purposes. The Russell 1000® Equal Weight Index methodology equally weights each industry within the index and then equally weights the companies within each industry. The Russell 1000® Equal Weight Index is re-weighted on a quarterly basis. The Russell 1000® Equal Weight Index is representative of a broader domestic equity market and range of securities than is found in the Fund’s portfolio. Individuals cannot invest directly in an Index; however, an individual can invest in exchange-traded funds or other investment vehicles that attempt to track the performance of a benchmark index. The inception date used for the Russell 1000® Equal Weight Index is December 28, 2018, the inception date of the Fund’s Institutional Shares. |
| (4) | The Russell Microcap® Index is a widely recognized unmanaged index of equity securities and is representative of a broader domestic equity market and range of securities than is found in the Fund’s portfolio. The Russell Microcap® Index measures the performance of the microcap segment of the U.S. equity market. The Russell Microcap® Index stocks make up less than 3% of the U.S. equity market (by market cap) and consist of the smallest 1,000 securities in the small cap Russell 2000® Index, plus the next 1,000 smallest eligible securities by market cap. Individuals cannot invest directly in an index; however, an individual can invest in exchange traded funds or other investment vehicles that attempt to track the performance of a benchmark index. The inception date used for the Russell Microcap® Index is December 28, 2018, the inception date of the Fund’s Institutional Shares. |
The performance information below provides some indication of the risks of investing in the Fund. The bar chart shows changes in the performance of the Institutional Shares from year to year.
The table shows the average annual returns of the Institutional Shares for the periods of 1 Year, 5 Years and Since Inception compared to a broad-based market index, as applicable. The Fund’s A Shares, C Shares, and R6 Shares have not yet commenced operations and are not yet available for purchase. Performance information for A Shares, C Shares, and R6 Shares will be included when the respective share class has been operational for a full calendar year. The Fund’s A Shares, C Shares, and R6 Shares would have substantially similar annual returns to the Institutional Share class presented herein because the shares are invested in the same portfolio of securities and the annual returns would differ only to the extent that the classes do not have the same expenses.
Visit www.fullerthalerfunds.com for more current performance information.
Past performance, before and after taxes, is not necessarily predictive of future performance.
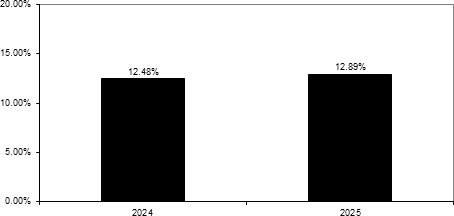
| Highest
and Lowest Quarter Returns (for periods shown in the bar chart) | ||
| Highest | 1/1/2024 – 3/31/2024 | 11.45% |
| Lowest | 4/1/2024 – 6/30/2024 | (5.28)% |
| 1 Year | Since Inception(1) | |||
| Mid-Cap Equity Fund | ||||
| Institutional Shares - Before Taxes | 12.89% | 16.78% | ||
| Institutional Shares - After Taxes on Distributions(2) | 12.80% | 16.67% | ||
| Institutional Shares - After Tax on Distributions and Sale of Fund Shares(2) | 7.69% | 13.05% | ||
| R6 Shares - Before Taxes(1) | N/A | N/A | ||
| A Shares - Before Taxes(1) | N/A | N/A | ||
| C Shares - Before Taxes(1) | N/A | N/A | ||
| Russell
1000® Equal Weight Index (reflects no deduction for fees, expenses or taxes)(3) |
11.13% | 16.17% | ||
| Russell
Midcap® Index (reflects no deduction for fees, expenses or taxes)(4) |
10.60% | 18.24% |
| (1) | The inception date of Fund’s Institutional Shares is October 2, 2023. The Fund’s Class A Shares, Class C Shares, and R6 Shares have not yet commenced operations and are not yet available for purchase. The Fund’s A Shares, Class C Shares, and R6 Shares will be offered for sale at a later date. Performance for A Shares, C Shares, and R6 Shares will be included when the respective share class has been operational for a full calendar year. |
| (2) | After-tax returns are estimated using the highest historical individual federal marginal income tax rates and do not reflect the impact of state and local taxes. Actual after-tax returns depend on an investor’s tax situation and may differ from those shown. After-tax returns are not relevant to investors who hold Fund shares through tax-deferred arrangements such as 401(k) plans or individual retirement accounts. After-tax returns are for Institutional Shares only. The Return After Taxes on Distributions and Sale of Fund Shares for a period may be greater than the Return After Taxes on Distributions for the same period if there was a loss realized on the sale of Fund shares. The benefit of the tax loss (to the extent it can be used to offset other gains) may result in a higher return. After-tax returns for other share classes will vary. |
| (3) | The Fund does not intend to deliver similar risk characteristics to the Russell 1000® Equal Weight Index which is a benchmark only for regulatory purposes. The Russell 1000® Equal Weight Index methodology equally weights each industry within the index and then equally weights the companies within each industry. The Russell 1000® Equal Weight Index is re-weighted on a quarterly basis. The Russell 1000® Equal Weight Index is representative of a broader domestic equity market and range of securities than is found in the Fund’s portfolio. Individuals cannot invest directly in an Index; however, an individual can invest in exchange-traded funds or other investment vehicles that attempt to track the performance of a benchmark index. The inception date used for the Russell 1000® Equal Weight Index is October 2, 2023, the inception date of the Fund’s Institutional Shares. |
| (4) | The Russell Midcap® Index is a widely recognized unmanaged index of equity securities that measures the performance of the mid-cap segment of the US equity universe. The Russell Midcap® Index is a subset of the Russell 1000® Index. It includes approximately 800 of the smallest securities based on a combination of their market cap and current index membership. The Russell Midcap® Index represents approximately 27% of the total market capitalization of the Russell 1000® companies, as of the most recent constitution. The Russell Midcap® Index is constructed to provide a comprehensive and unbiased barometer for the mid-cap segment. The index is completely reconstituted annually to ensure larger stocks do not distort the performance characteristics of the true mid-cap opportunity set. The Russell Midcap® Index is representative of a broader domestic equity market and range of securities than is found in the Fund’s portfolio. Individuals cannot invest directly in an index; however, an individual can invest in exchange traded funds or other investment vehicles that attempt to track the performance of a benchmark index. The inception date used for the Russell MidCap® Index is October 2, 2023, the inception date of the Fund’s Institutional Shares. |