The bar chart and the performance table below provide some indication of the risks of investing in the Fund by showing changes in the Fund's performance from year to year for the past ten calendar years and by showing how the Fund's average annual returns for 1, 5 and 10 years, and since the Fund's inception, compare with those of a broad measure of market performance. The Fund's past performance (before and after taxes) is not necessarily an indication of how the Fund will perform in the future. For current performance information, please call 1-800-DIAL-SEI.
|
|
Best Quarter: 20.21% (06/30/2020) Worst Quarter: -24.00% (03/31/2020) |
||||||
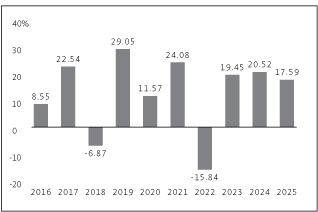
| Best Quarter: 20.21% (06/30/2020) Worst Quarter: -24.00% (03/31/2020) |
This table compares the Fund's average annual total returns to those of a broad-based securities market index and an additional index with characteristics relevant to the Fund's investment strategy.
After-tax returns are calculated using the historical highest individual federal marginal income tax rates and do not reflect the impact of state and local taxes. Your actual after-tax returns will depend on your tax situation and may differ from those shown. After-tax returns shown are not relevant to investors who hold their Fund shares through tax-deferred arrangements, such as 401(k) plans or individual retirement accounts. In some cases, the Fund's return after taxes may exceed the Fund's return before taxes due to an assumed tax benefit from any losses on a sale of Fund shares at the end of the measurement period.
|
Large Cap Fund — Class F |
1 Year |
5 Years |
10 Years |
Since Inception (9/30/2009) |
|||||||||||||||
|
Return Before Taxes |
17.59 |
% |
12.07 |
% |
12.17 |
% |
12.13 |
% |
|||||||||||
|
Return After Taxes on Distributions |
12.61 |
% |
8.72 |
% |
9.61 |
% |
9.77 |
% |
|||||||||||
|
Return After Taxes on Distributions and Sale of Fund Shares |
13.80 |
% |
9.06 |
% |
9.45 |
% |
9.61 |
% |
|||||||||||
|
S&P 500 Index Return (reflects no deduction for fees, expenses or taxes) |
17.88 |
% |
14.42 |
% |
14.82 |
% |
14.29 |
% |
|||||||||||
|
Russell 1000 Index Return (reflects no deduction for fees, expenses or taxes) |
17.37 |
% |
13.59 |
% |
14.59 |
% |
14.18 |
% |
|||||||||||
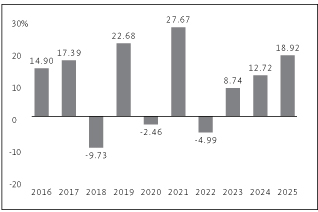
The bar chart and the performance table below provide some indication of the risks of investing in the Fund by showing changes in the Fund's performance from year to year for the past ten calendar years and by showing how the Fund's average annual returns for 1, 5 and 10 years, and since the Fund's inception, compare with those of a broad measure of market performance. The Fund's past performance (before and after taxes) is not necessarily an indication of how the Fund will perform in the future. For current performance information, please call 1-800-DIAL-SEI.
|
|
Best Quarter: 16.67% (12/31/2020) Worst Quarter: -29.98% (03/31/2020) |
||||||
|
|
Best Quarter: 16.67% (12/31/2020) Worst Quarter: -29.98% (03/31/2020) |
||||||
This table compares the Fund's average annual total returns to those of a broad-based securities market index and an additional index with characteristics relevant to the Fund's investment strategy.
After-tax returns are calculated using the historical highest individual federal marginal income tax rates and do not reflect the impact of state and local taxes. Your actual after-tax returns will depend on your tax situation and may differ from those shown. After-tax returns shown are not relevant to investors who hold their Fund shares through tax-deferred arrangements, such as 401(k) plans or individual retirement accounts.
|
Large Cap Value Fund — Class F |
1 Year |
5 Years |
10 Years |
Since Inception* (10/3/1994) |
|||||||||||||||
|
Return Before Taxes |
18.92 |
% |
12.07 |
% |
9.92 |
% |
10.69 |
% |
|||||||||||
|
Return After Taxes on Distributions |
15.20 |
% |
9.78 |
% |
8.20 |
% |
7.57 |
% |
|||||||||||
|
Return After Taxes on Distributions and Sale of Fund Shares |
13.79 |
% |
9.31 |
% |
7.77 |
% |
7.35 |
% |
|||||||||||
|
S&P 500 Index Return (reflects no deduction for fees, expenses or taxes) |
17.88 |
% |
14.42 |
% |
14.82 |
% |
11.05 |
% |
|||||||||||
|
Russell 1000 Value Index Return (reflects no deduction for fees, expenses or taxes) |
15.91 |
% |
11.33 |
% |
10.53 |
% |
9.89 |
% |
|||||||||||
* The Fund's actual inception date is April 20, 1987. Between April 20, 1987 and October 3, 1994, the Fund was advised by a different investment adviser. Accordingly, performance shown in the chart above is from October 3, 1994.
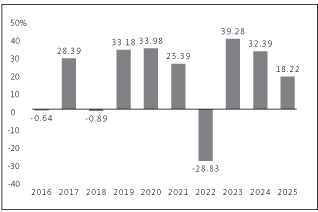
The bar chart and the performance table below provide some indication of the risks of investing in the Fund by showing changes in the Fund's performance from year to year for the past ten calendar years and by showing how the Fund's average annual returns for 1, 5 and 10 years, and since the Fund's inception, compare with those of a broad measure of market performance. The Fund's past performance (before and after taxes) is not necessarily an indication of how the Fund will perform in the future. For current performance information, please call 1-800-DIAL-SEI.
|
|
Best Quarter: 27.17% (06/30/2020) Worst Quarter: -20.21% (06/30/2022) |
||||||
|
|
Best Quarter: 27.17% (06/30/2020) Worst Quarter: -20.21% (06/30/2022) |
||||||
This table compares the Fund's average annual total returns to those of a broad-based securities market index and an additional index with characteristics relevant to the Fund's investment strategy.
After-tax returns are calculated using the historical highest individual federal marginal income tax rates and do not reflect the impact of state and local taxes. Your actual after-tax returns will depend on your tax situation and may differ from those shown. After-tax returns shown are not relevant to investors who hold their Fund shares through tax-deferred arrangements, such as 401(k) plans or individual retirement accounts. In some cases, the Fund's return after taxes may exceed the Fund's return before taxes due to an assumed tax benefit from any losses on a sale of Fund shares at the end of the measurement period.
|
Large Cap Growth Fund — Class F |
1 Year |
5 Years |
10 Years |
Since Inception (12/20/1994) |
|||||||||||||||
|
Return Before Taxes |
18.22 |
% |
14.24 |
% |
15.94 |
% |
10.51 |
% |
|||||||||||
|
Return After Taxes on Distributions |
12.31 |
% |
10.15 |
% |
12.88 |
% |
9.07 |
% |
|||||||||||
|
Return After Taxes on Distributions and Sale of Fund Shares |
14.00 |
% |
10.51 |
% |
12.53 |
% |
8.84 |
% |
|||||||||||
|
S&P 500 Index Return (reflects no deduction for fees, expenses or taxes) |
17.88 |
% |
14.42 |
% |
14.82 |
% |
11.14 |
% |
|||||||||||
|
Russell 1000 Growth Index Return (reflects no deduction for fees, expenses or taxes) |
18.56 |
% |
15.32 |
% |
18.13 |
% |
11.80 |
% |
|||||||||||
The bar chart and the performance table below provide some indication of the risks of investing in the Fund by showing changes in the Fund's performance from year to year for the past seven calendar years and by showing how the Fund's average annual returns for 1 and 5 years and since the Fund's inception, compare
with those of a broad measure of market performance. The Fund's past performance (before and after taxes) is not necessarily an indication of how the Fund will perform in the future. For current performance information, please call 1-800-DIAL-SEI.
|
|
Best Quarter: 21.66% (06/30/2020) Worst Quarter: -20.21% (03/31/2020) |
||||||
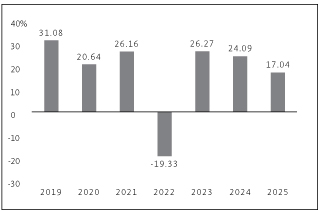
| Best Quarter: 21.66% (06/30/2020) Worst Quarter: -20.21% (03/31/2020) |
This table compares the Fund's average annual total returns to those of a broad-based securities market index and an additional index with characteristics relevant to the Fund's investment strategy.
After-tax returns are calculated using the historical highest individual federal marginal income tax rates and do not reflect the impact of state and local taxes. Your actual after-tax returns will depend on your tax situation and may differ from those shown. After-tax returns shown are not relevant to investors who hold their Fund shares through tax-deferred arrangements, such as 401(k) plans or individual retirement accounts.
|
Large Cap Index Fund |
1 Year |
5 Years |
Since Inception (1/31/2018) |
||||||||||||
|
Return Before Taxes |
17.04 |
% |
13.29 |
% |
13.12 |
% |
|||||||||
|
Return After Taxes on Distributions |
15.50 |
% |
12.53 |
% |
12.46 |
% |
|||||||||
|
Return After Taxes on Distributions and Sale of Fund Shares |
11.07 |
% |
10.55 |
% |
10.68 |
% |
|||||||||
|
S&P 500 Index Return (reflects no deduction for fees, expenses or taxes) |
17.88 |
% |
14.42 |
% |
13.68 |
% |
|||||||||
|
Russell 1000 Index Return (reflects no deduction for fees, expenses or taxes) |
17.37 |
% |
13.59 |
% |
13.43 |
% |
|||||||||
The bar chart and the performance table below provide some indication of the risks of investing in the Fund by showing changes in the Fund's performance from year to year for the past ten calendar years and by showing how the Fund's average annual returns for 1, 5 and 10 years, and since the Fund's inception, compare with those of a broad measure of market performance. The Fund's past performance (before and after taxes) is not necessarily an indication of how the Fund will perform in the future. For current performance information, please call 1-800-DIAL-SEI.
|
|
Best Quarter: 18.45% (06/30/2020) Worst Quarter: -21.71% (03/31/2020) |
||||||
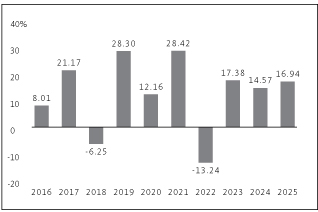
|
| Best Quarter: 18.45% (06/30/2020) Worst Quarter: -21.71% (03/31/2020) | ||||||
This table compares the Fund's average annual total returns to those of a broad-based securities market index and an additional index with characteristics relevant to the Fund's investment strategy.
After-tax returns are calculated using the historical highest individual federal marginal income tax rates and do not reflect the impact of state and local taxes. Your actual after-tax returns will depend on your tax situation and may differ from those shown. After-tax returns shown are not relevant to investors who hold their Fund shares through tax-deferred arrangements, such as 401(k) plans or individual retirement accounts.
|
Tax-Managed Large Cap Fund — Class F |
1 Year |
5 Years |
10 Years |
Since Inception (3/5/1998) |
|||||||||||||||
|
Return Before Taxes |
16.94 |
% |
11.87 |
% |
11.96 |
% |
7.39 |
% |
|||||||||||
|
Return After Taxes on Distributions |
16.50 |
% |
10.50 |
% |
10.86 |
% |
6.88 |
% |
|||||||||||
|
Return After Taxes on Distributions and Sale of Fund Shares |
10.32 |
% |
9.22 |
% |
9.67 |
% |
6.28 |
% |
|||||||||||
|
S&P 500 Index Return (reflects no deduction for fees, expenses or taxes) |
17.88 |
% |
14.42 |
% |
14.82 |
% |
8.98 |
% |
|||||||||||
|
Russell 1000 Index Return (reflects no deduction for fees, expenses or taxes) |
17.37 |
% |
13.59 |
% |
14.59 |
% |
9.06 |
% |
|||||||||||
The bar chart and the performance table below provide some indication of the risks of investing in the Fund by showing changes in the Fund's performance from year to year for the past ten calendar years and by showing how the Fund's average annual returns for 1, 5 and 10 years, and since the Fund's inception, compare with those of a broad measure of market performance. The Fund's past performance (before and after taxes) is not necessarily an indication of how the Fund will perform in the future. For current performance information, please call 1-800-DIAL-SEI.
|
|
Best Quarter: 20.47% (06/30/2020) Worst Quarter: -19.67% (03/31/2020) |
||||||
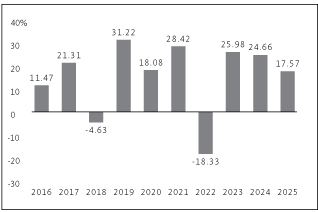
|
|
Best Quarter: 20.47% (06/30/2020) Worst Quarter: -19.67% (03/31/2020) |
|||||
After-tax returns are calculated using the historical highest individual federal marginal income tax rates and do not reflect the impact of state and local taxes. Your actual after-tax returns will depend on your tax situation and may differ from those shown. After-tax returns shown are not relevant to investors who hold their Fund shares through tax-deferred arrangements, such as 401(k) plans or individual retirement accounts.
|
S&P 500 Index Fund — Class F* |
1 Year |
5 Years |
10 Years |
Since Inception (2/28/1996) |
|||||||||||||||
|
Return Before Taxes |
17.57 |
% |
14.13 |
% |
14.49 |
% |
9.83 |
% |
|||||||||||
|
Return After Taxes on Distributions |
15.19 |
% |
11.89 |
% |
12.77 |
% |
8.81 |
% |
|||||||||||
|
Return After Taxes on Distributions and Sale of Fund Shares |
11.99 |
% |
10.90 |
% |
11.71 |
% |
8.34 |
% |
|||||||||||
|
S&P 500 Index Return (reflects no deduction for fees, expenses or taxes) |
17.88 |
% |
14.42 |
% |
14.82 |
% |
10.22 |
% |
|||||||||||
* The Fund is the successor to SEI Index Funds' S&P 500 Index Fund (the Predecessor Fund). The Fund commenced operations on September 17, 2007. Accordingly, for periods prior to September 17, 2007, performance information is based on the performance of the Predecessor Fund's Class A Shares.
The bar chart and the performance table below provide some indication of the risks of investing in the Fund by showing changes in the Fund's performance from year to year for the past ten calendar years and by showing how the Fund's average annual returns for 1, 5 and 10 years, and since the Fund's inception, compare with those of a broad measure of market performance. The Fund's past performance (before and after taxes)
is not necessarily an indication of how the Fund will perform in the future. For current performance information, please call 1-800-DIAL-SEI.
|
|
Best Quarter: 28.44% (12/31/2020) Worst Quarter: -31.27% (03/31/2020) |
||||||
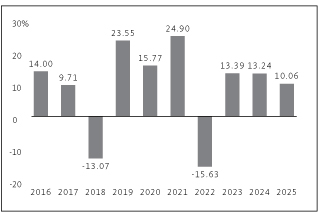
Best Quarter: 28.44% (12/31/2020)
Worst Quarter: -31.27% (03/31/2020)
This table compares the Fund's average annual total returns to those of a broad-based securities market index and an additional index with characteristics relevant to the Fund's investment strategy.
After-tax returns are calculated using the historical highest individual federal marginal income tax rates and do not reflect the impact of state and local taxes. Your actual after-tax returns will depend on your tax situation and may differ from those shown. After-tax returns shown are not relevant to investors who hold their Fund shares through tax-deferred arrangements, such as 401(k) plans or individual retirement accounts. In some cases, the Fund's return after taxes may exceed the Fund's return before taxes due to an assumed tax benefit from any losses on a sale of Fund shares at the end of the measurement period.
|
Small Cap Fund — Class F |
1 Year |
5 Years |
10 Years |
Since Inception (9/30/2009) |
|||||||||||||||
|
Return Before Taxes |
10.06 |
% |
8.29 |
% |
8.76 |
% |
9.57 |
% |
|||||||||||
|
Return After Taxes on Distributions |
7.52 |
% |
5.57 |
% |
6.77 |
% |
7.49 |
% |
|||||||||||
|
Return After Taxes on Distributions and Sale of Fund Shares |
7.79 |
% |
5.94 |
% |
6.57 |
% |
7.32 |
% |
|||||||||||
|
S&P 500 Index Return (reflects no deduction for fees, expenses or taxes) |
17.88 |
% |
14.42 |
% |
14.82 |
% |
14.29 |
% |
|||||||||||
|
Russell 2000 Index Return (reflects no deduction for fees, expenses or taxes) |
12.81 |
% |
6.09 |
% |
9.62 |
% |
10.57 |
% |
|||||||||||
The bar chart and the performance table below provide some indication of the risks of investing in the Fund by showing changes in the Fund's performance from year to year for the past ten calendar years and by showing how the Fund's average annual returns for 1, 5 and 10 years, and since the Fund's inception, compare with those of a broad measure of market performance. The Fund's past performance (before and after taxes) is not necessarily an indication of how the Fund will perform in the future. For current performance information, please call 1-800-DIAL-SEI.
|
|
Best Quarter: 30.47% (12/31/2020) Worst Quarter: -39.12% (03/31/2020) |
||||||
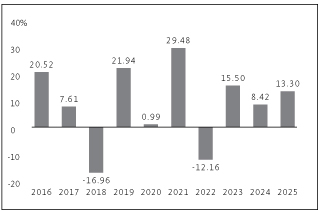
| Best Quarter: 30.47% (12/31/2020) Worst Quarter: -39.12% (03/31/2020) |
This table compares the Fund's average annual total returns to those of a broad-based securities market index and an additional index with characteristics relevant to the Fund's investment strategy.
After-tax returns are calculated using the historical highest individual federal marginal income tax rates and do not reflect the impact of state and local taxes. Your actual after-tax returns will depend on your tax situation and may differ from those shown. After-tax returns shown are not relevant to investors who hold their Fund shares through tax-deferred arrangements, such as 401(k) plans or individual retirement accounts.
|
Small Cap Value Fund — Class F |
1 Year |
5 Years |
10 Years |
Since Inception (12/20/1994) |
|||||||||||||||
|
Return Before Taxes |
13.30 |
% |
10.04 |
% |
7.90 |
% |
9.21 |
% |
|||||||||||
|
Return After Taxes on Distributions |
10.96 |
% |
7.78 |
% |
6.19 |
% |
7.58 |
% |
|||||||||||
|
Return After Taxes on Distributions and Sale of Fund Shares |
9.44 |
% |
7.68 |
% |
6.06 |
% |
7.41 |
% |
|||||||||||
|
S&P 500 Index Return (reflects no deduction for fees, expenses or taxes) |
17.88 |
% |
14.42 |
% |
14.82 |
% |
11.14 |
% |
|||||||||||
|
Russell 2000 Value Index Return (reflects no deduction for fees, expenses or taxes) |
12.59 |
% |
8.88 |
% |
9.27 |
% |
9.86 |
% |
|||||||||||
The bar chart and the performance table below provide some indication of the risks of investing in the Fund by showing changes in the Fund's performance from year to year for the past ten calendar years and by showing how the Fund's average annual returns for 1, 5 and 10 years, and since the Fund's inception, compare
with those of a broad measure of market performance. The Fund's past performance (before and after taxes) is not necessarily an indication of how the Fund will perform in the future. For current performance information, please call 1-800-DIAL-SEI.
|
|
Best Quarter: 29.99% (06/30/2020) Worst Quarter: -31.51% (03/31/2020) |
||||||
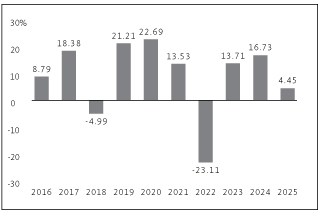
| Best Quarter: 29.99% (06/30/2020) Worst Quarter: -31.51% (03/31/2020) |
This table compares the Fund's average annual total returns to those of a broad-based securities market index and an additional index with characteristics relevant to the Fund's investment strategy.
After-tax returns are calculated using the historical highest individual federal marginal income tax rates and do not reflect the impact of state and local taxes. Your actual after-tax returns will depend on your tax situation and may differ from those shown. After-tax returns shown are not relevant to investors who hold their Fund shares through tax-deferred arrangements, such as 401(k) plans or individual retirement accounts. In some cases, the Fund's return after taxes may exceed the Fund's return before taxes due to an assumed tax benefit from any losses on a sale of Fund shares at the end of the measurement period.
|
Small Cap Growth Fund — Class F |
1 Year |
5 Years |
10 Years |
Since Inception (4/20/1992) |
|||||||||||||||
|
Return Before Taxes |
4.45 |
% |
3.89 |
% |
8.22 |
% |
8.74 |
% |
|||||||||||
|
Return After Taxes on Distributions |
2.10 |
% |
1.67 |
% |
6.56 |
% |
7.34 |
% |
|||||||||||
|
Return After Taxes on Distributions and Sale of Fund Shares |
4.32 |
% |
2.58 |
% |
6.28 |
% |
7.05 |
% |
|||||||||||
|
S&P 500 Index Return (reflects no deduction for fees, expenses or taxes) |
17.88 |
% |
14.42 |
% |
14.82 |
% |
10.83 |
% |
|||||||||||
|
Russell 2000 Growth Index Return (reflects no deduction for fees, expenses or taxes) |
13.01 |
% |
3.18 |
% |
9.57 |
% |
8.07 |
% |
|||||||||||
The bar chart and the performance table below provide some indication of the risks of investing in the Fund by showing changes in the Fund's performance from year to year for the past ten calendar years and by showing how the Fund's average annual returns for 1, 5 and 10 years, and since the Fund's inception, compare with those of a broad measure of market performance. The Fund's past performance (before and after taxes) is not necessarily an indication of how the Fund will perform in the future. For current performance information, please call 1-800-DIAL-SEI.
|
|
Best Quarter: 24.52% (12/31/2020) Worst Quarter: -30.74% (03/31/2020) |
||||||
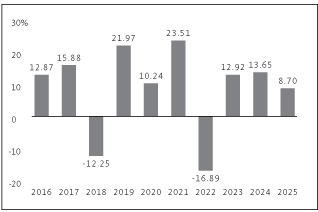
| Best Quarter: 24.52% (12/31/2020) Worst Quarter: -30.74% (03/31/2020) |
This table compares the Fund's average annual total returns to those of a broad-based securities market index and an additional index with characteristics relevant to the Fund's investment strategy.
After-tax returns are calculated using the historical highest individual federal marginal income tax rates and do not reflect the impact of state and local taxes. Your actual after-tax returns will depend on your tax situation and may differ from those shown. After-tax returns shown are not relevant to investors who hold their Fund shares through tax-deferred arrangements, such as 401(k) plans or individual retirement accounts. In some cases, the Fund's return after taxes may exceed the Fund's return before taxes due to an assumed tax benefit from any losses on a sale of Fund shares at the end of the measurement period.
|
Tax-Managed Small/Mid Cap Fund — Class F |
1 Year |
5 Years |
10 Years |
Since Inception (10/31/2000) |
|||||||||||||||
|
Return Before Taxes |
8.70 |
% |
7.44 |
% |
8.25 |
% |
7.07 |
% |
|||||||||||
|
Return After Taxes on Distributions |
7.60 |
% |
5.66 |
% |
7.01 |
% |
6.33 |
% |
|||||||||||
|
Return After Taxes on Distributions and Sale of Fund Shares |
5.93 |
% |
5.73 |
% |
6.56 |
% |
5.93 |
% |
|||||||||||
|
S&P 500 Index Return (reflects no deduction for fees, expenses or taxes) |
17.88 |
% |
14.42 |
% |
14.82 |
% |
8.43 |
% |
|||||||||||
|
Russell 2500 Index Return (reflects no deduction for fees, expenses or taxes) |
11.91 |
% |
7.26 |
% |
10.40 |
% |
8.89 |
% |
|||||||||||
The bar chart and the performance table below provide some indication of the risks of investing in the Fund by showing changes in the Fund's performance from year to year for the past ten calendar years and by showing how the Fund's average annual returns for 1, 5 and 10 years, and since the Fund's inception, compare with those of a broad measure of market performance. The Fund's past performance (before and after taxes) is not necessarily an indication of how the Fund will perform in the future. For current performance information, please call 1-800-DIAL-SEI.
|
|
Best Quarter: 24.31% (06/30/2020) Worst Quarter: -30.47% (03/31/2020) |
||||||
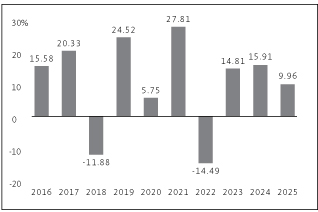
| Best Quarter: 24.31% (06/30/2020) Worst Quarter: -30.47% (03/31/2020) |
This table compares the Fund's average annual total returns to those of a broad-based securities market index and an additional index with characteristics relevant to the Fund's investment strategy.
After-tax returns are calculated using the historical highest individual federal marginal income tax rates and do not reflect the impact of state and local taxes. Your actual after-tax returns will depend on your tax situation and may differ from those shown. After-tax returns shown are not relevant to investors who hold their Fund shares through tax-deferred arrangements, such as 401(k) plans or individual retirement accounts. In some cases, the Fund's return after taxes may exceed the Fund's return before taxes due to an assumed tax benefit from any losses on a sale of Fund shares at the end of the measurement period.
|
Mid-Cap Fund — Class F |
1 Year |
5 Years |
10 Years |
Since Inception (2/16/1993) |
|||||||||||||||
|
Return Before Taxes |
9.96 |
% |
9.84 |
% |
9.95 |
% |
9.85 |
% |
|||||||||||
|
Return After Taxes on Distributions |
5.09 |
% |
7.19 |
% |
7.84 |
% |
8.07 |
% |
|||||||||||
|
Return After Taxes on Distributions and Sale of Fund Shares |
9.27 |
% |
7.31 |
% |
7.56 |
% |
7.87 |
% |
|||||||||||
|
S&P 500 Index Return (reflects no deduction for fees, expenses or taxes) |
17.88 |
% |
14.42 |
% |
14.82 |
% |
10.84 |
% |
|||||||||||
|
Russell Midcap Index Return (reflects no deduction for fees, expenses or taxes) |
10.60 |
% |
8.67 |
% |
11.01 |
% |
10.91 |
% |
|||||||||||
The bar chart and the performance table below provide some indication of the risks of investing in the Fund by showing changes in the Fund's performance from year to year for the past ten calendar years and by showing how the Fund's average annual returns for 1, 5 and 10 years, and since the Fund's inception, compare with those of a broad measure of market performance. The Fund's past performance (before and after taxes) is not necessarily an indication of how the Fund will perform in the future. For current performance information, please call 1-800-DIAL-SEI.
|
|
Best Quarter: 13.36% (12/31/2022) Worst Quarter: -23.18% (03/31/2020) |
||||||
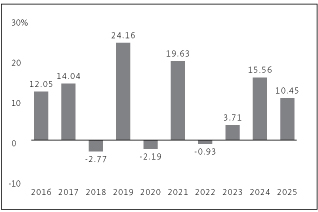
| Best Quarter: 13.36% (12/31/2022) Worst Quarter: -23.18% (03/31/2020) |
This table compares the Fund's average annual total returns to those of the S&P 500 Index (a broad-based securities market index), and two additional indexes with characteristics relevant to the Fund's investment strategy.
After-tax returns are calculated using the historical highest individual federal marginal income tax rates and do not reflect the impact of state and local taxes. Your actual after-tax returns will depend on your tax situation and may differ from those shown. After-tax returns shown are not relevant to investors who hold their Fund shares through tax-deferred arrangements, such as 401(k) plans or individual retirement accounts. In some cases, the Fund's return after taxes may exceed the Fund's return before taxes due to an assumed tax benefit from any losses on a sale of Fund shares at the end of the measurement period.
|
U.S. Managed Volatility Fund — Class F |
1 Year |
5 Years |
10 Years |
Since Inception (10/28/2004) |
|||||||||||||||
|
Return Before Taxes |
10.45 |
% |
9.42 |
% |
9.00 |
% |
8.77 |
% |
|||||||||||
|
Return After Taxes on Distributions |
6.38 |
% |
5.62 |
% |
6.27 |
% |
6.95 |
% |
|||||||||||
|
Return After Taxes on Distributions and Sale of Fund Shares |
8.72 |
% |
6.78 |
% |
6.71 |
% |
6.98 |
% |
|||||||||||
|
S&P 500 Index Return (reflects no deduction for fees, expenses or taxes) |
17.88 |
% |
14.42 |
% |
14.82 |
% |
11.00 |
% |
|||||||||||
|
MSCI USA Minimum Volatility Index (Net) (reflects no deduction for fees, expenses or taxes) |
7.31 |
% |
8.01 |
% |
9.92 |
% |
8.98 |
% |
|||||||||||
|
Russell 3000 Index Return (reflects no deduction for fees, expenses or taxes) |
17.15 |
% |
13.15 |
% |
14.29 |
% |
10.88 |
% |
|||||||||||
The bar chart and the performance table below provide some indication of the risks of investing in the Fund by showing changes in the Fund's performance from year to year for the past ten calendar years and by showing how the Fund's average annual returns for 1, 5 and 10 years, and since the Fund's inception, compare with those of a broad measure of market performance. The Fund's past performance (before and after taxes) is not necessarily an indication of how the Fund will perform in the future. For current performance information, please call 1-800-DIAL-SEI.
|
|
Best Quarter: 10.68% (06/30/2020) Worst Quarter: -19.29% (03/31/2020) |
||||||
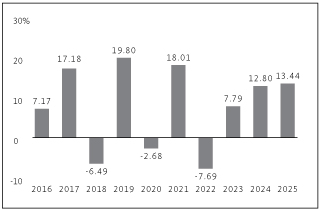
| Best Quarter: 10.68% (06/30/2020) Worst Quarter: -19.29% (03/31/2020) |
This table compares the Fund's average annual total returns to those of the MSCI All Country World ex-USA Index (Net) (a broad-based securities market index), and two additional indexes with characteristics relevant to the Fund's investment strategy.
After-tax returns are calculated using the historical highest individual federal marginal income tax rates and do not reflect the impact of state and local taxes. Your actual after-tax returns will depend on your tax situation and may differ from those shown. After-tax returns shown are not relevant to investors who hold their Fund shares through tax-deferred arrangements, such as 401(k) plans or individual retirement accounts. In some cases, the Fund's return after taxes may exceed the Fund's return before taxes due to an assumed tax benefit from any losses on a sale of Fund shares at the end of the measurement period.
|
Global Managed Volatility Fund — Class F |
1 Year |
5 Years |
10 Years |
Since Inception (7/27/2006) |
|||||||||||||||
|
Return Before Taxes |
13.44 |
% |
8.48 |
% |
7.48 |
% |
5.97 |
% |
|||||||||||
|
Return After Taxes on Distributions |
11.24 |
% |
6.17 |
% |
5.53 |
% |
4.45 |
% |
|||||||||||
|
Return After Taxes on Distributions and Sale of Fund Shares |
9.52 |
% |
6.27 |
% |
5.56 |
% |
4.43 |
% |
|||||||||||
|
MSCI All Country World ex-USA Index (Net) (reflects no deduction for fees or expenses) |
32.39 |
% |
7.91 |
% |
8.41 |
% |
5.29 |
% |
|||||||||||
|
MSCI World Minimum Volatility Index (Net) (reflects no deduction for fees or expenses) |
10.54 |
% |
6.29 |
% |
7.80 |
% |
7.02 |
% |
|||||||||||
|
MSCI World Index Return (Net) (reflects no deduction for fees or expenses) |
21.09 |
% |
12.15 |
% |
12.17 |
% |
8.46 |
% |
|||||||||||
The bar chart and the performance table below provide some indication of the risks of investing in the Fund by showing changes in the Fund's performance from year to year for the past ten calendar years and by showing how the Fund's average annual returns for 1, 5 and 10 years, and since the Fund's inception, compare with those of a broad measure of market performance. The Fund's past performance (before and after taxes) is not necessarily an indication of how the Fund will perform in the future. For current performance information, please call 1-800-DIAL-SEI.
|
|
Best Quarter: 11.90% (06/30/2020) Worst Quarter: -20.36% (03/31/2020) |
||||||
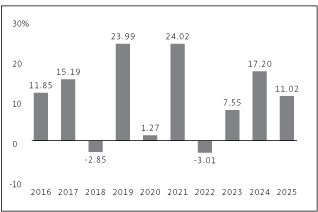
| Best Quarter: 11.90% (06/30/2020) Worst Quarter: -20.36% (03/31/2020) |
This table compares the Fund's average annual total returns to those of the S&P 500 Index (a broad-based securities market index), and two additional indexes with characteristics relevant to the Fund's investment strategy.
After-tax returns are calculated using the historical highest individual federal marginal income tax rates and do not reflect the impact of state and local taxes. Your actual after-tax returns will depend on your tax situation and may differ from those shown. After-tax returns shown are not relevant to investors who hold their Fund shares through tax-deferred arrangements, such as 401(k) plans or individual retirement accounts.
In some cases, the Fund's return after taxes may exceed the Fund's return before taxes due to an assumed tax benefit from any losses on a sale of Fund shares at the end of the measurement period.
|
Tax-Managed Managed Volatility Fund — Class F |
1 Year |
5 Years |
10 Years |
Since Inception (12/20/2007) |
|||||||||||||||
|
Return Before Taxes |
11.02 |
% |
10.98 |
% |
10.22 |
% |
9.35 |
% |
|||||||||||
|
Return After Taxes on Distributions |
5.65 |
% |
7.61 |
% |
8.05 |
% |
7.75 |
% |
|||||||||||
|
Return After Taxes on Distributions and Sale of Fund Shares |
10.35 |
% |
8.41 |
% |
8.08 |
% |
7.61 |
% |
|||||||||||
|
S&P 500 Index Return (reflects no deduction for fees, expenses or taxes) |
17.88 |
% |
14.42 |
% |
14.82 |
% |
11.06 |
% |
|||||||||||
|
MSCI USA Minimum Volatility Index (Net) (reflects no deduction for fees, expenses or taxes) |
7.31 |
% |
8.01 |
% |
9.92 |
% |
8.87 |
% |
|||||||||||
|
Russell 3000 Index Return (reflects no deduction for fees, expenses or taxes) |
17.15 |
% |
13.15 |
% |
14.29 |
% |
10.83 |
% |
|||||||||||
The bar chart and the performance table below provide some indication of the risks of investing in the Fund by showing changes in the Fund's performance from year to year for the past nine calendar years and by showing how the Fund's average annual returns for 1 and 5 years and since the Fund's inception compare with those of a broad measure of market performance. The Fund's past performance (before and after taxes) is not necessarily an indication of how the Fund will perform in the future. For current performance information, please call 1-800-DIAL-SEI.
|
|
Best Quarter: 14.33% (12/31/2022) Worst Quarter: -20.38% (03/31/2020) |
||||||
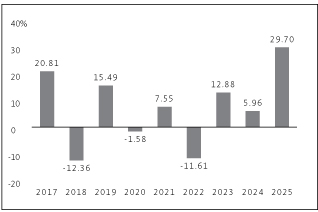
| Best Quarter: 14.33% (12/31/2022) Worst Quarter: -20.38% (03/31/2020) |
This table compares the Fund's average annual total returns to those of the MSCI All Country World ex-USA Index (Net) (a broad-based securities market index), and two additional indexes with characteristics relevant to the Fund's investment strategy.
After-tax returns are calculated using the historical highest individual federal marginal income tax rates and do not reflect the impact of state and local taxes. Your actual after-tax returns will depend on your tax situation and may differ from those shown. After-tax returns shown are not relevant to investors who hold their Fund shares through tax-deferred arrangements, such as 401(k) plans or individual retirement accounts.
|
Tax-Managed International Managed Volatility Fund — Class F |
1 Year |
5 Years |
Since Inception (10/17/2016) |
||||||||||||
|
Return Before Taxes |
29.70 |
% |
8.08 |
% |
6.28 |
% |
|||||||||
|
Return After Taxes on Distributions |
29.08 |
% |
7.31 |
% |
5.70 |
% |
|||||||||
|
Return After Taxes on Distributions and Sale of Fund Shares |
18.45 |
% |
6.29 |
% |
5.02 |
% |
|||||||||
|
MSCI All Country World ex-USA Index (Net) (reflects no deduction for fees or expenses) |
32.39 |
% |
7.91 |
% |
8.75 |
% |
|||||||||
|
MSCI EAFE Minimum Volatility Index (Net) (reflects no deduction for fees or expenses) |
25.79 |
% |
6.20 |
% |
6.39 |
% |
|||||||||
|
MSCI EAFE Index Return (Net) (reflects no deduction for fees or expenses) |
31.22 |
% |
8.92 |
% |
9.03 |
% |
|||||||||
The bar chart and the performance table below provide some indication of the risks of investing in the Fund by showing changes in the Fund's performance from year to year for the past ten calendar years and by showing how the Fund's average annual returns for 1, 5 and 10 years, and since the Fund's inception, compare with those of a broad measure of market performance. The Fund's past performance (before and after taxes) is not necessarily an indication of how the Fund will perform in the future. For current performance information, please call 1-800-DIAL-SEI.
|
|
Best Quarter: 16.80% (12/31/2023) Worst Quarter: -22.77% (03/31/2020) |
||||||
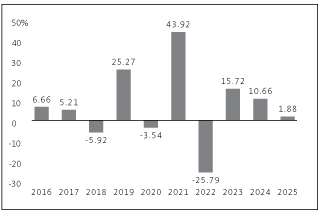
| Best Quarter: 16.80% (12/31/2023) Worst Quarter: -22.77% (03/31/2020) |
This table compares the Fund's average annual total returns to those of a broad-based securities market index and an additional index with characteristics relevant to the Fund's investment strategy.
After-tax returns are calculated using the historical highest individual federal marginal income tax rates and do not reflect the impact of state and local taxes. Your actual after-tax returns will depend on your tax
situation and may differ from those shown. After-tax returns shown are not relevant to investors who hold their Fund shares through tax-deferred arrangements, such as 401(k) plans or individual retirement accounts. In some cases, the Fund's return after taxes may exceed the Fund's return before taxes due to an assumed tax benefit from any losses on a sale of Fund shares at the end of the measurement period.
|
Real Estate Fund — Class F |
1 Year |
5 Years |
10 Years |
Since Inception (11/13/2003) |
|||||||||||||||
|
Return Before Taxes |
1.88 |
% |
6.86 |
% |
5.92 |
% |
7.89 |
% |
|||||||||||
|
Return After Taxes on Distributions^ |
-1.11 |
% |
4.84 |
% |
3.44 |
% |
6.07 |
% |
|||||||||||
|
Return After Taxes on Distributions and Sale of Fund Shares^ |
2.58 |
% |
4.80 |
% |
3.89 |
% |
5.96 |
% |
|||||||||||
|
S&P 500 Index Return (reflects no deduction for fees, expenses or taxes) |
17.88 |
% |
14.42 |
% |
14.82 |
% |
10.89 |
% |
|||||||||||
|
Wilshire U.S. Real Estate Securities Index Return (reflects no deduction for fees, expenses or taxes) |
3.47 |
% |
7.04 |
% |
5.74 |
% |
8.10 |
% |
|||||||||||
^ After tax figures are based on estimated amounts for the periods ended December 31, 2025.
The bar chart and the performance table below provide some indication of the risks of investing in the Fund by showing changes in the Fund's performance from year to year for the past ten calendar years and by showing how the Fund's average annual returns for 1, 5 and 10 years, and since the Fund's inception, compare with those of a broad measure of market performance. The Fund's past performance (before and after taxes) is not necessarily an indication of how the Fund will perform in the future. For current performance information, please call 1-800-DIAL-SEI.
|
|
Best Quarter: 7.29% (12/31/2023) Worst Quarter: -6.81% (03/31/2022) |
||||||
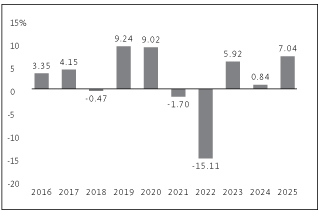
| Best Quarter: 7.29% (12/31/2023) Worst Quarter: -6.81% (03/31/2022) |
After-tax returns are calculated using the historical highest individual federal marginal income tax rates and do not reflect the impact of state and local taxes. Your actual after-tax returns will depend on your tax situation and may differ from those shown. After-tax returns shown are not relevant to investors who hold their Fund shares through tax-deferred arrangements, such as 401(k) plans or individual retirement accounts. In some cases, the Fund's return after taxes may exceed the Fund's return before taxes due to an assumed tax benefit from any losses on a sale of Fund shares at the end of the measurement period.
|
Core Fixed Income Fund — Class F |
1 Year |
5 Years |
10 Years |
Since Inception (5/1/1987) |
|||||||||||||||
|
Return Before Taxes |
7.04 |
% |
-0.94 |
% |
1.99 |
% |
5.21 |
% |
|||||||||||
|
Return After Taxes on Distributions |
5.50 |
% |
-2.14 |
% |
0.58 |
% |
3.26 |
% |
|||||||||||
|
Return After Taxes on Distributions and Sale of Fund Shares |
4.15 |
% |
-1.22 |
% |
0.93 |
% |
3.30 |
% |
|||||||||||
|
Bloomberg U.S. Aggregate Bond Index Return (reflects no deduction for fees, expenses or taxes) |
7.30 |
% |
-0.36 |
% |
2.01 |
% |
5.38 |
%^ |
|||||||||||
^ The benchmark's "Since Inception" return period begins 4/30/1987 due to the index provider calculating only month-end data points at that time.
The bar chart and the performance table below provide some indication of the risks of investing in the Fund by showing changes in the Fund's performance from year to year for the past ten calendar years and by showing how the Fund's average annual returns for 1, 5 and 10 years, and since the Fund's inception, compare with those of a broad measure of market performance. The Fund's past performance (before and after taxes)
is not necessarily an indication of how the Fund will perform in the future. For current performance information, please call 1-800-DIAL-SEI.
|
|
Best Quarter: 8.92% (06/30/2020) Worst Quarter: -15.60% (03/31/2020) |
||||||
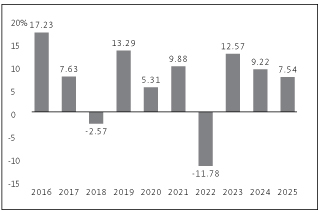
Best Quarter: 8.92% (06/30/2020)
Worst Quarter: -15.60% (03/31/2020)
This table compares the Fund's average annual total returns to those of a broad-based securities market index and an additional index with characteristics relevant to the Fund's investment strategy.
After-tax returns are calculated using the historical highest individual federal marginal income tax rates and do not reflect the impact of state and local taxes. Your actual after-tax returns will depend on your tax situation and may differ from those shown. After-tax returns shown are not relevant to investors who hold their Fund shares through tax-deferred arrangements, such as 401(k) plans or individual retirement accounts. In some cases, the Fund's return after taxes may exceed the Fund's return before taxes due to an assumed tax benefit from any losses on a sale of Fund shares at the end of the measurement period.
|
High Yield Bond Fund — Class F |
1 Year |
5 Years |
10 Years |
Since Inception (1/11/1995) |
|||||||||||||||
|
Return Before Taxes |
7.54 |
% |
5.09 |
% |
6.51 |
% |
6.72 |
% |
|||||||||||
|
Return After Taxes on Distributions |
3.85 |
% |
1.22 |
% |
3.00 |
% |
3.29 |
% |
|||||||||||
|
Return After Taxes on Distributions and Sale of Fund Shares |
4.40 |
% |
2.14 |
% |
3.42 |
% |
3.61 |
% |
|||||||||||
|
Bloomberg U.S. Aggregate Bond Index Return (reflects no deduction for fees, expenses or taxes) |
7.30 |
% |
-0.36 |
% |
2.01 |
% |
4.63 |
% |
|||||||||||
|
ICE BofA U.S. High Yield Constrained Index Return (reflects no deduction for fees, expenses or taxes) |
8.50 |
% |
4.50 |
% |
6.44 |
% |
|||||||||||||
† The ICE BofA U.S. High Yield Constrained Index Return for the "Since Inception" period is not provided because returns for the index are not available prior to 1996.
The bar chart and the performance table below provide some indication of the risks of investing in the Fund by showing changes in the Fund's performance from year to year for the past nine calendar years and by showing how the Fund's average annual returns for 1 and 5 years and since the Fund's inception compare with those of a broad measure of market performance. The Fund's past performance (before and after taxes) is not necessarily an indication of how the Fund will perform in the future. For current performance information, please call 1-800-DIAL-SEI.
|
|
Best Quarter: 1.40% (09/30/2024) Worst Quarter: -0.09% (03/31/2022) |
||||||
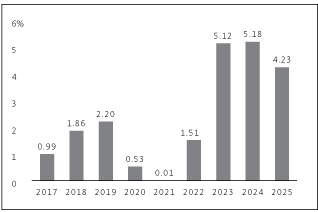
| Best Quarter: 1.40% (09/30/2024) Worst Quarter: -0.09% (03/31/2022) |
This table compares the Fund's average annual total returns to those of a broad-based securities market index and an additional index with characteristics relevant to the Fund's investment strategy.
After-tax returns are calculated using the historical highest individual federal marginal income tax rates and do not reflect the impact of state and local taxes. Your actual after-tax returns will depend on your tax situation and may differ from those shown. After-tax returns shown are not relevant to investors who hold their Fund shares through tax-deferred arrangements, such as 401(k) plans or individual retirement accounts.
|
Conservative Income Fund — Class F |
1 Year |
5 Years |
Since Inception (4/22/2016) |
||||||||||||
|
Return Before Taxes |
4.23 |
% |
3.19 |
% |
2.24 |
% |
|||||||||
|
Return After Taxes on Distributions |
2.48 |
% |
1.88 |
% |
1.32 |
% |
|||||||||
|
Return After Taxes on Distributions and Sale of Fund Shares |
2.48 |
% |
1.88 |
% |
1.32 |
% |
|||||||||
|
Bloomberg U.S. Aggregate Bond Index Return (reflects no deduction for fees, expenses or taxes) |
7.30 |
% |
-0.36 |
% |
1.76 |
% |
|||||||||
|
ICE BofA U.S. 3-Month Treasury Bill Index (reflects no deduction for fees, expenses or taxes) |
4.18 |
% |
3.17 |
% |
2.24 |
% |
|||||||||
Although the Fund's performance is benchmarked against the return of the ICE BofA U.S. 3-Month Treasury Bill Index, an investment in the Fund may differ from an investment in U.S. Treasury bills. Among other things, Treasury bills are backed by the full faith and credit of the U.S. Government and have a fixed rate of return. Investors in Treasury bills do not risk losing their investment, whereas loss of money is a risk of investing in the Fund. Further, an investment in the Fund may potentially be more volatile than an investment in Treasury bills because of the breadth and types of securities and other instruments in which the Fund may invest.
The bar chart and the performance table below provide some indication of the risks of investing in the Fund by showing changes in the Fund's performance from year to year for the past nine calendar years and by showing how the Fund's average annual returns for 1 and 5 years and since the Fund's inception compare with those of a broad measure of market performance. The Fund's past performance (before and after taxes) is not necessarily an indication of how the Fund will perform in the future. For current performance information, please call 1-800-DIAL-SEI.
|
|
Best Quarter: 0.88% (09/30/2024) Worst Quarter: 0.00% (03/31/2021) |
||||||
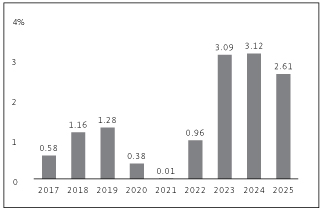
Best Quarter: 0.88% (09/30/2024)
Worst Quarter: 0.00% (03/31/2021)
This table compares the Fund's average annual total returns to those of a broad-based securities market index and an additional index with characteristics relevant to the Fund's investment strategy.
After-tax returns are calculated using the historical highest individual federal marginal income tax rates and do not reflect the impact of state and local taxes. Your actual after-tax returns will depend on your tax situation and may differ from those shown. After-tax returns shown are not relevant to investors who hold their Fund shares through tax-deferred arrangements, such as 401(k) plans or individual retirement accounts.
|
Tax-Free Conservative Income Fund — Class F |
1 Year |
5 Years |
Since Inception (4/22/2016) |
||||||||||||
|
Return Before Taxes |
2.61 |
% |
1.95 |
% |
1.38 |
% |
|||||||||
|
Return After Taxes on Distributions |
2.60 |
% |
1.94 |
% |
1.37 |
% |
|||||||||
|
Return After Taxes on Distributions and Sale of Fund Shares |
2.60 |
% |
1.94 |
% |
1.37 |
% |
|||||||||
|
Bloomberg U.S. Aggregate Bond Index Return (reflects no deduction for fees, expenses or taxes) |
7.30 |
% |
-0.36 |
% |
1.76 |
% |
|||||||||
|
ICE BofA U.S. 3-Month Treasury Bill Index (reflects no deduction for fees, expenses or taxes) |
4.18 |
% |
3.17 |
% |
2.24 |
% |
|||||||||
Although the Fund's performance is benchmarked against the return of the ICE BofA U.S. 3-Month Treasury Bill Index, an investment in the Fund may differ from an investment in U.S. Treasury bills. Among other things, Treasury bills are backed by the full faith and credit of the U.S. Government and have a fixed rate of return. Investors in Treasury bills do not risk losing their investment, whereas loss of money is a risk of investing in the Fund. Further, an investment in the Fund may potentially be more volatile than an investment in Treasury bills because of the breadth and types of securities and other instruments in which the Fund may invest.
The bar chart and the performance table below provide some indication of the risks of investing in the Fund by showing changes in the Fund's performance from year to year for the past ten calendar years and by showing how the Fund's average annual returns for 1, 5 and 10 years, and since the Fund's inception, compare with those of a broad measure of market performance. The Fund's past performance (before and after taxes) is not necessarily an indication of how the Fund will perform in the future. For current performance information, please call 1-800-DIAL-SEI.
|
|
Best Quarter: 3.35% (03/31/2025) Worst Quarter: -3.25% (09/30/2022) |
||||||
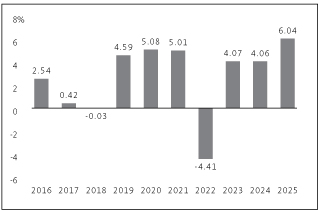
Best Quarter: 3.35% (03/31/2025)
Worst Quarter: -3.25% (09/30/2022)
This table compares the Fund's average annual total returns to those of a broad-based securities market index and an additional index with characteristics relevant to the Fund's investment strategy.
After-tax returns are calculated using the historical highest individual federal marginal income tax rates and do not reflect the impact of state and local taxes. Your actual after-tax returns will depend on your tax situation and may differ from those shown. After-tax returns shown are not relevant to investors who hold their Fund shares through tax-deferred arrangements, such as 401(k) plans or individual retirement accounts. In some cases, the Fund's return after taxes may exceed the Fund's return before taxes due to an assumed tax benefit from any losses on a sale of Fund shares at the end of the measurement period.
|
Real Return Fund — Class F |
1 Year |
5 Years |
10 Years |
Since Inception (7/2/2009) |
|||||||||||||||
|
Return Before Taxes |
6.04 |
% |
2.88 |
% |
2.69 |
% |
2.22 |
% |
|||||||||||
|
Return After Taxes on Distributions |
4.24 |
% |
1.06 |
% |
1.53 |
% |
1.28 |
% |
|||||||||||
|
Return After Taxes on Distributions and Sale of Fund Shares |
3.56 |
% |
1.40 |
% |
1.56 |
% |
1.32 |
% |
|||||||||||
|
Bloomberg U.S. Aggregate Bond Index Return (reflects no deduction for fees, expenses or taxes) |
7.30 |
% |
-0.36 |
% |
2.01 |
% |
2.81 |
% |
|||||||||||
|
Bloomberg 1-5 Year U.S. TIPS Index Return (reflects no deduction for fees, expenses or taxes) |
6.55 |
% |
3.32 |
% |
3.16 |
% |
2.67 |
% |
|||||||||||
The bar chart and the performance table below provide some indication of the risks of investing in the Fund by showing changes in the Fund's performance from year to year for the past ten calendar years and by showing how the Fund's average annual returns for 1, 5 and 10 years, and since the Fund's inception, compare with those of a broad measure of market performance. The Fund's past performance (before and after taxes) is not necessarily an indication of how the Fund will perform in the future. For current performance information, please call 1-800-DIAL-SEI.
|
|
Best Quarter: 20.97% (06/30/2020) Worst Quarter: -19.16% (03/31/2020) |
||||||
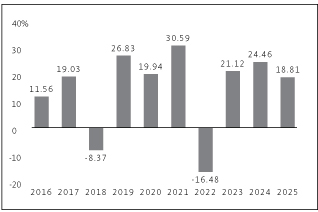
| Best Quarter: 20.97% (06/30/2020) Worst Quarter: -19.16% (03/31/2020) |
After-tax returns are calculated using the historical highest individual federal marginal income tax rates and do not reflect the impact of state and local taxes. Your actual after-tax returns will depend on your tax situation and may differ from those shown. After-tax returns shown are not relevant to investors who hold their Fund shares through tax-deferred arrangements, such as 401(k) plans or individual retirement accounts. In some cases, the Fund's return after taxes may exceed the Fund's return before taxes due to an assumed tax benefit from any losses on a sale of Fund shares at the end of the measurement period.
|
Dynamic Asset Allocation Fund — Class F |
1 Year |
5 Years |
10 Years |
Since Inception (7/30/2015) |
|||||||||||||||
|
Return Before Taxes |
18.81 |
% |
14.33 |
% |
13.71 |
% |
12.79 |
% |
|||||||||||
|
Return After Taxes on Distributions |
13.45 |
% |
10.85 |
% |
11.51 |
% |
10.68 |
% |
|||||||||||
|
Return After Taxes on Distributions and Sale of Fund Shares |
14.12 |
% |
10.67 |
% |
10.84 |
% |
10.07 |
% |
|||||||||||
|
S&P 500 Index Return (reflects no deduction for fees, expenses or taxes) |
17.88 |
% |
14.42 |
% |
14.82 |
% |
13.93 |
% |
|||||||||||
The bar chart and the performance table below provide some indication of the risks of investing in the Fund by showing changes in the Fund's performance from year to year for the past ten calendar years and by showing how the Fund's average annual returns for 1, 5 and 10 years, and since the Fund's inception, compare with those of a broad measure of market performance. The Fund's past performance (before and after taxes) is not necessarily an indication of how the Fund will perform in the future. For current performance information, please call 1-800-DIAL-SEI.
|
|
Best Quarter: 7.23% (12/31/2020) Worst Quarter: -6.44% (06/30/2022) |
||||||
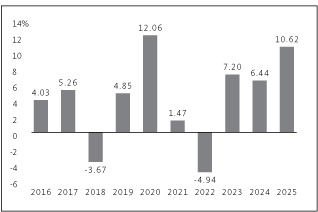
| Best Quarter: 7.23% (12/31/2020) Worst Quarter: -6.44% (06/30/2022) |
This table compares the Fund's average annual total returns to those of a broad-based securities market index and an additional index with characteristics relevant to the Fund's investment strategy.
After-tax returns are calculated using the historical highest individual federal marginal income tax rates and do not reflect the impact of state and local taxes. Your actual after-tax returns will depend on your tax situation and may differ from those shown. After-tax returns shown are not relevant to investors who hold their Fund shares through tax-deferred arrangements, such as 401(k) plans or individual retirement accounts. In some cases, the Fund's return after taxes may exceed the Fund's return before taxes due to an assumed tax benefit from any losses on a sale of Fund shares at the end of the measurement period.
|
Multi-Strategy Alternative Fund — Class F |
1 Year |
5 Years |
10 Years |
Since Inception (3/31/2010) |
|||||||||||||||
|
Return Before Taxes |
10.62 |
% |
4.01 |
% |
4.20 |
% |
2.80 |
% |
|||||||||||
|
Return After Taxes on Distributions |
8.51 |
% |
2.04 |
% |
2.83 |
% |
1.75 |
% |
|||||||||||
|
Return After Taxes on Distributions and Sale of Fund Shares |
6.36 |
% |
2.21 |
% |
2.69 |
% |
1.74 |
% |
|||||||||||
|
Bloomberg U.S. Aggregate Bond Index Return (reflects no deduction for fees, expenses or taxes) |
7.30 |
% |
-0.36 |
% |
2.01 |
% |
2.60 |
% |
|||||||||||
|
ICE BofA U.S. 3-Month Treasury Bill Index (reflects no deduction for fees, expenses or taxes) |
4.18 |
% |
3.17 |
% |
2.18 |
% |
1.41 |
% |
|||||||||||
Although the Fund's performance is benchmarked against the return of the ICE BofA U.S. 3-Month Treasury Bill Index, an investment in the Fund is substantially different from an investment in U.S. Treasury bills. Among other things, Treasury bills are backed by the full faith and credit of the U.S. Government and have a fixed rate of return. Investors in Treasury bills do not risk losing their investment, whereas loss of money is a risk of investing in the Fund. Further, an investment in the Fund is expected to be substantially more volatile than an investment in Treasury bills because of the breadth and types of securities and other instruments in which the Fund may invest.
The bar chart and the performance table below provide some indication of the risks of investing in the Fund by showing changes in the Fund's performance from year to year for the past ten calendar years and by showing how the Fund's average annual returns for 1, 5 and 10 years, and since the Fund's inception, compare with those of a broad measure of market performance. The Fund's past performance (before and after taxes) is not necessarily an indication of how the Fund will perform in the future. For current performance information, please call 1-800-DIAL-SEI.
|
|
Best Quarter: 20.21% (06/30/2020) Worst Quarter: -24.00% (03/31/2020) As of January 31, 2026, Class I Shares of the Fund had not commenced operations and did not have a performance history. For full calendar years through December 31, 2025, the performance of the Fund's Class F Shares is shown. The Fund's Class F Shares are offered in a separate prospectus. Because Class I Shares would have been invested in the same portfolio of securities, returns for Class I Shares would have been substantially similar to those of Class F Shares, shown here, and would have differed only to the extent that the classes do not have the same total annual fund operating expenses. |
||||||
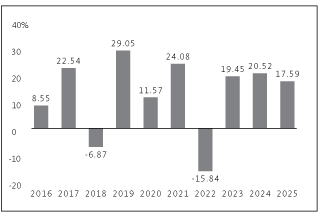
| Best Quarter: 20.21% (06/30/2020) Worst Quarter: -24.00% (03/31/2020) As of January 31, 2026, Class I Shares of the Fund had not commenced operations and did not have a performance history. For full calendar years through December 31, 2025, the performance of the Fund's Class F Shares is shown. The Fund's Class F Shares are offered in a separate prospectus. Because Class I Shares would have been invested in the same portfolio of securities, returns for Class I Shares would have been substantially similar to those of Class F Shares, shown here, and would have differed only to the extent that the classes do not have the same total annual fund operating expenses. |
This table compares the Fund's average annual total returns to those of a broad-based securities market index and an additional index with characteristics relevant to the Fund's investment strategy.
After-tax returns are calculated using the historical highest individual federal marginal income tax rates and do not reflect the impact of state and local taxes. Your actual after-tax returns will depend on your tax situation and may differ from those shown. After-tax returns shown are not relevant to investors who hold their Fund shares through tax-deferred arrangements, such as 401(k) plans or individual retirement accounts. In some cases, the Fund's return after taxes may exceed the Fund's return before taxes due to an assumed tax benefit from any losses on a sale of Fund shares at the end of the measurement period.
|
Large Cap Fund* |
1 Year |
5 Years |
10 Years |
Since Inception (9/30/2009) |
|||||||||||||||
|
Return Before Taxes |
17.59 |
% |
12.07 |
% |
12.17 |
% |
12.13 |
% |
|||||||||||
|
Return After Taxes on Distributions |
12.61 |
% |
8.72 |
% |
9.61 |
% |
9.77 |
% |
|||||||||||
|
Return After Taxes on Distributions and Sale of Fund Shares |
13.80 |
% |
9.06 |
% |
9.45 |
% |
9.61 |
% |
|||||||||||
|
S&P 500 Index Return (reflects no deduction for fees, expenses or taxes) |
17.88 |
% |
14.42 |
% |
14.82 |
% |
14.29 |
% |
|||||||||||
|
Russell 1000 Index Return (reflects no deduction for fees, expenses or taxes) |
17.37 |
% |
13.59 |
% |
14.59 |
% |
14.18 |
% |
|||||||||||
* As of January 31, 2026, Class I Shares of the Fund had not commenced operations and did not have a performance history. For periods prior to December 31, 2025, the performance of the Fund's Class F Shares has been used. Returns for Class I Shares would have been substantially similar to those of Class F Shares and would have differed only to the extent that Class I Shares have higher total annual fund operating expenses than Class F Shares.
The bar chart and the performance table below provide some indication of the risks of investing in the Fund by showing changes in the Fund's performance from year to year for the past ten calendar years and by showing how the Fund's average annual returns for 1, 5 and 10 years, and since the Fund's inception, compare with those of a broad measure of market performance. The Fund's past performance (before and after taxes) is not necessarily an indication of how the Fund will perform in the future. For current performance information, please call 1-800-DIAL-SEI.
|
|
Best Quarter: 16.63% (12/31/2020) Worst Quarter: -30.02% (03/31/2020) |
||||||
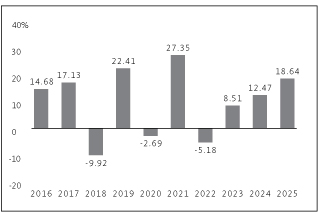
Best Quarter: 16.63% (12/31/2020)
Worst Quarter: -30.02% (03/31/2020)
This table compares the Fund's average annual total returns to those of a broad-based securities market index and an additional index with characteristics relevant to the Fund's investment strategy.
After-tax returns are calculated using the historical highest individual federal marginal income tax rates and do not reflect the impact of state and local taxes. Your actual after-tax returns will depend on your tax situation and may differ from those shown. After-tax returns shown are not relevant to investors who hold their Fund shares through tax-deferred arrangements, such as 401(k) plans or individual retirement accounts.
|
Large Cap Value Fund* |
1 Year |
5 Years |
10 Years |
Since Inception (10/3/1994) |
|||||||||||||||
|
Return Before Taxes |
18.64 |
% |
11.82 |
% |
9.68 |
% |
8.75 |
% |
|||||||||||
|
Return After Taxes on Distributions |
15.01 |
% |
9.61 |
% |
8.02 |
% |
7.34 |
% |
|||||||||||
|
Return After Taxes on Distributions and Sale of Fund Shares |
13.56 |
% |
9.12 |
% |
7.59 |
% |
7.12 |
% |
|||||||||||
|
Large Cap Value Fund* |
1 Year |
5 Years |
10 Years |
Since Inception (10/3/1994) |
|||||||||||||||
|
S&P 500 Index Return (reflects no deduction for fees, expenses or taxes) |
17.88 |
% |
14.42 |
% |
14.82 |
% |
11.05 |
% |
|||||||||||
|
Russell 1000 Value Index Return (reflects no deduction for fees, expenses or taxes) |
15.91 |
% |
11.33 |
% |
10.53 |
% |
9.89 |
% |
|||||||||||
* The Fund's Class I Shares commenced operations on August 6, 2001. Therefore, the Fund's average annual total returns for the periods prior to that time are based on the average annual total returns of the Class F Shares, adjusted for the higher expenses of the Class I Shares. The Fund's actual inception date is April 20, 1987. Between April 20, 1987 and October 3, 1994, the Fund was advised by a different investment adviser. Accordingly, performance shown in the chart above is from October 3, 1994.
The bar chart and the performance table below provide some indication of the risks of investing in the Fund by showing changes in the Fund's performance from year to year for the past ten calendar years and by showing how the Fund's average annual returns for 1, 5 and 10 years, and since the Fund's inception, compare with those of a broad measure of market performance. The Fund's past performance (before and after taxes) is not necessarily an indication of how the Fund will perform in the future. For current performance information, please call 1-800-DIAL-SEI.
|
|
Best Quarter: 27.09% (06/30/2020) Worst Quarter: -20.24% (06/30/2022) |
||||||
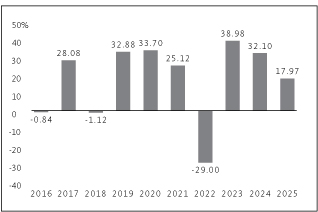
Best Quarter: 27.09% (06/30/2020)
Worst Quarter: -20.24% (06/30/2022)
This table compares the Fund's average annual total returns to those of a broad-based securities market index and an additional index with characteristics relevant to the Fund's investment strategy.
After-tax returns are calculated using the historical highest individual federal marginal income tax rates and do not reflect the impact of state and local taxes. Your actual after-tax returns will depend on your tax situation and may differ from those shown. After-tax returns shown are not relevant to investors who hold their Fund shares through tax-deferred arrangements, such as 401(k) plans or individual retirement accounts.
In some cases, the Fund's return after taxes may exceed the Fund's return before taxes due to an assumed tax benefit from any losses on a sale of Fund shares at the end of the measurement period.
|
Large Cap Growth Fund* |
1 Year |
5 Years |
10 Years |
Since Inception (12/20/1994) |
|||||||||||||||
|
Return Before Taxes |
17.97 |
% |
13.98 |
% |
15.69 |
% |
10.21 |
% |
|||||||||||
|
Return After Taxes on Distributions |
11.80 |
% |
9.74 |
% |
12.54 |
% |
8.75 |
% |
|||||||||||
|
Return After Taxes on Distributions and Sale of Fund Shares |
14.06 |
% |
10.29 |
% |
12.29 |
% |
8.56 |
% |
|||||||||||
|
S&P 500 Index Return (reflects no deduction for fees, expenses or taxes) |
17.88 |
% |
14.42 |
% |
14.82 |
% |
11.14 |
% |
|||||||||||
|
Russell 1000 Growth Index Return (reflects no deduction for fees, expenses or taxes) |
18.56 |
% |
15.32 |
% |
18.13 |
% |
11.80 |
% |
|||||||||||
* The Fund's Class I Shares commenced operations on August 6, 2001. Therefore, the Fund's average annual total returns for the periods prior to that time are based on the average annual total returns of the Class F Shares, adjusted for the higher expenses of the Class I Shares.
The bar chart and the performance table below provide some indication of the risks of investing in the Fund by showing changes in the Fund's performance from year to year for the past ten calendar years and by showing how the Fund's average annual returns for 1, 5 and 10 years, and since the Fund's inception, compare with those of a broad measure of market performance. The Fund's past performance (before and after taxes) is not necessarily an indication of how the Fund will perform in the future. For current performance information, please call 1-800-DIAL-SEI.
|
|
Best Quarter: 20.37% (06/30/2020) Worst Quarter: -19.75% (03/31/2020) |
||||||
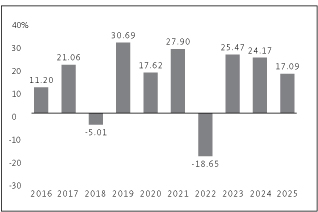
Best Quarter: 20.37% (06/30/2020)
Worst Quarter: -19.75% (03/31/2020)
After-tax returns are calculated using the historical highest individual federal marginal income tax rates and do not reflect the impact of state and local taxes. Your actual after-tax returns will depend on your tax
situation and may differ from those shown. After-tax returns shown are not relevant to investors who hold their Fund shares through tax-deferred arrangements, such as 401(k) plans or individual retirement accounts.
|
S&P 500 Index Fund* |
1 Year |
5 Years |
10 Years |
Since Inception (2/28/1996) |
|||||||||||||||
|
Return Before Taxes |
17.09 |
% |
13.67 |
% |
14.07 |
% |
9.50 |
% |
|||||||||||
|
Return After Taxes on Distributions |
14.86 |
% |
11.57 |
% |
12.47 |
% |
8.55 |
% |
|||||||||||
|
Return After Taxes on Distributions and Sale of Fund Shares |
11.63 |
% |
10.56 |
% |
11.39 |
% |
8.06 |
% |
|||||||||||
|
S&P 500 Index Return (reflects no deduction for fees, expenses or taxes) |
17.88 |
% |
14.42 |
% |
14.82 |
% |
10.22 |
% |
|||||||||||
* The Fund is the successor to SEI Index Funds' S&P 500 Index Fund (the Predecessor Fund). The Fund commenced operations on September 17, 2007. Accordingly, for periods prior to September 17, 2007, the performance information is based on the performance of the Predecessor Fund's Class A Shares (prior to June 28, 2002) and Class I Shares (between June 28, 2002 and September 16, 2007).
The bar chart and the performance table below provide some indication of the risks of investing in the Fund by showing changes in the Fund's performance from year to year for the past ten calendar years and by showing how the Fund's average annual returns for 1, 5 and 10 years and since the Fund's inception, compare with those of a broad measure of market performance. The Fund's past performance (before and after taxes) is not necessarily an indication of how the Fund will perform in the future. For current performance information, please call 1-800-DIAL-SEI.
|
|
Best Quarter: 28.44% (12/31/2020) Worst Quarter: -31.27% (03/31/2020) As of January 31, 2026, Class I Shares of the Fund had not commenced operations and did not have a performance history. For full calendar years through December 31, 2025, the performance of the Fund's Class F Shares is shown. The Fund's Class F Shares are offered in a separate prospectus. Because Class I Shares would have been invested in the same portfolio of securities, returns for Class I Shares would have been substantially similar to those of Class F Shares, shown here, and would have differed only to the extent that the classes do not have the same total annual fund operating expenses. |
||||||
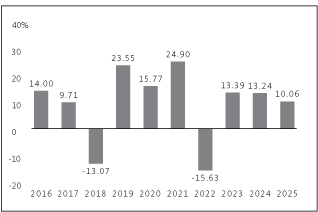
Best Quarter: 28.44% (12/31/2020)
Worst Quarter: -31.27% (03/31/2020)
As of January 31, 2026, Class I Shares of the Fund had not commenced operations and did not have a performance history. For full calendar years through December 31, 2025, the performance of the Fund's Class F Shares is shown. The Fund's Class F Shares are offered in a separate prospectus. Because Class I Shares would have been invested in the same portfolio of securities, returns for Class I Shares would have been substantially similar to those of Class F Shares, shown here, and would have differed only to the extent that the classes do not have the same total annual fund operating expenses.
This table compares the Fund's average annual total returns to those of a broad-based securities market index and an additional index with characteristics relevant to the Fund's investment strategy.
After-tax returns are calculated using the historical highest individual federal marginal income tax rates and do not reflect the impact of state and local taxes. Your actual after-tax returns will depend on your tax situation and may differ from those shown. After-tax returns shown are not relevant to investors who hold their Fund shares through tax-deferred arrangements, such as 401(k) plans or individual retirement accounts. In some cases, the Fund's return after taxes may exceed the Fund's return before taxes due to an assumed tax benefit from any losses on a sale of Fund shares at the end of the measurement period.
|
Small Cap Fund* |
1 Year |
5 Years |
10 Years |
Since Inception (9/30/2009) |
|||||||||||||||
|
Return Before Taxes |
10.06 |
% |
8.29 |
% |
8.76 |
% |
9.57 |
% |
|||||||||||
|
Return After Taxes on Distributions |
7.52 |
% |
5.57 |
% |
6.77 |
% |
7.49 |
% |
|||||||||||
|
Return After Taxes on Distributions and Sale of Fund Shares |
7.79 |
% |
5.94 |
% |
6.57 |
% |
7.32 |
% |
|||||||||||
|
S&P 500 Index Return (reflects no deduction for fees, expenses or taxes) |
17.88 |
% |
14.42 |
% |
14.82 |
% |
14.29 |
% |
|||||||||||
|
Russell 2000 Index Return (reflects no deduction for fees, expenses or taxes) |
12.81 |
% |
6.09 |
% |
9.62 |
% |
10.57 |
% |
|||||||||||
* As of January 31, 2026, Class I Shares of the Fund had not commenced operations and did not have a performance history. For periods prior to December 31, 2025, the performance of the Fund's Class F Shares has been used. Returns for Class I Shares would have been substantially similar to those of Class F Shares and would have differed only to the extent that Class I Shares have higher total annual fund operating expenses than Class F Shares.
The bar chart and the performance table below provide some indication of the risks of investing in the Fund by showing changes in the Fund's performance from year to year for the past ten calendar years and by showing how the Fund's average annual returns for 1, 5 and 10 years, and since the Fund's inception, compare with those of a broad measure of market performance. The Fund's past performance (before and after taxes) is not necessarily an indication of how the Fund will perform in the future. For current performance information, please call 1-800-DIAL-SEI.
|
|
Best Quarter: 30.40% (12/31/2020) Worst Quarter: -39.17% (03/31/2020) |
||||||
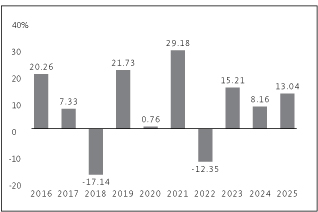
| Best Quarter: 30.40% (12/31/2020) Worst Quarter: -39.17% (03/31/2020) |
This table compares the Fund's average annual total returns to those of a broad-based securities market index and an additional index with characteristics relevant to the Fund's investment strategy.
After-tax returns are calculated using the historical highest individual federal marginal income tax rates and do not reflect the impact of state and local taxes. Your actual after-tax returns will depend on your tax situation and may differ from those shown. After-tax returns shown are not relevant to investors who hold their Fund shares through tax-deferred arrangements, such as 401(k) plans or individual retirement accounts.
|
Small Cap Value Fund* |
1 Year |
5 Years |
10 Years |
Since Inception (12/20/1994) |
|||||||||||||||
|
Return Before Taxes |
13.04 |
% |
9.79 |
% |
7.66 |
% |
8.91 |
% |
|||||||||||
|
Return After Taxes on Distributions |
10.75 |
% |
7.57 |
% |
6.00 |
% |
7.33 |
% |
|||||||||||
|
Return After Taxes on Distributions and Sale of Fund Shares |
9.27 |
% |
7.49 |
% |
5.88 |
% |
7.16 |
% |
|||||||||||
|
S&P 500 Index Return (reflects no deduction for fees, expenses or taxes) |
17.88 |
% |
14.42 |
% |
14.82 |
% |
11.14 |
% |
|||||||||||
|
Russell 2000 Value Index Return (reflects no deduction for fees, expenses or taxes) |
12.59 |
% |
8.88 |
% |
9.27 |
% |
9.86 |
% |
|||||||||||
* The Fund's Class I Shares commenced operations on February 11, 2002. Therefore, the Fund's average annual total returns for the periods prior to that time are based on the average annual total returns of the Class F Shares, adjusted for the higher expenses of the Class I Shares.
The bar chart and the performance table below provide some indication of the risks of investing in the Fund by showing changes in the Fund's performance from year to year for the past ten calendar years and by showing how the Fund's average annual returns for 1, 5 and 10 years, and since the Fund's inception, compare with those of a broad measure of market performance. The Fund's past performance (before and after taxes) is not necessarily an indication of how the Fund will perform in the future. For current performance information, please call 1-800-DIAL-SEI.
|
|
Best Quarter: 29.93% (06/30/2020) Worst Quarter: -31.55% (03/31/2020) |
||||||
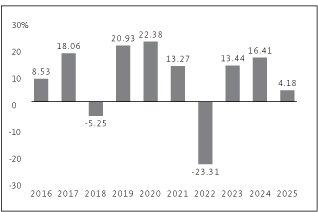
Best Quarter: 29.93% (06/30/2020)
Worst Quarter: -31.55% (03/31/2020)
This table compares the Fund's average annual total returns to those of a broad-based securities market index and an additional index with characteristics relevant to the Fund's investment strategy.
After-tax returns are calculated using the historical highest individual federal marginal income tax rates and do not reflect the impact of state and local taxes. Your actual after-tax returns will depend on your tax situation and may differ from those shown. After-tax returns shown are not relevant to investors who hold their Fund shares through tax-deferred arrangements, such as 401(k) plans or individual retirement accounts. In some cases, the Fund's return after taxes may exceed the Fund's return before taxes due to an assumed tax benefit from any losses on a sale of Fund shares at the end of the measurement period.
|
Small Cap Growth Fund* |
1 Year |
5 Years |
10 Years |
Since Inception (4/20/1992) |
|||||||||||||||
|
Return Before Taxes |
4.18 |
% |
3.63 |
% |
7.94 |
% |
8.43 |
% |
|||||||||||
|
Return After Taxes on Distributions |
1.63 |
% |
1.26 |
% |
6.19 |
% |
7.01 |
% |
|||||||||||
|
Return After Taxes on Distributions and Sale of Fund Shares |
4.31 |
% |
2.36 |
% |
6.03 |
% |
6.76 |
% |
|||||||||||
|
S&P 500 Index Return (reflects no deduction for fees, expenses or taxes) |
17.88 |
% |
14.42 |
% |
14.82 |
% |
10.83 |
% |
|||||||||||
|
Russell 2000 Growth Index Return (reflects no deduction for fees, expenses or taxes) |
13.01 |
% |
3.18 |
% |
9.57 |
% |
8.07 |
% |
|||||||||||
* The Fund's Class I Shares commenced operations on August 6, 2001. Therefore, the Fund's average annual total returns for the periods prior to that time are based on the average annual total returns of the Class F Shares, adjusted for the higher expenses of the Class I Shares.
The bar chart and the performance table below provide some indication of the risks of investing in the Fund by showing changes in the Fund's performance from year to year for the past ten calendar years and by showing how the Fund's average annual returns for 1, 5 and 10 years, and since the Fund's inception, compare with those of a broad measure of market performance. The Fund's past performance (before and after taxes) is not necessarily an indication of how the Fund will perform in the future. For current performance information, please call 1-800-DIAL-SEI.
|
|
Best Quarter: 24.27% (06/30/2020) Worst Quarter: -30.53% (03/31/2020) |
||||||
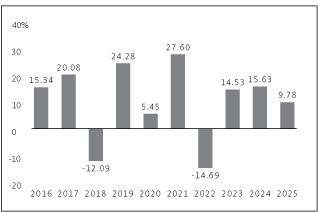
Best Quarter: 24.27% (06/30/2020)
Worst Quarter: -30.53% (03/31/2020)
This table compares the Fund's average annual total returns to those of a broad-based securities market index and an additional index with characteristics relevant to the Fund's investment strategy.
After-tax returns are calculated using the historical highest individual federal marginal income tax rates and do not reflect the impact of state and local taxes. Your actual after-tax returns will depend on your tax situation and may differ from those shown. After-tax returns shown are not relevant to investors who hold their Fund shares through tax-deferred arrangements, such as 401(k) plans or individual retirement accounts. In some cases, the Fund's return after taxes may exceed the Fund's return before taxes due to an assumed tax benefit from any losses on a sale of Fund shares at the end of the measurement period.
|
Mid-Cap Fund* |
1 Year |
5 Years |
10 Years |
Since Inception (2/16/1993) |
|||||||||||||||
|
Return Before Taxes |
9.78 |
% |
9.62 |
% |
9.71 |
% |
9.57 |
% |
|||||||||||
|
Return After Taxes on Distributions |
5.01 |
% |
7.03 |
% |
7.68 |
% |
7.80 |
% |
|||||||||||
|
Return After Taxes on Distributions and Sale of Fund Shares |
9.12 |
% |
7.14 |
% |
7.39 |
% |
7.61 |
% |
|||||||||||
|
S&P 500 Index Return (reflects no deduction for fees, expenses or taxes) |
17.88 |
% |
14.42 |
% |
14.82 |
% |
10.84 |
% |
|||||||||||
|
Russell Midcap Index Return (reflects no deduction for fees, expenses or taxes) |
10.60 |
% |
8.67 |
% |
11.01 |
% |
10.91 |
% |
|||||||||||
* The Fund's Class I Shares commenced operations on October 1, 2007. Therefore, the Fund's average annual total returns for the periods prior to that time are based on the average annual total returns of the Class F Shares, adjusted for the higher expenses of the Class I Shares.
The bar chart and the performance table below provide some indication of the risks of investing in the Fund by showing changes in the performance of the Fund's Class I Shares from year to year for the past ten calendar years and by showing how the Fund's average annual returns for 1, 5 and 10 years, and since the Fund's inception, compare with those of a broad measure of market performance. The Fund's past performance (before and after taxes) is not necessarily an indication of how the Fund will perform in the future. For current performance information, please call 1-800-DIAL-SEI.
|
|
Best Quarter: 13.30% (12/31/2022) Worst Quarter: -23.24% (03/31/2020) |
||||||
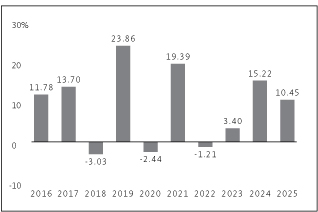
Best Quarter: 13.30% (12/31/2022)
Worst Quarter: -23.24% (03/31/2020)
This table compares the Fund's average annual total returns to those of the S&P 500 Index (a broad-based securities market index), and two additional indexes with characteristics relevant to the Fund's investment strategy.
After-tax returns are calculated using the historical highest individual federal marginal income tax rates and do not reflect the impact of state and local taxes. Your actual after-tax returns will depend on your tax situation and may differ from those shown. After-tax returns shown are not relevant to investors who hold their Fund shares through tax-deferred arrangements, such as 401(k) plans or individual retirement accounts. In some cases, the Fund's return after taxes may exceed the Fund's return before taxes due to an assumed tax benefit from any losses on a sale of Fund shares at the end of the measurement period.
|
U.S. Managed Volatility Fund* |
1 Year |
5 Years |
10 Years |
Since Inception (10/28/2004) |
|||||||||||||||
|
Return Before Taxes |
10.45 |
% |
9.42 |
% |
9.00 |
% |
8.77 |
% |
|||||||||||
|
Return After Taxes on Distributions |
6.38 |
% |
5.62 |
% |
6.27 |
% |
6.95 |
% |
|||||||||||
|
Return After Taxes on Distributions and Sale of Fund Shares |
8.72 |
% |
6.78 |
% |
6.71 |
% |
6.98 |
% |
|||||||||||
|
S&P 500 Index Return (reflects no deduction for fees, expenses or taxes) |
17.88 |
% |
14.42 |
% |
14.82 |
% |
11.00 |
% |
|||||||||||
|
U.S. Managed Volatility Fund* |
1 Year |
5 Years |
10 Years |
Since Inception (10/28/2004) |
|||||||||||||||
|
MSCI USA Minimum Volatility Index (Net) (reflects no deduction for fees, expenses or taxes) |
7.31 |
% |
8.01 |
% |
9.92 |
% |
8.98 |
% |
|||||||||||
|
Russell 3000 Index Return (reflects no deduction for fees, expenses or taxes) |
17.15 |
% |
13.15 |
% |
14.29 |
% |
10.88 |
% |
|||||||||||
* The Fund's Class I Shares are not currently in operation and therefore have no current performance history. Accordingly, the Fund's average annual total returns shown are those of the Class F Shares, which have not been adjusted to reflect the higher expenses of the Class I Shares (which would have lowered performance).
The bar chart and the performance table below provide some indication of the risks of investing in the Fund by showing changes in the Fund's performance from year to year for the past ten calendar years and by showing how the Fund's average annual returns for 1, 5 and 10 years, and since the Fund's inception, compare with those of a broad measure of market performance. The Fund's past performance (before and after taxes) is not necessarily an indication of how the Fund will perform in the future. For current performance information, please call 1-800-DIAL-SEI.
|
|
Best Quarter: 10.60% (06/30/2020) Worst Quarter: -19.29% (03/31/2020) |
||||||
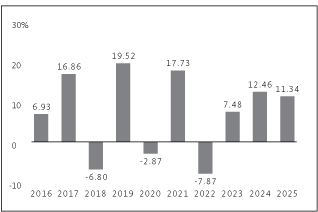
Best Quarter: 10.60% (06/30/2020)
Worst Quarter: -19.29% (03/31/2020)
This table compares the Fund's average annual total returns to those of the MSCI All Country World ex-USA Index (Net) (a broad-based securities market index), and two additional indexes with characteristics relevant to the Fund's investment strategy.
After-tax returns are calculated using the historical highest individual federal marginal income tax rates and do not reflect the impact of state and local taxes. Your actual after-tax returns will depend on your tax situation and may differ from those shown. After-tax returns shown are not relevant to investors who hold their Fund shares through tax-deferred arrangements, such as 401(k) plans or individual retirement accounts. In some cases, the Fund's return after taxes may exceed the Fund's return before taxes due to an assumed tax benefit from any losses on a sale of Fund shares at the end of the measurement period.
|
Global Managed Volatility Fund* |
1 Year |
5 Years |
10 Years |
Since Inception (7/27/2006) |
|||||||||||||||
|
Return Before Taxes |
11.34 |
% |
7.86 |
% |
7.03 |
% |
5.60 |
% |
|||||||||||
|
Return After Taxes on Distributions |
9.35 |
% |
5.59 |
% |
5.13 |
% |
4.10 |
% |
|||||||||||
|
Return After Taxes on Distributions and Sale of Fund Shares |
8.13 |
% |
5.80 |
% |
5.22 |
% |
4.13 |
% |
|||||||||||
|
MSCI All Country World ex-USA Index (Net) (reflects no deduction for fees or expenses) |
32.39 |
% |
7.91 |
% |
8.41 |
% |
5.29 |
% |
|||||||||||
|
MSCI World Minimum Volatility Index (Net) (reflects no deduction for fees or expenses) |
10.54 |
% |
6.29 |
% |
7.80 |
% |
7.02 |
% |
|||||||||||
|
MSCI World Index Return (Net) (reflects no deduction for fees or expenses) |
21.09 |
% |
12.15 |
% |
12.17 |
% |
8.46 |
% |
|||||||||||
* The Fund's Class I Shares commenced operations on June 29, 2007. Therefore, the Fund's average annual total returns for the periods prior to that time are based on the average annual total returns of the Class F Shares, adjusted for the higher expenses of the Class I Shares.
The bar chart and the performance table below provide some indication of the risks of investing in the Fund by showing changes in the Fund's performance from year to year for the past ten calendar years and by showing how the Fund's average annual returns for 1, 5 and 10 years, and since the Fund's inception, compare with those of a broad measure of market performance. The Fund's past performance (before and after taxes) is not necessarily an indication of how the Fund will perform in the future. For current performance information, please call 1-800-DIAL-SEI.
|
|
Best Quarter: 16.74% (12/31/2023) Worst Quarter: -22.80% (03/31/2020) |
||||||
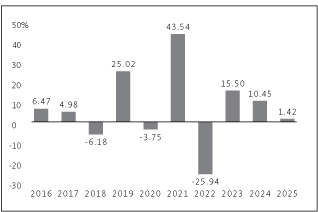
| Best Quarter: 16.74% (12/31/2023) Worst Quarter: -22.80% (03/31/2020) |
This table compares the Fund's average annual total returns to those of a broad-based securities market index and an additional index with characteristics relevant to the Fund's investment strategy.
After-tax returns are calculated using the historical highest individual federal marginal income tax rates and do not reflect the impact of state and local taxes. Your actual after-tax returns will depend on your tax
situation and may differ from those shown. After-tax returns shown are not relevant to investors who hold their Fund shares through tax-deferred arrangements, such as 401(k) plans or individual retirement accounts. In some cases, the Fund's return after taxes may exceed the Fund's return before taxes due to an assumed tax benefit from any losses on a sale of Fund shares at the end of the measurement period.
|
Real Estate Fund* |
1 Year |
5 Years |
10 Years |
Since Inception (11/13/2003) |
|||||||||||||||
|
Return Before Taxes |
1.42 |
% |
6.58 |
% |
5.67 |
% |
7.63 |
% |
|||||||||||
|
Return After Taxes on Distributions^ |
-1.41 |
% |
4.67 |
% |
3.28 |
% |
5.89 |
% |
|||||||||||
|
Return After Taxes on Distributions and Sale of Fund Shares^ |
2.31 |
% |
4.63 |
% |
3.75 |
% |
5.79 |
% |
|||||||||||
|
S&P 500 Index Return (reflects no deduction for fees, expenses or taxes) |
17.88 |
% |
14.42 |
% |
14.82 |
% |
10.89 |
% |
|||||||||||
|
Wilshire U.S. Real Estate Securities Index Return (reflects no deduction for fees, expenses or taxes) |
3.47 |
% |
7.04 |
% |
5.74 |
% |
8.10 |
% |
|||||||||||
* The Fund's Class I Shares commenced operations on October 1, 2007. Therefore, the Fund's average annual total returns for the periods prior to that time are based on the average annual total returns of the Class F Shares, adjusted for the higher expenses of the Class I Shares.
^ After tax figures are based on estimated amounts for the periods ended December 31, 2025.
The bar chart and the performance table below provide some indication of the risks of investing in the Fund by showing changes in the Fund's performance from year to year for the past ten calendar years and by showing how the Fund's average annual returns for 1, 5 and 10 years, and since the Fund's inception, compare with those of a broad measure of market performance. The Fund's past performance (before and after taxes) is not necessarily an indication of how the Fund will perform in the future. For current performance information, please call 1-800-DIAL-SEI.
|
|
Best Quarter: 7.12% (12/31/2023) Worst Quarter: -6.78% (03/31/2022) |
||||||
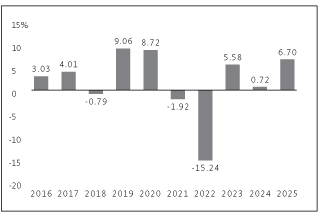
Best Quarter: 7.12% (12/31/2023)
Worst Quarter: -6.78% (03/31/2022)
After-tax returns are calculated using the historical highest individual federal marginal income tax rates and do not reflect the impact of state and local taxes. Your actual after-tax returns will depend on your tax situation and may differ from those shown. After-tax returns shown are not relevant to investors who hold their Fund shares through tax-deferred arrangements, such as 401(k) plans or individual retirement accounts. In some cases, the Fund's return after taxes may exceed the Fund's return before taxes due to an assumed tax benefit from any losses on a sale of Fund shares at the end of the measurement period.
|
Core Fixed Income Fund* |
1 Year |
5 Years |
10 Years |
Since Inception (5/1/1987) |
|||||||||||||||
|
Return Before Taxes |
6.70 |
% |
-1.16 |
% |
1.75 |
% |
4.85 |
% |
|||||||||||
|
Return After Taxes on Distributions |
5.26 |
% |
-2.28 |
% |
0.44 |
% |
2.97 |
% |
|||||||||||
|
Return After Taxes on Distributions and Sale of Fund Shares |
3.95 |
% |
-1.35 |
% |
0.79 |
% |
3.03 |
% |
|||||||||||
|
Bloomberg U.S. Aggregate Bond Index Return (reflects no deduction for fees, expenses or taxes) |
7.30 |
% |
-0.36 |
% |
2.01 |
% |
5.38 |
%^ |
|||||||||||
* The Fund's Class I Shares commenced operations on August 6, 2001. Therefore, the Fund's average annual total returns for the periods prior to that time are based on the average annual total returns of the Class F Shares, adjusted for the higher expenses of the Class I Shares.
^ The benchmark's "Since Inception" return period begins 4/30/1987 due to the index provider calculating only month-end data points at that time.
The bar chart and the performance table below provide some indication of the risks of investing in the Fund by showing changes in the Fund's performance from year to year for the past ten calendar years and by showing how the Fund's average annual returns for 1, 5 and 10 years, and since the Fund's inception, compare with those of a broad measure of market performance. The Fund's past performance (before and after taxes)
is not necessarily an indication of how the Fund will perform in the future. For current performance information, please call 1-800-DIAL-SEI.
|
|
Best Quarter: 8.78% (06/30/2020) Worst Quarter: -15.55% (03/31/2020) |
||||||
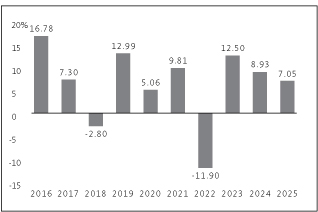
Best Quarter: 8.78% (06/30/2020)
Worst Quarter: -15.55% (03/31/2020)
This table compares the Fund's average annual total returns to those of a broad-based securities market index and an additional index with characteristics relevant to the Fund's investment strategy.
After-tax returns are calculated using the historical highest individual federal marginal income tax rates and do not reflect the impact of state and local taxes. Your actual after-tax returns will depend on your tax situation and may differ from those shown. After-tax returns shown are not relevant to investors who hold their Fund shares through tax-deferred arrangements, such as 401(k) plans or individual retirement accounts. In some cases, the Fund's return after taxes may exceed the Fund's return before taxes due to an assumed tax benefit from any losses on a sale of Fund shares at the end of the measurement period.
|
High Yield Bond Fund* |
1 Year |
5 Years |
10 Years |
Since Inception (1/11/1995) |
|||||||||||||||
|
Return Before Taxes |
7.05 |
% |
4.88 |
% |
6.26 |
% |
6.42 |
% |
|||||||||||
|
Return After Taxes on Distributions |
3.46 |
% |
1.05 |
% |
2.81 |
% |
3.03 |
% |
|||||||||||
|
Return After Taxes on Distributions and Sale of Fund Shares |
4.11 |
% |
2.00 |
% |
3.25 |
% |
3.39 |
% |
|||||||||||
|
Bloomberg U.S. Aggregate Bond Index Return (reflects no deduction for fees, expenses or taxes) |
7.30 |
% |
-0.36 |
% |
2.01 |
% |
4.63 |
% |
|||||||||||
|
ICE BofA U.S. High Yield Constrained Index Return (reflects no deduction for fees, expenses or taxes) |
8.50 |
% |
4.50 |
% |
6.44 |
% |
|||||||||||||
* The Fund's Class I Shares commenced operations on October 1, 2007. Therefore, the Fund's average annual total returns for the periods prior to that time are based on the average annual total returns of the Class F Shares, adjusted for the higher expenses of the Class I Shares.
† The ICE BofA U.S. High Yield Constrained Index Return for the "Since Inception" period is not provided because returns for the index are not available prior to 1996.
The bar chart and the performance table below provide some indication of the risks of investing in the Fund by showing changes in the Fund's performance from year to year for the past ten calendar years and by showing how the Fund's average annual returns for 1, 5 and 10 years, and since the Fund's inception, compare with those of a broad measure of market performance. The Fund's past performance (before and after taxes) is not necessarily an indication of how the Fund will perform in the future. For current performance information, please call 1-800-DIAL-SEI.
|
|
Best Quarter: 3.35% (03/31/2025) Worst Quarter: -3.25% (09/30/2022) As of January 31, 2026, Class I Shares of the Fund had not commenced operations and did not have a performance history. For full calendar years through December 31, 2025, the performance of the Fund's Class F Shares is shown. The Fund's Class F Shares are offered in a separate prospectus. Because Class I Shares would have been invested in the same portfolio of securities, returns for Class I Shares would have been substantially similar to those of Class F Shares, shown here, and would have differed only to the extent that the classes do not have the same total annual fund operating expenses. |
||||||
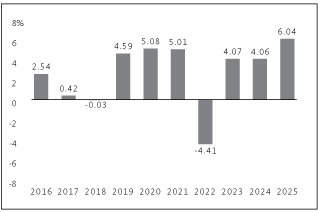
Best Quarter: 3.35% (03/31/2025)
Worst Quarter: -3.25% (09/30/2022)
As of January 31, 2026, Class I Shares of the Fund had not commenced operations and did not have a performance history. For full calendar years through December 31, 2025, the performance of the Fund's Class F Shares is shown. The Fund's Class F Shares are offered in a separate prospectus. Because Class I Shares would have been invested in the same portfolio of securities, returns for Class I Shares would have been substantially similar to those of Class F Shares, shown here, and would have differed only to the extent that the classes do not have the same total annual fund operating expenses.
This table compares the Fund's average annual total returns to those of a broad-based securities market index and an additional index with characteristics relevant to the Fund's investment strategy.
After-tax returns are calculated using the historical highest individual federal marginal income tax rates and do not reflect the impact of state and local taxes. Your actual after-tax returns will depend on your tax situation and may differ from those shown. After-tax returns shown are not relevant to investors who hold their Fund shares through tax-deferred arrangements, such as 401(k) plans or individual retirement accounts.
In some cases, the Fund's return after taxes may exceed the Fund's return before taxes due to an assumed tax benefit from any losses on a sale of Fund shares at the end of the measurement period.
|
Real Return Fund* |
1 Year |
5 Years |
10 Years |
Since Inception (7/2/2009) |
|||||||||||||||
|
Return Before Taxes |
6.04 |
% |
2.88 |
% |
2.69 |
% |
2.22 |
% |
|||||||||||
|
Return After Taxes on Distributions |
4.24 |
% |
1.06 |
% |
1.53 |
% |
1.28 |
% |
|||||||||||
|
Return After Taxes on Distributions and Sale of Fund Shares |
3.56 |
% |
1.40 |
% |
1.56 |
% |
1.32 |
% |
|||||||||||
|
Bloomberg U.S. Aggregate Bond Index Return (reflects no deduction for fees, expenses or taxes) |
7.30 |
% |
-0.36 |
% |
2.01 |
% |
2.81 |
% |
|||||||||||
|
Bloomberg 1-5 Year U.S. TIPS Index Return (reflects no deduction for fees, expenses or taxes) |
6.55 |
% |
3.32 |
% |
3.16 |
% |
2.67 |
% |
|||||||||||
* As of January 31, 2026, Class I Shares of the Fund had not commenced operations and did not have a performance history. For periods prior to December 31, 2025, the performance of the Fund's Class F Shares has been used. Returns for Class I Shares would have been substantially similar to those of Class F Shares and would have differed only to the extent that Class I Shares have higher total annual fund operating expenses than Class F Shares.
The bar chart and the performance table below provide some indication of the risks of investing in the Class Y Shares of the Fund by showing changes in the Fund's performance from year to year for the past ten calendar years and by showing how the Fund's average annual returns for 1, 5 and 10 years, and since the Fund's inception, compare with those of a broad measure of market performance. The Fund's past performance (before and after taxes) is not necessarily an indication of how the Fund will perform in the future. For current performance information, please call 1-800-DIAL-SEI.
|
|
Best Quarter: 20.29% (06/30/2020) Worst Quarter: -23.93% (03/31/2020) |
||||||
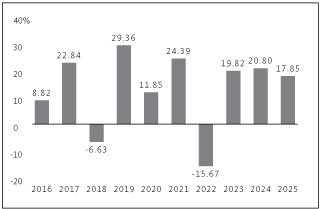
| Best Quarter: 20.29% (06/30/2020) Worst Quarter: -23.93% (03/31/2020) |
This table compares the Fund's average annual total returns to those of a broad-based securities market index and an additional index with characteristics relevant to the Fund's investment strategy.
After-tax returns are calculated using the historical highest individual federal marginal income tax rates and do not reflect the impact of state and local taxes. Your actual after-tax returns will depend on your tax situation and may differ from those shown. After-tax returns shown are not relevant to investors who hold their Fund shares through tax-deferred arrangements, such as 401(k) plans or individual retirement accounts. In some cases, the Fund's return after taxes may exceed the Fund's return before taxes due to an assumed tax benefit from any losses on a sale of Fund shares at the end of the measurement period.
|
Large Cap Fund* |
1 Year |
5 Years |
10 Years |
Since Inception (9/30/2009) |
|||||||||||||||
|
Return Before Taxes |
17.85 |
% |
12.34 |
% |
12.44 |
% |
12.32 |
% |
|||||||||||
|
Return After Taxes on Distributions |
12.80 |
% |
8.92 |
% |
9.82 |
% |
9.81 |
% |
|||||||||||
|
Return After Taxes on Distributions and Sale of Fund Shares |
14.00 |
% |
9.26 |
% |
9.66 |
% |
9.65 |
% |
|||||||||||
|
S&P 500 Index Return (reflects no deduction for fees, expenses or taxes) |
17.88 |
% |
14.42 |
% |
14.82 |
% |
14.29 |
% |
|||||||||||
|
Russell 1000 Index Return (reflects no deduction for fees, expenses or taxes) |
17.37 |
% |
13.59 |
% |
14.59 |
% |
14.18 |
% |
|||||||||||
* The Fund's Class Y Shares commenced operations on December 31, 2014. For periods prior to December 31, 2014, the performance of the Fund's Class F Shares has been used. Returns for Class Y Shares would have been substantially similar to those of Class F Shares and would have differed only to the extent that Class Y Shares have lower total annual fund operating expenses than Class F Shares.
The bar chart and the performance table below provide some indication of the risks of investing in the Class Y Shares of the Fund by showing changes in the Fund's performance from year to year for the past ten calendar years and by showing how the Fund's average annual returns for 1, 5 and 10 years, and since the Fund's inception, compare with those of a broad measure of market performance. The Fund's past performance (before and after taxes) is not necessarily an indication of how the Fund will perform in the future. For current performance information, please call 1-800-DIAL-SEI.
|
|
Best Quarter: 16.76% (12/31/2020) Worst Quarter: -29.95% (03/31/2020) |
||||||
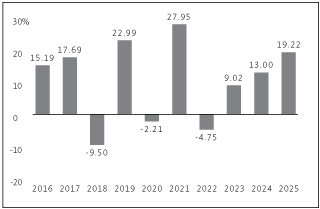
Best Quarter: 16.76% (12/31/2020)
Worst Quarter: -29.95% (03/31/2020)
This table compares the Fund's average annual total returns to those of a broad-based securities market index and an additional index with characteristics relevant to the Fund's investment strategy.
After-tax returns are calculated using the historical highest individual federal marginal income tax rates and do not reflect the impact of state and local taxes. Your actual after-tax returns will depend on your tax situation and may differ from those shown. After-tax returns shown are not relevant to investors who hold their Fund shares through tax-deferred arrangements, such as 401(k) plans or individual retirement accounts.
|
Large Cap Value Fund* |
1 Year |
5 Years |
10 Years |
Since Inception (10/3/1994) |
|||||||||||||||
|
Return Before Taxes |
19.22 |
% |
12.35 |
% |
10.20 |
% |
9.12 |
% |
|||||||||||
|
Return After Taxes on Distributions |
15.42 |
% |
9.99 |
% |
8.40 |
% |
7.49 |
% |
|||||||||||
|
Return After Taxes on Distributions and Sale of Fund Shares |
14.01 |
% |
9.52 |
% |
7.98 |
% |
7.27 |
% |
|||||||||||
|
S&P 500 Index Return (reflects no deduction for fees, expenses or taxes) |
17.88 |
% |
14.42 |
% |
14.82 |
% |
11.05 |
% |
|||||||||||
|
Russell 1000 Value Index Return (reflects no deduction for fees, expenses or taxes) |
15.91 |
% |
11.33 |
% |
10.53 |
% |
9.89 |
% |
|||||||||||
* The Fund's Class Y Shares commenced operations on October 30, 2015. For periods prior to October 30, 2015, the performance of the Fund's Class F Shares has been used. Returns for Class Y Shares would have been substantially similar to those of Class F Shares and would have differed only to the extent that Class Y Shares have lower total annual fund operating expenses than Class F Shares. The Fund's actual inception date is April 20, 1987. Between April 20, 1987 and October 3, 1994, the Fund was advised by a different investment adviser. Accordingly, performance shown in the chart above is from October 3, 1994.
The bar chart and the performance table below provide some indication of the risks of investing in the Class Y Shares of the Fund by showing changes in the Fund's performance from year to year for the past ten calendar years and by showing how the Fund's average annual returns for 1, 5 and 10 years, and since the Fund's inception, compare with those of a broad measure of market performance. The Fund's past performance (before and after taxes) is not necessarily an indication of how the Fund will perform in the future. For current performance information, please call 1-800-DIAL-SEI.
|
|
Best Quarter: 27.19% (06/30/2020) Worst Quarter: -20.16% (06/30/2022) |
||||||
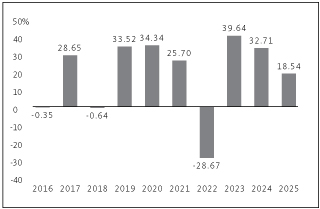
| Best Quarter: 27.19% (06/30/2020) Worst Quarter: -20.16% (06/30/2022) |
This table compares the Fund's average annual total returns to those of a broad-based securities market index and an additional index with characteristics relevant to the Fund's investment strategy.
After-tax returns are calculated using the historical highest individual federal marginal income tax rates and do not reflect the impact of state and local taxes. Your actual after-tax returns will depend on your tax situation and may differ from those shown. After-tax returns shown are not relevant to investors who hold their Fund shares through tax-deferred arrangements, such as 401(k) plans or individual retirement accounts.
In some cases, the Fund's return after taxes may exceed the Fund's return before taxes due to an assumed tax benefit from any losses on a sale of Fund shares at the end of the measurement period.
|
Large Cap Growth Fund* |
1 Year |
5 Years |
10 Years |
Since Inception (12/20/1994) |
|||||||||||||||
|
Return Before Taxes |
18.54 |
% |
14.52 |
% |
16.23 |
% |
10.60 |
% |
|||||||||||
|
Return After Taxes on Distributions |
12.59 |
% |
10.41 |
% |
13.13 |
% |
9.11 |
% |
|||||||||||
|
Return After Taxes on Distributions and Sale of Fund Shares |
14.16 |
% |
10.73 |
% |
12.75 |
% |
8.88 |
% |
|||||||||||
|
S&P 500 Index Return (reflects no deduction for fees, expenses or taxes) |
17.88 |
% |
14.42 |
% |
14.82 |
% |
11.14 |
% |
|||||||||||
|
Russell 1000 Growth Index Return (reflects no deduction for fees, expenses or taxes) |
18.56 |
% |
15.32 |
% |
18.13 |
% |
11.80 |
% |
|||||||||||
* The Fund's Class Y Shares commenced operations on October 30, 2015. For periods prior to October 30, 2015, the performance of the Fund's Class F Shares has been used. Returns for Class Y Shares would have been substantially similar to those of Class F Shares and would have differed only to the extent that Class Y Shares have lower total annual fund operating expenses than Class F Shares.
The bar chart and the performance table below provide some indication of the risks of investing in the Class Y Shares of the Fund by showing changes in the Fund's performance from year to year for the past ten calendar years and by showing how the Fund's average annual returns for 1, 5 and 10 years, and since the Fund's inception, compare with those of a broad measure of market performance. The Fund's past performance (before and after taxes) is not necessarily an indication of how the Fund will perform in the future. For current performance information, please call 1-800-DIAL-SEI.
|
|
Best Quarter: 18.53% (06/30/2020) Worst Quarter: -21.68% (03/31/2020) |
||||||
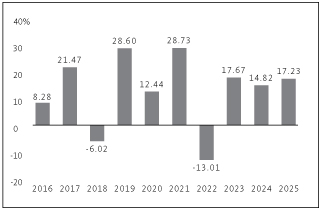
Best Quarter: 18.53% (06/30/2020)
Worst Quarter: -21.68% (03/31/2020)
This table compares the Fund's average annual total returns to those of a broad-based securities market index and an additional index with characteristics relevant to the Fund's investment strategy.
After-tax returns are calculated using the historical highest individual federal marginal income tax rates and do not reflect the impact of state and local taxes. Your actual after-tax returns will depend on your tax situation and may differ from those shown. After-tax returns shown are not relevant to investors who hold their Fund shares through tax-deferred arrangements, such as 401(k) plans or individual retirement accounts.
|
Tax-Managed Large Cap Fund* |
1 Year |
5 Years |
10 Years |
Since Inception (3/5/1998) |
|||||||||||||||
|
Return Before Taxes |
17.23 |
% |
12.14 |
% |
12.23 |
% |
7.49 |
% |
|||||||||||
|
Return After Taxes on Distributions |
16.72 |
% |
10.70 |
% |
11.07 |
% |
6.87 |
% |
|||||||||||
|
Return After Taxes on Distributions and Sale of Fund Shares |
10.53 |
% |
9.42 |
% |
9.89 |
% |
6.28 |
% |
|||||||||||
|
S&P 500 Index Return (reflects no deduction for fees, expenses or taxes) |
17.88 |
% |
14.42 |
% |
14.82 |
% |
8.98 |
% |
|||||||||||
|
Russell 1000 Index Return (reflects no deduction for fees, expenses or taxes) |
17.37 |
% |
13.59 |
% |
14.59 |
% |
9.06 |
% |
|||||||||||
* The Fund's Class Y Shares commenced operations on December 31, 2014. For periods prior to December 31, 2014, the performance of the Fund's Class F Shares has been used. Returns for Class Y Shares would have been substantially similar to those of Class F Shares and would have differed only to the extent that Class Y Shares have lower total annual fund operating expenses than Class F Shares.
The bar chart and the performance table below provide some indication of the risks of investing in the Class Y Shares of the Fund by showing changes in the Fund's performance from year to year for the past ten calendar years and by showing how the Fund's average annual returns for 1, 5 and 10 years, and since the Fund's inception, compare with those of a broad measure of market performance. The Fund's past performance (before and after taxes) is not necessarily an indication of how the Fund will perform in the future. For current performance information, please call 1-800-DIAL-SEI.
|
|
Best Quarter: 28.39% (12/31/2020) Worst Quarter: -31.17% (03/31/2020) |
||||||
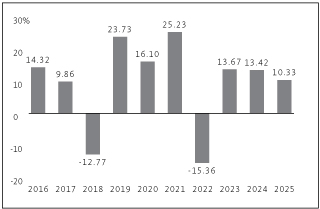
Best Quarter: 28.39% (12/31/2020)
Worst Quarter: -31.17% (03/31/2020)
This table compares the Fund's average annual total returns to those of a broad-based securities market index and an additional index with characteristics relevant to the Fund's investment strategy.
After-tax returns are calculated using the historical highest individual federal marginal income tax rates and do not reflect the impact of state and local taxes. Your actual after-tax returns will depend on your tax situation and may differ from those shown. After-tax returns shown are not relevant to investors who hold their Fund shares through tax-deferred arrangements, such as 401(k) plans or individual retirement accounts. In some cases, the Fund's return after taxes may exceed the Fund's return before taxes due to an assumed tax benefit from any losses on a sale of Fund shares at the end of the measurement period.
|
Small Cap Fund* |
1 Year |
5 Years |
10 Years |
Since Inception (9/30/2009) |
|||||||||||||||
|
Return Before Taxes |
10.33 |
% |
8.56 |
% |
9.02 |
% |
9.75 |
% |
|||||||||||
|
Return After Taxes on Distributions |
7.76 |
% |
5.79 |
% |
7.00 |
% |
7.61 |
% |
|||||||||||
|
Return After Taxes on Distributions and Sale of Fund Shares |
7.97 |
% |
6.14 |
% |
6.78 |
% |
7.42 |
% |
|||||||||||
|
S&P 500 Index Return (reflects no deduction for fees, expenses or taxes) |
17.88 |
% |
14.42 |
% |
14.82 |
% |
14.29 |
% |
|||||||||||
|
Russell 2000 Index Return (reflects no deduction for fees, expenses or taxes) |
12.81 |
% |
6.09 |
% |
9.62 |
% |
10.57 |
% |
|||||||||||
* The Fund's Class Y Shares commenced operations on December 31, 2014. For periods prior to December 31, 2014, the performance of the Fund's Class F Shares has been used. Returns for Class Y Shares would have been substantially similar to those of Class F Shares and would have differed only to the extent that Class Y Shares have lower total annual fund operating expenses than Class F Shares.
The bar chart and the performance table below provide some indication of the risks of investing in the Class Y Shares of the Fund by showing changes in the Fund's performance from year to year for the past ten calendar years and by showing how the Fund's average annual returns for 1, 5 and 10 years, and since the Fund's inception, compare with those of a broad measure of market performance. The Fund's past performance (before and after taxes) is not necessarily an indication of how the Fund will perform in the future. For current performance information, please call 1-800-DIAL-SEI.
|
|
Best Quarter: 30.55% (12/31/2020) Worst Quarter: -39.10% (03/31/2020) |
||||||
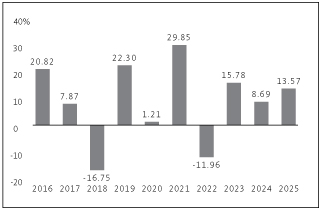
| Best Quarter: 30.55% (12/31/2020) Worst Quarter: -39.10% (03/31/2020) |
This table compares the Fund's average annual total returns to those of a broad-based securities market index and an additional index with characteristics relevant to the Fund's investment strategy.
After-tax returns are calculated using the historical highest individual federal marginal income tax rates and do not reflect the impact of state and local taxes. Your actual after-tax returns will depend on your tax situation and may differ from those shown. After-tax returns shown are not relevant to investors who hold their Fund shares through tax-deferred arrangements, such as 401(k) plans or individual retirement accounts.
|
Small Cap Value Fund* |
1 Year |
5 Years |
10 Years |
Since Inception (12/20/1994) |
|||||||||||||||
|
Return Before Taxes |
13.57 |
% |
10.32 |
% |
8.17 |
% |
9.30 |
% |
|||||||||||
|
Return After Taxes on Distributions |
11.16 |
% |
7.98 |
% |
6.39 |
% |
7.59 |
% |
|||||||||||
|
Return After Taxes on Distributions and Sale of Fund Shares |
9.64 |
% |
7.88 |
% |
6.26 |
% |
7.41 |
% |
|||||||||||
|
S&P 500 Index Return (reflects no deduction for fees, expenses or taxes) |
17.88 |
% |
14.42 |
% |
14.82 |
% |
11.14 |
% |
|||||||||||
|
Russell 2000 Value Index Return (reflects no deduction for fees, expenses or taxes) |
12.59 |
% |
8.88 |
% |
9.27 |
% |
9.86 |
% |
|||||||||||
* The Fund's Class Y Shares commenced operations on October 30, 2015. For periods prior to October 30, 2015, the performance of the Fund's Class F Shares has been used. Returns for Class Y Shares would have been substantially similar to those of Class F Shares and would have differed only to the extent that Class Y Shares have lower total annual fund operating expenses than Class F Shares.
The bar chart and the performance table below provide some indication of the risks of investing in the Class Y Shares of the Fund by showing changes in the Fund's performance from year to year for the past ten calendar years and by showing how the Fund's average annual returns for 1, 5 and 10 years, and since the Fund's
inception, compare with those of a broad measure of market performance. The Fund's past performance (before and after taxes) is not necessarily an indication of how the Fund will perform in the future. For current performance information, please call 1-800-DIAL-SEI.
|
|
Best Quarter: 30.08% (06/30/2020) Worst Quarter: -31.47% (03/31/2020) |
||||||
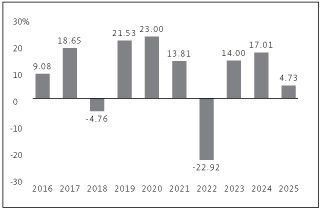
| Best Quarter: 30.08% (06/30/2020) Worst Quarter: -31.47% (03/31/2020) |
This table compares the Fund's average annual total returns to those of a broad-based securities market index and an additional index with characteristics relevant to the Fund's investment strategy.
After-tax returns are calculated using the historical highest individual federal marginal income tax rates and do not reflect the impact of state and local taxes. Your actual after-tax returns will depend on your tax situation and may differ from those shown. After-tax returns shown are not relevant to investors who hold their Fund shares through tax-deferred arrangements, such as 401(k) plans or individual retirement accounts. In some cases, the Fund's return after taxes may exceed the Fund's return before taxes due to an assumed tax benefit from any losses on a sale of Fund shares at the end of the measurement period.
|
Small Cap Growth Fund* |
1 Year |
5 Years |
10 Years |
Since Inception (4/20/1992) |
|||||||||||||||
|
Return Before Taxes |
4.73 |
% |
4.15 |
% |
8.48 |
% |
8.82 |
% |
|||||||||||
|
Return After Taxes on Distributions |
2.38 |
% |
1.92 |
% |
6.83 |
% |
7.42 |
% |
|||||||||||
|
Return After Taxes on Distributions and Sale of Fund Shares |
4.49 |
% |
2.78 |
% |
6.50 |
% |
7.11 |
% |
|||||||||||
|
S&P 500 Index Return (reflects no deduction for fees, expenses or taxes) |
17.88 |
% |
14.42 |
% |
14.82 |
% |
10.83 |
% |
|||||||||||
|
Russell 2000 Growth Index Return (reflects no deduction for fees, expenses or taxes) |
13.01 |
% |
3.18 |
% |
9.57 |
% |
8.07 |
% |
|||||||||||
* The Fund's Class Y Shares commenced operations on October 30, 2015. For periods prior to October 30, 2015, the performance of the Fund's Class F Shares has been used. Returns for Class Y Shares would have been substantially similar to those of Class F Shares and would have differed only to the extent that Class Y Shares have lower total annual fund operating expenses than Class F Shares.
The bar chart and the performance table below provide some indication of the risks of investing in the Class Y Shares of the Fund by showing changes in the Fund's performance from year to year for the past ten calendar years and by showing how the Fund's average annual returns for 1, 5 and 10 years, and since the Fund's
inception, compare with those of a broad measure of market performance. The Fund's past performance (before and after taxes) is not necessarily an indication of how the Fund will perform in the future. For current performance information, please call 1-800-DIAL-SEI.
|
|
Best Quarter: 24.54% (12/31/2020) Worst Quarter: -30.71% (03/31/2020) |
||||||
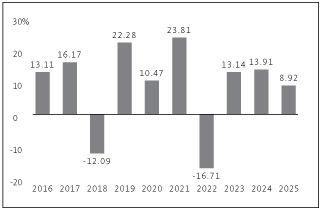
Best Quarter: 24.54% (12/31/2020)
Worst Quarter: -30.71% (03/31/2020)
This table compares the Fund's average annual total returns to those of a broad-based securities market index and an additional index with characteristics relevant to the Fund's investment strategy.
After-tax returns are calculated using the historical highest individual federal marginal income tax rates and do not reflect the impact of state and local taxes. Your actual after-tax returns will depend on your tax situation and may differ from those shown. After-tax returns shown are not relevant to investors who hold their Fund shares through tax-deferred arrangements, such as 401(k) plans or individual retirement accounts. In some cases, the Fund's return after taxes may exceed the Fund's return before taxes due to an assumed tax benefit from any losses on a sale of Fund shares at the end of the measurement period.
|
Tax-Managed Small/Mid Cap Fund* |
1 Year |
5 Years |
10 Years |
Since Inception (10/31/2000) |
|||||||||||||||
|
Return Before Taxes |
8.92 |
% |
7.68 |
% |
8.49 |
% |
7.18 |
% |
|||||||||||
|
Return After Taxes on Distributions |
7.76 |
% |
5.84 |
% |
7.20 |
% |
6.36 |
% |
|||||||||||
|
Return After Taxes on Distributions and Sale of Fund Shares |
6.10 |
% |
5.91 |
% |
6.74 |
% |
5.97 |
% |
|||||||||||
|
S&P 500 Index Return (reflects no deduction for fees, expenses or taxes) |
17.88 |
% |
14.42 |
% |
14.82 |
% |
8.43 |
% |
|||||||||||
|
Russell 2500 Index Return (reflects no deduction for fees, expenses or taxes) |
11.91 |
% |
7.26 |
% |
10.40 |
% |
8.89 |
% |
|||||||||||
* The Fund's Class Y Shares commenced operations on December 31, 2014. For periods prior to December 31, 2014, the performance of the Fund's Class F Shares has been used. Returns for Class Y Shares would have been substantially similar to those of Class F Shares and would have differed only to the extent that Class Y Shares have lower total annual fund operating expenses than Class F Shares.
The bar chart and the performance table below provide some indication of the risks of investing in the Class Y Shares of the Fund by showing changes in the Fund's performance from year to year for the past ten calendar years and by showing how the Fund's average annual returns for 1, 5 and 10 years, and since the Fund's inception, compare with those of a broad measure of market performance. The Fund's past performance (before and after taxes) is not necessarily an indication of how the Fund will perform in the future. For current performance information, please call 1-800-DIAL-SEI.
|
|
Best Quarter: 24.39% (06/30/2020) Worst Quarter: -30.42% (03/31/2020) |
||||||
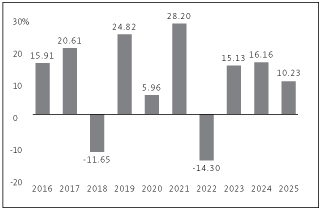
Best Quarter: 24.39% (06/30/2020)
Worst Quarter: -30.42% (03/31/2020)
This table compares the Fund's average annual total returns to those of a broad-based securities market index and an additional index with characteristics relevant to the Fund's investment strategy.
After-tax returns are calculated using the historical highest individual federal marginal income tax rates and do not reflect the impact of state and local taxes. Your actual after-tax returns will depend on your tax situation and may differ from those shown. After-tax returns shown are not relevant to investors who hold their Fund shares through tax-deferred arrangements, such as 401(k) plans or individual retirement accounts. In some cases, the Fund's return after taxes may exceed the Fund's return before taxes due to an assumed tax benefit from any losses on a sale of Fund shares at the end of the measurement period.
|
Mid-Cap Fund* |
1 Year |
5 Years |
10 Years |
Since Inception (2/16/1993) |
|||||||||||||||
|
Return Before Taxes |
10.23 |
% |
10.12 |
% |
10.22 |
% |
9.93 |
% |
|||||||||||
|
Return After Taxes on Distributions |
5.27 |
% |
7.38 |
% |
8.03 |
% |
8.07 |
% |
|||||||||||
|
Return After Taxes on Distributions and Sale of Fund Shares |
9.46 |
% |
7.51 |
% |
7.76 |
% |
7.88 |
% |
|||||||||||
|
S&P 500 Index Return (reflects no deduction for fees, expenses or taxes) |
17.88 |
% |
14.42 |
% |
14.82 |
% |
10.84 |
% |
|||||||||||
|
Russell Midcap Index Return (reflects no deduction for fees, expenses or taxes) |
10.60 |
% |
8.67 |
% |
11.01 |
% |
10.91 |
% |
|||||||||||
* The Fund's Class Y Shares commenced operations on October 30, 2015. For periods prior to October 30, 2015, the performance of the Fund's Class F Shares has been used. Returns for Class Y Shares would have been substantially similar to those of Class F Shares and would have differed only to the extent that Class Y Shares have lower total annual fund operating expenses than Class F Shares.
The bar chart and the performance table below provide some indication of the risks of investing in the Class Y Shares of the Fund by showing changes in the Fund's performance from year to year for the past ten calendar years and by showing how the Fund's average annual returns for 1, 5 and 10 years, and since the Fund's inception, compare with those of a broad measure of market performance. The Fund's past performance
(before and after taxes) is not necessarily an indication of how the Fund will perform in the future. For current performance information, please call 1-800-DIAL-SEI.
|
|
Best Quarter: 13.43% (12/31/2022) Worst Quarter: -23.09% (03/31/2020) |
||||||
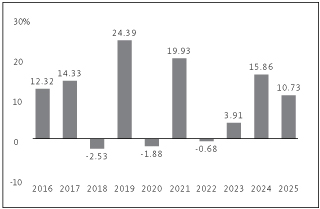
| Best Quarter: 13.43% (12/31/2022) Worst Quarter: -23.09% (03/31/2020) |
This table compares the Fund's average annual total returns to those of the S&P 500 Index (a broad-based securities market index), and two additional indexes with characteristics relevant to the Fund's investment strategy.
After-tax returns are calculated using the historical highest individual federal marginal income tax rates and do not reflect the impact of state and local taxes. Your actual after-tax returns will depend on your tax situation and may differ from those shown. After-tax returns shown are not relevant to investors who hold their Fund shares through tax-deferred arrangements, such as 401(k) plans or individual retirement accounts. In some cases, the Fund's return after taxes may exceed the Fund's return before taxes due to an assumed tax benefit from any losses on a sale of Fund shares at the end of the measurement period.
|
U.S. Managed Volatility Fund* |
1 Year |
5 Years |
10 Years |
Since Inception (10/28/2004) |
|||||||||||||||
|
Return Before Taxes |
10.73 |
% |
9.69 |
% |
9.27 |
% |
8.91 |
% |
|||||||||||
|
Return After Taxes on Distributions |
6.57 |
% |
5.80 |
% |
6.46 |
% |
6.90 |
% |
|||||||||||
|
Return After Taxes on Distributions and Sale of Fund Shares |
8.92 |
% |
6.96 |
% |
6.90 |
% |
6.93 |
% |
|||||||||||
|
S&P 500 Index Return (reflects no deduction for fees, expenses or taxes) |
17.88 |
% |
14.42 |
% |
14.82 |
% |
11.00 |
% |
|||||||||||
|
MSCI USA Minimum Volatility Index (Net) (reflects no deduction for fees, expenses or taxes) |
7.31 |
% |
8.01 |
% |
9.92 |
% |
8.98 |
% |
|||||||||||
|
Russell 3000 Index Return (reflects no deduction for fees, expenses or taxes) |
17.15 |
% |
13.15 |
% |
14.29 |
% |
10.88 |
% |
|||||||||||
* The Fund's Class Y Shares commenced operations on December 31, 2014. For periods prior to December 31, 2014, the performance of the Fund's Class F Shares has been used. Returns for Class Y Shares would have been substantially similar to those of Class F Shares and would have differed only to the extent that Class Y Shares have lower total annual fund operating expenses than Class F Shares.
The bar chart and the performance table below provide some indication of the risks of investing in the Class Y Shares of the Fund by showing changes in the Fund's performance from year to year for the past ten calendar years and by showing how the Fund's average annual returns for 1, 5 and 10 years, and since the Fund's inception, compare with those of a broad measure of market performance. The Fund's past performance (before and after taxes) is not necessarily an indication of how the Fund will perform in the future. For current performance information, please call 1-800-DIAL-SEI.
|
|
Best Quarter: 10.66% (06/30/2020) Worst Quarter: -19.18% (03/31/2020) |
||||||
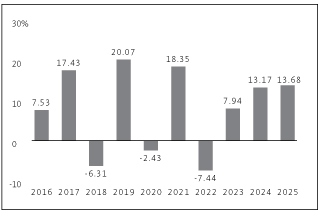
Best Quarter: 10.66% (06/30/2020)
Worst Quarter: -19.18% (03/31/2020)
This table compares the Fund's average annual total returns to those of the MSCI All Country World ex-USA Index (Net) (a broad-based securities market index), and two additional indexes with characteristics relevant to the Fund's investment strategy.
After-tax returns are calculated using the historical highest individual federal marginal income tax rates and do not reflect the impact of state and local taxes. Your actual after-tax returns will depend on your tax situation and may differ from those shown. After-tax returns shown are not relevant to investors who hold their Fund shares through tax-deferred arrangements, such as 401(k) plans or individual retirement accounts. In some cases, the Fund's return after taxes may exceed the Fund's return before taxes due to an assumed tax benefit from any losses on a sale of Fund shares at the end of the measurement period.
|
Global Managed Volatility Fund* |
1 Year |
5 Years |
10 Years |
Since Inception (7/27/2006) |
|||||||||||||||
|
Return Before Taxes |
13.68 |
% |
8.75 |
% |
7.75 |
% |
6.12 |
% |
|||||||||||
|
Return After Taxes on Distributions |
11.42 |
% |
6.37 |
% |
5.72 |
% |
4.48 |
% |
|||||||||||
|
Return After Taxes on Distributions and Sale of Fund Shares |
9.71 |
% |
6.47 |
% |
5.75 |
% |
4.46 |
% |
|||||||||||
|
MSCI All Country World ex-USA Index (Net) (reflects no deduction for fees or expenses) |
32.39 |
% |
7.91 |
% |
8.41 |
% |
5.29 |
% |
|||||||||||
|
MSCI World Minimum Volatility Index (Net) (reflects no deduction for fees or expenses) |
10.54 |
% |
6.29 |
% |
7.80 |
% |
7.02 |
% |
|||||||||||
|
MSCI World Index Return (Net) (reflects no deduction for fees or expenses) |
21.09 |
% |
12.15 |
% |
12.17 |
% |
8.46 |
% |
|||||||||||
* The Fund's Class Y Shares commenced operations on December 31, 2014. For periods prior to December 31, 2014, the performance of the Fund's Class F Shares has been used. Returns for Class Y Shares would have been substantially similar to those of Class F Shares and would have differed only to the extent that Class Y Shares have lower total annual fund operating expenses than Class F Shares.
The bar chart and the performance table below provide some indication of the risks of investing in the Class Y Shares of the Fund by showing changes in the Fund's performance from year to year for the past ten calendar years and by showing how the Fund's average annual returns for 1, 5 and 10 years, and since the Fund's inception, compare with those of a broad measure of market performance. The Fund's past performance (before and after taxes) is not necessarily an indication of how the Fund will perform in the future. For current performance information, please call 1-800-DIAL-SEI.
|
|
Best Quarter: 11.91% (06/30/2020) Worst Quarter: -20.26% (03/31/2020) |
||||||
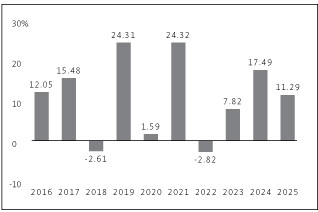
| Best Quarter: 11.91% (06/30/2020) Worst Quarter: -20.26% (03/31/2020) |
This table compares the Fund's average annual total returns to those of the S&P 500 Index (a broad-based securities market index), and two additional indexes with characteristics relevant to the Fund's investment strategy.
After-tax returns are calculated using the historical highest individual federal marginal income tax rates and do not reflect the impact of state and local taxes. Your actual after-tax returns will depend on your tax situation and may differ from those shown. After-tax returns shown are not relevant to investors who hold their Fund shares through tax-deferred arrangements, such as 401(k) plans or individual retirement accounts. In some cases, the Fund's return after taxes may exceed the Fund's return before taxes due to an assumed tax benefit from any losses on a sale of Fund shares at the end of the measurement period.
|
Tax-Managed Managed Volatility Fund* |
1 Year |
5 Years |
10 Years |
Since Inception (12/20/2007) |
|||||||||||||||
|
Return Before Taxes |
11.29 |
% |
11.24 |
% |
10.49 |
% |
9.51 |
% |
|||||||||||
|
Return After Taxes on Distributions |
5.84 |
% |
7.80 |
% |
8.25 |
% |
7.73 |
% |
|||||||||||
|
Return After Taxes on Distributions and Sale of Fund Shares |
10.56 |
% |
8.61 |
% |
8.28 |
% |
7.59 |
% |
|||||||||||
|
S&P 500 Index Return (reflects no deduction for fees, expenses or taxes) |
17.88 |
% |
14.42 |
% |
14.82 |
% |
11.06 |
% |
|||||||||||
|
MSCI USA Minimum Volatility Index (Net) (reflects no deduction for fees, expenses or taxes) |
7.31 |
% |
8.01 |
% |
9.92 |
% |
8.87 |
% |
|||||||||||
|
Russell 3000 Index Return (reflects no deduction for fees, expenses or taxes) |
17.15 |
% |
13.15 |
% |
14.29 |
% |
10.83 |
% |
|||||||||||
* The Fund's Class Y Shares commenced operations on April 30, 2015. For periods prior to April 30, 2015, the performance of the Fund's Class F Shares has been used. Returns for Class Y Shares would have been substantially similar to those of Class F Shares and would have differed only to the extent that Class Y Shares have lower total annual fund operating expenses than Class F Shares.
The bar chart and the performance table below provide some indication of the risks of investing in the Class Y Shares of the Fund by showing changes in the Fund's performance from year to year for the past nine calendar years and by showing how the Fund's average annual returns for 1 and 5 years and since the Fund's inception compare with those of a broad measure of market performance. The Fund's past performance (before and after taxes) is not necessarily an indication of how the Fund will perform in the future. For current performance information, please call 1-800-DIAL-SEI.
|
|
Best Quarter: 14.39% (12/31/2022) Worst Quarter: -20.29% (03/31/2020) |
||||||
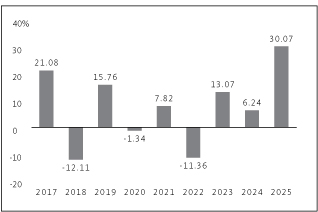
| Best Quarter: 14.39% (12/31/2022) Worst Quarter: -20.29% (03/31/2020) |
This table compares the Fund's average annual total returns to those of the MSCI All Country World ex-USA Index (Net) (a broad-based securities market index), and two additional indexes with characteristics relevant to the Fund's investment strategy.
After-tax returns are calculated using the historical highest individual federal marginal income tax rates and do not reflect the impact of state and local taxes. Your actual after-tax returns will depend on your tax situation and may differ from those shown. After-tax returns shown are not relevant to investors who hold their Fund shares through tax-deferred arrangements, such as 401(k) plans or individual retirement accounts.
|
Tax-Managed International Managed Volatility Fund — Class Y |
1 Year |
5 Years |
Since Inception (10/17/2016) |
||||||||||||
|
Return Before Taxes |
30.07 |
% |
8.35 |
% |
6.54 |
% |
|||||||||
|
Return After Taxes on Distributions |
29.38 |
% |
7.50 |
% |
5.89 |
% |
|||||||||
|
Return After Taxes on Distributions and Sale of Fund Shares |
18.72 |
% |
6.49 |
% |
5.22 |
% |
|||||||||
|
MSCI All Country World ex-USA Index (Net) (reflects no deduction for fees or expenses) |
32.39 |
% |
7.91 |
% |
8.75 |
% |
|||||||||
|
MSCI EAFE Minimum Volatility Index (Net) (reflects no deduction for fees or expenses) |
25.79 |
% |
6.20 |
% |
6.39 |
% |
|||||||||
|
MSCI EAFE Index Return (Net) (reflects no deduction for fees or expenses) |
31.22 |
% |
8.92 |
% |
9.03 |
% |
|||||||||
The bar chart and the performance table below provide some indication of the risks of investing in the Class Y Shares of the Fund by showing changes in the Fund's performance from year to year for the past ten calendar years and by showing how the Fund's average annual returns for 1, 5 and 10 years, and since the Fund's inception, compare with those of a broad measure of market performance. The Fund's past performance (before and after taxes) is not necessarily an indication of how the Fund will perform in the future. For current performance information, please call 1-800-DIAL-SEI.
|
|
Best Quarter: 16.93% (12/31/2023) Worst Quarter: -22.71% (03/31/2020) |
||||||
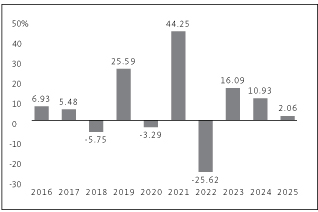
Best Quarter: 16.93% (12/31/2023)
Worst Quarter: -22.71% (03/31/2020)
This table compares the Fund's average annual total returns to those of a broad-based securities market index and an additional index with characteristics relevant to the Fund's investment strategy.
After-tax returns are calculated using the historical highest individual federal marginal income tax rates and do not reflect the impact of state and local taxes. Your actual after-tax returns will depend on your tax situation and may differ from those shown. After-tax returns shown are not relevant to investors who hold their Fund shares through tax-deferred arrangements, such as 401(k) plans or individual retirement accounts. In some cases, the Fund's return after taxes may exceed the Fund's return before taxes due to an assumed tax benefit from any losses on a sale of Fund shares at the end of the measurement period.
|
Real Estate Fund* |
1 Year |
5 Years |
10 Years |
Since Inception (11/13/2003) |
|||||||||||||||
|
Return Before Taxes |
2.06 |
% |
7.12 |
% |
6.18 |
% |
8.02 |
% |
|||||||||||
|
Return After Taxes on Distributions^ |
-1.03 |
% |
4.99 |
% |
3.58 |
% |
6.14 |
% |
|||||||||||
|
Return After Taxes on Distributions and Sale of Fund Shares^ |
2.69 |
% |
4.96 |
% |
4.04 |
% |
6.04 |
% |
|||||||||||
|
S&P 500 Index Return (reflects no deduction for fees, expenses or taxes) |
17.88 |
% |
14.42 |
% |
14.82 |
% |
10.89 |
% |
|||||||||||
|
Wilshire U.S. Real Estate Securities Index Return (reflects no deduction for fees, expenses or taxes) |
3.47 |
% |
7.04 |
% |
5.74 |
% |
8.10 |
% |
|||||||||||
* The Fund's Class Y Shares commenced operations on December 31, 2014. For periods prior to December 31, 2014, the performance of the Fund's Class F Shares has been used. Returns for Class Y Shares would have been substantially similar to those of Class F Shares and would have differed only to the extent that Class Y Shares have lower total annual fund operating expenses than Class F Shares.
^ After tax figures are based on estimated amounts for the periods ended December 31, 2025.
The bar chart and the performance table below provide some indication of the risks of investing in the Class Y Shares of the Fund by showing changes in the Fund's performance from year to year for the past ten calendar years and by showing how the Fund's average annual returns for 1, 5 and 10 years, and since the Fund's inception, compare with those of a broad measure of market performance. The Fund's past performance (before and after taxes) is not necessarily an indication of how the Fund will perform in the future. For current performance information, please call 1-800-DIAL-SEI.
|
|
Best Quarter: 7.35% (12/31/2023) Worst Quarter: -6.74% (03/31/2022) |
||||||
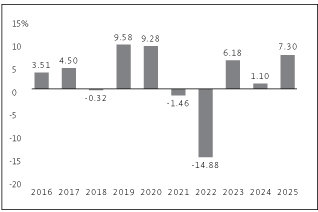
Best Quarter: 7.35% (12/31/2023)
Worst Quarter: -6.74% (03/31/2022)
After-tax returns are calculated using the historical highest individual federal marginal income tax rates and do not reflect the impact of state and local taxes. Your actual after-tax returns will depend on your tax situation and may differ from those shown. After-tax returns shown are not relevant to investors who hold their Fund shares through tax-deferred arrangements, such as 401(k) plans or individual retirement accounts. In some cases, the Fund's return after taxes may exceed the Fund's return before taxes due to an assumed tax benefit from any losses on a sale of Fund shares at the end of the measurement period.
|
Core Fixed Income Fund* |
1 Year |
5 Years |
10 Years |
Since Inception (5/1/1987) |
|||||||||||||||
|
Return Before Taxes |
7.30 |
% |
-0.69 |
% |
2.24 |
% |
5.28 |
% |
|||||||||||
|
Return After Taxes on Distributions |
5.65 |
% |
-1.99 |
% |
0.73 |
% |
3.31 |
% |
|||||||||||
|
Return After Taxes on Distributions and Sale of Fund Shares |
4.30 |
% |
-1.08 |
% |
1.07 |
% |
3.35 |
% |
|||||||||||
|
Bloomberg U.S. Aggregate Bond Index Return (reflects no deduction for fees, expenses or taxes) |
7.30 |
% |
-0.36 |
% |
2.01 |
% |
5.38 |
%^ |
|||||||||||
* The Fund's Class Y Shares commenced operations on June 30, 2015. For periods prior to June 30, 2015, the performance of the Fund's Class F Shares has been used. Returns for Class Y Shares would have been substantially similar to those of Class F Shares and would have differed only to the extent that Class Y Shares have lower total annual fund operating expenses than Class F Shares.
^ The benchmark's "Since Inception" return period begins 4/30/1987 due to the index provider calculating only month-end data points at that time.
The bar chart and the performance table below provide some indication of the risks of investing in the Class Y Shares of the Fund by showing changes in the Fund's performance from year to year for the past ten calendar years and by showing how the Fund's average annual returns for 1, 5 and 10 years, and since the Fund's inception, compare with those of a broad measure of market performance. The Fund's past performance
(before and after taxes) is not necessarily an indication of how the Fund will perform in the future. For current performance information, please call 1-800-DIAL-SEI.
|
|
Best Quarter: 8.99% (06/30/2020) Worst Quarter: -15.55% (03/31/2020) |
||||||
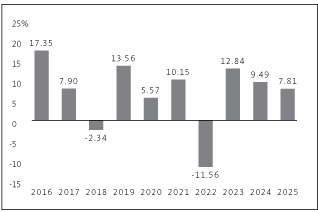
|
| Best Quarter: 8.99% (06/30/2020) Worst Quarter: -15.55% (03/31/2020 | ||||||
This table compares the Fund's average annual total returns to those of a broad-based securities market index and an additional index with characteristics relevant to the Fund's investment strategy.
After-tax returns are calculated using the historical highest individual federal marginal income tax rates and do not reflect the impact of state and local taxes. Your actual after-tax returns will depend on your tax situation and may differ from those shown. After-tax returns shown are not relevant to investors who hold their Fund shares through tax-deferred arrangements, such as 401(k) plans or individual retirement accounts. In some cases, the Fund's return after taxes may exceed the Fund's return before taxes due to an assumed tax benefit from any losses on a sale of Fund shares at the end of the measurement period.
|
High Yield Bond Fund* |
1 Year |
5 Years |
10 Years |
Since Inception (1/11/1995) |
|||||||||||||||
|
Return Before Taxes |
7.81 |
% |
5.35 |
% |
6.76 |
% |
6.81 |
% |
|||||||||||
|
Return After Taxes on Distributions |
4.00 |
% |
1.37 |
% |
3.13 |
% |
3.34 |
% |
|||||||||||
|
Return After Taxes on Distributions and Sale of Fund Shares |
4.55 |
% |
2.29 |
% |
3.56 |
% |
3.65 |
% |
|||||||||||
|
Bloomberg U.S. Aggregate Bond Index Return (reflects no deduction for fees, expenses or taxes) |
7.30 |
% |
-0.36 |
% |
2.01 |
% |
4.63 |
% |
|||||||||||
|
ICE BofA U.S. High Yield Constrained Index Return (reflects no deduction for fees, expenses or taxes) |
8.50 |
% |
4.50 |
% |
6.44 |
% |
|||||||||||||
* The Fund's Class Y Shares commenced operations on December 31, 2014. For periods prior to December 31, 2014, the performance of the Fund's Class F Shares has been used. Returns for Class Y Shares would have been substantially similar to those of Class F Shares and would have differed only to the extent that Class Y Shares have lower total annual fund operating expenses than Class F Shares.
† The ICE BofA U.S. High Yield Constrained Index Return for the "Since Inception" period is not provided because returns for the index are not available prior to 1996.
The bar chart and the performance table below provide some indication of the risks of investing in the Fund by showing changes in the Fund's performance from year to year for the past nine calendar years and by showing how the Fund's average annual returns for 1 and 5 years and since the Fund's inception compare with those of a broad measure of market performance. The Fund's past performance (before and after taxes) is not necessarily an indication of how the Fund will perform in the future. For current performance information, please call 1-800-DIAL-SEI.
|
|
Best Quarter: 1.42% (09/30/2024) Worst Quarter: 0.00% (06/30/2021) |
||||||
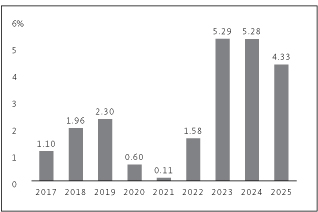
| Best Quarter: 1.42% (09/30/2024) Worst Quarter: 0.00% (06/30/2021) |
This table compares the Fund's average annual total returns to those of a broad-based securities market index and an additional index with characteristics relevant to the Fund's investment strategy.
After-tax returns are calculated using the historical highest individual federal marginal income tax rates and do not reflect the impact of state and local taxes. Your actual after-tax returns will depend on your tax situation and may differ from those shown. After-tax returns shown are not relevant to investors who hold their Fund shares through tax-deferred arrangements, such as 401(k) plans or individual retirement accounts.
|
Conservative Income Fund — Class Y |
1 Year |
5 Years |
Since Inception (4/22/2016) |
||||||||||||
|
Return Before Taxes |
4.33 |
% |
3.30 |
% |
2.35 |
% |
|||||||||
|
Return After Taxes on Distributions |
2.54 |
% |
1.95 |
% |
1.38 |
% |
|||||||||
|
Return After Taxes on Distributions and Sale of Fund Shares |
2.54 |
% |
1.94 |
% |
1.38 |
% |
|||||||||
|
Bloomberg U.S. Aggregate Bond Index Return (reflects no deduction for fees, expenses or taxes) |
7.30 |
% |
-0.36 |
% |
1.76 |
% |
|||||||||
|
ICE BofA U.S. 3-Month Treasury Bill Index (reflects no deduction for fees, expenses or taxes) |
4.18 |
% |
3.17 |
% |
2.24 |
% |
|||||||||
Although the Fund's performance is benchmarked against the return of the ICE BofA U.S. 3-Month Treasury Bill Index, an investment in the Fund may differ from an investment in U.S. Treasury bills. Among other things, Treasury bills are backed by the full faith and credit of the U.S. Government and have a fixed rate of return. Investors in Treasury bills do not risk losing their investment, whereas loss of money is a risk of investing in the Fund. Further, an investment in the Fund may potentially be more volatile than an investment in Treasury bills because of the breadth and types of securities and other instruments in which the Fund may invest.
The bar chart and the performance table below provide some indication of the risks of investing in the Fund by showing changes in the Fund's performance from year to year for the past nine calendar years and by showing how the Fund's average annual returns for 1 and 5 years and since the Fund's inception compare with those of a broad measure of market performance. The Fund's past performance (before and after taxes) is not necessarily an indication of how the Fund will perform in the future. For current performance information, please call 1-800-DIAL-SEI.
|
|
Best Quarter: 0.97% (12/31/2023) Worst Quarter: 0.00% (06/30/2021) |
||||||
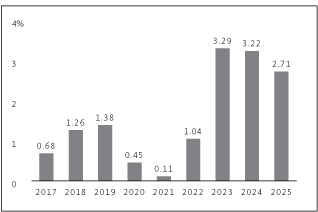
|
|
Best Quarter: 0.97% (12/31/2023) Worst Quarter: 0.00% (06/30/2021) |
||||||
This table compares the Fund's average annual total returns to those of a broad-based securities market index and an additional index with characteristics relevant to the Fund's investment strategy.
After-tax returns are calculated using the historical highest individual federal marginal income tax rates and do not reflect the impact of state and local taxes. Your actual after-tax returns will depend on your tax situation and may differ from those shown. After-tax returns shown are not relevant to investors who hold their Fund shares through tax-deferred arrangements, such as 401(k) plans or individual retirement accounts.
|
Tax-Free Conservative Income Fund — Class Y |
1 Year |
5 Years |
Since Inception (4/22/2016) |
||||||||||||
|
Return Before Taxes |
2.71 |
% |
2.07 |
% |
1.48 |
% |
|||||||||
|
Return After Taxes on Distributions |
2.70 |
% |
2.06 |
% |
1.48 |
% |
|||||||||
|
Return After Taxes on Distributions and Sale of Fund Shares |
2.70 |
% |
2.05 |
% |
1.47 |
% |
|||||||||
|
Bloomberg U.S. Aggregate Bond Index Return (reflects no deduction for fees, expenses or taxes) |
7.30 |
% |
-0.36 |
% |
1.76 |
% |
|||||||||
|
ICE BofA U.S. 3-Month Treasury Bill Index (reflects no deduction for fees, expenses or taxes) |
4.18 |
% |
3.17 |
% |
2.24 |
% |
|||||||||
Although the Fund's performance is benchmarked against the return of the ICE BofA U.S. 3-Month Treasury Bill Index, an investment in the Fund may differ from an investment in U.S. Treasury bills. Among other things, Treasury bills are backed by the full faith and credit of the U.S. Government and have a fixed rate of return. Investors in Treasury bills do not risk losing their investment, whereas loss of money is a risk of investing in the Fund. Further, an investment in the Fund may potentially be more volatile than an investment in Treasury bills because of the breadth and types of securities and other instruments in which the Fund may invest.
The bar chart and the performance table below provide some indication of the risks of investing in the Class Y Shares of the Fund by showing changes in the Fund's performance from year to year for the past ten calendar years and by showing how the Fund's average annual returns for 1, 5 and 10 years, and since the Fund's inception, compare with those of a broad measure of market performance. The Fund's past performance (before and after taxes) is not necessarily an indication of how the Fund will perform in the future. For current performance information, please call 1-800-DIAL-SEI.
|
|
Best Quarter: 3.44% (03/31/2025) Worst Quarter: -3.21% (09/30/2022) |
||||||
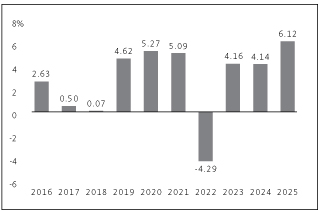
| Best Quarter: 3.44% (03/31/2025) Worst Quarter: -3.21% (09/30/2022) |
This table compares the Fund's average annual total returns to those of a broad-based securities market index and an additional index with characteristics relevant to the Fund's investment strategy.
After-tax returns are calculated using the historical highest individual federal marginal income tax rates and do not reflect the impact of state and local taxes. Your actual after-tax returns will depend on your tax situation and may differ from those shown. After-tax returns shown are not relevant to investors who hold their Fund shares through tax-deferred arrangements, such as 401(k) plans or individual retirement accounts. In some cases, the Fund's return after taxes may exceed the Fund's return before taxes due to an assumed tax benefit from any losses on a sale of Fund shares at the end of the measurement period.
|
Real Return Fund* |
1 Year |
5 Years |
10 Years |
Since Inception (7/2/2009) |
|||||||||||||||
|
Return Before Taxes |
6.12 |
% |
2.97 |
% |
2.79 |
% |
2.29 |
% |
|||||||||||
|
Return After Taxes on Distributions |
4.28 |
% |
1.11 |
% |
1.59 |
% |
1.33 |
% |
|||||||||||
|
Return After Taxes on Distributions and Sale of Fund Shares |
3.61 |
% |
1.46 |
% |
1.62 |
% |
1.37 |
% |
|||||||||||
|
Bloomberg U.S. Aggregate Bond Index Return (reflects no deduction for fees, expenses or taxes) |
7.30 |
% |
-0.36 |
% |
2.01 |
% |
2.81 |
% |
|||||||||||
|
Bloomberg 1-5 Year U.S. TIPS Index Return (reflects no deduction for fees, expenses or taxes) |
6.55 |
% |
3.32 |
% |
3.16 |
% |
2.67 |
% |
|||||||||||
* The Fund's Class Y Shares commenced operations on December 31, 2014. For periods prior to December 31, 2014, the performance of the Fund's Class F Shares has been used. Returns for Class Y Shares would have been substantially similar to those of Class F Shares and would have differed only to the extent that Class Y Shares have lower total annual fund operating expenses than Class F Shares.
The bar chart and the performance table below provide some indication of the risks of investing in the Fund by showing changes in the Fund's performance from year to year for the past ten calendar years and by showing how the Fund's average annual returns for 1, 5 and 10 years, and since the Fund's inception, compare with those of a broad measure of market performance. The Fund's past performance (before and after taxes) is not necessarily an indication of how the Fund will perform in the future. For current performance information, please call 1-800-DIAL-SEI.
|
|
Best Quarter: 21.04% (06/30/2020) Worst Quarter: -19.09% (03/31/2020) |
||||||
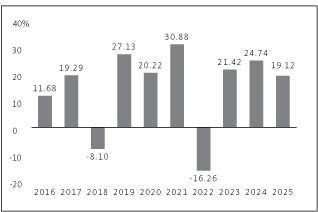
| Best Quarter: 21.04% (06/30/2020) Worst Quarter: -19.09% (03/31/2020) |
After-tax returns are calculated using the historical highest individual federal marginal income tax rates and do not reflect the impact of state and local taxes. Your actual after-tax returns will depend on your tax situation and may differ from those shown. After-tax returns shown are not relevant to investors who hold their Fund shares through tax-deferred arrangements, such as 401(k) plans or individual retirement accounts. In some cases, the Fund's return after taxes may exceed the Fund's return before taxes due to an assumed tax benefit from any losses on a sale of Fund shares at the end of the measurement period.
|
Dynamic Asset Allocation Fund — Class Y |
1 Year |
5 Years |
10 Years |
Since Inception (7/30/2015) |
|||||||||||||||
|
Return Before Taxes |
19.12 |
% |
14.61 |
% |
13.98 |
% |
13.06 |
% |
|||||||||||
|
Return After Taxes on Distributions |
13.68 |
% |
11.06 |
% |
11.69 |
% |
10.87 |
% |
|||||||||||
|
Return After Taxes on Distributions and Sale of Fund Shares |
14.31 |
% |
10.87 |
% |
11.02 |
% |
10.26 |
% |
|||||||||||
|
S&P 500 Index Return (reflects no deduction for fees, expenses or taxes) |
17.88 |
% |
14.42 |
% |
14.82 |
% |
13.93 |
% |
|||||||||||
The bar chart and the performance table below provide some indication of the risks of investing in the Class Y Shares of the Fund by showing changes in the Fund's performance from year to year for the past ten calendar years and by showing how the Fund's average annual returns for 1, 5 and 10 years, and since the Fund's inception, compare with those of a broad measure of market performance. The Fund's past performance (before and after taxes) is not necessarily an indication of how the Fund will perform in the future. For current performance information, please call 1-800-DIAL-SEI.
|
|
Best Quarter: 7.29% (12/31/2020) Worst Quarter: -6.34% (06/30/2022) |
||||||
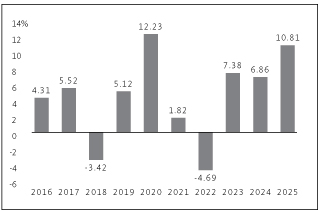
|
|
Best Quarter: 7.29% (12/31/2020) Worst Quarter: -6.34% (06/30/2022) |
||||||
This table compares the Fund's average annual total returns to those of a broad-based securities market index and an additional index with characteristics relevant to the Fund's investment strategy.
After-tax returns are calculated using the historical highest individual federal marginal income tax rates and do not reflect the impact of state and local taxes. Your actual after-tax returns will depend on your tax situation and may differ from those shown. After-tax returns shown are not relevant to investors who hold their Fund shares through tax-deferred arrangements, such as 401(k) plans or individual retirement accounts. In some cases, the Fund's return after taxes may exceed the Fund's return before taxes due to an assumed tax benefit from any losses on a sale of Fund shares at the end of the measurement period.
|
Multi-Strategy Alternative Fund* |
1 Year |
5 Years |
10 Years |
Since Inception (3/31/2010) |
|||||||||||||||
|
Return Before Taxes |
10.81 |
% |
4.29 |
% |
4.46 |
% |
2.97 |
% |
|||||||||||
|
Return After Taxes on Distributions |
8.58 |
% |
2.20 |
% |
2.98 |
% |
1.82 |
% |
|||||||||||
|
Return After Taxes on Distributions and Sale of Fund Shares |
6.47 |
% |
2.37 |
% |
2.85 |
% |
1.82 |
% |
|||||||||||
|
Bloomberg U.S. Aggregate Bond Index Return (reflects no deduction for fees, expenses or taxes) |
7.30 |
% |
-0.36 |
% |
2.01 |
% |
2.60 |
% |
|||||||||||
|
ICE BofA U.S. 3-Month Treasury Bill Index (reflects no deduction for fees, expenses or taxes) |
4.18 |
% |
3.17 |
% |
2.18 |
% |
1.41 |
% |
|||||||||||
* The Fund's Class Y Shares commenced operations on April 30, 2015. For periods prior to April 30, 2015, the performance of the Fund's Class F Shares has been used. Returns for Class Y Shares would have been substantially similar to those of Class F Shares and would have differed only to the extent that Class Y Shares have lower total annual fund operating expenses than Class F Shares.
Although the Fund's performance is benchmarked against the return of the ICE BofA U.S. 3-Month Treasury Bill Index, an investment in the Fund is substantially different from an investment in U.S. Treasury bills. Among other things, Treasury bills are backed by the full faith and credit of the U.S. Government and have a fixed rate of return. Investors in Treasury bills do not risk losing their investment, whereas loss of money is a risk of investing in the Fund. Further, an investment in the Fund is expected to be substantially more volatile than an investment in Treasury bills because of the breadth and types of securities and other instruments in which the Fund may invest.
The bar chart and the performance table below provide some indication of the risks of investing in the Class F Shares of the Fund by showing changes in the Fund's performance from year to year for the past ten calendar years and by showing how the Fund's average annual returns for 1, 5 and 10 years, and since the Fund's inception compare with those of a broad measure of market performance. The Fund's past performance (before and after taxes) is not necessarily an indication of how the Fund will perform in the future. For current performance information, please call 1-800-DIAL-SEI.
|
|
Best Quarter: 10.18% (03/31/2019) Worst Quarter: -12.58% (06/30/2022) |
||||||
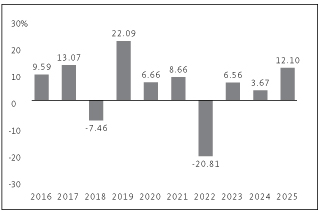
Best Quarter: 10.18% (03/31/2019)
Worst Quarter: -12.58% (06/30/2022)
This table compares the Fund's average annual total returns to those of the MSCI All Country World ex-USA Index (Net) (a broad-based securities market index), and two additional indexes with characteristics relevant to the Fund's investment strategy. The Fund's additional indexes are the MSCI World Index (net) (Hedged) (USD) and the Fund's 60/40 blended benchmark, that is composed of the MSCI World Index (net) (Hedged) (USD) (60%) and the Bloomberg Global Aggregate Index, Hedged (USD) (40%).
After-tax returns are calculated using the historical highest individual federal marginal income tax rates and do not reflect the impact of state and local taxes. Your actual after-tax returns will depend on your tax situation and may differ from those shown. After-tax returns shown are not relevant to investors who hold their Fund shares through tax-deferred arrangements, such as 401(k) plans or individual retirement accounts. In some cases, the Fund's return after taxes may exceed the Fund's return before taxes due to an assumed tax benefit from any losses on a sale of Fund shares at the end of the measurement period.
|
Multi-Asset Accumulation Fund — Class F |
1 Year |
5 Years |
10 Years |
Since Inception (4/9/2012) |
|||||||||||||||
|
Return Before Taxes |
12.10 |
% |
1.28 |
% |
4.76 |
% |
4.14 |
% |
|||||||||||
|
Return After Taxes on Distributions |
10.79 |
% |
-1.03 |
% |
2.46 |
% |
2.01 |
% |
|||||||||||
|
Return After Taxes on Distributions and Sale of Fund Shares |
7.17 |
% |
0.03 |
% |
2.85 |
% |
2.43 |
% |
|||||||||||
|
MSCI All Country World ex-USA Index (Net) (reflects no deductions for fees, expenses or taxes, (except foreign withholding taxes)) |
32.39 |
% |
7.91 |
% |
8.41 |
% |
6.99 |
% |
|||||||||||
|
MSCI World Index (net) (Hedged) (USD) (reflects no deductions for fees, expenses or taxes (except foreign withholding taxes)) |
19.03 |
% |
13.67 |
% |
12.99 |
% |
12.74 |
% |
|||||||||||
|
The Fund's Blended Benchmark Return (reflects no deduction for fees, expenses or taxes) |
13.28 |
% |
8.30 |
% |
8.84 |
% |
8.79 |
% |
|||||||||||
The bar chart and the performance table below provide some indication of the risks of investing in the Class F Shares of the Fund by showing changes in the Fund's performance from year to year for the past ten calendar years and by showing how the Fund's average annual returns for 1, 5 and 10 years, and since the Fund's inception compare with those of a broad measure of market performance. The Fund's past performance (before and after taxes) is not necessarily an indication of how the Fund will perform in the future. For current performance information, please call 1-800-DIAL-SEI.
|
|
Best Quarter: 11.20% (06/30/2020) Worst Quarter: -14.23% (03/31/2020) |
||||||
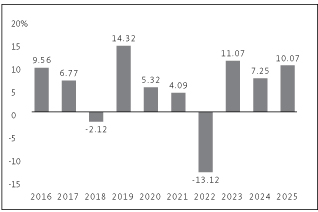
| Best Quarter: 11.20% (06/30/2020) Worst Quarter: -14.23% (03/31/2020) |
This table compares the Fund's average annual total returns to those of a broad-based securities market index and an additional index with characteristics relevant to the Fund's investment strategy. The additional index is the Fund's blended benchmark index that is composed of the Bloomberg U.S. Aggregate Bond Index (45%), the ICE BofA U.S. High Yield Constrained Index (40%) and the MSCI All Country World Index (Net) (15%).
After-tax returns are calculated using the historical highest individual federal marginal income tax rates and do not reflect the impact of state and local taxes. Your actual after-tax returns will depend on your tax situation and may differ from those shown. After-tax returns shown are not relevant to investors who hold their Fund shares through tax-deferred arrangements, such as 401(k) plans or individual retirement accounts. In some cases, the Fund's return after taxes may exceed the Fund's return before taxes due to an assumed tax benefit from any losses on a sale of Fund shares at the end of the measurement period.
|
Multi-Asset Income Fund — Class F |
1 Year |
5 Years |
10 Years |
Since Inception (4/9/2012) |
|||||||||||||||
|
Return Before Taxes |
10.07 |
% |
3.47 |
% |
5.04 |
% |
5.27 |
% |
|||||||||||
|
Return After Taxes on Distributions |
7.80 |
% |
1.25 |
% |
3.08 |
% |
3.21 |
% |
|||||||||||
|
Return After Taxes on Distributions and Sale of Fund Shares |
6.05 |
% |
1.68 |
% |
3.04 |
% |
3.18 |
% |
|||||||||||
|
Bloomberg U.S. Aggregate Bond Index Return (reflects no deduction for fees, expenses or taxes) |
7.30 |
% |
-0.36 |
% |
2.01 |
% |
2.01 |
% |
|||||||||||
|
The Fund's Blended Benchmark Return (reflects no deduction for fees, expenses or taxes) |
9.99 |
% |
3.61 |
% |
5.67 |
% |
5.36 |
% |
|||||||||||
The bar chart and the performance table below provide some indication of the risks of investing in the Class F Shares of the Fund by showing changes in the Fund's performance from year to year for the past ten calendar years and by showing how the Fund's average annual returns for 1, 5 and 10 years, and since the Fund's inception compare with those of a broad measure of market performance. The Fund's past performance (before and after taxes) is not necessarily an indication of how the Fund will perform in the future. For current performance information, please call 1-800-DIAL-SEI.
|
|
Best Quarter: 8.31% (03/31/2022) Worst Quarter: -10.32% (03/31/2020) |
||||||
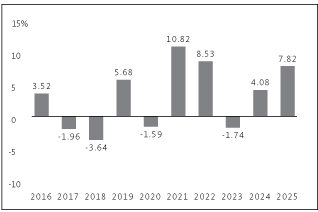
| Best Quarter: 8.31% (03/31/2022) Worst Quarter: -10.32% (03/31/2020) |
This table compares the Fund's average annual total returns to those of the Bloomberg U.S. Aggregate Bond Index (a broad-based securities market index), and an additional index with characteristics relevant to the Fund's investment strategy. The Fund's additional index is the Fund's 70/20/10 blended benchmark that is composed of the Bloomberg 1-5 Year U.S. TIPS Index (70%), the Bloomberg Commodity Index (20%) and the S&P 500 Index (10%). In prior years, the Fund also compared its performance to the Bloomberg 1-5 Year U.S. TIPS Index.
After-tax returns are calculated using the historical highest individual federal marginal income tax rates and do not reflect the impact of state and local taxes. Your actual after-tax returns will depend on your tax situation and may differ from those shown. After-tax returns shown are not relevant to investors who hold their Fund shares through tax-deferred arrangements, such as 401(k) plans or individual retirement accounts. In some cases, the Fund's return after taxes may exceed the Fund's return before taxes due to an assumed tax benefit from any losses on a sale of Fund shares at the end of the measurement period.
|
Multi-Asset Inflation Managed Fund — Class F |
1 Year |
5 Years |
10 Years |
Since Inception (4/9/2012) |
|||||||||||||||
|
Return Before Taxes |
7.82 |
% |
5.81 |
% |
3.04 |
% |
1.15 |
% |
|||||||||||
|
Return After Taxes on Distributions |
6.01 |
% |
3.38 |
% |
1.58 |
% |
0.09 |
% |
|||||||||||
|
Return After Taxes on Distributions and Sale of Fund Shares |
4.74 |
% |
3.47 |
% |
1.74 |
% |
0.44 |
% |
|||||||||||
|
Bloomberg U.S. Aggregate Bond Index (reflects no deduction for fees, expenses or taxes) |
7.30 |
% |
-0.36 |
% |
2.01 |
% |
2.01 |
% |
|||||||||||
|
The Fund's Blended Benchmark Return (reflects no deduction for fees, expenses or taxes) |
9.57 |
% |
6.04 |
% |
4.99 |
% |
2.93 |
% |
|||||||||||
The bar chart and the performance table below provide some indication of the risks of investing in the Class F Shares of the Fund by showing changes in the Fund's performance from year to year for the past ten calendar years and by showing how the Fund's average annual returns for 1, 5 and 10 years, and since the Fund's inception compare with those of a broad measure of market performance. The Fund's past performance (before and after taxes) is not necessarily an indication of how the Fund will perform in the future. For current performance information, please call 1-800-DIAL-SEI.
|
|
Best Quarter: 3.85% (12/31/2023) Worst Quarter: -2.08% (06/30/2022) |
||||||
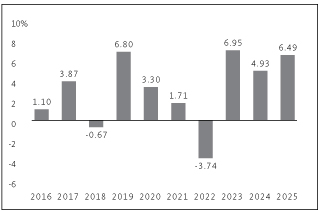
Best Quarter: 3.85% (12/31/2023)
Worst Quarter: -2.08% (06/30/2022)
This table compares the Fund's average annual total returns to those of the Bloomberg U.S. Aggregate Bond Index (a broad-based securities market index), and an additional index with characteristics relevant to the Fund's investment strategy. The Fund's additional index is the Fund's 95/5 blended benchmark that is composed of the Bloomberg 1-3 Year U.S. Government/Credit Index (95%) and the S&P 500 Index (5%). In prior years, the Fund also compared its performance to the Bloomberg 1-3 Year U.S. Government/Credit Index.
After-tax returns are calculated using the historical highest individual federal marginal income tax rates and do not reflect the impact of state and local taxes. Your actual after-tax returns will depend on your tax situation and may differ from those shown. After-tax returns shown are not relevant to investors who hold their Fund shares through tax-deferred arrangements, such as 401(k) plans or individual retirement accounts. In some cases, the Fund's return after taxes may exceed the Fund's return before taxes due to an assumed tax benefit from any losses on a sale of Fund shares at the end of the measurement period.
|
Multi-Asset Capital Stability Fund — Class F |
1 Year |
5 Years |
10 Years |
Since Inception (4/9/2012) |
|||||||||||||||
|
Return Before Taxes |
6.49 |
% |
3.19 |
% |
3.02 |
% |
2.45 |
% |
|||||||||||
|
Return After Taxes on Distributions |
5.77 |
% |
1.82 |
% |
1.96 |
% |
1.58 |
% |
|||||||||||
|
Return After Taxes on Distributions and Sale of Fund Shares |
3.92 |
% |
1.91 |
% |
1.91 |
% |
1.56 |
% |
|||||||||||
|
Bloomberg U.S. Aggregate Bond Index (reflects no deduction for fees, expenses or taxes) |
7.30 |
% |
-0.36 |
% |
2.01 |
% |
2.01 |
% |
|||||||||||
|
The Fund's Blended Benchmark Return (reflects no deduction for fees, expenses or taxes) |
5.97 |
% |
2.61 |
% |
2.75 |
% |
2.38 |
% |
|||||||||||
The bar chart and the performance table below provide some indication of the risks of investing in the Class Y Shares of the Fund by showing changes in the Fund's performance from year to year for the past ten calendar years and by showing how the Fund's average annual returns for 1, 5 and 10 years, and since the Fund's inception compare with those of a broad measure of market performance. The Fund's past performance (before and after taxes) is not necessarily an indication of how the Fund will perform in the future. For current performance information, please call 1-800-DIAL-SEI.
|
|
Best Quarter: 10.23% (03/31/2019) Worst Quarter: -12.47% (06/30/2022) |
||||||
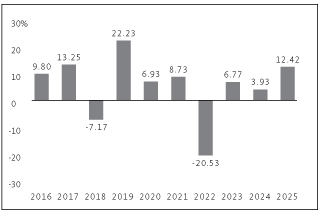
Best Quarter: 10.23% (03/31/2019)
Worst Quarter: -12.47% (06/30/2022)
This table compares the Fund's average annual total returns to those of the MSCI All Country World ex-USA Index (Net) (a broad-based securities market index), and two additional indexes with characteristics relevant to the Fund's investment strategy. The Fund's additional indexes are the MSCI World Index (net) (Hedged) (USD) and the Fund's 60/40 blended benchmark, that is composed of the MSCI World Index (net) (Hedged) (USD) (60%) and the Bloomberg Global Aggregate Index, Hedged (USD) (40%).
After-tax returns are calculated using the historical highest individual federal marginal income tax rates and do not reflect the impact of state and local taxes. Your actual after-tax returns will depend on your tax situation and may differ from those shown. After-tax returns shown are not relevant to investors who hold their Fund shares through tax-deferred arrangements, such as 401(k) plans or individual retirement accounts. In some cases, the Fund's return after taxes may exceed the Fund's return before taxes due to an assumed tax benefit from any losses on a sale of Fund shares at the end of the measurement period.
|
Multi-Asset Accumulation Fund* |
1 Year |
5 Years |
10 Years |
Since Inception (4/9/2012) |
|||||||||||||||
|
Return Before Taxes |
12.42 |
% |
1.51 |
% |
4.98 |
% |
4.33 |
% |
|||||||||||
|
Return After Taxes on Distributions |
11.01 |
% |
-0.89 |
% |
2.61 |
% |
2.14 |
% |
|||||||||||
|
Return After Taxes on Distributions and Sale of Fund Shares |
7.36 |
% |
0.16 |
% |
2.99 |
% |
2.55 |
% |
|||||||||||
|
MSCI All Country World ex-USA Index (Net) (reflects no deductions for fees, expenses or taxes, (except foreign withholding taxes)) |
32.39 |
% |
7.91 |
% |
8.41 |
% |
6.99 |
% |
|||||||||||
|
MSCI World Index (net) (Hedged) (USD) (reflects no deductions for fees, expenses or taxes, (except foreign withholding taxes)) |
19.03 |
% |
13.67 |
% |
12.99 |
% |
12.74 |
% |
|||||||||||
|
The Fund's Blended Benchmark Return (reflects no deduction for fees, expenses or taxes) |
13.28 |
% |
8.30 |
% |
8.84 |
% |
8.79 |
% |
|||||||||||
* The Fund's Class Y Shares commenced operations on December 31, 2014. For periods prior to December 31, 2014, the performance of the Fund's Class F Shares has been used. Returns for Class Y Shares would have been substantially similar to those of Class F Shares and would have differed only to the extent that Class Y Shares have lower total annual fund operating expenses than Class F Shares.
The bar chart and the performance table below provide some indication of the risks of investing in the Class Y Shares of the Fund by showing changes in the Fund's performance from year to year for the past ten calendar years and by showing how the Fund's average annual returns for 1, 5 and 10 years, and since the Fund's inception compare with those of a broad measure of market performance. The Fund's past performance (before and after taxes) is not necessarily an indication of how the Fund will perform in the future. For current performance information, please call 1-800-DIAL-SEI.
|
|
Best Quarter: 11.22% (06/30/2020) Worst Quarter: -14.21% (03/31/2020) |
||||||
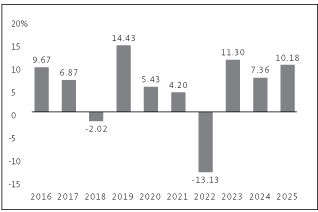
| Best Quarter: 11.22% (06/30/2020) Worst Quarter: -14.21% (03/31/2020) |
This table compares the Fund's average annual total returns to those of a broad-based securities market index and an additional index with characteristics relevant to the Fund's investment strategy. The additional index is the Fund's blended benchmark index that is composed of the Bloomberg U.S. Aggregate Bond Index (45%), the ICE BofA U.S. High Yield Constrained Index (40%) and the MSCI All Country World Index (Net) (15%).
After-tax returns are calculated using the historical highest individual federal marginal income tax rates and do not reflect the impact of state and local taxes. Your actual after-tax returns will depend on your tax
situation and may differ from those shown. After-tax returns shown are not relevant to investors who hold their Fund shares through tax-deferred arrangements, such as 401(k) plans or individual retirement accounts. In some cases, the Fund's return after taxes may exceed the Fund's return before taxes due to an assumed tax benefit from any losses on a sale of Fund shares at the end of the measurement period.
|
Multi-Asset Income Fund* |
1 Year |
5 Years |
10 Years |
Since Inception (4/9/2012) |
|||||||||||||||
|
Return Before Taxes |
10.18 |
% |
3.57 |
% |
5.14 |
% |
5.36 |
% |
|||||||||||
|
Return After Taxes on Distributions |
7.87 |
% |
1.31 |
% |
3.14 |
% |
3.26 |
% |
|||||||||||
|
Return After Taxes on Distributions and Sale of Fund Shares |
6.11 |
% |
1.74 |
% |
3.10 |
% |
3.23 |
% |
|||||||||||
|
Bloomberg U.S. Aggregate Bond Index Return (reflects no deduction for fees, expenses or taxes) |
7.30 |
% |
-0.36 |
% |
2.01 |
% |
2.01 |
% |
|||||||||||
|
The Fund's Blended Benchmark Return (reflects no deduction for fees, expenses or taxes) |
9.99 |
% |
3.61 |
% |
5.67 |
% |
5.36 |
% |
|||||||||||
* The Fund's Class Y Shares commenced operations on December 31, 2014. For periods prior to December 31, 2014, the performance of the Fund's Class F Shares has been used. Returns for Class Y Shares would have been substantially similar to those of Class F Shares and would have differed only to the extent that Class Y Shares have lower total annual fund operating expenses than Class F Shares.
The bar chart and the performance table below provide some indication of the risks of investing in the Class Y Shares of the Fund by showing changes in the Fund's performance from year to year for the past ten calendar years and by showing how the Fund's average annual returns for 1, 5 and 10 years, and since the Fund's inception compare with those of a broad measure of market performance. The Fund's past performance (before and after taxes) is not necessarily an indication of how the Fund will perform in the future. For current performance information, please call 1-800-DIAL-SEI.
|
|
Best Quarter: 8.44% (03/31/2022) Worst Quarter: -10.22% (03/31/2020) |
||||||
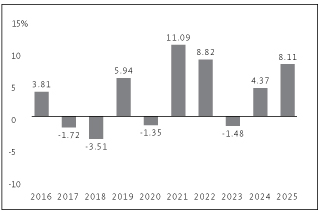
| Best Quarter: 8.44% (03/31/2022) Worst Quarter: -10.22% (03/31/2020) |
This table compares the Fund's average annual total returns to those of the Bloomberg U.S. Aggregate Bond Index (a broad-based securities market index), and an additional index with characteristics relevant to the Fund's investment strategy. The Fund's additional index is the Fund's 70/20/10 blended benchmark that is composed of the Bloomberg 1-5 Year U.S. TIPS Index (70%), the Bloomberg Commodity Index (20%) and the S&P 500 Index (10%). In prior years, the Fund also compared its performance to the Bloomberg 1-5 Year U.S. TIPS Index.
After-tax returns are calculated using the historical highest individual federal marginal income tax rates and do not reflect the impact of state and local taxes. Your actual after-tax returns will depend on your tax situation and may differ from those shown. After-tax returns shown are not relevant to investors who hold their Fund shares through tax-deferred arrangements, such as 401(k) plans or individual retirement accounts. In some cases, the Fund's return after taxes may exceed the Fund's return before taxes due to an assumed tax benefit from any losses on a sale of Fund shares at the end of the measurement period.
|
Multi-Asset Inflation Managed Fund* |
1 Year |
5 Years |
10 Years |
Since Inception (4/9/2012) |
|||||||||||||||
|
Return Before Taxes |
8.11 |
% |
6.09 |
% |
3.29 |
% |
1.36 |
% |
|||||||||||
|
Return After Taxes on Distributions |
6.19 |
% |
3.55 |
% |
1.74 |
% |
0.21 |
% |
|||||||||||
|
Return After Taxes on Distributions and Sale of Fund Shares |
4.92 |
% |
3.64 |
% |
1.90 |
% |
0.56 |
% |
|||||||||||
|
Bloomberg U.S. Aggregate Bond Index (reflects no deduction for fees, expenses or taxes) |
7.30 |
% |
-0.36 |
% |
2.01 |
% |
2.01 |
% |
|||||||||||
|
The Fund's Blended Benchmark Return (reflects no deduction for fees, expenses or taxes) |
9.57 |
% |
6.04 |
% |
4.99 |
% |
2.93 |
% |
|||||||||||
* The Fund's Class Y Shares commenced operations on December 31, 2014. For periods prior to December 31, 2014, the performance of the Fund's Class F Shares has been used. Returns for Class Y Shares would have been substantially similar to those of Class F Shares and would have differed only to the extent that Class Y Shares have lower total annual fund operating expenses than Class F Shares.
The bar chart and the performance table below provide some indication of the risks of investing in the Class Y Shares of the Fund by showing changes in the Fund's performance from year to year for the past ten calendar years and by showing how the Fund's average annual returns for 1, 5 and 10 years, and since the Fund's inception compare with those of a broad measure of market performance. The Fund's past performance (before and after taxes) is not necessarily an indication of how the Fund will perform in the future. For current performance information, please call 1-800-DIAL-SEI.
|
|
Best Quarter: 3.85% (12/31/2023) Worst Quarter: -1.98% (06/30/2022) |
||||||
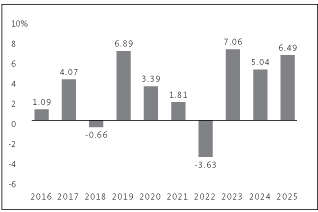
Best Quarter: 3.85% (12/31/2023)
Worst Quarter: -1.98% (06/30/2022)
This table compares the Fund's average annual total returns to those of the Bloomberg U.S. Aggregate Bond Index (a broad-based securities market index), and an additional index with characteristics relevant to the Fund's investment strategy. The Fund's additional index is the Fund's 95/5 blended benchmark that is composed of the Bloomberg 1-3 Year U.S. Government/Credit Index (95%) and the S&P 500 Index (5%). In prior years, the Fund also compared its performance to the Bloomberg 1-3 Year U.S. Government/Credit Index.
After-tax returns are calculated using the historical highest individual federal marginal income tax rates and do not reflect the impact of state and local taxes. Your actual after-tax returns will depend on your tax situation and may differ from those shown. After-tax returns shown are not relevant to investors who hold their Fund shares through tax-deferred arrangements, such as 401(k) plans or individual retirement accounts. In some cases, the Fund's return after taxes may exceed the Fund's return before taxes due to an assumed tax benefit from any losses on a sale of Fund shares at the end of the measurement period.
|
Multi-Asset Capital Stability Fund* |
1 Year |
5 Years |
10 Years |
Since Inception (4/9/2012) |
|||||||||||||||
|
Return Before Taxes |
6.49 |
% |
3.28 |
% |
3.10 |
% |
2.52 |
% |
|||||||||||
|
Return After Taxes on Distributions |
5.72 |
% |
1.86 |
% |
2.00 |
% |
1.63 |
% |
|||||||||||
|
Return After Taxes on Distributions and Sale of Fund Shares |
3.92 |
% |
1.96 |
% |
1.96 |
% |
1.60 |
% |
|||||||||||
|
Bloomberg U.S. Aggregate Bond Index Return (reflects no deduction for fees, expenses or taxes) |
7.30 |
% |
-0.36 |
% |
2.01 |
% |
2.01 |
% |
|||||||||||
|
The Fund's Blended Benchmark Return (reflects no deduction for fees, expenses or taxes) |
5.97 |
% |
2.61 |
% |
2.75 |
% |
2.38 |
% |
|||||||||||
* The Fund's Class Y Shares commenced operations on December 31, 2014. For periods prior to December 31, 2014, the performance of the Fund's Class F Shares has been used. Returns for Class Y Shares would have been substantially similar to those of Class F Shares and would have differed only to the extent that Class Y Shares have lower total annual fund operating expenses than Class F Shares.