The bar chart and performance table below show the variability of the Fund’s returns over time, which is some indication of the risks of investing in the Fund. The bar chart shows performance of the Fund’s Class I shares for each of the last ten full calendar years. The performance table compares the performance of the Fund over time to the performance of a broad-based market index and a supplemental index. You should be aware that the Fund’s past performance (before and after taxes) may not be an indication of how the Fund will perform in the future. The Fund was under different management from October 15, 2021 through December 31, 2025 and the Fund’s performance during that period may be less relevant to new investors. Updated performance information is available at no cost by visiting www.persimmonfunds.com or by calling 1-855-233-8300.
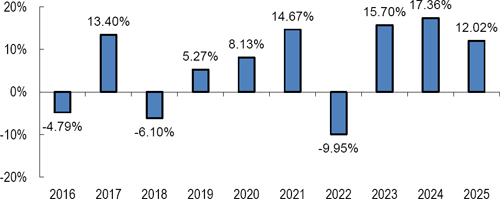
| Best Quarter: | 12/31/2023 | 10.75% |
| Worst Quarter: | 3/31/2020 | (9.70)% |
| One Year |
Five Years |
Ten
Years | |
| Class I shares | |||
| Return before taxes | 12.02% | 9.45% | 6.13% |
| Return after taxes on distributions | 12.01% | 9.45% | 5.86% |
| Return after taxes on distributions and sale of Fund shares | 7.11% | 7.49% | 4.84% |
| HFRX
Equity Hedge Index(1) (reflects no deduction for fees, expenses or taxes) |
10.06% | 6.61% | 4.40% |
| S&P
500 Total Return Index(2) (reflects no deduction for fees, expenses or taxes) |
17.88% | 14.42% | 14.82% |
| (1) | The HFRX Equity Hedge Index is a broad-based index covering strategies that maintain positions both long and short in primarily equity and equity derivative securities. The index is a daily index of Long/Short Equity Hedge Fund Returns provided by Hedge Fund Research (hedgefundresearch.com). The index covers a wide variety of investment processes including both quantitative and fundamental techniques; strategies can be broadly diversified or narrowly focused on specific sectors and can range broadly in terms of levels of net exposure, leverage employed, holding period, concentrations of market capitalizations and valuation ranges of typical portfolios. The Persimmon Long Short Fund utilizes a systematic process to limit the net exposure of the strategy resulting in profile similar to that of the average Equity Hedge managers that typically maintain at least 50% exposure and may in some cases be substantially entirely invested in equities, both long and short. The HFRX Equity Hedge is a commonly used benchmark for alternative investments such as the Persimmon Long Short Fund. Index performance returns do not reflect any management fees, transaction costs or expenses. You cannot invest directly in an index. |
| (2) | The S&P 500 Total Return Index is an unmanaged composite of 500 large capitalization companies and includes the reinvestment of dividends. This index is widely used by professional investors as a performance benchmark for large-cap stocks. You cannot invest directly in an index. |
After-tax returns were calculated using the historical highest individual federal marginal income tax rates and do not reflect the impact of state and local taxes. Actual after-tax returns depend on an investor’s tax situation and may differ from those shown, and after-tax returns shown are not relevant to investors who hold shares of the Fund through tax-deferred arrangements, such as 401(k) plans or individual retirement accounts.