Performance Management - PlanRock Alternative Growth ETF
Jan. 28, 2026
The bar chart and performance table show the variability of the Fund’s returns over time, which is some indication of the risks of investing in the Fund by comparing the Fund’s performance with a broad measure of market performance. The bar chart shows performance of the Fund’s shares for each calendar year since the Fund’s inception. The performance table compares the performance of the Fund over time to the performance of a broad-based securities market index. You should be aware that the Fund’s past performance (before and after taxes) is not necessarily an indication of how the Fund will perform in the future. Updated performance information is available at no cost by visiting www.PlanRockFunds.com or by calling 800-677-6025.
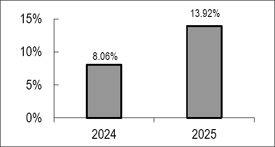
| Best Quarter: | 9/30/2025 | 11.03% |
| Worst Quarter: | 3/31/2025 | (5.34)% |
| One
Year |
Since Inception (12/18/23) | |
| Return before taxes | 13.92% | 11.20% |
| Return after taxes on distributions | 13.87% | 11.05% |
| Return after taxes on distributions and sale of Fund shares | 8.27% | 8.63 |
| MSCI AC World Index (Net)(1) | 22.34% | 20.33% |
| (1) | The MSCI AC World Index (Net) is a stock index designed to track broad global equity-market performance. Maintained by Morgan Stanley Capital International (MSCI), the index comprises the stocks of nearly 3,000 companies from 23 developed countries and 24 emerging markets. Investors cannot invest directly in an index. |