The bar chart and performance table below provide an indication of the risks of an investment in the Fund by showing how the Fund’s performance has varied from year to year, and by showing how the Fund’s average annual returns compare with those of a broad measure of market performance and a supplemental index. Past performance (before and after taxes) is not necessarily an indication of how the Fund will perform in the future.
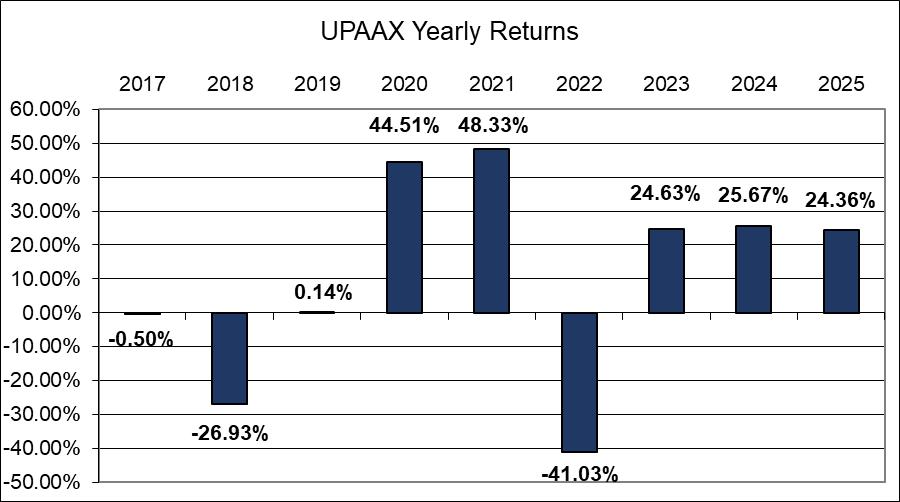
Best and Worst Quarterly Returns
| Best | Worst |
| 33.72% | -22.63% |
The Fund’s performance for the quarter ended September 30, 2025 was 15.43%.
After-tax returns are calculated using the highest historical individual federal marginal income tax rate and do not reflect the impact of state and local taxes. Actual after-tax returns depend on a shareholder’s tax situation and may differ from those shown. After-tax returns are not relevant for shareholders who hold Fund shares in tax-deferred accounts, such as 401(k) plans or individual retirement accounts, or to shares held by non-taxable entities.
| 1 Year | 5 Years | Since Inception | |
| Return Before Taxes | 24.36% | 11.22% | 7.34% |
| Return After Taxes on Distributions | 24.33% | 11.00% | 7.20% |
| Return After Taxes on Distributions and Sale of Fund Shares | 14.42% | 8.81% | 5.82% |
| Dow Jones Moderate US Portfolio Index* (reflects no deductions for fees and expenses) | 11.43% | 6.64% | 7.89% |
| Bloomberg Barclays US Gov’t/Credit Index* (reflects no deductions for fees and expenses) | 6.88% | -0.59% | 1.82% |
| S&P 500 Index* (reflects no deductions for fees and expenses) | 17.88% | 14.42% | 14.62% |
*The Fund’s benchmarks changed from the S&P 500 Index to the Dow Jones Moderate US Portfolio Index and Bloomberg Barclays US Government/Credit Bond Index to better reflect the Fund’s investment characteristics.
The bar chart and performance table below provide an indication of the risks of an investment in the Fund by showing how the Fund’s performance has varied from year to year, and by showing how the Fund’s average annual returns compare with those of a broad measure of market performance and a supplemental index. Past performance (before and after taxes) is not necessarily an indication of how the Fund will perform in the future.
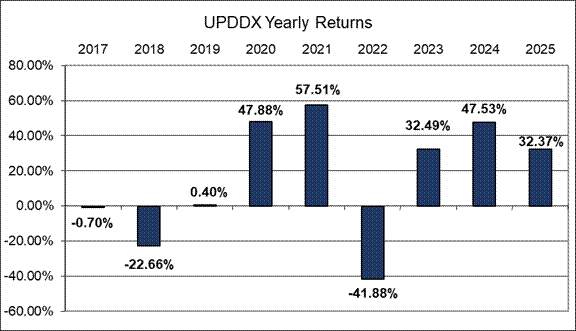
Best and Worst Quarterly Returns
| Best | Worst |
|
35.84% |
-26.76% |
The Fund’s performance for the quarter ended September 30, 2025 was 14.93%.
After-tax returns are calculated using the highest historical individual federal marginal income tax rate and do not reflect the impact of state and local taxes. Actual after-tax returns depend on a shareholder’s tax situation and may differ from those shown. After-tax returns are not relevant for shareholders who hold Fund shares in tax-deferred accounts, such as 401(k) plans or individual retirement accounts, or to shares held by non-taxable entities.
| 1 Year | 5 Years | Since Inception | |
| Return Before Taxes | 32.37% | 18.78% | 12.82% |
| Return After Taxes on Distributions | 32.37% | 18.52% | 12.56% |
|
Return After Taxes on Distributions and Sale of Fund Shares |
19.16% | 15.14% | 10.43% |
| Dow Jones US Total Stock Market Index* (reflects no deductions for fees and expenses) | 11.43% | 6.64% | 7.89% |
| Bloomberg Barclays US Gov’t/Credit Index* (reflects no deductions for fees and expenses) | 6.88% | -0.59% | 1.82% |
| S&P 500 Index* (reflects no deductions for fees and expenses) | 17.88% | 14.42% | 14.62% |
*The Fund’s benchmarks changed from the S&P 500 Index to the Dow Jones US Total Stock Market Index and Bloomberg Barclays US Government/Credit Bond Index to better reflect the Fund’s investment characteristics.
The bar chart and performance table below provide an indication of the risks of an investment in the Fund by showing how the Fund’s performance has varied from year to year, and by showing how the Fund’s average annual returns compare with those of a broad measure of market performance. Past performance (before and after taxes) is not necessarily an indication of how the Fund will perform in the future.
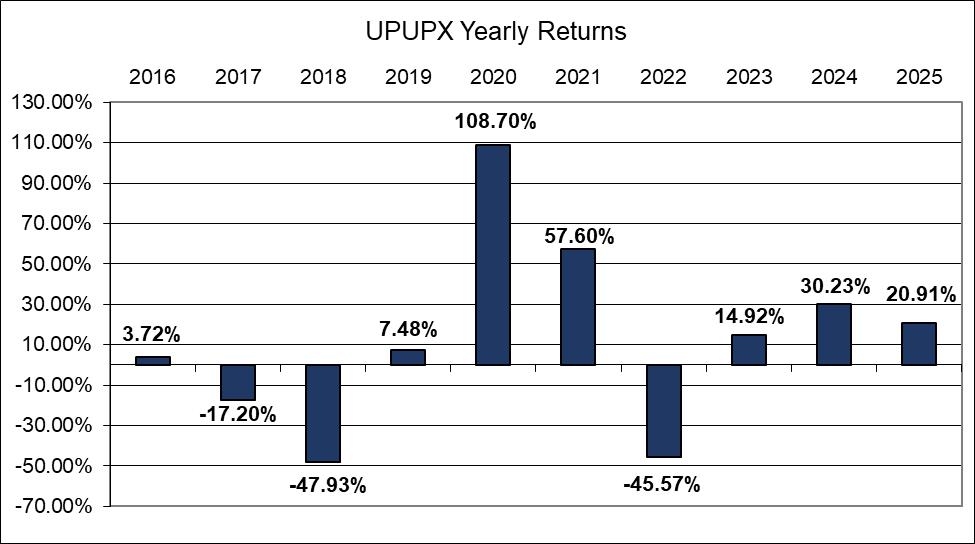
Best and Worst Quarterly Returns
| Best | Worst |
| 60.80% | -29.84% |
The Fund’s performance for the quarter ended September 30, 2025 was 11.34%.
After-tax returns are calculated using the highest historical individual federal marginal income tax rate and do not reflect the impact of state and local taxes. Actual after-tax returns depend on a shareholder’s tax situation and may differ from those shown. After-tax returns are not relevant for shareholders who hold Fund shares in tax-deferred accounts, such as 401(k) plans or individual retirement accounts, or to shares held by non-taxable entities.
| 1 Year | 5 Years | 10 Years | |
| Return Before Taxes | 20.91 % | 9.16 % | 4.47 % |
| Return After Taxes on Distributions | 18.64 % | 7.80% | 3.22 % |
|
Return After Taxes on Distributions and Sale of Fund Shares |
13.95 % | 6.84 % | 3.15 % |
| S&P 500 Index (reflects no deductions for fees and expenses) | 17.88 % | 14.42% | 14.81 % |