Pay vs Performance Disclosure - USD ($)
Sep. 28, 2025
Sep. 28, 2024
Jun. 14, 2024
| Year (1) | Summary Compensation Table Total for PEO - GG (2) | Compensation Actually Paid to PEO - GG | Summary Compensation Table Total for PEO - LB (2) | Compensation Actually Paid to PEO - LB (3) | Average Summary Compensation Table for non-PEO Named Executive Officers (4) | Average Compensation Actually Paid to non-PEO Named Executive Officers (5) | Value
of Initial Fixed $100 Investment Based on Total Shareholder Return (6) | Net Income (Loss) | ||||||||||||||||||||||||
| 2025 | 157,740 | 157,740 | $ | 95.15 | $ | 1,458,083 | ||||||||||||||||||||||||||
| 2024 | $ | 381,516 | $ | 381,516 | $ | 117,263 | $ | 117,263 | $ | 102.44 | $ | (1,094,481 | ) | |||||||||||||||||||
| (2) | Represents, for fiscal 2025 and 2024, the total compensation to the principal executive officers (PEOs), Lisa Brady and Geoffrey Gannon. Ms. Brady served as the Company’s President and CEO from November 14, 2022 through June 14, 2024. Mr. Gannon has served as the Company’s President since June 14, 2024. He has elected to fill this role without direct compensation. Mr. Gannon is also the Portfolio Manager at Focused Compounding Fund, LP, which owns 40.2% of the Company’s issued and outstanding stock as of February 27, 2026. |
| Fiscal Year | 2025 | 2024 | ||||||
| Average Total from Summary Compensation Table | $ | $ | 381,516 | |||||
| (-) Grant Date Fair Value of Option Awards and Stock Awards Granted in Fiscal Year | ||||||||
| (+) Fair Value at Fiscal Year-End of Outstanding and Unvested Option Awards and Stock Awards Granted in Fiscal Year | ||||||||
| (+) / (-) Change in Fair Value of Outstanding and Unvested Option Awards and Stock Awards Granted in Prior Fiscal Years | ||||||||
| (+) / (-) Change in Fair Value as of Vesting Date of Option Awards and Stock Awards Granted in Prior Fiscal Years For Which Applicable Vesting Conditions Were Satisfied During Fiscal Year | ||||||||
| Compensation Actually Paid | $ | $ | 381,516 | |||||
| Fiscal Year | 2025 | 2024 | ||||||
| Average Total from Summary Compensation Table | $ | 157,740 | $ | 117,263 | ||||
| (-) Grant Date Fair Value of Option Awards and Stock Awards Granted in Fiscal Year | ||||||||
| (+) Fair Value at Fiscal Year-End of Outstanding and Unvested Option Awards and Stock Awards Granted in Fiscal Year | ||||||||
| (+) / (-) Change in Fair Value of Outstanding and Unvested Option Awards and Stock Awards Granted in Prior Fiscal Years | ||||||||
| (+) / (-) Change in Fair Value as of Vesting Date of Option Awards and Stock Awards Granted in Prior Fiscal Years For Which Applicable Vesting Conditions Were Satisfied During Fiscal Year | ||||||||
| Compensation Actually Paid | $ | 157,740 | $ | 117,263 | ||||
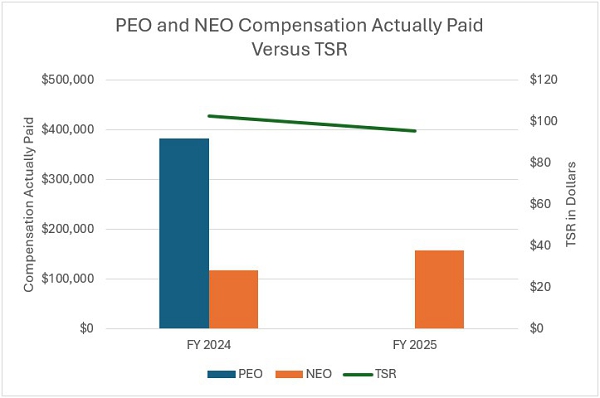
Compensation Actually Paid and Cumulative TSR
The following chart sets forth the relationship between compensation actually paid to the PEO and the NEO, compared to our cumulative TSR for each the years presented:
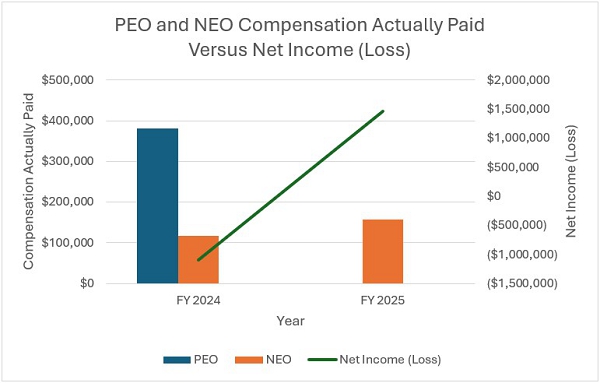
Compensation Actually Paid and the Company’s Net Income (Loss) over FY 2024-2025
The following chart sets forth the relationship between compensation actually paid to the PEO and the NEO, compared to the Company’s Net Income (Loss) for each of the years presented:
| [1] | Data presented for our last two fiscal years in compliance with Item 402(v)(8). |
| [2] | Represents, for fiscal 2025 and 2024, the total compensation to the only non-PEO NEO, Rebeccas McGraw and Todd White, respectively. On September 3, 2024, Mr. White and the Company entered into a Separation Agreement pursuant to which Mr. White determined to resign as the Company’s Chief Financial Officer, effective December 31, 2024. |
| [3] | The following adjustments were made to the non-PEO NEO total compensation for each year to determine “compensation actually paid” in accordance with SEC regulations: |
| [4] | Total Shareholder Return (“TSR”) illustrates the value, as of the last day of the indicated fiscal year, of an investment of $100 in our common stock on September 30, 2022. |
| [5] | Ms. Brady |
| [6] | The dollar amounts reported in this column represent the average amount of “compensation actually paid” to Lisa Brady as computed in accordance with Item 402(v) of Regulation S-K. The following adjustments were made to the PEO total compensation for each year to determine “compensation actually paid” in accordance with SEC regulations: |