Pay vs Performance Disclosure - USD ($)
Nov. 01, 2025
Nov. 02, 2024
Nov. 04, 2023
Nov. 05, 2022
Pay Versus Performance
This section is required by Section 953(a) of the Dodd-Frank Wall Street Reform and Consumer Protection Act, and Item 402(v) of Regulation
S-K.
The following table shows the total compensation for the Company’s principal executive officer (“PEO”) and other named executive officers (“NEO”) as set forth in the Summary Compensation Table, the compensation “actually paid” (“CAP”) to the NEOs, the Company’s total shareholder return (“TSR”), and our net income (loss) for the past four fiscal years: Fiscal Year |
Summary Compensation Table Total For PEO ($)(1) |
Compensation Actually Paid to PEO ($)(1)(4) |
Average Summary Compensation Table Total for Non- PEO NEOs ($)(2) |
Average Compensation Actually Paid to Non-PEO NEOs ($)(4) |
Value of Initial Fixed $100 Investment Based on TSR ($)(3) |
Net Income (Loss)($) |
||||||||||||||||||
2025 |
393,475 | 393,475 | 389,720 | 389,720 | 97.42 | 8,446,383 | ||||||||||||||||||
2024 |
393,475 | 393,475 | 389,720 | 389,720 | 107.83 | 8,611,262 | ||||||||||||||||||
2023 |
393,475 | 393,475 | 389,720 | 389,720 | 90.44 | 10,898,864 | ||||||||||||||||||
2022 |
333,475 | 333,475 | 329,720 | 329,720 | 73.53 | 7,232,029 | ||||||||||||||||||
| (1) | For fiscal years 2025, 2024, 2023, and 2022 the Company’s PEO was Mr. Terry E. Trexler. |
| (2) | For fiscal years 2025, 2024, 2023, and 2022, the Company’s Non-PEO NEO was Thomas W. Trexler. |
| (3) | TSR is calculated by dividing the difference between the Company’s share price at the end and the beginning of the measurement period by the Company’s share price at the beginning of the measurement period. |
| (4) | SEC rules require that certain adjustments be made to the Summary Compensation Table totals to determine CAP, as reported in the Pay versus Performance Table above. In accordance with the requirements of Item 402(v)(2)(iii) of Regulation S-K, there were no adjustments required to be made to the summary compensation table total for each year to determine CAP for either our PEO or our non-PEO NEOs. |
Non-PEO
NEO was Thomas W. Trexler.
PEO and
Non-PEO
Compensation Actually Paid and Company Total Stockholder ReturnThe following chart sets forth the relationship between CAP paid to our PEO, the average CAP paid to our
Non-PEO
NEOs, and the Company’s TSR over the period covering fiscal years 2022 to 2025. 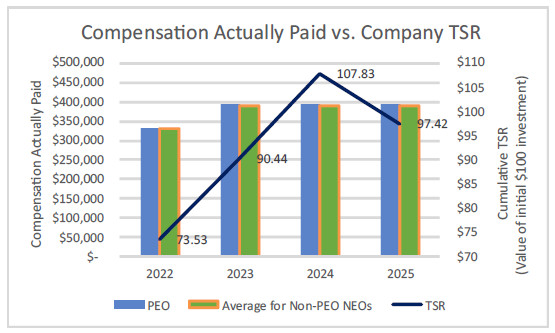
PEO and
Non-PEO
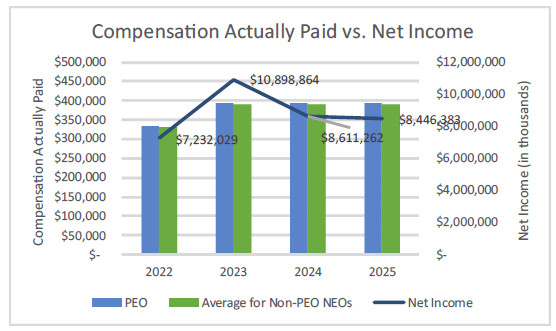
Compensation Actually Paid and Net Income The following chart sets forth the relationship between CAP paid to our PEO, the average CAP paid to our
Non-PEO
NEOs, and the Company’s Net Income over the period covering fiscal years 2022 to 2025.