The bar chart below shows how the Fund’s investment results have varied from year to year as represented by the performance of Institutional Class shares. Returns for Investor Class shares, which are not presented in the bar chart, would be different than the returns for Institutional Class shares. The table below shows how the Fund’s average annual total returns compare over time to those of a broad-based index. This information provides some indication of the risks of investing in the Fund. Past performance is not necessarily an indication of how the Fund will perform in the future.
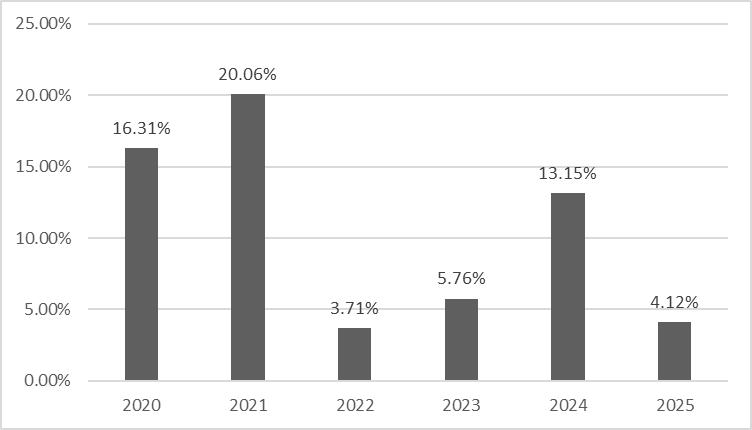
Highest/Lowest quarterly results during this time period were:
| Highest Quarter: | 14.66% | |
| Lowest Quarter: | (4.54)% |
| One Year | Five Years | Since Inception (12/30/2019) | ||||
| Standpoint Multi-Asset Fund – Institutional Class | ||||||
| Before Taxes | 4.12% | 9.18% | 10.33% | |||
| After Taxes on Distributions | 3.94% | 7.83% | 9.12% | |||
| After Taxes on Distributions and Sale of Fund Shares | 2.57% | 6.74% | 7.80% | |||
| Standpoint Multi-Asset Fund – Investor Class | ||||||
| Before Taxes | 3.85% | 8.91% | 10.07% | |||
| Bloomberg Global Aggregate Total Return Index Value Hedged USD(1)(3) (reflects no deduction for fees, expenses, or U.S. taxes) | 4.86% | 0.34% | 1.19% | |||
| ICE BofA US Treasury Bill Index(2)(3) (reflects no deduction for fees, expenses, or U.S. taxes) | 4.28% | 3.18% | 2.77% |
| (1) | As of the date of this Prospectus, the Fund has replaced its primary index to Bloomberg Global Aggregate Total Return Index Value Hedged USD as its broad based index comparison. The Bloomberg Global Aggregate Total Return Index Value Hedged USD (LEGATRUH) is a benchmark measuring global investment-grade, fixed-rate debt, including treasury, corporate, and securitized bonds from developed and emerging markets. It hedges currency exposure back to the USD. |
| (2) | The ICE BofA U.S. Treasury Bill Index tracks the performance of US dollar denominated US Treasury Bills publicly issued in the US domestic market. Qualifying securities must have at least one month remaining term to final maturity and a minimum amount outstanding of $1 billion. Securities issued or marketed primarily to retail investors are excluded. |
| (3) | Index returns do not reflect the deduction of expenses, which have been deducted from the Fund’s returns. Index returns assume reinvestment of all distributions and do not reflect the deduction of taxes and fees. An individual cannot invest directly in an index. |
After-tax returns are calculated using the historical highest individual federal marginal income tax rates and do not reflect the impact of state and local taxes. Actual after-tax returns depend on an investor’s tax situation and may differ from those shown. After-tax returns shown are not relevant to investors who hold their Fund shares through tax-deferred arrangements, such as 401(k) plans or individual retirement accounts (“IRAs”). After-tax returns are shown for the Institutional Class only and will vary for the Investor Class. The returns of the indices presented above assume reinvestment of all distributions and exclude the effect of taxes and fees (if expenses and taxes were deducted, the actual returns of the indices would be lower).
Current performance of the Fund may be lower or higher than the performance quoted above. Performance data current to the most recent month end may be obtained by calling toll-free (866) 738-1128 or accessed on the Fund’s website at www.standpointfunds.com.