Performance Management - Nomura Global Listed Real Assets Fund - Nomura Global Listed Real Assets Fund
Oct. 31, 2025
The bar chart and table below provide some indication of the risks of investing in the Fund. The bar chart shows changes in the Fund’s performance from year to year and the table shows how the Fund’s average annual total returns for the 1-, 5-, and 10-year or lifetime periods compare with those of a broad measure of market performance and additional indices with characteristics relevant to the Fund.
Prior to the close of business on August 19, 2019, the Fund invested primarily in securities of companies principally engaged in the real estate industry. Since the close of business on August 19, 2019, the Fund has been repositioned to invest primarily in listed real assets securities (Repositioning). The historical returns prior to that time do not reflect the Repositioning.
The Fund’s past performance (before and after taxes) is not necessarily an indication of how the Fund will perform in the future. The returns reflect any expense caps in effect during these periods. The returns would be lower without the expense caps. You may obtain the Fund’s most recently available month-end performance by calling 800-523-1918 or by visiting our website at nomuraassetmanagement.com/performance.
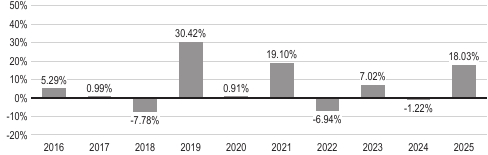
During the periods illustrated in this bar chart, Class A’s highest quarterly return was 15.17% for the quarter ended March 31, 2019, and its lowest quarterly return was -21.27% for the quarter ended March 31, 2020. The maximum Class A sales charge of 5.75%, which is normally deducted when you purchase shares, is not reflected in the highest/lowest quarterly returns or in the bar chart. If this fee were included, the returns would be less than those shown. The average annual total returns in the table below do include the sales charge.
|
|
1 year
|
5 years
|
10 years or
lifetime |
|
Class A return before taxes.................................................
|
11.28%
|
5.44%
|
5.34%
|
|
Class A return after taxes on distributions.......................................
|
10.49%
|
3.91%
|
3.60%
|
|
Class A return after taxes on distributions and sale of Fund shares.....................
|
6.75%
|
3.79%
|
3.62%
|
|
Class C return before taxes.................................................
|
16.15%
|
5.91%
|
5.17%
|
|
Class R return before taxes.................................................
|
17.76%
|
6.43%
|
5.70%
|
|
Class R6 return before taxes (lifetime: 8/31/16–12/31/25)............................
|
18.43%
|
7.07%
|
5.66%
|
|
Institutional Class return before taxes..........................................
|
18.29%
|
6.97%
|
6.23%
|
|
MSCI ACWI (All Country World Index) (gross) (reflects no deduction for fees, expenses, or
taxes)............................................................... |
22.87%
|
11.70%
|
12.28%
|
|
MSCI ACWI (All Country World Index) (net) (reflects no deduction for fees or expenses)......
|
22.34%
|
11.19%
|
11.72%
|
|
Bloomberg Global Inflation-Linked Total Return Index Value Hedged USD (reflects no deduction
for fees, expenses, or taxes)............................................... |
4.46%
|
-1.10%
|
2.51%
|
|
S&P Global Infrastructure Index (net) (reflects no deduction for fees or expenses)...........
|
21.54%
|
10.02%
|
8.47%
|
|
FTSE EPRA Nareit Developed Index (net) (reflects no deduction for fees or expenses).......
|
9.58%
|
2.76%
|
3.25%
|
|
S&P Global Natural Resources Index (net) (reflects no deduction for fees or expenses).......
|
28.86%
|
10.60%
|
10.38%
|
After-tax performance is presented only for Class A shares of the Fund. The after-tax returns for other Fund classes may vary. Actual after-tax returns depend on the investor’s individual tax situation and may differ from the returns shown. After-tax returns are not relevant for shares held in tax-advantaged investment vehicles such as employer-sponsored 401(k) plans and individual retirement accounts (IRAs). The after-tax returns shown are calculated using the highest individual federal marginal income tax rates in effect during the periods presented and do not reflect the impact of state and local taxes.