Risk management
Dec. 31, 2025
Basis of disclosures (*) The risk management section contains information relating to the nature and extent of the risks of financial instruments as required by International Financial Reporting Standards (IFRS) 7 ‘Financial Instruments: Disclosures’. These disclosures are an integral part of the ING Group Consolidated financial statements and are indicated by the symbol (*). This is applicable for the chapters, paragraphs, graphs, or tables within the risk management section that are indicated with this symbol in the respective headings or table header. This risk management section includes additional disclosures beyond those required by IFRS, such as certain legal and regulatory disclosures. Not all information in this section can be reconciled back to the primary financial statements and corresponding notes, as it has been prepared using risk data that differs from the accounting basis of measurement. Disclosures in accordance with Part Eight of the CRR3 and CRD VI, and as required by the supervisory authority, are published in our ‘Additional Pillar III Report’, which can be found on our corporate website ing.com. | ||
In the table below, we describe the different types of credit and
counterparty risk categories and include a reconciliation with the notes in
the financial statements:
Credit risk appetite and concentration risk framework (*)
The credit risk appetite and concentration risk framework is designed to
prevent undesired high levels of credit risk and credit concentrations within
various levels of the ING portfolio. It is derived from the concepts of
boundaries and instruments as described in the ING Risk Appetite Framework.
Credit risk appetite is the maximum level of credit risk ING is willing to
accept for growth and value creation. The credit risk appetite is linked to
the overall bank-wide framework and is expressed in quantitative and
qualitative measures.
The credit risk appetite is set at different levels and dimensions within ING.
The credit risk appetite framework specifies the scope and focus of the
credit risk ING is willing to take, as well the composition of the credit
portfolio, including the concentration and diversification objectives across
business lines, locations, sectors, and products.
Reconciliation between credit & counterparty risk categories and financial position (*) | ||
Credit risk categories | Notes in the financial statements | |
Lending risk: The risk that the client (counterparty, corporate, or individual) does not pay the principal interest or fees on a loan when they are due, or on demand for letters of credit (LCs) and guarantees provided by ING. | 2 | Cash and balances with central banks |
3 | Loans and advances to banks | |
4 | Financial assets at fair value through profit or loss | |
5 | Financial assets at fair value through other comprehensive income | |
7 | Loans and advances to customers | |
41 | Commitments | |
Investment risk: The credit default and risk rating migration risk that is associated with ING’s investments in bonds, commercial paper, equities, securitisations, and other similar publicly traded securities. This can be viewed as the potential loss that ING may incur from holding a position in underlying securities whose issuer's credit quality deteriorates or defaults. | 4 | Financial assets at fair value through profit or loss |
5 | Financial assets at fair value through other comprehensive income | |
6 | Debt securities | |
Money market risk: This arises when ING places short-term deposits with a counterparty in order to manage excess liquidity. In the event of a counterparty default, ING may lose the deposit placed. | 2 | Cash and balances with central banks |
3 | Loans and advances to banks | |
7 | Loans and advances to customers | |
Pre-settlement risk: This arises when a client defaults on a transaction before settlement and ING must replace the contract by a trade with another counterparty at the then prevailing (possibly unfavourable) market price. This credit risk category is associated with derivatives transactions (exchange-traded derivatives, over-the-counter (OTC) derivatives and securities financing transactions). | 4 | Financial assets at fair value through profit or loss |
14 | Financial liabilities at fair value through profit or loss | |
40 | Offsetting financial assets and liabilities | |
Settlement risk: This arises when there is an exchange of value (funds or instruments) and receipt from its counterparty is not verified or expected until after ING has given irrevocable instructions to pay or has paid or delivered its side of the trade. The risk is that ING delivers but does not receive delivery from its counterparty. | 4 | Financial assets at fair value through profit or loss |
11 | Other assets | |
14 | Financial liabilities at fair value through profit or loss | |
16 | Other liabilities | |
The credit concentration risk framework is composed of:
§Country risk concentration: Country risk is the risk that arises due to
events in a specific country (or group of countries). To manage the
maximum country loss ING is willing to accept, boundaries are
approved by the SB. The estimated level is correlated to the risk rating
assigned to a given country. Actual country limits are set by means of
country instruments, which are monitored monthly and updated when
needed. For countries with elevated levels of geopolitical or severe
economic cycle risk, monitoring is performed on a more frequent basis,
with strict pipeline and exposure management.
§Single name concentration (including secondary risk): ING has an
established credit concentration risk framework to identify, measure,
and monitor single name concentration, including secondary risk. The
same concept of boundaries and instruments is applicable.
§Sector and product concentration risk are managed via the credit risk
appetite framework.
Credit risk portfolio (*)Within ING, credit risk exposures are classified into four sources: 1)
Consumer Lending (to private individuals), 2) Business Lending, 3)
Investment and Money Market and 4) Pre-settlement. ING’s credit
exposure is mainly related to lending to individuals (also referred to as
consumer lending, all Retail) and businesses (referred to as business
lending, both in Retail and Wholesale), followed by investments in bonds
and securitised assets, and money market (Wholesale). Loans to
individuals are mainly mortgage loans secured by residential property.
Loans (including guarantees issued) to businesses are often collateralised,
but may be unsecured based on the internal analysis of the borrower’s
creditworthiness. Bonds in the investment portfolio are generally
unsecured, but predominantly consist of bonds issued by central
governments and EU and/or OECD-based financial institutions. Secured
bonds, such as mortgage-backed securities and asset-backed securities,
are secured by the underlying diversified pool of assets (commercial or
residential mortgages, car loans and/or other assets) held by the securities
issuer. For money market, exposure is mainly deposits to central banks.
The last major credit risk source involves pre-settlement exposures which
arise from trading activities, including derivatives, repurchase transactions
and securities lending/borrowing transactions. This is also commonly
referred to as counterparty credit risk.
Overall portfolio (*)
During 2025, ING’s portfolio size increased by €41.1 billion (4.3%) to
€1,002.9 billion outstanding. Foreign exchange rate changes had a €22.0
billion negative impact on the portfolio size, mainly driven by the
depreciation of the US dollar which had an impact of €16.6 billion mainly in
Wholesale Banking. Following this, net growth in Wholesale Banking was
€4.4 billion. Retail Banking outstandings increased by €38.4 billion mainly
due to underlying growth in residential mortgages.
Rating distribution (*)
Overall, the rating class distribution remained stable in 2025. The share of
investment grade rating classes increased from 78.1% to 79.3%, while the
share of non-investment grade decreased from 19.9% to 18.7%.
Performing restructuring outstandings remained constant at 0.6% of the
total portfolio in 2025, whereas non-performing loans (calculated
including Investment and Pre-Settlement exposures) decreased from 1.4%
to 1.3%.
With respect to the rating distribution within the business lines, in
Wholesale Banking, investment grade increased to 84.3% from 83.7%,
while non-investment grade exposures decreased to 13.9% from 14.6%
compared to 2024. Performing restructuring assets increased from 0.6%
to 0.7% of total Wholesale Banking assets where non-performing loans for
Wholesale Banking decreased from 1.2% to 1.1%.
For Retail Banking, investment grade increased to 75.4% from 73.3%,
while non-investment grade exposures decreased to 22.5% from 24.4% as
compared to 2024. Performing restructuring decreased to 0.6% from 0.7%
whereas NPL remained constant at 1.5% in 2025.
Industry (*)
The industry breakdown is presented in accordance with the NAICS
definition. The increase of €41.1 billion in total volume during 2025 was
mainly due to the increase in Private Individuals (€28.7 billion) and Central
Governments (€13.4 billion) which was partially offset by the decrease in
Central Banks (€ 21.9 billion). The share of Private Individuals increased
from 39.5% last year to 40.7%.
Portfolio analysis per business line (*)
Outstandings per line of business (*) 1, 2, 3 | |||||||||
in EUR million | Wholesale Banking | Retail Banking | Corporate line | Total | |||||
Rating class | 2025 | 2024 | 2025 | 2024 | 2025 | 2024 | 2025 | 2024 | |
Investment grade | 1 (AAA) | 43,030 | 53,363 | 34,022 | 29,151 | 27 | 1,790 | 77,079 | 84,304 |
2-4 (AA) | 70,691 | 72,462 | 68,484 | 63,187 | 1 | 4 | 139,175 | 135,653 | |
5-7 (A) | 130,280 | 101,766 | 149,694 | 140,479 | 555 | 154 | 280,528 | 242,400 | |
8-10 (BBB) | 119,661 | 129,429 | 175,823 | 155,375 | 3,240 | 3,662 | 298,724 | 288,466 | |
Non-investment grade | 11-13 (BB) | 49,980 | 53,757 | 90,916 | 94,753 | 140,896 | 148,510 | ||
14-16 (B) | 8,900 | 7,396 | 33,663 | 31,165 | 42,563 | 38,561 | |||
17 (CCC) | 1,224 | 1,037 | 3,147 | 3,345 | 147 | 170 | 4,518 | 4,552 | |
Performing Restructuring loans | 18 (CC) | 2,209 | 1,792 | 1,945 | 2,001 | 4,154 | 3,794 | ||
19 (C) | 637 | 560 | 1,678 | 1,760 | 2,315 | 2,321 | |||
Non-performing loans | 20-22 (D) | 4,602 | 5,204 | 8,393 | 8,100 | 12,995 | 13,303 | ||
Total | 431,214 | 426,767 | 567,764 | 529,317 | 3,970 | 5,779 | 1,002,947 | 961,863 | |
Industry | |||||||||
Private Individuals | 1,893 | 2,116 | 406,589 | 377,712 | 408,482 | 379,827 | |||
Central Banks | 40,270 | 61,091 | 15,713 | 15,044 | 1,785 | 55,983 | 77,919 | ||
Natural Resources | 39,229 | 39,974 | 1,757 | 1,925 | 40,985 | 41,899 | |||
Real Estate | 25,024 | 24,643 | 29,665 | 28,738 | 54,689 | 53,381 | |||
Commercial Banks | 44,512 | 40,962 | 6,351 | 6,662 | 3,638 | 3,616 | 54,501 | 51,240 | |
Non-Bank Financial Institutions | 65,037 | 64,217 | 1,973 | 2,212 | 262 | 290 | 67,271 | 66,719 | |
Central Governments | 59,600 | 48,389 | 10,280 | 8,107 | 1 | 1 | 69,880 | 56,497 | |
Transportation & Logistics | 25,427 | 27,499 | 6,507 | 6,037 | 31,934 | 33,536 | |||
Utilities | 26,378 | 25,517 | 2,431 | 2,196 | 28,809 | 27,713 | |||
Food, Beverages & Personal Care | 13,798 | 13,827 | 11,298 | 10,419 | 25,096 | 24,246 | |||
Services | 9,489 | 8,844 | 13,756 | 13,442 | 19 | 27 | 23,265 | 22,312 | |
General Industries | 13,235 | 10,512 | 9,655 | 8,812 | 22,890 | 19,324 | |||
Lower Public Administration | 8,904 | 6,959 | 22,529 | 19,598 | 31,433 | 26,557 | |||
Other | 58,418 | 52,218 | 29,261 | 28,412 | 50 | 62 | 87,730 | 80,691 | |
Total | 431,214 | 426,767 | 567,764 | 529,317 | 3,970 | 5,779 | 1,002,947 | 961,863 | |
Outstandings per line of business (*) - continued 1, 2, 3 | |||||||||
in EUR million | Wholesale Banking | Retail Banking | Corporate line | Total | |||||
Region | 2025 | 2024 | 2025 | 2024 | 2025 | 2024 | 2025 | 2024 | |
Europe | Netherlands | 35,165 | 44,421 | 180,030 | 164,590 | 526 | 1,903 | 215,720 | 210,913 |
Belgium | 25,786 | 26,506 | 99,055 | 95,584 | 124,841 | 122,091 | |||
Germany | 29,699 | 27,443 | 136,951 | 128,598 | 22 | 30 | 166,672 | 156,071 | |
Poland | 23,740 | 21,190 | 34,223 | 30,946 | 3 | 57,966 | 52,136 | ||
United Kingdom | 30,475 | 28,257 | 252 | 265 | 78 | 91 | 30,805 | 28,613 | |
France | 26,462 | 24,351 | 3,742 | 3,122 | 3 | 3 | 30,207 | 27,476 | |
Spain | 15,568 | 11,990 | 31,015 | 28,507 | 38 | 36 | 46,620 | 40,533 | |
Luxembourg | 28,844 | 26,176 | 4,587 | 5,139 | 33,431 | 31,314 | |||
Rest of Europe | 70,498 | 72,860 | 26,384 | 23,203 | 37 | 14 | 96,919 | 96,076 | |
America | 83,269 | 86,402 | 2,304 | 2,402 | 201 | 232 | 85,775 | 89,037 | |
Asia | 47,881 | 44,136 | 257 | 215 | 3,060 | 3,464 | 51,198 | 47,815 | |
Australia | 11,673 | 10,887 | 48,938 | 46,723 | 1 | 8 | 60,613 | 57,618 | |
Africa | 2,154 | 2,148 | 27 | 22 | 2,181 | 2,170 | |||
Total | 431,214 | 426,767 | 567,764 | 529,317 | 3,970 | 5,779 | 1,002,947 | 961,863 | |
1Based on credit risk measurement contained in lending, pre-settlement, money market and investment activities.
2Based on the total amount of credit risk in the respective column using ING’s internal credit risk measurement methodologies. Economic sectors (industry) below 2% are not shown separately but grouped in Other.
3Geographical areas are based on country of residence, except for private individuals, for which the geographical areas are based on the primary country of risk.
Portfolio analysis per geographical area (*)
The portfolio analysis per geographical area re-emphasises the
international distribution of ING’s credit portfolio. The Netherlands
maintains the largest portfolio share in a single country with 21.5%
(2024: 21.9%) of the total amount, followed by Germany with 16.6%
(2024: 16.2%), and Belgium with 12.4% (2024: 12.7%).
In terms of region, the majority of the portfolio balance remained in
Europe with 80.1% (2024: 79.6%), followed by the Americas with 8.6%
(2024: 9.3%), and Australia with 6.0% (2024: 6.0%).
The top five countries within Rest of Europe based on outstandings were
Italy (€25.2 billion), Romania (€14.0 billion), Switzerland (€10.9 billion),
Türkiye (€9.7 billion) and Ireland (€5.2 billion).
The main contributors for the overall increase in outstanding are Germany
(€10.6 billion), Spain (€ 6.1 billion), Poland (€ 5.8 billion), and the
Netherlands (€4.8 billion).
Private Individuals remained the largest composition of portfolio balances
for the Netherlands at 62.0% (2024: 58.3%), Belgium at 37.7%
(2024: 37.4%), Germany at 68.5% (2024: 68.8%), and Australia at 68.1%
(2024: 66.1%).The decrease in Central Banks is mainly attributed to the
Netherlands (€13.8 billion), Belgium (€3.6 billion), and Asia (€3.1 billion).
In individual countries, the total share of investment grade/non-
investment grade remains substantial for the Netherlands at 98.5%
(2024: 98.5%), Germany at 98.7% (2024: 98.9%), and Belgium 96.8%
(2024: 96.6%).
In Europe, the increase in investment grade outstandings was mainly
observed in Germany (€11.9 billion), Spain (€ 8.4 billion), Poland (€ 5.2
billion), and France (€3.0 billion).
The net decrease in non-investment grade outstandings was mainly
observed in Spain (€ 2.4 billion), America (€1.9 billion), and Germany (€1.7
billion).
Outstandings by economic sectors and geographical area (*) 1 | ||||||||||||||
in EUR million | Region | Total | ||||||||||||
Industry | Netherlands | Belgium | Germany | Poland | Spain | United Kingdom | Luxembourg | France | Rest of Europe | America | Asia | Australia | Africa | 2025 |
Private Individuals | 133,644 | 47,047 | 114,235 | 18,871 | 29,412 | 117 | 2,734 | 2,038 | 18,761 | 183 | 128 | 41,294 | 20 | 408,482 |
Central Banks | 8,742 | 6,621 | 13,938 | 1,499 | 577 | 3,791 | 6,088 | 6,912 | 6,426 | 1,388 | 55,983 | |||
Natural Resources | 2,220 | 1,257 | 869 | 909 | 156 | 2,848 | 2,254 | 261 | 10,730 | 8,974 | 8,830 | 1,396 | 281 | 40,985 |
Real Estate | 17,212 | 14,082 | 1,184 | 2,356 | 1,749 | 679 | 3,257 | 3,055 | 3,805 | 2,591 | 1,409 | 3,309 | 54,689 | |
Commercial Banks | 1,482 | 504 | 5,605 | 493 | 754 | 4,917 | 6,808 | 5,228 | 8,205 | 9,182 | 10,762 | 398 | 164 | 54,501 |
Non-Bank Financial Institutions | 3,577 | 1,536 | 5,717 | 2,295 | 880 | 8,040 | 6,819 | 6,255 | 5,738 | 21,294 | 3,451 | 1,659 | 10 | 67,271 |
Central Governments | 3,297 | 14,525 | 374 | 11,768 | 6,692 | 31 | 186 | 5,485 | 11,463 | 14,146 | 935 | 400 | 580 | 69,880 |
Transportation & Logistics | 4,652 | 2,132 | 1,239 | 1,759 | 698 | 2,384 | 967 | 839 | 6,048 | 3,665 | 6,196 | 663 | 692 | 31,934 |
Utilities | 1,678 | 1,868 | 3,890 | 1,127 | 1,932 | 3,184 | 539 | 593 | 4,291 | 6,144 | 1,376 | 2,067 | 121 | 28,809 |
Food, Beverages & Personal Care | 8,415 | 3,675 | 604 | 2,425 | 340 | 261 | 1,472 | 801 | 2,998 | 2,358 | 1,269 | 476 | 1 | 25,096 |
Services | 5,322 | 8,420 | 1,906 | 1,639 | 127 | 1,123 | 306 | 394 | 1,464 | 1,106 | 873 | 585 | 1 | 23,265 |
General Industries | 5,118 | 3,232 | 1,304 | 2,957 | 208 | 262 | 476 | 550 | 4,399 | 2,575 | 1,461 | 322 | 25 | 22,890 |
Lower Public Administration | 2,236 | 7,362 | 10,121 | 815 | 682 | 235 | 3,432 | 520 | 1,462 | 38 | 4,528 | 31,433 | ||
Other | 18,125 | 12,579 | 5,685 | 9,053 | 2,413 | 3,169 | 1,290 | 1,277 | 11,584 | 12,097 | 8,044 | 2,127 | 287 | 87,730 |
Total | 215,720 | 124,841 | 166,672 | 57,966 | 46,620 | 30,805 | 33,431 | 30,207 | 96,919 | 85,775 | 51,198 | 60,613 | 2,181 | 1,002,947 |
Rating class | ||||||||||||||
Investment grade | 171,615 | 74,908 | 148,033 | 41,249 | 41,114 | 25,930 | 29,551 | 24,917 | 71,116 | 71,271 | 45,214 | 50,441 | 147 | 795,507 |
Non-investment grade | 40,889 | 45,899 | 16,505 | 14,477 | 4,771 | 4,664 | 3,586 | 5,048 | 22,521 | 12,841 | 5,430 | 9,527 | 1,821 | 187,976 |
Performing Restructuring | 1,528 | 928 | 680 | 694 | 265 | 30 | 53 | 134 | 1,486 | 406 | 66 | 162 | 39 | 6,469 |
Non-performing loans | 1,689 | 3,107 | 1,454 | 1,546 | 470 | 181 | 242 | 108 | 1,795 | 1,257 | 488 | 483 | 175 | 12,995 |
Total | 215,720 | 124,841 | 166,672 | 57,966 | 46,620 | 30,805 | 33,431 | 30,207 | 96,919 | 85,775 | 51,198 | 60,613 | 2,181 | 1,002,947 |
1Geographical areas are based on country of residence, except for Private Individuals for which the geographical areas are based on the primary country of risk.
Outstandings by economic sectors and geographical area (*) 1 | ||||||||||||||
in EUR million | Region | Total | ||||||||||||
Industry | Netherlands | Belgium | Germany | Poland | Spain | United Kingdom | Luxembourg | France | Rest of Europe | America | Asia | Australia | Africa | 2024 |
Private Individuals | 122,914 | 45,611 | 107,415 | 16,525 | 27,083 | 122 | 3,058 | 2,260 | 16,391 | 198 | 129 | 38,106 | 16 | 379,827 |
Central Banks | 22,529 | 10,196 | 13,966 | 1,729 | 510 | 1,935 | 5,737 | 10,913 | 9,525 | 879 | 77,919 | |||
Natural Resources | 2,197 | 1,531 | 881 | 778 | 152 | 3,021 | 2,503 | 405 | 11,212 | 8,475 | 8,989 | 1,593 | 159 | 41,899 |
Real Estate | 16,749 | 13,387 | 1,218 | 2,085 | 1,595 | 552 | 3,446 | 2,713 | 3,707 | 3,220 | 1,066 | 3,642 | 53,381 | |
Commercial Banks | 1,285 | 314 | 4,129 | 695 | 376 | 4,733 | 5,268 | 5,074 | 7,779 | 10,700 | 9,394 | 1,336 | 157 | 51,240 |
Non-Bank Financial Institutions | 2,872 | 1,766 | 5,147 | 2,874 | 249 | 8,479 | 6,031 | 5,932 | 5,174 | 23,367 | 3,518 | 1,255 | 55 | 66,719 |
Central Governments | 1,416 | 11,009 | 51 | 9,435 | 5,308 | 48 | 82 | 3,202 | 9,203 | 15,377 | 288 | 488 | 589 | 56,497 |
Transportation & Logistics | 4,290 | 2,076 | 1,426 | 1,623 | 679 | 2,262 | 828 | 765 | 7,407 | 3,983 | 6,912 | 504 | 781 | 33,536 |
Utilities | 1,805 | 1,843 | 3,920 | 814 | 1,971 | 2,826 | 395 | 712 | 3,951 | 5,886 | 1,187 | 2,253 | 152 | 27,713 |
Food, Beverages & Personal Care | 7,377 | 3,690 | 695 | 2,215 | 351 | 328 | 1,393 | 1,102 | 3,008 | 2,498 | 1,168 | 406 | 14 | 24,246 |
Services | 4,919 | 8,431 | 1,852 | 1,538 | 122 | 869 | 540 | 310 | 1,271 | 1,265 | 516 | 680 | 22,312 | |
General Industries | 4,568 | 2,690 | 1,059 | 2,824 | 219 | 301 | 539 | 484 | 3,862 | 2,039 | 708 | 23 | 8 | 19,324 |
Lower Public Administration | 782 | 6,824 | 7,435 | 608 | 557 | 246 | 3,091 | 476 | 1,554 | 44 | 4,941 | 26,557 | ||
Other | 17,208 | 12,722 | 6,876 | 8,394 | 1,361 | 3,137 | 1,248 | 1,426 | 11,722 | 10,475 | 4,372 | 1,513 | 238 | 80,691 |
Total | 210,913 | 122,091 | 156,071 | 52,136 | 40,533 | 28,613 | 31,314 | 27,476 | 96,076 | 89,037 | 47,815 | 57,618 | 2,170 | 961,863 |
Rating class | ||||||||||||||
Investment grade | 170,093 | 74,882 | 136,096 | 36,029 | 32,741 | 23,844 | 27,235 | 21,886 | 67,110 | 72,686 | 41,203 | 46,959 | 59 | 750,822 |
Non-investment grade | 37,689 | 43,059 | 18,238 | 13,948 | 7,126 | 4,388 | 3,858 | 5,229 | 25,679 | 14,763 | 5,859 | 9,889 | 1,898 | 191,623 |
Performing Restructuring | 1,579 | 1,078 | 305 | 701 | 234 | 59 | 56 | 54 | 1,369 | 443 | 30 | 203 | 4 | 6,114 |
Non-performing loans | 1,552 | 3,071 | 1,432 | 1,458 | 432 | 322 | 166 | 307 | 1,918 | 1,145 | 723 | 568 | 210 | 13,303 |
Total | 210,913 | 122,091 | 156,071 | 52,136 | 40,533 | 28,613 | 31,314 | 27,476 | 96,076 | 89,037 | 47,815 | 57,618 | 2,170 | 961,863 |
1Geographical areas are based on country of residence, except for Private Individuals for which the geographical areas are based on the primary country of risk.
Credit risk mitigation (*)
ING uses various techniques and instruments to mitigate the credit risk
associated with an exposure and to reduce the losses incurred subsequent
to a default by a customer. The most common terminology used in ING for
credit risk protection is ‘cover’. While a cover may be an important
mitigant of credit risk and an alternative source of repayment, generally it
is ING’s practice to lend on the basis of the customer’s creditworthiness
rather than relying on the value of the cover.
Cover forms (*)
Within ING, there are two distinct forms of covers. First, where the asset
has been pledged to ING as collateral or security, ING has the right to
liquidate it should the customer be unable to fulfil its financial obligation.
As such, the proceeds can be applied towards full or partial compensation
of the customer's outstanding exposure. This may be tangible (such as
cash, securities, receivables, inventory, plant and machinery, and
mortgages on real estate properties) or intangible (such as patents,
trademarks, contract rights, and licences). Second, where there is a third-
party obligation, indemnification or undertaking (either by contract and/or
by law), ING has the right to claim from that third party an amount if the
customer fails in its obligations. The most common examples are
guarantees, such as parent guarantees, export credit insurances, or third-
party pledged mortgages. Insurance or reinsurance covers, including
comprehensive private risk insurance (CPRI) may be recognised as
guarantees and effectively function in an equivalent manner. ING accepts
credit risk insurance companies and export credit agencies (ECAs) as cover
providers.
Cover valuation methodology (*)
General guidelines for cover valuation are established with the objective of
ensuring consistent application within ING. These also require that the
value of the cover is monitored on a regular basis. Covers are revalued
periodically and whenever there is reason to believe that the market is
subject to significant changes in conditions. The frequency of monitoring
and revaluation depends on the type of cover.
The valuation method also depends on the type of covers. For asset
collateral, the valuation sources can be the customer’s balance sheet (e.g.
inventory, machinery, and equipment), nominal value (e.g. cash and
receivables), market value (e.g. securities and commodities), independent
valuations (e.g. commercial real estate) and market indices (e.g. residential
real estate). For third-party obligations, the valuation is based on the value
that is attributed to the contract between ING and that third party.
Where collateral values are used in the calculation of Stage 3 individual
loan loss provisions, haircuts may be applied to the valuation in specific
circumstances to sufficiently include all relevant factors impacting future
cash flows. ING applies haircuts to the collateral values of real estate,
shipping and aviation assets that are used in the calculation of the loss-
given-default in recovery scenarios. The haircut reflects the risks of
adverse price developments between the moment of valuation of an asset
and the actual settlement/cash receipt.
Cover values (*)
This section provides insight into the types of cover and the extent to
which exposures benefit from collateral or guarantees. The disclosure
differentiates between risk categories (lending, investment, money market
and pre-settlement). The most relevant types of cover include mortgages
(market values), financial collateral (cash and securities), guarantees, and
other covers (mainly pledges). The scope of covers in this overview has
been revised due to CRR3 implementation to align with regulatory
reporting. This explains the decrease in the values of 'other covers', which
had only a limited effect on the fully covered part of the portfolio, as ING's
portfolio remains well collateralised. Collateral covering financial market
transactions is valued on a daily basis (margining), and is as such not
included in the following tables. To mitigate the credit risk arising from
financial markets transactions, the bank enters into legal agreements
governing the exchange of financial collateral (high-quality government
bonds and cash).
The cover values are presented for the total portfolio of ING, both the
performing and non-performing portfolio.
Cover values including guarantees received (*) | ||||||||
in EUR million | Cover type and value | Collateralisation | ||||||
2025 | Outstandings | Mortgages | Financial Collateral | Guarantees | Other covers | No cover | Partially covered | Fully covered |
Consumer lending | 407,552 | 905,028 | 5,317 | 37,473 | 842 | 7.8% | 2.0% | 90.2% |
Business lending | 383,536 | 186,276 | 31,834 | 166,953 | 215,177 | 42.1% | 15.8% | 42.1% |
Investment and money market | 151,639 | — | — | 1,506 | — | 99.6% | —% | 0.4% |
Total lending, investment and money market | 942,727 | 1,091,304 | 37,151 | 205,932 | 216,019 | 36.6% | 7.3% | 56.1% |
of which NPL | 12,981 | 9,827 | 196 | 2,771 | 3,591 | 33.0% | 18.5% | 48.5% |
Pre-settlement | 60,220 | |||||||
Total Group | 1,002,947 | |||||||
Cover values including guarantees received (*) | ||||||||
in EUR million | Cover type and value | Collateralisation | ||||||
2024 | Outstandings | Mortgages | Financial Collateral | Guarantees | Other covers | No cover | Partially covered | Fully covered |
Consumer lending | 378,832 | 865,466 | 6,257 | 25,428 | 55,115 | 6.5% | 2.0% | 91.5% |
Business lending | 368,570 | 163,143 | 24,838 | 119,410 | 484,148 | 34.1% | 23.7% | 42.2% |
Investment and money market | 153,493 | — | — | 1,115 | 95 | 99.3% | —% | 0.7% |
Total lending, investment and money market | 900,894 | 1,028,609 | 31,095 | 145,953 | 539,357 | 33.6% | 10.5% | 55.9% |
of which NPL | 13,295 | 10,427 | 194 | 3,093 | 11,109 | 27.6% | 27.7% | 44.7% |
Pre-settlement | 60,968 | |||||||
Total | 961,863 | |||||||
The above tables gives an overview of the collateralisation of ING’s total
portfolio. Excluding the pre-settlement portfolio, 56.1% (2024: 55.9%) of
ING’s outstandings were fully collateralised in 2025. Since investments
traditionally do not require covers, the ‘no covers’ percentage in this
portfolio is over 99.6%.
Consumer lending portfolio (*)
The consumer lending portfolio accounts for 40.6% (2024: 39.4%) of ING’s
total outstanding, primarily consisting of residential mortgage loans and
consequently most collateral consists of mortgages. Mortgage values are
collected in an internal central database and in most cases external data is
used to index the market value.
A significant part of ING’s residential mortgage portfolio is in the
Netherlands (2025: 35.0%, 2024: 35.0% ), Germany (2025: 27.0%,
2024: 27.3%), Belgium (including Luxembourg) (2025: 12.0%, 2024: 12.2%)
and Australia (2025: 10.9%, 2024: 10.6%).
Business lending portfolio (*)
Business lending accounts for 38.2% (2024: 38.3%) of ING’s total
outstanding. Business lending presented in this section does not include
pre-settlement, investment and money market exposures.
Credit quality (*)
ING uses three distinct statuses to categorise the management of clients
with (perceived) deteriorating credit risk profiles. ING makes use of Early
Warning Indicators (EWIs) in daily credit risk management processes,
which relate to a change in (internal and/or external) circumstances or
outlook of the specific obligor, the sector or the portfolio. ING usually
classifies a client with a 'watch list' status (Business lending only) when
there are early warning indicators triggered that detect an increased risk
profile. Watch list status requires more than usual attention, increased
monitoring and quarterly reviews. Some clients with a watch list or EWI
status may develop into a performing restructuring status or a non-
performing status. When there is increasing doubt as to the performance
and collectability of the client’s contractual obligations, the loans are
managed by Global Credit Restructuring (GCR) or by restructuring units in
the various regions and business units. The statuses and links with rating
grades are illustrated in the table below.
Credit quality outstandings (*) | ||
in EUR million | 2025 | 2024 |
Performing not past due | 879,378 | 823,478 |
Business lending performing past due | 8,071 | 9,174 |
Consumer lending performing past due | 895 | 802 |
Non-performing | 12,981 | 13,295 |
Total lending and investment | 901,325 | 846,749 |
Money market | 41,402 | 54,145 |
Pre-settlement | 60,220 | 60,968 |
Total | 1,002,947 | 961,863 |
Past due obligations (*)
Retail Banking measures its portfolio in terms of payment arrears and
determines on a monthly basis if there are any significant changes in the
level of arrears. This methodology applies to Private Individuals as well as
Business lending. An obligation is considered ‘past due’ if it is more than
one day late, subject to materiality thresholds in line with Definition of
Default Regulation. ING aims to help its customers as soon as they are past
due by reminding them of their payment obligations. In its contact with
customers, ING aims to solve the (potential) financial difficulties by offering
a range of measures (e.g. payment arrangements, restructuring). If the
issues cannot be resolved because the customer is unable or unwilling to
pay, for example, the contract is sent to the recovery unit. The facility is
downgraded to risk rating 20 (non-performing) when the facility or obligor
– depending on the level at which the non-performing status is applied – is
more than 90 days past due and to risk rating 21 or 22 in case of an exit
scenario.
The table below represents the breakdown of lending and investment
credit risk outstandings that are performing by age and geographic area.
The past due but performing consumer lending outstanding increased by
€93 million, due to the increase in 1-30 days (€90 million) and 31-60 days
(€3 million).
The largest single country increase was in Belgium (€42 million), followed
by the Netherlands (€22 million), mainly in the 1-30 days bucket.
The largest decrease was seen in Australia (€21 million).
Ageing analysis (past due but performing): Consumer lending portfolio by geographic area, outstandings (*) | |||||||||
in EUR million | 2025 | 2024 | |||||||
Region | Past due for 1–30 days | Past due for 31–60 days | Past due for 61–90 days | Total | Past due for 1–30 days | Past due for 31–60 days | Past due for 61–90 days | Total | |
Europe | Netherlands | 84 | 32 | 6 | 122 | 62 | 35 | 4 | 101 |
Belgium | 219 | 60 | 26 | 305 | 185 | 49 | 29 | 263 | |
Germany | 70 | 37 | 22 | 129 | 65 | 37 | 24 | 125 | |
Poland | 58 | 6 | 3 | 68 | 61 | 9 | 4 | 74 | |
Spain | 22 | 17 | 9 | 48 | 12 | 16 | 8 | 36 | |
Luxembourg | 25 | 5 | 4 | 34 | 22 | 6 | 3 | 32 | |
Rest of Europe | 121 | 23 | 6 | 150 | 93 | 15 | 4 | 112 | |
America | 0 | 1 | 0 | 1 | 0 | 0 | 0 | 1 | |
Asia | 0 | 1 | 0 | 1 | 0 | 0 | 0 | 0 | |
Australia | 29 | 8 | 1 | 38 | 38 | 19 | 2 | 59 | |
Africa | 0 | 0 | 0 | 0 | 0 | 0 | 0 | 0 | |
Total | 628 | 189 | 78 | 895 | 538 | 186 | 78 | 802 | |
Ageing analysis (past due but performing): Business lending portfolio by geographic area, outstandings (*) | |||||||||
in EUR million | 2025 | 2024 | |||||||
Region | Past due for 1–30 days | Past due for 31–60 days | Past due for 61–90 days | Total | Past due for 1–30 days | Past due for 31–60 days | Past due for 61–90 days | Total | |
Europe | Netherlands | 586 | 31 | 9 | 626 | 929 | 14 | 943 | |
Belgium | 476 | 22 | 10 | 508 | 1,187 | 17 | 13 | 1,217 | |
Germany | 415 | 2 | 2 | 419 | 215 | 3 | 2 | 220 | |
Poland | 403 | 31 | 15 | 449 | 173 | 17 | 19 | 209 | |
United Kingdom | 516 | 531 | 1,046 | 830 | 8 | 838 | |||
France | 73 | 73 | 194 | 194 | |||||
Spain | 9 | 9 | 26 | 26 | |||||
Luxembourg | 212 | 9 | 1 | 222 | 367 | 51 | 5 | 423 | |
Rest of Europe | 899 | 17 | 3 | 919 | 630 | 4 | 46 | 681 | |
America | 2,946 | 68 | 3,013 | 3,504 | 95 | 3,599 | |||
Asia | 133 | 133 | 310 | 310 | |||||
Australia | 636 | 10 | 7 | 654 | 469 | 6 | 475 | ||
Africa | 39 | 39 | |||||||
Total | 7,303 | 720 | 47 | 8,071 | 8,873 | 215 | 86 | 9,174 | |
Total past due but performing outstanding of business lending decreased
by €1.1 billion. The decrease was mainly witnessed in the 1–30 days past
due bucket (€1.6 billion) and was offset by the increase in 31-60 days (€0.5
billion) past due bucket, fully in the United Kingdom related to overdue
fees. The largest decreases were in Belgium (€0.7 billion) and America
(€0.6 billion), while the largest increase were in Australia (€0.2 billion),
Germany (€0.2 billion), Poland (€0.2 billion), and the United Kingdom (€0.2
billion).
Forbearance (*)
Forbearance occurs when a client is unable to meet their financial
commitments due to financial difficulties they are facing or are about to
face and ING grants them concessions. Forborne assets are assets for
which forbearance measures have been granted.
Forbearance may enable clients experiencing financial difficulties to
continue repaying their debt.
For business clients, ING mainly applies forbearance measures to support
clients with fundamentally sound business models that are experiencing
temporary difficulties. The aim is to maximise the client’s repayment
ability, thereby avoiding a default situation, and help the client to return to
a performing situation.
For ING Retail units, clear criteria have been established to determine
whether a client is eligible for the forbearance process. Specific approval
mandates are in place to approve the measures, as well as procedures to
manage, monitor, and report the forbearance activities.
ING reviews the performance of forborne exposures at least quarterly,
either on a case-by-case (Business) or portfolio (Retail) basis.
Both performing (risk ratings 1-19) and non-performing (risk ratings 20-22)
exposures are eligible for Forbearance measures. ING uses specific criteria
to move forborne exposures from non-performing to performing or to
remove the forbearance statuses that are consistent with the
corresponding European Banking Authority (EBA) standards. An exposure
is reported as forborne for a minimum of two years. An additional one-
year probation period is applied to forborne exposures that move from
non-performing back to performing.
Summary Forborne portfolio (*) | ||||||||
in EUR million | 2025 | 2024 | ||||||
Business line | Outstandings | Of which: performing | Of which: non-performing | % of total portfolio(1) | Outstandings | Of which: performing | Of which: non-performing | % of total portfolio(1) |
Wholesale Banking | 5,910 | 3,194 | 2,716 | 1.7% | 5,934 | 3,191 | 2,743 | 1.9% |
Retail Banking | 7,551 | 4,538 | 3,013 | 1.4% | 6,883 | 3,987 | 2,897 | 1.3% |
Total | 13,461 | 7,732 | 5,729 | 1.5% | 12,817 | 7,178 | 5,640 | 1.5% |
Summary Forborne portfolio by forbearance type (*) | ||||||||
in EUR million | 2025 | 2024 | ||||||
Forbearance type | Outstandings | Of which: performing | Of which: non-performing | % of total portfolio(1) | Outstandings | Of which: performing | Of which: non-performing | % of total portfolio(1) |
Loan modification | 11,883 | 6,581 | 5,302 | 1.3% | 11,726 | 6,734 | 4,993 | 1.4% |
Refinancing | 1,578 | 1,151 | 427 | 0.2% | 1,091 | 444 | 647 | 0.1% |
Total | 13,461 | 7,732 | 5,729 | 1.5% | 12,817 | 7,178 | 5,640 | 1.5% |
% of total portfolio is based on lending and investment outstandings.
Forborne assets increased by €644 million, mainly due to the increase of
€667 million in Retail Banking, which was offset by a €24 million decrease
in Wholesale Banking. The rise in Retail Banking forborne assets was
primarily driven by residential mortgages in the Netherlands, which
contributed €608 million. This increase was largely the result of the
implementation of an updated framework, under which more clients are
classified as forborne, while outflow is only allowed after a two-year
probation period.
In terms of forbearance type, the increase is mainly witnessed in
refinancing type (€487 million) driven by a few larger files in Wholesale
Banking.
Modification of financial assets (*)
The following table shows:
§Financial assets that were modified during the year (i.e. qualified as
forborne) while they had a loss allowance measured at an amount
equal to lifetime ECL; and
§Financial assets that were reclassified to Stage 1 during the period
while being modified before.
§
Financial assets modified (*) | ||
in EUR million | 2025 | 2024 |
Financial assets modified during the period | ||
Amortised cost before modification | 1,746 | 1,888 |
Net modification results | -72 | -107 |
Financial assets modified since initial recognition | ||
Gross carrying amount at 31 December of financial assets for which loss allowance has changed to 12-month measurement during the period | 1,027 | 1,506 |
Wholesale Banking (*)
Wholesale Banking forborne assets amounted to €5.9 billion (2024:
€5.9 billion), which represented 1.7% (2024: 1.9%) of the total Wholesale
Banking portfolio.
The net decrease in Wholesale Banking forborne assets was driven by a
€27 million reduction in non-performing forborne exposure and partially
offset by a €3 million rise in performing forborne exposures.
Wholesale Bankings' forborne assets show an increase in Telecom due to
refinancing, which was offset by a decrease in other sectors, such as real
estate, food, beverages & personal care, chemicals, health &
pharmaceuticals and natural resources. These five sectors accounted for
69.6% of the total Wholesale Banking forborne outstandings.
Wholesale Banking: Forborne portfolio by geographical area (*) | |||||||
in EUR million | 2025 | 2024 | |||||
Region | Outstandings | Of which: performing | Outstandings | Of which: performing | |||
Europe | Netherlands | 316 | 191 | 124 | 217 | 69 | 148 |
Belgium | 3 | 3 | 0 | 172 | 165 | 7 | |
Germany | 336 | 29 | 307 | 372 | 62 | 310 | |
Poland | 662 | 305 | 357 | 630 | 284 | 346 | |
United Kingdom | 676 | 516 | 160 | 444 | 266 | 178 | |
Italy | 547 | 519 | 28 | 389 | 353 | 36 | |
Rest of Europe | 1,081 | 558 | 523 | 1,339 | 940 | 399 | |
America | 1,313 | 545 | 768 | 1,586 | 867 | 719 | |
Asia | 711 | 313 | 398 | 652 | 111 | 541 | |
Australia | 212 | 177 | 35 | 79 | 34 | 44 | |
Africa | 53 | 37 | 15 | 54 | 40 | 15 | |
Total | 5,910 | 3,194 | 2,716 | 5,934 | 3,191 | 2,743 | |
Wholesale Banking: Forborne portfolio by economic sector (*) | ||||||
in EUR million | 2025 | 2024 | ||||
Industry | Outstandings | Outstandings | ||||
Natural Resources | 605 | 308 | 297 | 781 | 424 | 356 |
Real Estate | 945 | 375 | 570 | 1,115 | 703 | 412 |
Transportation & Logistics | 145 | 48 | 97 | 214 | 83 | 131 |
Food, Beverages & Personal Care | 629 | 289 | 340 | 810 | 415 | 395 |
Services | 172 | 149 | 24 | 211 | 176 | 34 |
Automotive | 263 | 139 | 124 | 332 | 183 | 149 |
Utilities | 497 | 218 | 279 | 677 | 301 | 376 |
General Industries | 197 | 42 | 155 | 127 | 70 | 58 |
Retail | 111 | 41 | 70 | 149 | 21 | 128 |
Chemicals, Health & Pharmaceuticals | 619 | 74 | 545 | 668 | 136 | 532 |
Builders & Contractors | 179 | 174 | 4 | 122 | 118 | 5 |
Telecom1 | 1,314 | 1,166 | 148 | 486 | 383 | 103 |
Other | 234 | 172 | 62 | 243 | 178 | 65 |
Total | 5,910 | 3,194 | 2,716 | 5,934 | 3,191 | 2,743 |
1The presentation has been revised to separately disclose Telecom. Comparative figures have been adjusted accordingly.
Retail Banking (*)
As of year end, Retail Banking forborne assets amounted to €7.6 billion
(2024: €6.9 billion), which represented 1.4% (2024: 1.3%) of the total Retail
Banking portfolio. Retail Banking performing forborne exposure increased
by €0.6 billion.
The main concentration of forborne assets in a single country was in
Belgium with 28.5% (2024: 28.2%) of total Retail Banking forborne assets
and 39.0% (2024: 39.4%) of the non-performing forborne assets. The other
significant single country concentration is in the Netherlands with 28.3%
(2024: 22.5%), which increased during 2025 because of the
implementation of a new framework for mortgages, and Germany having
17.3% (2024: 20.0%) of the total Retail forborne assets.
Retail Banking: Forborne portfolio by geographical area (*) | |||||||
in EUR million | 2025 | 2024 | |||||
Region | Outstandings | Of which: performing | Of which: non- performing | Outstandings | Of which: performing | Of which: non- performing | |
Europe | Netherlands | 2,136 | 1,711 | 424 | 1,548 | 1,134 | 414 |
Belgium | 2,153 | 978 | 1,175 | 1,942 | 800 | 1,142 | |
Germany | 1,304 | 965 | 338 | 1,379 | 1,052 | 327 | |
Poland | 793 | 361 | 432 | 777 | 403 | 374 | |
Spain | 92 | 55 | 37 | 159 | 127 | 31 | |
Italy | 104 | 33 | 70 | 122 | 43 | 79 | |
Türkiye | 22 | 16 | 6 | 13 | 9 | 4 | |
Romania | 216 | 106 | 110 | 173 | 72 | 101 | |
Rest of Europe | 91 | 32 | 59 | 102 | 50 | 52 | |
America | 5 | 5 | 22 | 17 | 6 | ||
Asia | 1 | 1 | 1 | ||||
Australia | 635 | 279 | 357 | 646 | 279 | 367 | |
Africa | |||||||
Total | 7,551 | 4,538 | 3,013 | 6,883 | 3,987 | 2,897 | |
Non-performing loans (*)
ING has aligned the regulatory concept of non-performing with that of the
definition of default. Hence, borrowers are classified as non-performing
when a default trigger occurs (non-exhaustive list):
§ING believes the borrower is unlikely to pay. The borrower has
evidenced significant financial difficulty, to the extent that it will have a
negative impact on the future cash flows of the financial asset. The
following events could be seen as indicators of financial difficulty:
–The borrower (or third party) has started insolvency proceedings;
–A group company/co-borrower has NPL status;
–Indication of fraud (affecting the company’s ability to service its
debt);
–There is doubt as to the borrower’s ability to generate stable and
sufficient cash flows to service its debt;
–Restructuring of debt; and
–ING has granted concessions relating to the borrower’s financial
difficulty, the effect of which is a reduction in expected future cash
flows of the financial asset below current carrying amount.
§The obligor has failed in the payment of principal, interest, or fees; the
total past due amount is above the materiality threshold, and this
remains the case for more than 90 consecutive days.
Furthermore, Wholesale Banking has an individual name approach, using
early warning indicators to signal possible future issues in debt service.
Also in Retail Banking early warning indicator frameworks have been
implemented.
The table below represents the breakdown of credit risk outstandings that
have been classified as non-performing by sector and business line.
Non-performing Loans: Outstandings by economic sector and business lines (*) 1 | ||||||
in EUR million | Wholesale Banking | Retail Banking | Total | |||
Industry | 2025 | 2024 | 2025 | 2024 | 2025 | 2024 |
Private Individuals | 3 | 4 | 4,899 | 4,766 | 4,902 | 4,769 |
Natural Resources | 945 | 965 | 115 | 99 | 1,061 | 1,064 |
Food, Beverages & Personal Care | 372 | 452 | 325 | 357 | 697 | 809 |
Transportation & Logistics | 251 | 347 | 227 | 157 | 478 | 504 |
Services | 94 | 102 | 375 | 394 | 469 | 495 |
Real Estate | 586 | 831 | 656 | 603 | 1,241 | 1,434 |
General Industries | 243 | 236 | 471 | 451 | 713 | 687 |
Builders & Contractors | 31 | 51 | 541 | 445 | 571 | 496 |
Retail | 184 | 157 | 189 | 224 | 373 | 381 |
Utilities | 336 | 582 | 26 | 19 | 362 | 600 |
Chemicals, Health & Pharmaceuticals | 602 | 654 | 150 | 185 | 752 | 839 |
Telecom2 | 170 | 151 | 36 | 12 | 206 | 163 |
Other | 771 | 666 | 383 | 387 | 1,154 | 1,052 |
Total | 4,589 | 5,196 | 8,392 | 8,099 | 12,981 | 13,295 |
1Based on lending and investment outstandings.
2The presentation has been revised to separately disclose Telecom. Comparative figures have been adjusted accordingly.
Non-performing loans: Outstandings by economic sectors and geographical area (*) | ||||||||||||||
in EUR million | Region | Total | ||||||||||||
Industry | Netherlands | Belgium | Germany | Poland | Spain | United Kingdom | France | Luxembourg | Rest of Europe | America | Asia | Australia | Africa | 2025 |
Private Individuals | 697 | 1,481 | 1,113 | 220 | 357 | 10 | 8 | 39 | 574 | 2 | 2 | 399 | 1 | 4,902 |
Natural Resources | 137 | 84 | 28 | 14 | 584 | 23 | 191 | 1,061 | ||||||
Food, Beverages & Personal Care | 167 | 94 | 1 | 94 | 19 | 6 | 126 | 59 | 131 | 697 | ||||
Transportation & Logistics | 87 | 40 | 136 | 47 | 22 | 72 | 22 | 10 | 1 | 41 | 478 | |||
Services | 68 | 262 | 75 | 1 | 3 | 4 | 16 | 26 | 13 | 469 | ||||
Real Estate | 24 | 419 | 59 | 115 | 45 | 47 | 101 | 8 | 377 | 48 | 1,241 | |||
General Industries | 137 | 138 | 38 | 196 | 20 | 13 | 130 | 10 | 31 | 713 | ||||
Builders & Contractors | 89 | 219 | 7 | 182 | 8 | 66 | 571 | |||||||
Retail | 80 | 79 | 33 | 56 | 1 | 4 | 15 | 105 | 373 | |||||
Utilities | 14 | 10 | 19 | 8 | 151 | 1 | 12 | 80 | 33 | 35 | 362 | |||
Chemicals, Health & Pharmaceuticals | 47 | 65 | 112 | 346 | 43 | 25 | 64 | 49 | 752 | |||||
Telecom | 37 | 4 | 3 | 15 | 146 | 2 | 206 | |||||||
Other | 102 | 209 | 72 | 88 | 2 | 1 | 10 | 105 | 358 | 75 | 132 | 1,154 | ||
Total | 1,686 | 3,105 | 1,454 | 1,546 | 470 | 181 | 108 | 242 | 1,786 | 1,257 | 488 | 483 | 175 | 12,981 |
Non-performing loans: Outstandings by economic sectors and geographical area (*) | ||||||||||||||
in EUR million | Region | Total | ||||||||||||
Industry | Netherlands | Belgium | Germany | Poland | Spain | United Kingdom | France | Luxembourg | Rest of Europe | America | Asia | Australia | Africa | 2024 |
Private Individuals | 646 | 1,461 | 1,066 | 210 | 304 | 10 | 8 | 44 | 545 | 2 | 2 | 469 | 4,769 | |
Natural Resources | 13 | 54 | 33 | 569 | 31 | 343 | 21 | 1,064 | ||||||
Food, Beverages & Personal Care | 196 | 154 | 1 | 93 | 23 | 5 | 158 | 51 | 127 | 809 | ||||
Transportation & Logistics | 93 | 40 | 3 | 124 | 47 | 1 | 136 | 1 | 59 | 504 | ||||
Services | 57 | 293 | 5 | 87 | 2 | 1 | 3 | 5 | 10 | 34 | 495 | |||
Real Estate | 12 | 374 | 63 | 114 | 59 | 59 | 90 | 6 | 606 | 52 | 1,434 | |||
General Industries | 153 | 123 | 24 | 147 | 20 | 2 | 1 | 170 | 17 | 30 | 687 | |||
Builders & Contractors | 68 | 175 | 5 | 162 | 7 | 78 | 496 | |||||||
Retail | 53 | 97 | 39 | 62 | 3 | 14 | 97 | 15 | 1 | 381 | ||||
Utilities | 13 | 8 | 25 | 21 | 285 | 12 | 128 | 109 | 600 | |||||
Chemicals, Health & Pharmaceuticals | 37 | 94 | 84 | 340 | 1 | 110 | 113 | 36 | 24 | 839 | ||||
Telecom | 7 | 1 | 3 | 44 | 14 | 90 | 4 | 163 | ||||||
Other | 202 | 198 | 117 | 60 | 2 | 72 | 17 | 90 | 54 | 92 | 150 | 1,052 | ||
Total | 1,549 | 3,071 | 1,432 | 1,457 | 432 | 322 | 307 | 166 | 1,916 | 1,145 | 723 | 567 | 210 | 13,295 |
In 2025, the NPL portfolio decreased to €13.0 billion (2024: €13.3 billion),
mainly driven by the decrease of €0.6 billion in Wholesale Banking. The
decrease was offset by the increase in Retail Banking (€0.3 billion) in line
with strong portfolio growth, mainly in residential mortgages.
Total net decrease was mainly seen in sectors Utilities, Real Estate and
Food, Beverage & Personal Care while the largest increase was in Private
Individuals.
Loan loss provisioning (*)
ING recognises loss allowances based on the expected credit loss (ECL)
model of IFRS 9, which is designed to be forward-looking. The IFRS 9
impairment requirements are applicable to on-balance-sheet financial
assets measured at amortised cost or fair value through other
comprehensive income (FVOCI), such as loans, debt securities, and lease
receivables, as well as off-balance-sheet items such as undrawn loan
commitments and financial- and non-financial guarantees issued.
ING distinguishes between two types of calculation methods for credit loss
allowances:
§Collective 12-month ECL (Stage 1) and collective lifetime ECL (Stage 2)
for portfolios of financial instruments, as well as collective lifetime ECL
for credit-impaired exposures (Stage 3) below €1 million; and
§Individual lifetime ECL for credit-impaired (Stage 3) financial
instruments with exposures above €1 million.
IFRS 9 models (*)
ING’s IFRS 9 models leverage on the internal rating-based (IRB) models (PD,
LGD, EAD), which include certain required conservatism. To include IFRS 9
requirements, such regulatory conservatism is removed from the ECL
parameters (PD, LGD and EAD). The IFRS 9 models apply two other types of
adjustments to the IRB ECL parameters: (i) to the economic outlook and (ii)
for Stage 2 and Stage 3 assets only, to the lifetime horizon. The IFRS 9
model parameters are estimated based on statistical techniques and
supported by expert judgement.
ING has aligned the definition of default for regulatory purposes with the
definition of ‘credit-impaired’ financial assets under IFRS 9 (Stage 3). ING
has also aligned its definition of default between IFRS 9 and the regulatory
technical standards (RTS) and EBA guidelines.
Climate and environmental risks in IFRS 9 models (*)
Climate risk drivers (physical and transition risks) can reduce the ability of
businesses and households to fulfil their obligations due, under existing
lending contracts. These climate risks are partly reflected in IFRS9 ECL
through regular credit risk transmission channels such as the
macroeconomic forecast and relevant risk parameters.
On the other hand, future physical or transition risks from climate change
are not yet fully captured within the current ECL models. In our
assessment of physical risks, it is generally expected that these risks will
only become financially significant on the long-term horizon.
Consequently, for short- and medium-term loans, such risks are not
expected to lead to significant credit deterioration over the exposure’s
lifetime. For the long term, the probability and timing of physical risk
events remain highly uncertain. ING is however actively enhancing the
integration of physical and transition risks into collateral valuations,
ensuring that effects on property values are appropriately captured.
In case of risk events that have already occurred (e.g. floods, stranded
assets), the impact of such events is assessed in the calculation of Stage 3
individual provisions, collective SICR or management adjustments to ECL
models. For example, we consider whether affected assets have suffered
from a significant increase in credit risk (or are credit impaired) and
whether the ECL is appropriate.
Additionally, a management adjustment to ECL models for business
clients was introduced to specifically cover for medium- to long-term
transition risk on high greenhouse gas-emitting sectors. The management
adjustment reflects the risk of financial loss foreseen on the longer horizon
for lenders with higher transition risk in these high greenhouse gas-
emitting sectors as consequence of future carbon taxation. ‘See
Management adjustments applied this reporting period’.
ING is continuously improving on climate risk data, which will enable us to
further embed climate risks into the IFRS 9 ECL models. For more
information on ESG risk management, see ‘ESG risk’.
The table below describes the portfolio composition over the different
IFRS 9 stages and rating classes. The Stage 1 portfolio represents 92.0%
(2024: 91.1%) of the total gross carrying amounts, mainly composed of
investment grade, while Stage 2 makes up 6.8% (2024: 7.6%) and Stage 3
makes up 1.2% (2024: 1.3%) of the total gross carrying amounts,
respectively.
Gross carrying amount per IFRS 9 stage and rating class (*) 1,2 | |||||||||||||||||
in EUR million | 12-month ECL (Stage 1) | Lifetime ECL not credit impaired (Stage 2) | Lifetime ECL credit impaired (Stage 3) | Total | |||||||||||||
Rating class | Gross carrying amount | Provisions | Gross carrying amount | Provisions | Gross carrying amount | Provisions | Gross carrying amount | Provisions | |||||||||
2025 | 2024 | 2025 | 2024 | 2025 | 2024 | 2025 | 2024 | 2025 | 2024 | 2025 | 2024 | 2025 | 2024 | 2025 | 2024 | ||
Investment grade | 1 (AAA) | 79,938 | 79,076 | 2 | 1 | 126 | 281 | 80,064 | 79,357 | 2 | 1 | ||||||
2-4 (AA) | 146,878 | 140,671 | 11 | 10 | 1,437 | 1,579 | 1 | 1 | 148,315 | 142,250 | 13 | 11 | |||||
5-7 (A) | 299,699 | 244,241 | 39 | 21 | 5,394 | 6,908 | 6 | 8 | 305,093 | 251,149 | 45 | 29 | |||||
8-10 (BBB) | 334,845 | 310,324 | 77 | 55 | 19,168 | 24,683 | 43 | 55 | 354,012 | 335,008 | 119 | 110 | |||||
Non-investment grade | 11-13 (BB) | 156,373 | 154,348 | 165 | 190 | 17,217 | 18,479 | 89 | 91 | 173,589 | 172,827 | 254 | 281 | ||||
14-16 (B) | 26,187 | 25,377 | 147 | 124 | 22,668 | 17,433 | 357 | 366 | 48,855 | 42,811 | 504 | 490 | |||||
17 (CCC) | 412 | 905 | 5 | 8 | 4,682 | 3,992 | 224 | 173 | 5,094 | 4,897 | 228 | 181 | |||||
Performing Restructuring | 18 (CC) | 4,349 | 4,059 | 262 | 233 | 4,349 | 4,060 | 262 | 233 | ||||||||
19 (C) | 2,447 | 2,474 | 198 | 203 | 2,447 | 2,474 | 198 | 203 | |||||||||
Non-performing loans | 20-22 (D) | 13,590 | 13,742 | 4,476 | 4,509 | 13,590 | 13,742 | 4,476 | 4,509 | ||||||||
Total | 1,044,332 | 954,943 | 446 | 409 | 77,487 | 79,888 | 1,179 | 1,130 | 13,590 | 13,742 | 4,476 | 4,509 | 1,135,409 | 1,048,574 | 6,101 | 6,049 | |
1Compared to the credit risk portfolio, the differences are due to undrawn committed amounts (€200 billion; 2024: €156 billion) and other positions (2025: nil; 2024:€6 billion) not included in credit outstandings and non-IFRS 9 eligible assets (€ 68 billion; 2024: €75 billion) included in credit outstandings but not in the
gross carrying amounts.
2Stage 3 lifetime credit impaired provision includes €29 million (2024: €21 million) on purchased or
originated credit impaired.
Changes in gross carrying amounts and loan loss provisions (*)
The table below provides a reconciliation by stage of the gross carrying
amount and allowances for loans and advances to banks and customers,
including loan commitments and financial guarantees. The transfers of
financial instruments represent the impact of stage transfers upon the
gross carrying/nominal amount and associated allowance for ECL. This
includes the net-remeasurement of ECL arising from stage transfers, for
example, moving from a 12-month (Stage 1) to a lifetime (Stage 2) ECL
measurement basis.
The net-remeasurement line represents the changes in provisions for
facilities that remain in the same stage.
Please note the following comments with respect to the movements
observed in the table below:
§Stage 3 gross carrying amount decreased by €0.2 billion from €13.7
billion as at 31 December 2024 to €13.6 billion as at 31 December 2025,
mainly as a result of €3.5 billion net inflow into NPL (credit impaired) in
2025, which is offset by €2.3 billion derecognitions and repayments
and €1.5 billion write-offs and disposals. Following the decrease in
carrying amount, Stage 3 provisions slightly decreased by €33 million.
§Stage 2 gross carrying amounts decreased by €2.4 billion from €79.9
billion as at 31 December 2024 to €77.5 billion as at 31 December 2025,
largely driven by €15.7 billion net transfers from Stage 1 into Stage 2,
including the impact of changes in risk drivers (including updated
macro-economic forecasts), model redevelopments mainly for
Wholesale Banking models, and new Stage 2 overlays. This was offset
by a decrease of exposure by €18.1 billion due to derecognised
financial assets (including sales and repayments) and €1.2 billion
exposure moving to Stage 3. Stage 2 provisions increased by € 49.3
million to €1.2 billion as of 31 December 2025.
Changes in gross carrying amounts and loan loss provisions (*) 1, 2 | ||||||||||||||||
in EUR million | 12-month ECL (Stage 1) | Lifetime ECL not credit impaired (Stage 2) | Lifetime ECL credit impaired (Stage 3) | Total | 12-month ECL (Stage 1) | Lifetime ECL not credit impaired (Stage 2) | Lifetime ECL credit impaired (Stage 3) | Total | ||||||||
Gross carrying amount | Provisions | Gross carrying amount | Provisions | Gross carrying amount | Provisions | Gross carrying amount | Provisions | Gross carrying amount | Provisions | Gross carrying amount | Provisions | Gross carrying amount | Provisions | Gross carrying amount | Provisions | |
2025 | 2024 | |||||||||||||||
Opening balance | 954,943 | 409 | 79,888 | 1,130 | 13,742 | 4,509 | 1,048,574 | 6,049 | 937,633 | 517 | 75,454 | 1,435 | 11,956 | 3,887 | 1,025,043 | 5,839 |
Transfer into 12-month ECL (Stage 1) | 21,773 | 21 | -21,555 | -199 | -218 | -35 | -212 | 20,486 | 22 | -20,236 | -195 | -249 | -34 | -207 | ||
Transfer into lifetime ECL not credit impaired (Stage 2) | -37,208 | -50 | 38,174 | 533 | -966 | -115 | 368 | -43,155 | -49 | 43,900 | 429 | -745 | -96 | 285 | ||
Transfer into lifetime ECL credit impaired (Stage 3) | -2,534 | -14 | -2,172 | -138 | 4,705 | 1,259 | 1,108 | -2,980 | -18 | -2,856 | -235 | 5,836 | 1,802 | 1,548 | ||
Net remeasurement of loan loss provisions | 7 | -53 | 349 | 302 | -181 | -137 | 185 | -133 | ||||||||
New financial assets originated or purchased | 263,371 | 189 | 22 | 2 | 263,393 | 191 | 212,516 | 192 | 212,516 | 192 | ||||||
Financial assets that have been derecognised | -119,098 | -78 | -12,295 | -147 | -1,422 | -240 | -132,814 | -465 | -126,858 | -76 | -11,840 | -153 | -1,450 | -257 | -140,148 | -485 |
Net drawdowns and repayments | -57,493 | -5,739 | -853 | -64,085 | -41,763 | -4,393 | -309 | -46,465 | ||||||||
Changes in models/risk parameters | -33 | 71 | -35 | 3 | 8 | -6 | -22 | -20 | ||||||||
Increase in loan loss provisions | 43 | 68 | 1,185 | 1,296 | -102 | -297 | 1,578 | 1,179 | ||||||||
Write-offs | -937 | -937 | -937 | -937 | -1,017 | -1,017 | -1,017 | -1,017 | ||||||||
Disposals | -666 | -3 | -84 | -3 | -564 | -286 | -1,314 | -291 | -935 | -1 | -141 | -8 | -279 | -215 | -1,355 | -225 |
Recoveries of amounts previously written off | 58 | 58 | 69 | 69 | ||||||||||||
Other movements | 21,242 | -4 | 1,269 | -16 | 80 | -53 | 22,591 | -73 | -5 | 208 | 203 | |||||
Closing balance | 1,044,332 | 446 | 77,487 | 1,179 | 13,590 | 4,476 | 1,135,409 | 6,101 | 954,943 | 409 | 79,888 | 1,130 | 13,742 | 4,509 | 1,048,574 | 6,049 |
1Stage 3 lifetime credit impaired provision includes €29 million (2024: €21 million) on purchased or originated credit impaired.
2The addition to the loan provision (in the consolidated statement of profit or loss) amounts to €1,304 million (2024: €1,194 million) of which €1,301 million (2024: €1,170 million) related to IFRS 9 eligible financial assets, €-5 million (2024: €9 million) to IFRS eligible commitments and €8 million (2024: €15 million) to
modification gains and losses on restructured financial assets.
of estimation uncertainty (*)
Methodology (*)
This section outlines our methodology for adopting and generating
macroeconomic scenarios. We apply this methodology when producing
our probability-weighted ECL, incorporating alternative scenarios and
management adjustments where necessary. These adjustments are made
when management believes the consensus forecast does not fully capture
the extent of recent credit or economic events. The macroeconomic
scenarios are applicable to the whole ING portfolio in the scope of IFRS 9
ECLs.
The IFRS 9 standard, with its inherent complexities and potential impact on
the carrying amounts of our assets and liabilities, represents a key source
of estimation uncertainty. In particular, ING’s reportable ECL numbers are
sensitive to the forward-looking macroeconomic forecasts used as model
inputs, the probability weights applied to each of the three scenarios, and
the criteria for identifying a significant increase in credit risk. As such,
these crucial components require consultation and management
judgement, and are subject to extensive governance.
Baseline scenario (*)
As a baseline for IFRS 9, ING has adopted a market-neutral view combining
consensus forecasts for economic variables (GDP, unemployment) with
market forwards (for interest rates, exchange rates, and oil prices). Input
from a leading third-party service provider is used to complement the
consensus with consistent projections for variables for which there are no
consensus estimates available (most notably house prices and – for some
countries – unemployment), to generate alternative scenarios, to convert
annual consensus information to a quarterly frequency, and to ensure
general consistency of the scenarios. As the baseline scenario is consistent
with the consensus view, it can be considered as free from any bias.
The relevance and selection of macroeconomic variables is defined by the
ECL models under credit risk model governance. The scenarios are
reviewed and challenged by a panels of ING experts.
Alternative scenarios and probability weights (*)
Two alternative scenarios are taken into account: an upside and a
downside scenario. The alternative scenarios have statistical
characteristics as they are based on the forecast deviations of the leading
third-party service provider.
To understand the baseline level of uncertainty around any forecast, the
leading third-party service provider keeps track of all its deviations (so-
called forecast errors) of the past 30 years. The distribution of forecast
errors for GDP, unemployment, house prices, and share prices is applied to
the baseline forecast creating a broad range of alternative outcomes. In
addition, to understand the balance of risks facing the economy in an
unbiased way, the leading third-party service provider runs a survey with
respondents from around the world and across a broad range of
industries. In this survey, respondents put forward their views of key risks.
Following the survey results, the distribution of forecast errors (that is
being used for determining the scenarios) may be skewed.
For the downside scenario, ING has chosen the 90th percentile of that
distribution because this corresponds with the way risk management
earnings-at-risk is defined within the Group. The upside scenario is
represented by the 10th percentile of the distribution. The applicable
percentiles of the distribution imply a 20 percent probability for each
alternative scenario. Consequently, the baseline scenario has a 60 percent
probability weighting. Please note that, given their technical nature, the
downside and upside scenarios are not based on an explicit specific
narrative and have not changed compared to previous year.
Macroeconomic scenarios applied (*)
The macroeconomic scenarios applied in the calculation of loan loss
provisions are based on the consensus forecasts.
Baseline assumptions (*)
The general picture that the consensus conveys is that global economic
growth is slowing compared to recent years. US growth is expected to
continue to outpace European markets, but the gap is narrowing down.
China is expected to continue a declining growth trend, but still at higher
rates than seen in advanced markets. Inflation is expected to remain near
target for most advanced economies, but a bit above for the United States.
With interest rates moderating, monetary conditions are turning more
favourable for growth. For the housing market, continued price growth is
expected for almost all main markets.
The December 2025 consensus expects global output (as measured by the
weighted average GDP growth rate of ING’s 25 main markets) to remain at
a constant 2.4% from 2025-2027.
The eurozone economy has shown more resilience than expected despite
global headwinds, with sluggish but positive growth through 2025. The
coming years are expected to see modest growth rates as well. The trade
environment continues to be plagued by higher US tariffs and a stronger
euro. Expectations of a pickup in growth over the course of 2026 come
from stronger consumer spending and investment. German infrastructure
spending is expected to add to this momentum. Southern European
economies continue to benefit from European Recovery Fund investments.
Consensus expects the eurozone to have grown by 1.4% in 2025, before
slowing to 1.1% in 2026 and then recovering to 1.3% in 2027.
Elsewhere in Europe, the growth outlook is stronger. Poland’s growth
momentum remains solid, growing faster than its European peers. The key
growth drivers over the near-term forecast are consumption and public
investments, such as those carried out under the National Recovery Plan
(KPO). The economy is expected to grow by 3.6% in 2025, picking up to
3.7% in 2026 and settling at 3.2% in 2027. The consensus expectation for
Türkiye is to see stable growth of 3.5% and 3.4% in 2025 and 2026, as
domestic demand remains resilient and fixed investments and inventories
see an uptick. For 2027, a recovery to 3.7% is expected.
The American economy has held its ground despite the tariff war and
slowing employment growth. Its characterisation by a K-shaped economy
where most of the growth comes from high-income consumers and tech
investments is likely to continue in 2026. Tariffs are not feeding into
inflation as much as expected earlier in the year, and inflation
expectations remain benign, although still above the 2% target. This has
prompted the Federal Reserve to resume its rate cutting cycle. Inflation is
expected to remain around 2.8% and 2.9% in 2025 and 2026 before
steadying down at 2.4% in 2027.The US economy is expected to
experience steady growth of 2.0% in 2025-2027.
For China, economic underperformance continues as it still struggles with
the impact of the real estate correction and weak domestic demand.
However, the economy has come out resilient to the tariff war with a trade
surplus reaching record levels, making external demand the key driver of
2025. This enables the economy to reach its short-term growth target, but
medium-term consensus continues to be downbeat for the moment
because of its weak domestic economy. For 2025, consensus expects
4.9% growth, down to 4.5% in 2026 and 4.3% in 2027.
Economic momentum in Australia is expected to be soft, as much of the
growth in 2025 came from government consumption. The economy is
lacking a clear growth engine, with the private sector struggling against
restrictive policy settings and consumers facing a tough outlook with
weaker employment growth and real wage gains moderating. Growth is
expected to come in at 1.8% in 2025, with a pick-up expected for 2026 to
2.2% and 2.3% for 2027.
When compared to the June 2025 consensus forecast, the December 2025
forecast has improved slightly because of better than expected growth in
major economies. Global GDP is expected to increase by 2.4% in both
2025 and 2026 (compared to 2.0% and 2.1% assumed before). The global
economy showed quite some resilience in 2025 despite trade and
geopolitical tensions, as GDP growth has continued despite political
disruptions. Markets, too, have adjusted to the new world of volatility.
Alternative scenarios and risks (*)
The baseline scenario assumes steady economic growth. However, further
escalation of geopolitical tensions and global trade uncertainty are seen as
key downside risks to the global economy. The balance of risks to the
baseline outlook is negative, and the alternative scenarios have a
downward skew.
The downside scenario sees a recession in 2026 and 2027 for most
countries. Unemployment increases strongly in this scenario and house
prices in most countries show outright falls. The downside scenario
captures the possible impact of geopolitical tensions, global trade policy
and heightened tariff uncertainty.
The upside scenario reflects the possibility of a better economic out-turn
resulting from the avoidance of further trade escalation, an AI-driven
productivity rebound and stronger European growth supported by defence
spending.
Management adjustments applied this reporting period (*)
In times of volatility and uncertainty where portfolio quality and the
economic environment are changing rapidly, models alone may not be
able to accurately predict losses. In these cases, management
adjustments can be applied to appropriately reflect ECL. Management
adjustments may also be applied when the impact of the updated
macroeconomic scenarios is over- or under-estimated by the IFRS 9
models, or to account for model redevelopment, recalibration, and periodic
assessment procedures that have not yet been incorporated into the IFRS9
models.
ING has an internal governance framework and controls in place to assess
the appropriateness of all management adjustments.
Management adjustments to ECL models (*) | ||
in EUR million | 2025 | 2024 |
Commercial Real Estate/ Inflation and interest rate increases | 50 | |
Economic sector / portfolio based adjustments | 9 | 38 |
Mortgage portfolio adjustments | 121 | 112 |
Climate transition risk | 47 | 29 |
Other Post Model Adjustments | 7 | -27 |
Total management adjustments | 183 | 203 |
The management adjustment of €50 million for the Commercial Real
Estate portfolio, reported at 31 December 2024 due to prevailing risks in
this sector, is released in 2025 due to improved risk profile and partially
replaced with a management adjustment for a recent model update,
which corrects for the effects of the aforementioned risks on the model
outcome. As the model update has not been implemented in production
yet, a management adjustment of €10 million is reported under the Other
Post Model Adjustments category at 31 December 2025.
As at 31 December 2025, an economic sector / portfolio-based adjustment
is reported in the Mortgages portfolio in Australia (€9 million) to address
emerging risk from inflation, interest rate increases and overall cost of
living. The management adjustment reported at 31 December 2024 for the
increased credit risk in the Mortgages and Consumer Lending portfolios in
Spain – due to the effects of floods – has been released, as the remaining
affected performing customers are reported in Stage 2. Also the
adjustment taken in the Business Banking portfolio in Germany at 31
December 2024 to cover for the increased uncertainty in the German
economy has been released due to the agreed sale of the affected
portfolio.
As of 31 December 2025, the overall mortgage portfolio adjustment
amounts to €121 million (31 December 2024: €112 million) and fully
related to the management adjustment in Stage 2 for the risk
segmentation model that captures affordability, repayment, and
refinancing risk on performing mortgage customers with a bullet loan in
the Netherlands.
As of 31 December 2025, an adjustment of €47 million is in place to
address the impact of climate transition risk in Wholesale Banking (€31
million) and in Business Banking (€16 million). Climate transition risk is
expected to lead to a structural change in credit risk, which means specific
business activities will become structurally riskier due to environmental
policies, technological progress or changes in market sentiment and
preferences. The current IFRS 9 models do not capture this (novel) risk. The
management adjustment to ECL models for business clients was made to
specifically cover for the medium- to long-term transition risk on high
greenhouse gas-emitting sectors and is reported in Stage 2. The sectors
included in the overlay represent approximately 20% of the exposure
within Wholesale and Business Banking.
Other post-model adjustments mainly relate to the impact of model
redevelopment or recalibration and periodic model assessment
procedures that have not been incorporated in the ECL models yet. The
impact on total ECL can be positive or negative. These adjustments will be
removed once updates to the specific models have been implemented.
The change in balance compared to previous reporting date is due to i)
released negative overlays because of model updates that have been
implemented and ii) new overlays recognised for new recalibrations and
periodic model assessment procedures that have not been incorporated
yet.
Analysis on sensitivity (*)
The table below presents the analysis on the sensitivity of key forward-
looking macroeconomic inputs used in the ECL collective-assessment
modelling process and the probability weights applied to each of the three
scenarios. The countries included in the analysis are the most significant
geographic regions in ING. For Wholesale Banking, the US is the most
significant in terms of both gross contribution to reportable ECL and
sensitivity of ECL to forward-looking macroeconomics. Accordingly, ING
considers these portfolios to present the most significant risk of resulting in
a material adjustment to the carrying amount of financial assets within
the next financial year.
The purpose of the sensitivity analysis is to enable the reader to
understand the extent of the impact from the upside and downside
scenario on model-based reportable ECL.
In the table below, the real GDP is presented in percentage year-on-year
change, the unemployment in percentage of total labour force, and the
house price index (HPI) in percentage year-on-year change.
Sensitivity analysis as at December 2025 (*) | |||||||
2026 | 2027 | 2028 | Unweighted ECL (€ mln) | Probability-weighting | Reportable ECL (€ mln)1 | ||
Netherlands Upside scenario | Real GDP | 2.6 | 2.9 | 2.3 | 288 | 20% | 389 |
Unemployment | 3.5 | 3.2 | 3.2 | ||||
HPI | 8.2 | 8.5 | 7.0 | ||||
Baseline scenario | Real GDP | 1.1 | 1.4 | 1.5 | 364 | 60% | |
Unemployment | 4.0 | 3.9 | 4.1 | ||||
HPI | 4.4 | 3.0 | 2.9 | ||||
Downside scenario | Real GDP | -1.2 | -0.9 | 0.2 | 566 | 20% | |
Unemployment | 5.5 | 6.5 | 7.4 | ||||
HPI | -0.8 | -5.1 | -5.1 | ||||
Germany Upside scenario | Real GDP | 2.8 | 3.0 | 1.8 | 584 | 20% | 633 |
Unemployment | 3.0 | 2.4 | 2.2 | ||||
HPI | 8.2 | 9.8 | 9.4 | ||||
Baseline scenario | Real GDP | 1.1 | 1.5 | 1.3 | 623 | 60% | |
Unemployment | 3.5 | 3.2 | 3.1 | ||||
HPI | 5.0 | 6.2 | 6.3 | ||||
Downside scenario | Real GDP | -1.7 | -1.1 | 0.4 | 713 | 20% | |
Unemployment | 4.7 | 5.3 | 5.6 | ||||
HPI | 0.9 | 0.4 | 2.7 | ||||
Belgium Upside scenario | Real GDP | 2.7 | 2.3 | 1.9 | 544 | 20% | 596 |
Unemployment | 5.1 | 4.6 | 4.5 | ||||
HPI | 5.2 | 4.9 | 5.4 | ||||
Baseline scenario | Real GDP | 1.1 | 1.4 | 1.6 | 585 | 60% | |
Unemployment | 5.9 | 5.6 | 5.5 | ||||
HPI | 3.7 | 4.2 | 4.4 | ||||
Downside scenario | Real GDP | -1.5 | 0.1 | 1.4 | 682 | 20% | |
Unemployment | 7.0 | 7.7 | 7.9 | ||||
HPI | 1.8 | 2.6 | 2.6 | ||||
United States Upside scenario | Real GDP | 3.2 | 2.9 | 2.7 | 64 | 20% | 105 |
Unemployment | 3.2 | 2.5 | 2.6 | ||||
HPI | 4.8 | 9.4 | 10.9 | ||||
Baseline scenario | Real GDP | 2.0 | 2.0 | 2.0 | 92 | 60% | |
Unemployment | 4.3 | 4.1 | 4.1 | ||||
HPI | 1.4 | 2.7 | 3.6 | ||||
Downside scenario | Real GDP | -0.4 | -0.1 | 0.8 | 184 | 20% | |
Unemployment | 6.7 | 7.2 | 7.5 | ||||
HPI | -5.1 | -7.9 | -5.5 | ||||
1Excluding management adjustments. | |||||||
Sensitivity analysis as at December 2024 (*) | |||||||
2025 | 2026 | 2027 | Unweighted ECL (€ mln) | Probability-weighting | Reportable ECL (€ mln)1 | ||
Netherlands Upside scenario | Real GDP | 2.6 | 3.0 | 2.5 | 193 | 20% | 270 |
Unemployment | 3.5 | 3.3 | 3.3 | ||||
HPI | 18.9 | 11.7 | 2.5 | ||||
Baseline scenario | Real GDP | 1.5 | 1.4 | 1.5 | 249 | 60% | |
Unemployment | 4.0 | 4.1 | 4.3 | ||||
HPI | 9.1 | 3.5 | 2.4 | ||||
Downside scenario | Real GDP | -0.4 | -1.4 | -0.2 | 411 | 20% | |
Unemployment | 5.7 | 7.2 | 8.1 | ||||
HPI | -3.7 | -7.2 | 2.2 | ||||
Germany Upside scenario | Real GDP | 2.0 | 2.8 | 1.6 | 510 | 20% | 548 |
Unemployment | 2.9 | 2.4 | 2.0 | ||||
HPI | 5.4 | 8.9 | 9.9 | ||||
Baseline scenario | Real GDP | 0.5 | 1.1 | 1.2 | 540 | 60% | |
Unemployment | 3.4 | 3.3 | 3.2 | ||||
HPI | 2.6 | 5.6 | 6.3 | ||||
Downside scenario | Real GDP | -1.7 | -1.7 | 0.3 | 609 | 20% | |
Unemployment | 4.7 | 5.6 | 5.9 | ||||
HPI | -1.7 | 1.3 | 2.2 | ||||
Belgium Upside scenario | Real GDP | 2.2 | 2.6 | 2.1 | 534 | 20% | 579 |
Unemployment | 5.1 | 5.0 | 4.9 | ||||
HPI | 4.8 | 4.5 | 4.4 | ||||
Baseline scenario | Real GDP | 1.1 | 1.5 | 1.6 | 569 | 60% | |
Unemployment | 5.7 | 5.7 | 5.6 | ||||
HPI | 3.2 | 4.1 | 3.8 | ||||
Downside scenario | Real GDP | -0.6 | -0.2 | 1.1 | 654 | 20% | |
Unemployment | 7.0 | 8.0 | 8.0 | ||||
HPI | 1.2 | 2.9 | 2.5 | ||||
United States Upside scenario | Real GDP | 3.1 | 3.5 | 3.2 | 74 | 20% | 113 |
Unemployment | 3.4 | 2.4 | 2.3 | ||||
HPI | 4.3 | 8.4 | 9.4 | ||||
Baseline scenario | Real GDP | 2.0 | 2.0 | 2.0 | 101 | 60% | |
Unemployment | 4.2 | 4.1 | 4.0 | ||||
HPI | 3.3 | 3.7 | 3.9 | ||||
Downside scenario | Real GDP | -0.1 | -1.1 | -0.4 | 187 | 20% | |
Unemployment | 5.9 | 7.3 | 8.0 | ||||
HPI | -0.7 | -3.0 | -2.5 | ||||
1Excluding management adjustments. | |||||||
When compared to the sensitivity analysis of 2024, the baseline
macroeconomic inputs have become slightly more positive overall,
underpinned by the resilience of the global economy in the face of trade
and geopolitical tensions. House price growth expectations are lower for
the Netherlands, given a rise in supply from the sale of rental properties
and slowdown of wage growth. In the US, a weak labour and housing
market both signal underlying economic challenges due to policy and
trade uncertainty, and persistent affordability issues. The upside and the
downside scenarios are not directly comparable with those of 2024 due to
an update in the basis of their derivation.
On a total ING level, the unweighted ECL for all collective provisioned
clients in the upside scenario was €2,938 million, in the baseline scenario
€3,232 million and in the downside scenario €3,993 million compared to
€3,326 million reportable model ECL as at 31 December 2025 (excluding all
management adjustments). To perform the sensitivity analysis, a point in
time reportable ECL is used as input, which slightly deviates from the total
reportable collective provisions as presented below:
Reconciliation of reportable collective ECL to total ECL (*) | ||
in EUR million | 2025 | 2024 |
Total reportable collective provisions | 3,168 | 2,975 |
ECL from individually assessed impairments | 2,750 | 2,871 |
ECL from management adjustments | 183 | 203 |
Total ECL | 6,101 | 6,049 |
Criteria for identifying a significant increase in credit risk (SICR) (*)
All assets and off-balance-sheet items that are in scope of IFRS 9
impairment and which are subject to collective ECL assessment are
allocated a 12-month ECL if deemed to belong in Stage 1, or a lifetime ECL
if deemed to belong in Stages 2 or 3. An asset belongs in Stage 2 if it is
considered to have experienced a significant increase in credit risk (SICR)
since initial origination or purchase.
The main determinant of SICR is a quantitative test, whereby the lifetime
PD of an asset at each reporting date is compared against its lifetime PD
determined at the date of initial recognition. If either a threshold for
absolute change in lifetime PD or a threshold for relative change in lifetime
PD is reached, the item is considered to have experienced an SICR (for more
details on absolute and relative thresholds, see the following sections).
Furthermore, any facility which shows an increase of 200 percent between
the PD at the date of initial recognition and the lifetime PD at the reporting
date (i.e. threefold increase in PD) must be classified as Stage 2. This is
considered a backstop within the quantitative assessment of SICR.
In Wholesale Banking, a significant increase in lifetime PD is not considered
plausible for assets of obligors with a credit rating at the reporting date in
the top range of investment grade. The assets of these Wholesale Banking
obligors are excluded from the assessment of significant increase in credit
risk triggers. For these obligors the qualitative significant increases in credit
risk triggers remain applicable (see the section below on Qualitative SICR
triggers). These are, for example, the watch list and/or forbearance
triggers. Finally, the 30 days past due backstop also remains applicable for
the top range of investment grade exposures to ensure a significant
increase in credit risk recognition.
Absolute lifetime PD threshold
The absolute threshold is a fixed value calibrated per portfolio/segment
and provides a fixed threshold that, if exceeded by the difference between
lifetime PD at reporting date and lifetime PD at origination, triggers Stage 2
classification. The absolute threshold is calibrated during model
development.
Relative lifetime PD threshold
The relative threshold defines a relative increase of the lifetime PD, beyond
which a given facility is classified in Stage 2 because of a significant
increase in credit risk. The relative threshold is dependent on the individual
PD assigned to each facility at the moment of origination, and a scaling
factor calibrated in the model development phase.
Ultimately, the relative threshold provides a criterion to assess whether
the ratio (i.e. increase) between lifetime PD at reporting date and lifetime
PD at origination date is deemed a significant increase in credit risk. If the
threshold is breached, SICR is identified and Stage 2 is assigned to the
given facility.
The threshold for the relative change in lifetime PD is inversely correlated
with the PD at origination; the higher the PD at origination, the lower the
threshold. The logic behind this is to allow facilities originated in very
favourable ratings to downgrade for longer without the need of a Stage 2
classification. In fact, it is likely that such facilities will still be in favourable
ratings even after a downgrade of a few notches. On the contrary, facilities
originated in already unfavourable ratings grades are riskier and even a
single-notch downgrade might represent a significant increase in credit
risk and thus a tighter threshold will be in place. Still, the relative threshold
is relatively sensitive for investment-grade assets while the absolute
threshold primarily affects non-investment grade assets.
Average threshold ratio
The table below shows the average increase in PD at origination needed to
be classified in Stage 2 is reported, taking into account the PD at
origination of the facilities included in each combination of asset class and
rating quality. In terms of rating quality, assets are divided into
'investment grade' and 'non-investment grade' facilities. Rating 18 and 19
are not included in the table, since facilities are not originated in these
ratings and they constitute a staging trigger of their own (i.e. if a facility is
ever to reach rating 18 or 19 at reporting date, it is classified in Stage 2). In
the table, values are weighted by IFRS 9 exposure and shown for both
year-end 2024 and year-end 2025.
To represent the thresholds as a ratio (i.e. how much should the PD at
origination increase in relative terms to trigger Stage 2 classification) the
absolute threshold is recalculated as a relative threshold for disclosure
purposes. Since breaching only relative or absolute threshold triggers
Stage 2 classification, the minimum between the relative and recalculated
absolute threshold is taken as value of reference for each facility.
Quantitative SICR thresholds (*) | ||||
2025 | 2024 | |||
Average threshold ratio | Investment grade (rating grade 1-10) | Non-investment grade (rating grade 11-17) | Investment grade (rating grade 1-10) | Non-investment grade (rating grade 11-17) |
Asset class category | ||||
Mortgages | 2.9 | 2.4 | 2.9 | 2.4 |
Consumer lending | 2.9 | 2.3 | 2.8 | 2.1 |
Business lending | 2.7 | 2.0 | 2.7 | 2.1 |
Governments and financial institutions | 2.9 | 1.8 | 2.9 | 1.9 |
Other Wholesale Banking | 2.7 | 1.9 | 2.7 | 1.9 |
As it is apparent from the disclosures above, as per ING’s methodology, the
threshold is tighter the higher the riskiness at origination of the assets,
illustrated by the difference between the average threshold applied to
investment grade facilities and non-investment grade facilities.
Sensitivity of ECL to PD lifetime PD thresholds
The setting of PD threshold bands requires management judgement and is
a key source of estimation uncertainty. On Group level, the total model
ECL on performing assets, which is the ECL collective assessment without
taking management adjustments into account, was €1,501 million as at
31 December 2025 (31 December 2024: €1,328 million). To demonstrate
the sensitivity of the ECL to these PD threshold bands, hypothetically
solely applying the upside scenario would result in total model ECL on
performing assets of €1,159 million and a decrease in the Stage 2 ratio by
0.3%-point, while solely applying the downside scenario would result in
total model ECL on performing assets of €2,193 million and an increase in
the Stage 2 ratio by 1.6%-point.
Qualitative SICR thresholds
It should be noted that the lifetime PD thresholds are not the only drivers
of stage allocation as ING Group also relies on a number of qualitative
indicators to identify and assess SICR. An asset can also change stages as
a result of other triggers, such as having over 30 days arrears (used as a
backstop), the occurrence of an early warning indicator, collective SICR
assessment, being on a watch list, being under intensive care
management, having a substandard internal rating, or being forborne.
Market riskIntroduction (*)
Market risk is the risk that movements in market variables, such as interest
rates, equity prices, foreign exchange rates, credit spreads, and real-estate
prices negatively impact the bank’s earnings, capital, market value, or
liquidity position. Market risk either arises through positions in banking
books or trading books.
The banking book positions are intended to be held for the long term (or
until maturity) or for the purpose of hedging other banking book positions.
The trading book positions are typically held with the intention of short-
term trading or to hedge other positions in the trading book. Policies and
processes are in place to monitor the inclusion of positions in either the
trading or banking book as well as to monitor the transfer of risk between
the trading and banking books.
The following sections elaborate on the various elements of the risk
management framework for:
§Market risk in banking books;
§Market risk in trading books; and
§Market risk capital.
Market risk in banking books (*)ING distinguishes between the trading and banking (non-trading) books.
Positions in banking books originate from the market risks inherent in
commercial products that are sold to clients, Group Treasury exposures, and
from the investment of our own funds (core capital). Both the commercial
products and the products used to hedge related market-risk exposures are
intended to be held until maturity, or at least for the long term.
Risk transfer (*)
Market risks in the banking book are managed via the risk transfer process.
In this process the interest rate, FX, funding, and liquidity risks are
transferred from the commercial books through matched funding or
replication to Group Treasury, where they are centrally managed. The
scheme below presents the transfer and management process of market
risks in the banking books.
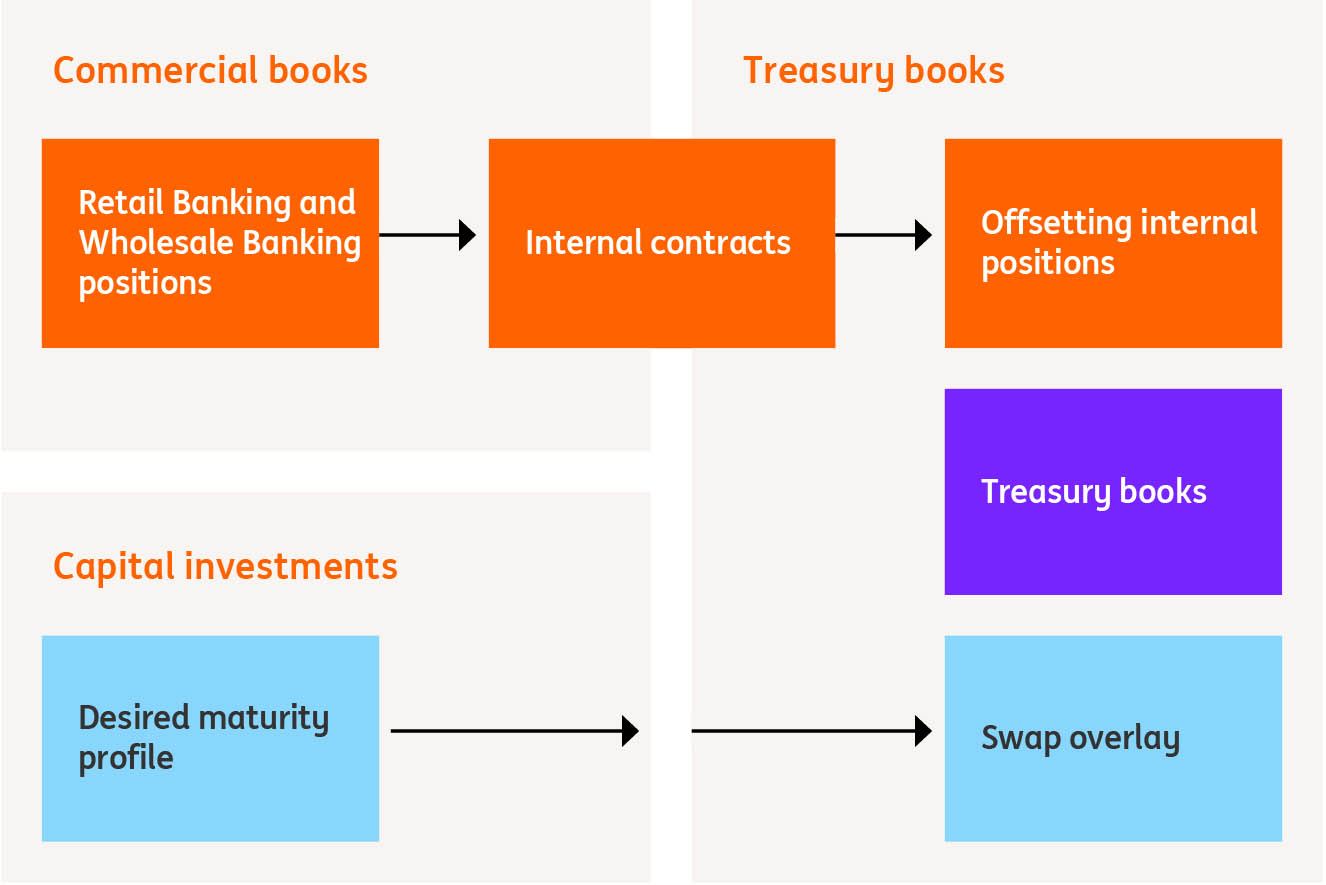
The main concepts and metrics used for measuring market risk in the
banking book are described below per risk type.
Interest rate risk in banking book (*)
Interest rate risk in the banking book is defined as the exposure of a bank’s
earnings, capital, and market value to adverse movements in interest
rates originated from positions in the banking book.
ING centralises interest rate risk management from commercial books
(that capture the products sold to clients) to globally managed interest
rate risk books. This enables a clear demarcation between commercial
business results and results based on unhedged interest rate positions.
ING distinguishes between three types of activities that generate interest
rate risk in the banking book:
§Investment of own funds;
§Commercial business; and
§Group Treasury exposures, including strategic interest rate positions.
Group Treasury is responsible for managing the investment of own funds
(core capital). Capital is invested for longer periods to contribute to stable
earnings within the risk appetite boundaries set by ALCO Bank.
Commercial activities can result in linear interest rate risk due to different
re-pricing properties of assets and liabilities. Also, interest rate risk can
arise from customer behaviour and/or convexity risk, depending on the
nature of the underlying product characteristics.
To determine interest rate risk in specific products (such as savings or
mortgages) certain assumptions may need to be applied. Customer
behaviour risk is defined as the potential future loss (value) arising from
deviations between actual client behaviour and the modelled behaviour
regarding embedded options within commercial products. General sources
of customer behaviour risk include, among other things, the state of the
economy, competition, changes in regulation, legislation and tax regime,
developments in the housing market, and interest rate developments.
From an interest rate risk perspective, commercial activities can typically
be divided into the following main product types: savings and current
accounts (funds entrusted), demand deposits, mortgages, and loans.
Savings and demand deposits are generally invested in such a way that
both the value is hedged and the sensitivity of the margin to market
interest rates is minimised. This is achieved by creating the investment
profile distributed from short term to long term, which dampens the
immediate impact from changes in the market rates and stabilises margin
in the longer horizon. Interest rate risk is modelled based on the stability of
deposits and the pass-through rate. This takes account of different
elements, such as pricing strategies, volume developments, and the level
and shape of the yield curve.
In determining the interest rate profile of mortgages, prepayment or other
embedded optionality can be an important risk driver. In modelling this
risk, both interest-rate-dependent prepayments and constant
prepayments are considered. Next to a dependence on interest rates,
modelled prepayments may include other effects such as loan-to-value,
seasonality, and the reset date of the loan. In addition, the interest
sensitivity of embedded offered rate options is typically considered.
Wholesale Banking loans typically do not experience interest-rate-
dependent prepayment behaviour, as these are mostly floating rate
products. These portfolios are match-funded, taking the constant
prepayment model into account, and typically do not contain significant
convexity risk. Wholesale Banking loans can have an all-in rate floor or a
floor on a reference rate.
Customer behaviour in relation to mortgages, loans, savings, and demand
deposits is modelled based on extensive analysis of historical data.
However, the substantial fluctuations in the interest rate environment in
recent years make the analysis more challenging than before and may
increase model risk. Models are backtested and updated when deemed
necessary, at least annually. Model parameters and the resulting risk
measures are approved by (local) ALCO, and are closely monitored on a
monthly basis.
Linear risk transfers take place from commercial business books to the
treasury book (Group Treasury), if necessary, by using estimations of
customer behaviour. The originating commercial business is ultimately
responsible for estimating this customer behaviour, leaving convexity risk
and (unexpected) customer behaviour risk with the commercial business.
Risk measurement and the risk transfer process take place at least
monthly. If deemed necessary, additional risk transfers can take place.
The commercial business manages the convexity risk that is the result of
products that contain embedded options, like mortgages. Here the
convexity risk is defined as the optionality effects in the value due to
interest rate changes, excluding the first-order effects. In some cases,
convexity risk is hedged by treasury using cap/floor contracts and
swaptions.
NII at Risk (*)
The NII-at-Risk measures the impact of changing interest rates on the
forecasted net interest income (before tax) of the banking book, excluding
the impacts of credit spread sensitivity, fees, and fair value impact. Future
projected balance sheet developments (dynamic plan) are included in this
risk metric. NII-at-Risk provides insight into the sensitivity of ING’s NII under
shocked interest rate scenarios against what is projected in a base case
scenario.
In its risk management, ING monitors the NII-at-Risk under a three-year
time frame. Interest rates are shocked during the first year of analysis
through the gradual application of shock. The rate changes considered
encompass both upward and downward scenarios, as well as both parallel
(equal movements across the yield curve) and non-parallel scenarios.
The impact of changing interest rates on ING’s NII is predominantly caused
by the following factors:
§Change in returns of (re)investments of client deposits;
§Change in client deposit rates (mainly savings), (partially) tracking
changes in market interest rates;
§Change in the amortisation profile of mortgages, due to an increase or
decrease in expected prepayments;
§Higher/lower returns of (re-)investments of core capital investment;
§Open interest rate positions, leading to changes in return because of
different market rates; and
§Assumed volume development of the balance sheet in line with ING’s
dynamic plan.
For projecting the change in client deposit rates, ING uses a client rate
model that describes the relation between market interest rates and client
deposit rates. The model is calibrated under a range of interest rate
scenarios. Per scenario, the actual change in client deposit rates may
deviate from this calibrated model. The actual NII development of
customer deposits may, indeed, differ from the provided scenarios,
depending on, among other things, actual interest rate and savings client
rate evolution, as well as changes to ING’s balance sheet composition,
such as net deposit growth and relative share of savings deposits and non-
remunerated current accounts.
The NII-at-Risk figures in the table below represent a parallel, linear
interest rate shift over one year (‘ramped’) based on the assumption that
balance sheet developments follow ING’s dynamic plan within a one-year
horizon.
The NII-at-Risk is mainly influenced by the difference in the sensitivity
between client liabilities and client assets and investments to rate
changes. The primary factor of NII-at-Risk are the investments of current
accounts, while the investments of own funds have a marginal effect, as
only a relatively small portion needs to be (re)invested within a one-year
period.
NII-at-Risk banking book per currency - year one (*) | ||||
in EUR million | 2025 | 2024 | ||
Ramped, floored | Ramped, floored | |||
parallel ▼ | parallel ▲ | parallel ▼ | parallel ▲ | |
By currency | ||||
Euro | -182 | 205 | -146 | 160 |
US dollar | 1 | -1 | -4 | 5 |
Other | -74 | 94 | -2 | 21 |
Total | -254 | 298 | -153 | 186 |
EUR ramped (floored at -100bps) is at +/- 120bps in 1 year | ||||
USD ramped (floored at -100bps) is at +/- 120bps in 1 year | ||||
The change in NII under declining and upward interest rate scenarios may
not be equal. This is due to different expected reactions in prepayment
behaviour of mortgages and different pricing developments of commercial
loans and deposits products (mainly savings). This is caused by embedded
options, explicit or implicit pricing floors, and other (assumed) pricing
factors.
The metrics mentioned above are internal metrics, which therefore deviate
from the regulatory NII SOT metric. Both internal and regulatory measures
are part of the bank's risk appetite framework and are actively managed.
Year-on-year variance analysis (*)
In 2025, ING maintained its dynamic hedging strategy, transferring
interest rate risk from business units to Group Treasury, where it was
subsequently hedged in financial markets, resulting in overall limited
sensitivity of NII at Risk (NIIaR) compared to ING’s total net interest income.
Year-on-year NIIaR increase by €100 million under a parallel down (worst
case) scenario, is primarily driven by revised repricing assumptions and
positions taken by treasury.
Net present value (NPV) at Risk (*)
NPV-at-Risk measures the impact of changing interest rates on the value
of the positions in the banking book and it is defined as the outcome of an
instantaneous increase or decrease in interest rates from applying
currency-specific scenarios. The metric primarily reflects the impact of
interest rate fluctuations on the bank’s strategic interest rate positions
(e.g. investments of own funds), as well as on the savings and mortgage
portfolios. While strategic positions typically adjust proportionally with
changing rates, the savings and mortgage products exhibit more complex
behavior due to embedded optionalities. Customers can prepay or
reallocate their balances, resulting in non-linear value changes. As a result,
these portfolios may incur value losses both when interest rates increase
and decrease, contributing to the asymmetric NPV-at-Risk pattern
highlighted in the annual report.
The full value impact cannot be directly linked to the financial position or
profit or loss account, as fair value movements in banking books are not
necessarily reported through the profit or loss account or through other
comprehensive income (OCI). The changes in value are expected to
materialise over time in the profit and loss account if interest rates develop
according to forward rates throughout the remaining maturity of the
portfolio. The majority of the risk comes from the investments of own
funds and from positions exhibiting negative convexity due to embedded
optionality (most notably variable rate savings and fixed rate mortgages).
The metrics mentioned above are internal metrics, which therefore deviate
from the regulatory EVE SOT metric. Both internal and regulatory
measures are part of the bank’s risk appetite framework and are actively
managed.
NPV-at-Risk banking books per currency (*) | ||||
in EUR million | 2025 | 2024 | ||
floored | floored | |||
parallel ▼ | parallel ▲ | parallel ▼ | parallel ▲ | |
By currency | ||||
Euro | 1,319 | -2,593 | 154 | -1,613 |
US dollar | 273 | -265 | 274 | -266 |
Other | 269 | -267 | 321 | -329 |
Total | 1,862 | -3,125 | 749 | -2,208 |
EUR (floored at -100bps) is at +/- 120bps | ||||
USD (floored at -100bps) is at +/- 120bps | ||||
Year-on-year variance analysis (*)
The overall NPV sensitivity increased considerably compared to the
previous year. The parallel up scenario continues to represent the worst-
case outcome, and the calculation shock for the primary currencies (EUR
and USD) was maintained at 120 basis points, consistent with the level
used in 2024. Year-over-year variations are explained by the evolving
balance sheet composition, movements in interest rates, and shifting
market expectations.
The impact of the benchmark rate reform (*)
In line with the recommendations of the Financial Stability Board, a
fundamental review of important interest rates benchmarks has been
undertaken. Some interest rate benchmarks have been reformed, while
others have or will be replaced by risk-free rates and discontinued.
In 2025, the benchmark rate reform of only one reference rate, to which
ING has significant exposures as at 31 December 2025, was continuing (i.e.
WIBOR in Poland).
On 24 January 2025, the Steering Committee of the National Working
Group (NWG SC) in Poland selected POLSTR (Polish Short Term Rate) as the
ultimate interest rate benchmark to replace WIBOR. POLSTR is calculated
based on unsecured deposits of Credit and Financial Institutions and is
expected to replace WIBOR by 31 December 2027.
In April 2025, the NWG SC published the updated transition roadmap of the
replacing process of WIBOR and announced in June 2025 that the official
determination of the POLSTR has started.
During the second half of 2025, the NWG SC approved several
recommendations for products based on POLSTR, and informed that
POLSTR has been applied for the first time in the domestic financial market
on 1 September 2025. Therefore, POLSTR gained a status of a benchmark
in accordance with the requirements of the EU Benchmark Regulation.
On 30 September 2025, the benchmark administrator GPW Benchmark
S.A, published the decision to cease providing the WIBOR reference rate for
various tenors in phases, between the end of 2025 and the end of 2026.
On 21 November 2025, the Ministry of Finance (of Poland) conducted the
first pilot issuance of treasury bonds linked to the POLSTR benchmark
during a sale auction.
Other important milestones of the process are planned in subsequent
years, including the construction of a market for financial products based
on the new benchmark and achieving regulatory and operational
readiness of all market participants to offer and operate these financial
products.
Due to the discontinuation of WIBOR, ING, its customers, and in general
those market participants with exposure to this benchmark rate will be
faced with a number of risks. These risks include legal, financial,
operational, reputational, and conduct risk. The WIBOR rates are used in
several of our lending and derivative products, and hence a project team
has been established to manage the transition. The WIBOR transition is
especially important for our Polish subsidiary (ING Bank Śląski S.A.) with a
significant amount of Polish zloty-denominated assets and liabilities
including derivatives that are continuously rebalanced to hedge the risk
exposures.
The tables below summarise the approximate gross exposure of ING that
has yet to transition related to WIBOR, excluding exposures expiring before
the transition date of 31 December 2027.
Non-derivative financial instruments to transition from WIBOR to POLSTR (*) | |||
Financial assets non-derivative | Financial liabilities non- derivative | Off-balance sheet commitments | |
in EUR million | Carrying value | Carrying value | Nominal value |
31 December 2025 | 25,333 | 360 | 2,301 |
31 December 2024 | 19,202 | 134 | 1,544 |
Derivative financial instruments to transition from WIBOR to POLSTR (*) | ||
31 December 2025 | 31 December 2024 | |
in EUR million | Nominal value | Nominal value |
WIBOR | 196,133 | 110,189 |
See sections 1.5.4 of Note 1 ‘Basis of preparation and material accounting
policy information’ for information on the Phase 1 amendments to IFRS.
As at 31 December 2025, Phase 1 reliefs are applicable to WIBOR indexed
fair value and cash flow hedge accounting relationships as there is
uncertainty arising from the WIBOR reform with respect to the timing and
the amount of the underlying cash flows that the Group is exposed to.
Therefore, for WIBOR financial instruments designated in hedge
accounting the applicable Phase 1 reliefs will continue to apply until the
relevant contract is modified. At that point in time, the reliefs of Phase 2
amendments to IFRS will become applicable.
Following the Phase 1 reliefs that allow ING to continue applying hedge
accounting, ING has to assume that the WIBOR-based cash flows from the
hedging instrument and hedged item will remain unaffected for the
affected fair value and cash flow hedge relationships. In addition, for the
forecast transactions that are subject to cash flow hedge accounting,
under the Phase 1 reliefs ING has to assume that the WIBOR benchmark on
which the hedged cash flows are based is not altered as a result of the
reform and, therefore, the forecast transactions still meet the highly
probable requirement.
The total gross notional amounts of hedging instruments that are used in
ING’s hedge accounting relationships for which the Phase 1 amendments
to IAS 39 were applied are:
Notional amounts of hedging instruments from WIBOR to POLSTR (*) | ||
31 December 2025 | 31 December 2024 | |
in EUR million | Nominal value | Nominal value |
WIBOR | 97,492 | 99,663 |
As at 31 December 2025, 50% (31 December 2024: 32%) of the notional
amounts have a maturity date beyond 31 December 2027. The notional
amounts of the derivative hedging instruments provide a close
approximation of the extent of the risk exposure ING manages through
these hedging relationships.
Credit spread risk in banking books (CSRBB) (*)
Credit spread risk is defined as risk driven by the changes of the market
price for credit risk, for liquidity and potentially other characteristics of
credit-risky instruments, which is not captured by another existing
prudential framework such as Interest Rate Risk in Banking Book or by
expected credit/(jump-to-) default risk. The CSRBB framework is
implemented based on EBA Guidelines. Metrics used are NPV-at-Risk, NII-
at-Risk and Market Value Changes-at Risk and view the positions across
different accounting treatments.
Credit spread risk is not part of the internal risk transfer towards Group
Treasury and therefore remains in the business unit it originated in. Group
Treasury itself is also an important driver of credit spread risk via its high-
quality liquid assets (HQLA) investment portfolio and issuance activities.
Risk appetite limits are set on a combination of metrics and accounting
scopes and are cascaded to local ALCOs depending on the type of limit
and materiality. Metrics and limits are monitored and reported monthly to
global and local risk committees, and various stakeholders.
Foreign exchange (FX) risk in banking books (*)
FX exposures in banking books result from core banking business activities
(business units doing business in currencies other than their base
currency), foreign currency investments in subsidiaries (including realised
net profit and loss), and strategic equity stakes in foreign currencies. The
policy regarding these exposures is briefly explained below.
Core banking business (*)
Every business unit hedges the FX risk resulting from core banking
business activities into its base currency to prevent volatility in profit and
loss. Consequently, assets and liabilities are matched in terms of currency,
within certain friction limits.
FX translation (*)
ING’s strategy is to protect the CET1 ratio against adverse impact from FX
rate fluctuations, while limiting the volatility in the profit and loss account
due to this CET1 hedging and limiting the RWA impact under the
regulatory framework. Currency exposure of Return on Equity is also
considered. Hedge accounting is applied to the largest extent possible.
Taking this into account, the CET1 ratio hedge can be achieved by
deliberately taking foreign currency positions equal to certain target
positions, such that the CET1 capital and risk-weighted assets are equally
sensitive in relative terms to changing FX rates.
Risk profile – FX translation (*)
The following table presents the currency exposures in the banking books
for the most important currencies for the FX translation result. Positive
figures indicate long positions in the respective currency. As a result of the
strategy to hedge the CET1 ratio, an open structural FX exposure exists.
To measure the volatility of the CET1 ratio from FX rate fluctuations,
different metrics are used, including the CET1 Ratio-at-Risk. The impact is
controlled via the Solvency and Financial Risk RAS.
Foreign currency exposures banking books (*) | ||||||
in EUR million | Foreign Investments | Hedges | Net exposures | |||
2025 | 2024 | 2025 | 2024 | 2025 | 2024 | |
US Dollar | 9,698 | 11,251 | -4,500 | -4,823 | 5,198 | 6,429 |
Pound Sterling | 1,584 | 1,674 | -515 | -484 | 1,069 | 1,190 |
Polish Zloty | 4,652 | 4,292 | -2,009 | -1,616 | 2,643 | 2,677 |
Australian Dollar | 3,307 | 3,373 | -1,933 | -2,161 | 1,374 | 1,212 |
Turkish Lira | 469 | 557 | 0 | 0 | 469 | 557 |
Chinese Yuan | 2,015 | 2,439 | 1 | -830 | 2,016 | 1,609 |
Russian Rouble | 597 | 396 | 0 | 0 | 597 | 396 |
Romanian Leu | 913 | 913 | -228 | -176 | 685 | 736 |
Thai Baht | 1,307 | 1,266 | -829 | -838 | 478 | 428 |
Other currency | 3,032 | 3,346 | -1,995 | -2,748 | 1,036 | 599 |
Total | 27,573 | 29,509 | -12,008 | -13,675 | 15,565 | 15,834 |
1.The FX sensitivity is expressed as the FX spot equivalent position.
EBA Structural FX guidelines
In line with the EBA guidelines on Structural FX, upon permission from the
competent authorities, certain currency positions are being excluded from
the calculation of net open currency positions under CRR article 352(2).
The resulting impact is presented in the Pillar 3 disclosure.
Equity price risk in banking books (*)
ING maintains a portfolio with substantial equity exposure in its banking
books.
Risk profile (*)
Equity price risk arises from the possibility that an equity security’s price
will fluctuate, affecting the values of the equity security itself as well as
other instruments whose values react similarly to the particular security, a
defined basket of securities, or a securities index. ING’s equity exposure
mainly consists of the investments in associates and joint ventures of
€1,607 million (2024: €1,679 million) and equity securities held at fair value
through other comprehensive income (FVOCI) of €2,607 million (2024:
€2,562 million). The value of equity securities held at FVOCI is directly
linked to equity security prices with increases/decreases being recognised
in the revaluation reserve.
Investments in associates and joint ventures are measured in accordance
with the equity method of accounting, and the balance sheet value is
therefore not directly linked to equity security prices. The equity sensitivity
is expressed as the equity position.
Year-on-year variance analysis (*)
In 2025, the revaluation reserve equity securities decreased by €372
million from €1,816 million to €1,444 million due to revaluation of the
shares in Bank of Beijing with €-403 million. In 2025, the equity securities
at fair value through OCI increased by €45 million mainly due to increased
stake in Van Lanschot Kempen.
Revaluation reserve equity securities at fair value through other comprehensive income (*) | ||
in EUR million | 2025 | 2024 |
Positive remeasurement | 1,456 | 1,820 |
Negative remeasurement | -12 | -4 |
Total | 1,444 | 1,816 |
Market risk in trading books (*)
Within the trading portfolios, the positions are maintained in the financial
markets. These positions are often a result of transactions with clients and
may benefit from short-term price movements. In 2025, ING continued its
strategy of undertaking trading activities to develop its client-driven
franchise and deliver a differentiating experience by offering multiple
market and trading products.
With respect to the trading portfolios, Trading Risk Management (TRM)
focuses on the management of market risks of Wholesale Banking (mainly
Financial Markets) as this is the only business line within ING where trading
activities take place. Trading activities include facilitation of client business
and market making. TRM is responsible for the development and
implementation of trading risk policies and risk measurement
methodologies, and for reporting and monitoring risk exposures against
approved trading limits. TRM also reviews trading mandates and global
limits, and performs the gatekeeper role in the product review process
(PARP).
Risk measurement (*)
ING uses a comprehensive set of methodologies and techniques to
measure market risk in trading books: Value at Risk (VaR) and Stressed
Value at Risk (SVaR), Incremental Risk Charge (IRC), and stress testing.
Systematic validation processes are in place to validate the accuracy and
internal consistency of data and parameters used for the internal models
and modelling processes.
Value at Risk (*)
TRM uses the historical simulation VaR methodology (HVaR) as its primary
risk measure. The HVaR for market risk quantifies, with a one-sided
confidence level of 99 percent, the maximum overnight loss that could
occur in the trading portfolio of ING due to changes in risk factors (e.g.
interest rates, equity prices, foreign exchange rates, credit spreads, implied
volatilities), considering the positions remain unchanged for a time period
of one day.
Next to general market movements in these risk factors, HVaR also takes
into account market data movements for specific moves in, for example,
the underlying issuer or securities. A single model which diversifies general
and specific risk is used. In general, a full revaluation approach is applied,
while for a limited number of linear trading positions and risk factors in
commodity and equity risk classes, a sensitivity-based approach is applied.
The potential impact of historical market movements on today’s portfolio
is estimated, based on equally weighted observed market movements of
the previous year (260 business days). When simulating potential
movements in risk factors, depending on the risk factor type, either an
absolute or a relative shift is used.
The data used in the computations is updated daily. ING uses HVaR with a
one-day horizon for internal risk measurement, management control, and
backtesting, and HVaR with a 10-day horizon for determining regulatory
capital. To compute HVaR with a 10-day horizon, the one-day risk factor
shifts are scaled by the square root of 10 and then used as an input for the
revaluation. The same model is used for all legal entities within ING with
market risk exposure in the trading portfolio.
Limitations (*)
HVaR has some limitations: it uses historical data to forecast future price
behaviour, but future price behaviour could differ substantially from past
behaviour. Moreover, the use of a one-day holding period (or 10 days for
regulatory capital calculations) assumes that all positions in the portfolio
can be liquidated or hedged in one day. In periods of illiquidity or market
events, this assumption may not hold. Also, the use of a 99 percent
confidence level means that HVaR does not take into account any losses
that occur beyond this confidence level.
Backtesting (*)
Backtesting is a technique for the ongoing monitoring of the plausibility of
the HVaR model in use. Although HVaR models estimate potential future
trading results, estimates are based on historical market data. In a backtest,
the actual daily trading result (excluding fees and commissions) is
compared with the one-day HVaR.
In addition to using actual results for backtesting, ING also uses hypothetical
results, which exclude the effects of intraday trading, fees, and
commissions. When an actual or a hypothetical loss exceeds the HVaR, an
‘outlier’ occurs. Based on ING’s one-sided confidence level of 99 percent, an
outlier is expected once in every 100 business days.
On an overall level in 2025, there was one outlier for hypothetical P&L and
zero outliers for actual P&L. The hypothetical outlier occurred in the first
quarter of 2025, mainly driven by higher EUR rates due to anticipated
changes in German fiscal policy.
Stressed HVaR (*)
The stressed HVaR (SVaR) is intended to replicate the HVaR calculation that
would be generated on the bank’s current portfolio with inputs calibrated to
the historical data from a continuous 12-month period of significant
financial stress relevant to the bank’s portfolio.
To calculate SVaR, ING uses the same model that is used for 1DHVaR, with a
10-day horizon. The data for the historical stress period used currently
includes the height of the credit crisis around the fall of Lehman Brothers
(2008-2009), and this stressed period selection is reviewed annually. The
historical data period is chosen so that it gives the worst-scenario loss
estimates for the current portfolio. The same SVaR model is used for
management purposes and for regulatory purposes. The same SVaR model
is used for all legal entities within ING with market risk exposure in the
trading portfolio.
Incremental risk charge (*)
The incremental risk charge (IRC) for ING is an estimate of the default and
migration risks for credit products (excluding securitisations) in the trading
book, over a one-year capital horizon, with a 99.9 percent confidence level.
Trading positions (excluding securitisations) of ING, which are subject to
specific interest rate risk included in the internal model approach for market
risk regulatory capital, are in scope of the IRC model. By model choice,
equity is excluded from the model. For the calculation of IRC, ING performs a
Monte Carlo simulation based on a multi-factor t-copula. In the multi-factor
IRC model the supervisory asset correlations are no longer applicable and
the calibration of the correlations is based on historical market data. The
rating change is simulated for all issuers over the different liquidity horizons
(i.e. time required to liquidate the position or hedge all significant risks)
within one year. Movements across different rating categories and
probabilities of default are governed by a credit-rating transition matrix. An
internal transition matrix along with internal LGDs is used, to comply with
the consistency requirement. The financial impact is then determined for
the simulated migration to default, or for the simulated migration to a
different rating category, based on LGD or credit spread changes,
respectively.
The liquidity horizon has been set to the regulatory minimum of three
months for all positions in scope. ING reviews the liquidity horizons on a
yearly basis, based on a structured assessment of the time it takes to
liquidate the positions in the trading portfolio.
Stress testing and event risk (*)
Stress testing is a valuable risk management tool. In addition to the bank-
wide stress-test framework as described in the stress-testing section,
Trading Risk Management performs stress tests specific to the trading book
with various frequencies. The trading book stress tests evaluate the impact
on the bank’s trading book under severe but plausible stress scenarios, using
a full revaluation approach. The framework is based on historical as well as
hypothetical scenarios. The stress result is an estimate of the profit and loss
caused by a potential event and its worldwide impact for ING. The results of
the stress tests are used for decision-making, aimed at maintaining a
financially healthy going-concern institution after a severe event occurs.
In stress scenarios, shocks are applied to prices (credit spreads, interest
rates, equity, commodities, and FX rates) and volatilities. Depending on the
type of the stress test, additional scenario assumptions can be made, for
example on correlations, dividends, or recovery rates. The structural
scenarios are defined to cover market moves in various directions and
capture different asset class correlations. Scenarios are calculated using a
full revaluation approach. The worst scenarios are determined for each
product line, business line, and super business line, and compared against
limits.
Sensitivities (*)As part of the risk monitoring framework, TRM actively monitors the
sensitivities of the trading portfolios. Sensitivities measure the impact of
movements in individual market risk factors (foreign exchange rates,
interest rates, credit spreads, equity and commodity prices) on profit and
loss results of the trading positions and portfolios.
The following tables show the five largest trading positions in terms of
sensitivities to foreign exchange, interest rate, and credit spread risk factor
movements. These largest exposures also reflect concentrations of risk in
FX risk per currency, interest rate risk per currency, and credit spread risk
per country, rating, and sector. Due to the nature of the trading portfolios,
positions in the portfolios can change significantly from day to day, and
sensitivities of the portfolios can change daily accordingly.
Most important foreign exchange year-end trading positions (*) | |||
in EUR million | 2025 | 2024 | |
Foreign exchange | Foreign exchange | ||
US Dollar | -260 | US Dollar | -93 |
Turkish Lira | 229 | Turkish Lira | 84 |
Chinese Yuan | 88 | Korean Won | 62 |
Japanese Yen | -49 | Japanese Yen | 61 |
Romanian Leu | 42 | Chinese Yuan | -37 |
Most important interest rate and credit spread sensitivities at year-end (*) | |||
in EUR thousand | 2025 | 2024 | |
Interest rate (BPV) 1 | Interest rate (BPV) 1 | ||
Euro | -312 | Euro | -799 |
US Dollar | -161 | US Dollar | -198 |
British Pound | -133 | British Pound | -189 |
Japanese Yen | 133 | Korean Won | -54 |
Philippine Peso | -98 | Philippine Peso | -54 |
Credit spread (CSO1) 2 | Credit spread (CSO1) 2 | ||
France | 178 | United States | 193 |
United Kingdom | 111 | Netherlands | -165 |
Netherlands | 75 | France | -113 |
Indonesia | -63 | Poland | 69 |
South Korea | 63 | Germany | 49 |
1.Basis point value (BPV) measures the impact on value of a one basis point increase in interest
rates.
2.Credit spread sensitivity (CS01) measures the impact on value of a one basis point increase in
credit spreads. Exposures to supranational institutions are not assigned to a specific country.
Credit spread sensitivities per risk class and sector at year-end (*) | ||||
2025 | 2024 | |||
in EUR thousand | Corporate | Financial institutions | Corporate | Financial institutions |
Credit spread (CSO1) 1 | ||||
Risk classes | ||||
1 (AAA) | -2 | -19 | -2 | -118 |
2–4 (AA) | 26 | -13 | -44 | -27 |
5–7 (A) | 64 | -37 | 49 | -246 |
8–10 (BBB) | 191 | -54 | 93 | -76 |
11–13 (BB) | 38 | -14 | 38 | -13 |
14–16 (B) | 56 | 8 | 23 | -12 |
17–22 (CCC and NPL) | 6 | 4 | 4 | 2 |
Total | 378 | -124 | 162 | -489 |
1Credit Spread Sensitivity (CS01) measures the impact on value of a 1 basis point increase in credit spreads. | ||||
Introduction (*)
Funding and liquidity (F&L) risk is the risk that ING or one of its subsidiaries
cannot meet their financial obligations upon their maturity date at a
reasonable cost and in a timely manner. ING incorporates funding and
liquidity risk management in its business strategy and has established a
funding and liquidity risk framework to manage these risks within pre-
defined boundaries.
The following sections elaborate on the various elements of funding and
liquidity risk:
§Funding and liquidity risk framework;
§Funding and liquidity risk management strategy and objectives;
§Funding and liquidity adequacy and risk appetite;
§Funding and liquidity risk indicators;
§Liquidity stress testing; and
§Contingency funding planning.
Funding and liquidity risk framework (*)
Macroeconomic and market environments are important considerations in
ING’s F&L framework. The macroeconomic environment is comprised of
various exogenous factors over which ING has no control, but which may
have a material impact on ING’s F&L position. Exogenous factors analysed
on a regular basis include:
§performance of global and local macroeconomic indicators, e.g. shifts
in gross domestic product, inflation rates, unemployment rates, and
public deficit/surplus;
§developments and risks arising from geopolitical tensions and trends;
§monetary policy with a focus on the alternative monetary measures
employed by central banks in recent years as a result of the global
energy crisis and periods of high inflation; and
§regulatory requirements, e.g. understanding the changing regulatory
landscape as well as the impact of ING’s actions on existing regulatory
boundaries.
The strategic ambitions of ING, together with the design and execution of
the funding plan, are assessed under both current and projected market
conditions. An emphasis is placed on understanding overall market trends
and developments, credit rating changes, and peer comparisons.
The EB, MBB, and staff departments from the CRO and CFO domains, as
well as Group Treasury, have oversight of, and are responsible for,
managing funding and liquidity risks.
Funding and liquidity management strategy and objectives (*)
The main objective of ING’s funding and liquidity risk management is to
maintain sufficient liquidity to fund the commercial activities of ING both
under normal and stressed market circumstances across various locations,
currencies and tenors.
ING’s funding consists mainly of retail and corporate deposits contributing
to 53 percent and 22 percent of total funding, respectively. These funding
sources provide a stable funding base. The remainder of the required
funding is attracted primarily through a combination of long-term and
short-term professional funding. Group Treasury manages the professional
funding in line with the F&L risk appetite with the aim of ensuring a
sufficiently diversified and stable funding base.ING’s long-term professional funding is diversified across maturities and currencies. The main portion of long-term professional funding is euro and
US dollar denominated, which is in line with the currency composition of
customer lending.
Funding and liquidity adequacy and risk appetite (*)ING identifies key drivers of short-term and future liquidity and funding
needs on an ongoing basis through the periodic risk-identification process.
Taking into consideration the identified risk drivers, ING regularly assesses
its current and future liquidity adequacy and, if deemed necessary, takes
action to further improve ING’s liquidity position and maintain sufficient
counterbalancing capacity. A Liquidity Adequacy Statement is formulated
on a regular basis to substantiate and reflect the management view on
the current funding and liquidity position as well as the potential future
challenges. The Liquidity Adequacy Statement is an important part of
ING’s Internal Liquidity Adequacy Assessment Process (ILAAP).
Additionally, ING completes ad-hoc funding and liquidity assessments if
deemed necessary.
ING assesses its F&L adequacy through three lenses – stress, economic,
and normative:
§Through the stress lens, ING evaluates its ability to withstand periods of
prolonged F&L stress for both normative and economic requirements.
Limits under idiosyncratic, market-related, combined idiosyncratic and
market-related, and climate risk scenarios, which lead to customer
deposit outflows, deterioration of access to funding markets, and lower
liquidity value of counterbalancing capacity are evaluated.
§Through the economic lens, ING assesses the extent to which its
customers, professional counterparties, and investors are comfortable
to provide deposits and funding in the tenors, currencies, and
instruments necessary to sustainably fund the business (intraday,
short-term, and long-term) in a going-concern situation.
§Through the normative lens, ING ascertains that the bank is in the
position to meet current and future domestic and host regulatory
requirements.
For each lens, ING has established a related set of risk appetite statements,
which define ING’s risk appetite, commensurate with the principles of
liquidity adequacy.
The F&L risk appetite statements are translated into metrics with
appropriate boundaries and instruments which are used to regularly
measure and manage ING’s funding and liquidity risk. The risk appetite
with respect to the stress lens aims to have sufficient counterbalancing
capacity under various internally defined stress scenarios. Regarding the
economic perspective, an internally defined stable funding to loans (SFtL)
ratio and stable funding surplus (SFS) metric (supplemented by other
metrics) is used to stimulate a diversified funding base and to prevent
overreliance on professional funding. Finally, the liquidity coverage ratio
(LCR) and the net stable funding ratio (NSFR) regulatory metrics are
monitored in terms of both ING’s risk appetite and normative
requirements.
Liquidity stress testing (*)Funding and liquidity stress testing forms part of the overall F&L
framework. It allows ING to examine the effects of exceptional but
plausible future events on ING’s funding and liquidity position and provides
insight into which entities, business lines, or portfolios are vulnerable to
which types of risk drivers or scenarios.
The stress-testing framework encompasses the funding and liquidity risks
of the consolidated balance sheet of ING Group, including all entities,
business lines as well as on- and off-balance sheet positions. The net
liquidity position (NLP) is the main stress-testing measure and is measured
at different time buckets.
The stress-testing framework considers idiosyncratic, market-wide,
combined (idiosyncratic and market-wide) and climate-stress scenarios.
The design of the framework is based on empirical evidence supplemented
by expert judgment. The framework can be extended to additional ad-hoc
scenarios. For example, it can be used as input for firm-wide stress testing
and reverse stress testing.
Outcomes of the stress tests are considered in the key aspects of ING’s F&L
risk framework and F&L risk management, including:
§Risk Appetite Framework (through risk appetite statements);
§Risk identification and assessment;
§Monitoring of the liquidity and funding position;
§Business actions (if needed);
§Contingency funding plan; and
§Early-warning indicators.
The funding and liquidity stress-testing framework is also subject to
regular internal validation by model validation.
In line with supervisory expectations, ING’s liquidity position is stress tested
on (at minimum) a monthly basis using scenarios that form part of the
F&L risk appetite statement. The results of all internal stress scenarios are
monitored and assessed on a monthly basis. In addition, ad-hoc scenarios
based on current economic and market developments are run to
determine their potential impacts on the funding and liquidity position of
ING. In 2025, this included stress-test scenarios assessing the impact of a
shutdown of US short- and long-term funding markets and FX markets.
The internal stress scenarios and their corresponding results serve as input
in the decision on holding additional contingency measures.
Contingency funding planning (*)
ING’s contingent F&L risks are addressed in its Contingency Capital and
Funding Plan (CCFP). The objectives of the CCFP include:
§Establishment of a monitoring framework to detect approaching
contingent events as well as their impact on ING’s F&L position;
§Provision of a plan for responding to various and increasing levels of a
bank’s liquidity and capital shortfall under adverse and stressed
conditions;
§Designation of management responsibilities, crisis communication
methods and channels, and reporting requirements;
§Identification of contingent capital and liquidity sources under
escalating adverse and stressed conditions; and
§Description of the steps needed to ensure the bank’s capital and
liquidity sources are sufficient to fund scheduled operating
requirements and meet the institution’s commitments, with minimal
costs and disruption.
The contingency funding measures are developed in conjunction with the
ING Recovery Plan and are reviewed and tested on a regular basis.