Report of Directors Financial Review Risk Report
Dec. 31, 2025
(Audited)
The Credit Risk sub-function in Group Risk and Compliance is
responsible for the key policies and processes for managing credit risk,
which include formulating Group credit policies and risk rating
frameworks, guiding the Group’s appetite for credit risk exposures,
undertaking independent reviews and objective assessment of credit
risk, and monitoring performance and management of portfolios while
fostering a culture of responsible lending.
Concentration of exposure(Audited)
Concentration of credit risk occurs when multiple counterparties share
similar economic traits or operate in the same sectors or regions,
making them collectively vulnerable to changes in economic or political
conditions. To mitigate this risk, the Group uses various controls such
as portfolio and counterparty limits, approval and review processes, and
stress testing across industries, countries and businesses.
Credit quality of financial instruments
(Audited)
Our risk rating system facilitates the internal ratings-based approach
under the Basel framework to support the calculation of our minimum
capital requirement. The five credit quality classifications encompass a
range of granular internal credit rating grades assigned to wholesale
and retail customers, and the external ratings attributed by external
agencies to debt securities.
For debt securities and certain other financial instruments, external
ratings have been aligned to the five quality classifications based upon
the mapping of related customer risk rating (‘CRR’) to external credit
rating.
Forborne loans and advances(Audited)
Forbearance measures consist of concessions towards an obligor that
is experiencing, or about to experience, difficulties in meeting its
financial commitments.
We continue to class loans as forborne when we modify the
contractual payment terms due to having concerns about the
borrowers’ ability to meet contractual payments when they were due.
Our definition of forborne captures non-payment-related concessions,
such as covenant waivers.
ÑFor details of our policy on forbearance, see Note 1.2(j) in the financial
statementsForborne loans and recognition of expected credit losses
(Audited)
Forborne loans expected credit loss assessments reflect the higher
rates of losses typically experienced with these types of loans; as such
they are categorised as stage 2 and stage 3. The higher rates are more
pronounced in unsecured retail lending requiring further segmentation.
For wholesale lending, forborne loans are typically assessed
individually. Credit risk ratings are intrinsic to the impairment
assessments. The individual impairment assessment takes into
account the higher risk of the future non-payment inherent in forborne
loans.
Impairment assessment
(Audited)
For details of our impairment policies on loans and advances and
financial investments, see Note 1.2(j) on the financial statements.
Write-off of loans and advances
(Audited)
Under IFRS 9, write-off should occur when there is no reasonable
expectation of recovering further cash flows from the financial asset.
This principle does not prohibit early write-off, which is defined in local
policies to ensure effectiveness in the management of customers in
the collections process.
Unsecured personal facilities, including credit cards, are generally
written off at between 150 and 210 days past due. The standard period
runs until the end of the month in which the account becomes 180
days contractually delinquent. However, in exceptional circumstances,
to avoid unfair customer outcomes, deliver customer duty or meet
regulatory expectations, the period may be extended further.
For secured facilities, write-off should occur upon repossession of
collateral, receipt of proceeds via settlement, or determination that
recovery of the collateral will not be pursued. Where these assets are
maintained on the balance sheet beyond 60 months of consecutive
delinquency-driven default, the prospect of recovery is reassessed.
Recovery activity, on both secured and unsecured assets, may
continue after write-off.
Any unsecured exposures that are not written off at 180 days past due,
and any secured exposures that are in ‘default’ status for 60 months or
greater but are not written off, are subject to additional monitoring via
the appropriate governance forums.
Summary of credit risk (excluding debt instruments measured at FVOCI) by stage distribution and ECL coverage by industry sector | |||||||||||||||
(Audited) | |||||||||||||||
Gross carrying/nominal amount1 | Allowance for ECL | ECL coverage % | |||||||||||||
Stage 1 | Stage 2 | Stage 3 | POCI2 | Total | Stage 1 | Stage 2 | Stage 3 | POCI2 | Total | Stage 1 | Stage 2 | Stage 3 | POCI2 | Total | |
$m | $m | $m | $m | $m | $m | $m | $m | $m | $m | % | % | % | % | % | |
893,433 | 80,936 | 24,389 | 333 | 999,091 | (1,201) | (2,318) | (7,097) | (76) | (10,692) | 0.1 | 2.9 | 29.1 | 22.8 | 1.1 | |
– personal | 446,696 | 23,887 | 3,945 | — | 474,528 | (667) | (1,235) | (895) | — | (2,797) | 0.1 | 5.2 | 22.7 | — | 0.6 |
– corporate and commercial | 349,763 | 54,636 | 19,966 | 140 | 424,505 | (478) | (1,064) | (5,909) | (75) | (7,526) | 0.1 | 1.9 | 29.6 | 53.6 | 1.8 |
– non-bank financial institutions | 96,974 | 2,413 | 478 | 193 | 100,058 | (56) | (19) | (293) | (1) | (369) | 0.1 | 0.8 | 61.3 | 0.5 | 0.4 |
108,336 | 132 | 1 | — | 108,469 | (4) | (2) | (1) | — | (7) | — | 1.5 | 100.0 | — | — | |
888,491 | 1,651 | 184 | — | 890,326 | (76) | (11) | (42) | — | (129) | — | 0.7 | 22.8 | — | — | |
669,648 | 20,488 | 652 | 4 | 690,792 | (149) | (97) | (69) | — | (315) | — | 0.5 | 10.6 | — | — | |
– personal | 270,494 | 1,945 | 92 | — | 272,531 | (22) | (5) | — | — | (27) | — | 0.3 | — | — | — |
– corporate and commercial | 255,740 | 14,649 | 560 | 4 | 270,953 | (115) | (88) | (69) | — | (272) | — | 0.6 | 12.3 | — | 0.1 |
– financial | 143,414 | 3,894 | — | — | 147,308 | (12) | (4) | — | — | (16) | — | 0.1 | — | — | — |
Financial guarantees | 15,913 | 1,371 | 192 | — | 17,476 | (8) | (17) | (26) | — | (51) | 0.1 | 1.2 | 13.5 | — | 0.3 |
– personal | 1,446 | — | — | — | 1,446 | (1) | — | — | — | (1) | 0.1 | — | — | — | 0.1 |
– corporate and commercial | 10,071 | 1,287 | 190 | — | 11,548 | (6) | (17) | (26) | — | (49) | 0.1 | 1.3 | 13.7 | — | 0.4 |
– financial | 4,396 | 84 | 2 | — | 4,482 | (1) | — | — | — | (1) | — | — | — | — | — |
At 31 Dec 2025 | 2,575,821 | 104,578 | 25,418 | 337 | 2,706,154 | (1,438) | (2,445) | (7,235) | (76) | (11,194) | 0.1 | 2.3 | 28.5 | 22.6 | 0.4 |
Loans and advances to customers at amortised cost | 824,420 | 93,248 | 22,615 | 90 | 940,373 | (1,078) | (2,546) | (6,040) | (51) | (9,715) | 0.1 | 2.7 | 26.7 | 56.7 | 1.0 |
– personal | 403,746 | 39,919 | 3,560 | — | 447,225 | (570) | (1,158) | (796) | — | (2,524) | 0.1 | 2.9 | 22.4 | — | 0.6 |
–corporate and commercial | 340,987 | 51,231 | 18,376 | 90 | 410,684 | (463) | (1,358) | (4,883) | (51) | (6,755) | 0.1 | 2.7 | 26.6 | 56.7 | 1.6 |
– non-bank financial institutions | 79,687 | 2,098 | 679 | — | 82,464 | (45) | (30) | (361) | — | (436) | 0.1 | 1.4 | 53.2 | — | 0.5 |
Loans and advances to banks at amortised cost | 101,852 | 198 | 2 | — | 102,052 | (9) | (2) | (2) | — | (13) | — | 1.0 | 100.0 | — | — |
Other financial assets measured at amortised cost | 826,621 | 1,806 | 153 | — | 828,580 | (64) | (5) | (23) | — | (92) | — | 0.3 | 15.0 | — | — |
Loan and other credit-related commitments | 597,231 | 21,175 | 958 | 3 | 619,367 | (137) | (121) | (90) | — | (348) | — | 0.6 | 9.4 | — | 0.1 |
– personal | 251,489 | 1,680 | 86 | — | 253,255 | (17) | — | (5) | — | (22) | — | — | 5.8 | — | — |
– corporate and commercial | 231,201 | 17,453 | 838 | 3 | 249,495 | (111) | (116) | (83) | — | (310) | — | 0.7 | 9.9 | — | 0.1 |
– financial | 114,541 | 2,042 | 34 | — | 116,617 | (9) | (5) | (2) | — | (16) | — | 0.2 | 5.9 | — | — |
Financial guarantees | 15,353 | 1,397 | 248 | — | 16,998 | (8) | (5) | (16) | — | (29) | 0.1 | 0.4 | 6.5 | — | 0.2 |
– personal | 1,416 | 11 | — | — | 1,427 | — | — | — | — | — | — | — | — | — | — |
– corporate and commercial | 10,048 | 1,232 | 195 | — | 11,475 | (7) | (5) | (15) | — | (27) | 0.1 | 0.4 | 7.7 | — | 0.2 |
– financial | 3,889 | 154 | 53 | — | 4,096 | (1) | — | (1) | — | (2) | — | — | 1.9 | — | — |
At 31 Dec 2024 | 2,365,477 | 117,824 | 23,976 | 93 | 2,507,370 | (1,296) | (2,679) | (6,171) | (51) | (10,197) | 0.1 | 2.3 | 25.7 | 54.8 | 0.4 |
1Represents the maximum amount at risk should the contracts be fully drawn upon and clients default.
2Purchased or originated credit-impaired (‘POCI’).
Stage 2 days past due analysis | ||||||||||||
(Audited) | ||||||||||||
Gross carrying amount | Allowance for ECL | ECL coverage % | ||||||||||
Stage 2 | Up-to- date | 1 to 29 DPD1 | 30 and > DPD1 | Stage 2 | Up-to- date | 1 to 29 DPD1 | 30 and > DPD1 | Stage 2 | Up-to- date | 1 to 29 DPD1 | 30 and > DPD1 | |
At 31 Dec 2025 | $m | $m | $m | $m | $m | $m | $m | $m | % | % | % | % |
Loans and advances to customers at amortised cost | 80,936 | 77,615 | 1,894 | 1,427 | (2,318) | (1,837) | (211) | (270) | 2.9 | 2.4 | 11.1 | 18.9 |
– personal | 23,887 | 21,481 | 1,483 | 923 | (1,235) | (797) | (188) | (250) | 5.2 | 3.7 | 12.7 | 27.1 |
54,636 | 53,898 | 400 | 338 | (1,064) | (1,024) | (23) | (17) | 1.9 | 1.9 | 5.8 | 5.0 | |
2,413 | 2,236 | 11 | 166 | (19) | (16) | — | (3) | 0.8 | 0.7 | — | 1.8 | |
Loans and advances to banks at amortised cost | 132 | 132 | — | — | (2) | (2) | — | — | 1.5 | 1.5 | — | — |
1,651 | 1,611 | 21 | 19 | (11) | (10) | — | (1) | 0.7 | 0.6 | — | 5.3 | |
At 31 Dec 2024 | ||||||||||||
Loans and advances to customers at amortised cost | 93,248 | 90,157 | 1,888 | 1,203 | (2,546) | (2,147) | (192) | (207) | 2.7 | 2.4 | 10.2 | 17.2 |
– personal | 39,919 | 37,676 | 1,361 | 882 | (1,158) | (799) | (169) | (190) | 2.9 | 2.1 | 12.4 | 21.5 |
– corporate and commercial | 51,231 | 50,486 | 506 | 239 | (1,358) | (1,326) | (21) | (11) | 2.7 | 2.6 | 4.2 | 4.6 |
– non-bank financial institutions | 2,098 | 1,995 | 21 | 82 | (30) | (22) | (2) | (6) | 1.4 | 1.1 | 9.5 | 7.3 |
Loans and advances to banks at amortised cost | 198 | 198 | — | — | (2) | (2) | — | — | 1.0 | 1.0 | — | — |
Other financial assets measured at amortised cost | 1,806 | 1,794 | 3 | 9 | (5) | (5) | — | — | 0.3 | 0.3 | — | — |
1The days past due amounts presented above are on a contractual basis.
Credit exposureMaximum exposure to credit risk
(Audited)
This section provides information on balance sheet items and their
offsets as well as loan and other credit-related commitments.
Commentary on consolidated balance sheet movements in 2025
is provided on page 74.
Maximum exposure to credit risk | ||||||
(Audited) | ||||||
At 31 Dec 2025 | At 31 Dec 2024 | |||||
Maximum exposure | Offset | Net | Maximum exposure | Offset | Net | |
$m | $m | $m | $m | $m | $m | |
Loans and advances to customers held at amortised cost | 988,399 | (25,671) | 962,728 | 930,658 | (22,822) | 907,836 |
– personal | 471,731 | (3,568) | 468,163 | 444,701 | (2,256) | 442,445 |
– corporate and commercial | 416,979 | (20,636) | 396,343 | 403,929 | (18,897) | 385,032 |
– non-bank financial institutions | 99,689 | (1,467) | 98,222 | 82,028 | (1,669) | 80,359 |
Loans and advances to banks at amortised cost | 108,462 | — | 108,462 | 102,039 | — | 102,039 |
Other financial assets held at amortised cost | 888,882 | (5,865) | 883,017 | 827,193 | (4,383) | 822,810 |
– cash and balances at central banks | 242,859 | — | 242,859 | 267,674 | — | 267,674 |
– Hong Kong Government certificates of indebtedness | 44,063 | — | 44,063 | 42,293 | — | 42,293 |
– reverse repurchase agreements – non-trading | 298,392 | (5,865) | 292,527 | 252,549 | (4,383) | 248,166 |
– financial investments | 182,089 | — | 182,089 | 153,973 | — | 153,973 |
– prepayments, accrued income and other assets | 121,479 | — | 121,479 | 110,704 | — | 110,704 |
Assets held for sale | 11,115 | — | 11,115 | 27,234 | — | 27,234 |
Derivatives | 237,740 | (229,223) | 8,517 | 268,637 | (254,257) | 14,380 |
Total on-balance sheet exposure to credit risk | 2,234,598 | (260,759) | 1,973,839 | 2,155,761 | (281,462) | 1,874,299 |
Total off-balance sheet | 1,068,162 | — | 1,068,162 | 970,610 | — | 970,610 |
– financial and other guarantees | 119,840 | — | 119,840 | 109,380 | — | 109,380 |
– loan and other credit-related commitments | 948,322 | — | 948,322 | 861,230 | — | 861,230 |
Total | 3,302,760 | (260,759) | 3,042,001 | 3,126,371 | (281,462) | 2,844,909 |
instruments
(Audited)
ÑA summary of our current policies and practices regarding the identification,
treatment and measurement of stage 1, stage 2, stage 3 (credit impaired)
and POCI financial instruments can be found in Note 1.2(j) on the financial
statements.
Measurement uncertainty and sensitivity analysis of ECL estimates(Audited)The recognition and measurement of ECL involves the use of
significant judgement and estimation. We form multiple scenarios
based on economic forecasts and distributional estimates and apply
these to credit risk models to estimate future credit losses. The results
are then probability-weighted to determine an unbiased ECL estimate.
Management assessed the current economic environment, reviewed
the latest economic forecasts and discussed key risks before selecting
economic scenarios and their weightings.
Management judgemental adjustments are used where modelled
allowance for ECL does not fully reflect the identified risks and related
uncertainty, or to capture significant late-breaking events.
MethodologyAt 31 December 2025, four economic scenarios were used to capture
the latest economic expectations and to articulate management’s view
of the range of risks and potential outcomes. Scenarios are created
using the latest economic forecasts and distributional estimates, each
quarter.
Three scenarios, the Upside, Central and Downside, are drawn from
external consensus forecasts, market data and distributional estimates
of the entire range of economic outcomes. These estimates are used
as conditioning assumptions in a modelled expansion of other
variables, to ensure scenarios that are economically coherent and
internally consistent. The fourth scenario, the Downside 2, represents
management’s view of severe downside risks.
The consensus Central scenario is deemed the ‘most likely’ scenario,
and will attract the largest probability weighting.
The consensus outer scenarios represent short-term cyclical deviations
from the Central scenario, where variable paths converge back to long-
term trend expectations. They are calibrated to a 10% probability.
HSBC’s Central scenario assumes that the effects of announced
climate measures, carbon pricing and green levies are incorporated into
economic forecasts where their short-term effects are known from
enacted legislation, or may be reasonably projected from current trends
and statutory targets. Variable paths and projections aligned to long-
term climate outcomes, but which are dependent on additional policy
adjustments, carry greater uncertainty. Further details about climate
scenarios may be found in the ‘Insights from climate scenario analysis’
section of our Risk review on page 206.
The Downside 2 explores a more extreme economic outcome than
those captured by the consensus scenarios. In this scenario, variables
do not, by design, revert to long-term trend expectations and may
instead explore alternative states of equilibrium, where economic
variables move permanently away from past trends. It is calibrated to a
5% probability.
In most circumstances, the alignment of weightings with the calibrated
probability of scenarios is deemed appropriate for the unbiased
estimation of ECL. However, management may depart from this
probability-based scenario weighting approach when the economic
outlook and forecasts are determined to be particularly uncertain and
risks are elevated.
Description of economic scenariosThe economic assumptions presented in this section are formed by
HSBC with reference to external forecasts and estimates for the
purpose of calculating ECL.
Forecasts may change, and remain subject to uncertainty. Outer
scenarios are designed to capture the potential crystallisation of key
economic and financial risks and alternative paths for economic
variables. The scenarios used to calculate ECL are described below.
The consensus Central scenarioHSBC’s Central scenario incorporates higher growth forecasts for 2026
relative to the fourth quarter of 2024, in most of our major markets.
The change in forecasts for 2027 is more mixed, reflecting differing
regional dynamics. The scenario is modelled consistent with a US tariff
rate, measured as an effective trade-weighted average, of 15% at the
start of 2026. That rate has fallen in recent months to reflect the
lowering of US tariff rates on imports from mainland China, the
conclusion of a trade agreement with Switzerland and targeted tariff
exemptions on key products.
Forecasts for mainland China and Hong Kong have improved relative to
the fourth quarter of 2024, when projections were weighed down by
expectations that the imposition of US tariffs would result in much
slower growth. Growth expectations have since been revised upwards,
supported by China’s success in redirecting trade away from the US,
and further anticipated official policy support. In Hong Kong, further
increases in residential property sector transactions and domestic
consumption are expected to be driven by a lowering of interest rates.
Forecast US GDP growth has also improved relative to the fourth
quarter of 2024 despite trade policy uncertainty, the persistence of
higher inflation and a weaker labour market. The economy has proved
more resilient to tariffs than had been expected, and robust growth in
private sector investment, related to the technology sector, has further
supported growth. The key exception to the improved outlook is the
UK, where forecasts have deteriorated as unemployment has risen and
both household and business confidence has weakened.
Global GDP is expected to grow by 2.5% in 2026 in the Central
scenario, and the average rate of global GDP growth is forecast to be
2.6% over the five-year forecast period.
The key features of our Central scenario are:
–Forecast GDP growth has improved since the fourth quarter of
2024, although the outlook still envisages either a slowdown or
stabilisation in growth in 2026, relative to 2025, for most markets.
The exceptions are Mexico and the UAE, where growth is forecast
to improve in 2026.
–In most markets, unemployment is forecast to rise moderately in
2026 in line with slower economic activity and subdued hiring. It will
remain relatively low by historical standards.
–The evolution of inflation is mixed. In the US and UK, inflation is
expected to fall gradually but remain above central bank target rates
through 2026, reflecting higher tariffs in the US and the effects of
services price inflation in the UK. In mainland China, inflation is
expected to remain subdued due to soft consumer demand and
continued manufacturing growth.
–House prices in mainland China are expected to continue to fall. In
Hong Kong, prices are forecast to see further moderate
improvements due to a revival in buyer interest, spurred by lower
interest rates. House price growth is projected to remain positive,
but subdued, in the UK and the US.
–Challenging conditions are also forecast to continue in certain
segments of the commercial property sector in a number of our
major markets, including Hong Kong. Structural changes to demand
in the office segment in particular have driven lower valuations.
–Policy interest rates in major markets are forecast to gradually
decline further in 2026. In the longer term, they are expected to
remain at a higher level than in recent years.
–The Brent crude oil price is forecast to average around $65 per
barrel over the projection period.
The Central scenario was created with forecasts available in late
November 2025, and subsequently kept under review until the end of
December 2025.
The following tables describe key macroeconomic variables in the consensus Central scenario.Consensus Central scenario | ||||||||||||||
2026–2030 (as at 4Q25) | 2025–2029 (as at 4Q24) | |||||||||||||
UK | US | Hong Kong | Mainland China | France | UAE | Mexico | UK | US | Hong Kong | Mainland China | France | UAE | Mexico | |
GDP (annual average growth rate, %) | ||||||||||||||
2025 | 1.2 | 2.0 | 1.7 | 4.0 | 0.9 | 4.4 | 0.9 | |||||||
2026 | 1.1 | 1.9 | 2.3 | 4.4 | 0.9 | 4.7 | 1.3 | 1.3 | 1.6 | 1.8 | 3.7 | 0.9 | 4.2 | 1.2 |
2027 | 1.4 | 2.0 | 2.3 | 4.2 | 1.2 | 4.1 | 2.0 | 1.8 | 1.6 | 3.5 | 4.3 | 1.4 | 3.9 | 1.7 |
2028 | 1.5 | 2.1 | 2.3 | 4.0 | 1.3 | 3.8 | 2.2 | 1.6 | 1.8 | 3.1 | 3.9 | 1.5 | 3.6 | 1.9 |
2029 | 1.5 | 2.1 | 2.4 | 3.8 | 1.3 | 3.5 | 2.2 | 1.6 | 2.0 | 2.7 | 3.7 | 1.4 | 3.6 | 2.0 |
2030 | 1.5 | 2.0 | 2.4 | 3.8 | 1.3 | 3.5 | 2.2 | |||||||
5-year average1 | 1.4 | 2.0 | 2.3 | 4.0 | 1.2 | 3.9 | 2.0 | 1.5 | 1.8 | 2.6 | 3.9 | 1.2 | 3.9 | 1.5 |
Unemployment rate (%) | ||||||||||||||
2025 | 4.9 | 4.4 | 3.3 | 5.2 | 7.5 | 2.7 | 3.5 | |||||||
2026 | 4.9 | 4.4 | 3.6 | 5.2 | 7.6 | 2.5 | 3.2 | 4.7 | 4.3 | 3.7 | 5.4 | 7.3 | 2.6 | 3.5 |
2027 | 4.7 | 4.3 | 3.4 | 5.2 | 7.6 | 2.4 | 3.2 | 4.5 | 4.3 | 3.3 | 5.2 | 7.2 | 2.6 | 3.5 |
2028 | 4.7 | 4.1 | 3.1 | 5.1 | 7.5 | 2.4 | 3.2 | 4.3 | 4.2 | 3.0 | 5.0 | 7.0 | 2.5 | 3.5 |
2029 | 4.7 | 4.1 | 3.0 | 5.0 | 7.4 | 2.4 | 3.1 | 4.3 | 4.1 | 2.9 | 5.0 | 7.0 | 2.5 | 3.5 |
2030 | 4.7 | 4.1 | 3.0 | 5.0 | 7.4 | 2.4 | 3.1 | |||||||
5-year average1 | 4.7 | 4.2 | 3.2 | 5.1 | 7.5 | 2.4 | 3.2 | 4.5 | 4.2 | 3.2 | 5.2 | 7.2 | 2.6 | 3.5 |
House prices (annual average growth rate, %) | ||||||||||||||
2025 | 1.4 | 4.4 | (0.5) | (5.9) | 2.1 | 9.3 | 7.6 | |||||||
2026 | 1.2 | 1.1 | 0.5 | (1.6) | 4.3 | 5.8 | 4.8 | 3.8 | 3.2 | 2.4 | (0.7) | 4.4 | 5.1 | 4.5 |
2027 | 2.8 | 1.9 | 1.5 | 2.1 | 5.0 | 3.2 | 4.5 | 4.6 | 2.4 | 3.0 | 3.2 | 4.4 | 3.6 | 4.2 |
2028 | 3.3 | 2.7 | 2.5 | 3.5 | 4.1 | 2.3 | 4.4 | 3.5 | 2.5 | 2.7 | 4.1 | 3.8 | 1.8 | 4.0 |
2029 | 2.7 | 3.2 | 2.1 | 3.4 | 3.1 | 2.0 | 4.3 | 2.7 | 2.6 | 2.7 | 2.9 | 3.1 | 1.3 | 4.0 |
2030 | 2.4 | 3.2 | 2.1 | 2.3 | 2.2 | 2.1 | 4.2 | |||||||
5-year average1 | 2.5 | 2.4 | 1.8 | 1.9 | 3.7 | 3.1 | 4.4 | 3.2 | 3.0 | 2.1 | 0.7 | 3.6 | 4.2 | 4.9 |
Inflation (annual average growth rate, %) | ||||||||||||||
2025 | 2.4 | 2.4 | 1.4 | 0.3 | 1.2 | 2.1 | 5.0 | |||||||
2026 | 2.5 | 2.9 | 1.8 | 0.7 | 1.4 | 2.0 | 3.7 | 2.1 | 2.8 | 1.9 | 1.0 | 1.6 | 1.9 | 3.9 |
2027 | 2.1 | 2.3 | 1.9 | 1.2 | 1.7 | 1.9 | 3.6 | 2.1 | 2.5 | 2.2 | 1.5 | 2.0 | 1.8 | 3.4 |
2028 | 2.1 | 2.2 | 2.0 | 1.4 | 2.1 | 1.9 | 3.5 | 2.0 | 2.2 | 2.2 | 1.7 | 2.3 | 1.9 | 3.4 |
2029 | 2.0 | 2.2 | 2.2 | 1.5 | 2.1 | 2.0 | 3.4 | 2.0 | 2.1 | 2.3 | 1.6 | 2.2 | 1.8 | 3.4 |
2030 | 2.0 | 2.2 | 2.2 | 1.5 | 1.9 | 2.0 | 3.4 | |||||||
5-year average | 2.2 | 2.4 | 2.0 | 1.3 | 1.9 | 1.9 | 3.5 | 2.1 | 2.4 | 2.0 | 1.2 | 1.9 | 1.9 | 3.8 |
Central bank policy rate (annual average, %) | ||||||||||||||
2025 | 4.2 | 4.1 | 4.5 | 2.9 | 2.1 | 4.1 | 9.4 | |||||||
2026 | 3.5 | 3.4 | 3.8 | 3.0 | 1.9 | 3.5 | 7.0 | 3.9 | 3.7 | 4.1 | 2.9 | 1.8 | 3.8 | 8.8 |
2027 | 3.4 | 3.1 | 3.5 | 3.0 | 2.0 | 3.1 | 7.2 | 3.8 | 3.7 | 4.0 | 3.0 | 2.0 | 3.7 | 8.8 |
2028 | 3.5 | 3.2 | 3.6 | 3.1 | 2.1 | 3.3 | 7.5 | 3.7 | 3.6 | 4.0 | 3.2 | 2.0 | 3.6 | 8.9 |
2029 | 3.7 | 3.4 | 3.8 | 3.1 | 2.3 | 3.4 | 7.7 | 3.7 | 3.6 | 4.0 | 3.3 | 2.1 | 3.6 | 8.9 |
2030 | 3.8 | 3.6 | 3.9 | 3.2 | 2.5 | 3.6 | 7.9 | |||||||
5-year average1 | 3.6 | 3.3 | 3.7 | 3.1 | 2.2 | 3.4 | 7.5 | 3.9 | 3.7 | 4.1 | 3.1 | 2.0 | 3.8 | 8.9 |
1The five-year average is calculated over a projected period of 20 quarters from 1Q26 to 4Q30 for the 4Q25 scenario and 1Q25 to 4Q29 for the 4Q24 scenario.
2For mainland China, the rate shown is the Loan Prime Rate.
The consensus Upside scenarioCompared with the Central scenario, the consensus Upside scenario
features stronger economic activity in the near term, before converging
to long-run trend expectations. It also incorporates lower
unemployment and higher asset prices than incorporated in the Central
scenario. Inflation accelerates modestly, driven by increased
investment and higher consumption spending.
The scenario is consistent with a number of key upside risk themes.
These include a partial rollback of tariff measures, deregulation, an
improvement in the US-China relationship, and a de-escalation in
geopolitical tensions.
The following tables describe key macroeconomic variables in the
consensus Upside scenario.
Consensus Upside scenario 2026–2030 (as at 4Q25) | ||||||||||||||
UK | US | Hong Kong | Mainland China | France | UAE | Mexico | ||||||||
GDP level (%, start-to-peak)1 | 11.0 | (4Q30) | 15.2 | (4Q30) | 20.7 | (4Q30) | 28.6 | (4Q30) | 8.5 | (4Q30) | 29.0 | (4Q30) | 16.9 | (4Q30) |
Unemployment rate (%, min)2 | 3.2 | (4Q27) | 3.5 | (4Q27) | 2.8 | (2Q28) | 4.7 | (4Q27) | 6.6 | (4Q27) | 2.0 | (4Q27) | 2.8 | (3Q26) |
House price index (%, start-to-peak)1 | 20.0 | (4Q30) | 23.2 | (4Q30) | 19.4 | (4Q30) | 14.9 | (4Q30) | 22.6 | (4Q30) | 22.2 | (4Q30) | 29.5 | (4Q30) |
Inflation rate (YoY % change, max)3 | 3.5 | (1Q26) | 3.6 | (3Q26) | 2.9 | (2Q26) | 1.5 | (4Q30) | 2.4 | (4Q27) | 3.1 | (2Q26) | 4.2 | (1Q26) |
Central bank policy rate (%, max)3 | 3.9 | (1Q26) | 3.9 | (1Q26) | 4.2 | (1Q26) | 3.4 | (1Q27) | 2.5 | (4Q30) | 3.9 | (1Q26) | 8.1 | (4Q30) |
Consensus Upside scenario 2025–2029 (as at 4Q24) | ||||||||||||||
UK | US | Hong Kong | Mainland China | France | UAE | Mexico | ||||||||
GDP level (%, start-to-peak)1 | 11.3 | (4Q29) | 13.6 | (4Q29) | 21.4 | (4Q29) | 27.5 | (4Q29) | 8.9 | (4Q29) | 28.9 | (4Q29) | 13.6 | (4Q29) |
Unemployment rate (%, min)2 | 3.5 | (3Q26) | 3.6 | (1Q26) | 2.9 | (4Q29) | 4.9 | (4Q26) | 6.4 | (4Q26) | 2.2 | (4Q26) | 3.0 | (1Q25) |
House price index (%, start-to-peak)1 | 24.2 | (4Q29) | 23.6 | (4Q29) | 25.3 | (4Q29) | 9.8 | (4Q29) | 22.8 | (4Q29) | 26.1 | (4Q29) | 31.7 | (4Q29) |
Inflation rate (YoY % change, min)3 | 1.4 | (1Q26) | 1.6 | (2Q26) | (0.1) | (4Q25) | (1.0) | (4Q25) | 0.1 | (4Q25) | 0.6 | (4Q25) | 3.1 | (2Q26) |
Central bank policy rate (%, min)3 | 3.6 | (4Q25) | 3.6 | (1Q29) | 4.0 | (1Q29) | 2.7 | (1Q26) | 1.4 | (3Q25) | 3.6 | (1Q29) | 7.6 | (1Q26) |
1Cumulative change to the highest level of the series during the 20-quarter projection.
2Lowest projected unemployment rate in the scenario.
3Highest/lowest projected policy rate and year-on-year percentage change in inflation in the scenario. For mainland China, the rate shown is the Loan Prime Rate.
Downside scenariosDownside scenarios explore the intensification and crystallisation of
key risk themes and are modelled so that economic shocks drive
consumption and investment lower and commodity prices fall. For
most markets, inflation and interest rates are lower compared with the
Central scenario. That narrative is disrupted in the US and Mexico as
higher tariff rates and other countermeasures are assumed to drive a
broad increase in import prices.
Key downside risks include:
–an increase in protectionist policies. This lowers investment,
complicates international supply chains, and impedes trade flows;
–abrupt asset repricing given elevated valuations, particularly in the
tech sector, eroding wealth effects and ultimately increasing credit
risks;
–broader and more prolonged conflict in the Middle East and the
Russia-Ukraine war, which undermine confidence and investment;
and
–continued differences between the US and China, which affect
economic confidence and the global goods trade and supply chains
for critical technologies.
The consensus Downside scenario
In the consensus Downside scenario, the effects of tariffs on the
global economy are worse than expected, leading to weaker economic
activity compared with the Central scenario. The scenario is consistent
with the tariff rate, measured as an effective trade-weighted average,
rising to 19% in 2026, and remaining at that level in 2027. The key
driver of that increase is the application of sector-specific tariff rates.
In this scenario, GDP declines and unemployment rates rise, while
asset prices and commodity prices fall. The scenario features an
escalation in geopolitical tensions and an increase in tariffs over and
above those assumed in the Central scenario. Existing and recently
approved trade agreements are assumed to hold. In most markets,
inflation declines relative to the Central scenario, as tariffs are assumed
to drive a drop in export demand from the US. In the US and Mexico,
the scenario sees inflation rise as higher tariffs across a broad range of
imported goods pass through to consumer prices.
In the scenario, oil prices trough at $40 per barrel.
The following tables describe key macroeconomic variables in the
consensus Downside scenario.
Consensus Downside scenario 2026–2030 (as at 4Q25) | ||||||||||||||
UK | US | Hong Kong | Mainland China | France | UAE | Mexico | ||||||||
GDP level (%, start-to-trough)1 | (0.2) | (2Q27) | (0.8) | (3Q26) | (1.7) | (4Q27) | (1.7) | (3Q26) | (0.4) | (3Q26) | 0.4 | (1Q26) | (1.0) | (1Q27) |
Unemployment rate (%, max)2 | 6.2 | (4Q26) | 5.3 | (3Q26) | 4.8 | (4Q26) | 6.8 | (4Q27) | 8.6 | (3Q26) | 3.2 | (3Q27) | 3.8 | (3Q26) |
House price index (%, start-to-trough)1 | (4.1) | (1Q27) | (3.1) | (1Q27) | (3.8) | (1Q27) | (5.6) | (1Q27) | 0.7 | (1Q26) | (3.4) | (2Q26) | 0.6 | (1Q26) |
Inflation rate (YoY % change)3 | 1.3 | (3Q26) | 3.4 | (1Q26) | 0.1 | (4Q26) | (2.9) | (4Q26) | 0.4 | (4Q26) | 0.5 | (4Q26) | 4.7 | (1Q26) |
Central bank policy rate (%)3 | 2.2 | (3Q28) | 4.6 | (2Q26) | 5.0 | (2Q26) | 1.5 | (4Q26) | 0.6 | (1Q27) | 4.6 | (2Q26) | 9.5 | (2Q26) |
Consensus Downside scenario 2025–2029 (as at 4Q24) | ||||||||||||||
UK | US | Hong Kong | Mainland China | France | UAE | Mexico | ||||||||
GDP level (%, start-to-trough)1 | (1.0) | (4Q26) | (0.6) | (3Q25) | (4.5) | (4Q25) | (2.5) | (3Q25) | (0.6) | (1Q26) | 0.3 | (1Q25) | (2.1) | (4Q26) |
Unemployment rate (%, max)2 | 6.1 | (4Q25) | 5.3 | (3Q25) | 5.1 | (2Q26) | 6.9 | (4Q26) | 8.3 | (3Q25) | 3.4 | (1Q26) | 4.1 | (4Q25) |
House price index (%, start-to-trough)1 | (4.5) | (1Q26) | (0.2) | (1Q25) | (1.9) | (2Q26) | (12.8) | (3Q26) | (0.3) | (1Q25) | (0.4) | (1Q25) | 2.1 | (1Q25) |
Inflation rate (YoY % change, max)3 | 3.4 | (4Q25) | 4.5 | (1Q26) | 3.1 | (1Q26) | 2.0 | (1Q26) | 2.6 | (3Q25) | 2.8 | (1Q26) | 7.4 | (4Q25) |
Central bank policy rate (%, max)3 | 5.0 | (1Q25) | 4.8 | (1Q25) | 5.2 | (1Q25) | 3.0 | (1Q25) | 3.2 | (1Q25) | 4.8 | (1Q25) | 11.5 | (3Q25) |
1Cumulative change to the lowest level of the series during the 20-quarter projection.
2The highest projected unemployment rate in the scenario.
3The table for 4Q25 shows highest year-on-year percentage change in inflation and projected policy rates for the US and Mexico, and lowest for other countries
and territories. For the UAE and Hong Kong, the policy rate is shown as the maximum, consistent with the operation of US-dollar-linked exchange rates. For
mainland China, the rate shown is the Loan Prime Rate.
Downside 2 scenario
The Downside 2 scenario reflects management’s view of the tail of the
economic distribution. It incorporates the simultaneous crystallisation
of a number of risks that lead to a deep global recession. The
subsequent drop in demand leads to a steep fall in commodity prices,
and a rapid increase in unemployment.
The narrative features an escalation in tariff actions, resulting in a global
trade war, and further intensification of geopolitical crises. Asset prices
fall steeply, with technology-related stocks expected to experience the
most significant price adjustments. The scenario is consistent with the
US tariff rate, measured as an effective trade-weighted average, rising
to 25% in 2026, and remaining at that level in 2027.
In the scenario, oil prices trough at $30 per barrel.
The following tables describe key macroeconomic variables in the
Downside 2 scenario.
Downside 2 scenario 2026–2030 (as at 4Q25) | ||||||||||||||
UK | US | Hong Kong | Mainland China | France | UAE | Mexico | ||||||||
GDP level (%, start-to-trough)1 | (5.3) | (2Q27) | (4.5) | (1Q27) | (9.3) | (3Q27) | (6.0) | (1Q27) | (6.2) | (2Q27) | (5.7) | (2Q27) | (10.0) | (1Q27) |
Unemployment rate (%, max)2 | 8.9 | (2Q27) | 9.0 | (1Q28) | 7.0 | (4Q26) | 7.0 | (4Q27) | 10.7 | (4Q27) | 3.9 | (3Q26) | 5.2 | (2Q27) |
House price index (%, start-to-trough)1 | (24.2) | (4Q27) | (17.1) | (4Q26) | (19.6) | (2Q29) | (23.1) | (4Q27) | (5.9) | (3Q27) | (30.5) | (1Q28) | 0.6 | (1Q26) |
Inflation rate (YoY % change)3 | (1.9) | (4Q26) | 4.1 | (2Q26) | (1.7) | (2Q27) | (6.5) | (4Q26) | (0.6) | (4Q26) | 0.3 | (4Q26) | 4.8 | (1Q26) |
Central bank policy rate (%)3 | 1.4 | (1Q27) | 4.7 | (2Q26) | 5.0 | (2Q26) | 1.2 | (2Q27) | 0.1 | (4Q26) | 4.7 | (2Q26) | 9.9 | (2Q26) |
Downside 2 scenario 2025–2029 (as at 4Q24) | ||||||||||||||
UK | US | Hong Kong | Mainland China | France | UAE | Mexico | ||||||||
GDP level (%, start-to-trough)1 | (9.1) | (2Q26) | (4.1) | (2Q26) | (10.1) | (4Q25) | (8.7) | (4Q25) | (7.9) | (2Q26) | (6.8) | (2Q26) | (10.5) | (3Q26) |
Unemployment rate (%, max)2 | 8.4 | (2Q26) | 9.3 | (2Q26) | 7.1 | (1Q26) | 7.1 | (4Q26) | 10.4 | (1Q27) | 5.0 | (3Q25) | 5.6 | (1Q26) |
House price index (%, start-to-trough)1 | (27.2) | (4Q26) | (15.8) | (4Q25) | (34.4) | (3Q27) | (30.5) | (4Q26) | (14.0) | (2Q27) | (13.2) | (2Q27) | 2.0 | (1Q25) |
Inflation rate (YoY % change, max)3 | 10.1 | (2Q25) | 4.9 | (4Q25) | 3.6 | (1Q26) | 3.8 | (4Q25) | 7.6 | (2Q25) | 3.7 | (2Q25) | 7.9 | (4Q25) |
Central bank policy rate (%, max)3 | 5.5 | (1Q25) | 5.5 | (1Q25) | 5.9 | (1Q25) | 3.5 | (3Q25) | 4.2 | (1Q25) | 5.6 | (1Q25) | 12.1 | (3Q25) |
1Cumulative change to the lowest level of the series during the 20-quarter projection.
2 The highest projected unemployment rate in the scenario.
3 The table for 4Q25 shows highest year-on-year percentage change in inflation and projected policy rates for the US and Mexico, and lowest for other countries
and territories. For the UAE and Hong Kong, the policy rate is shown as the maximum, consistent with the operation of US-dollar-linked exchange rates. For
mainland China, the rate shown is the Loan Prime Rate.
The following graphs show the historical and forecasted GDP growth rate for the various economic scenarios in our four largest markets.Hong Kong |
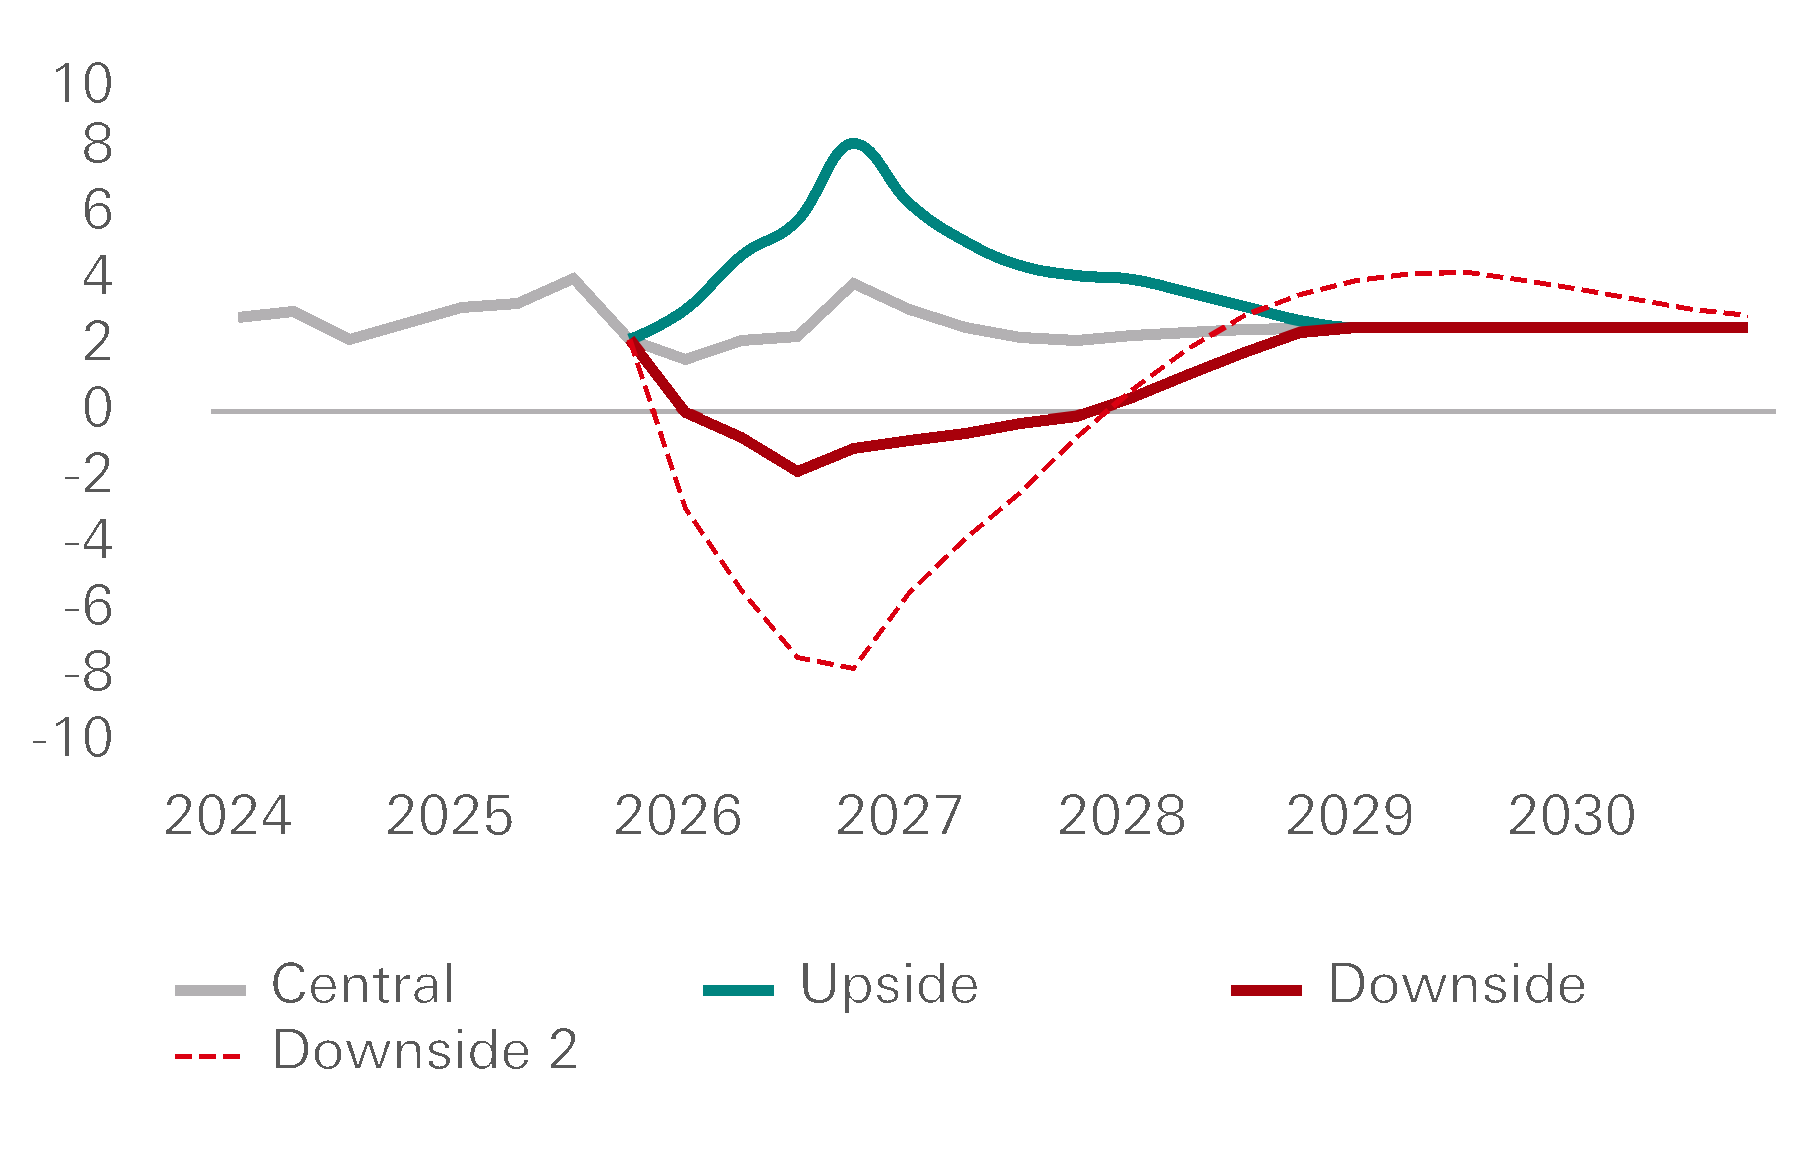
Mainland China |
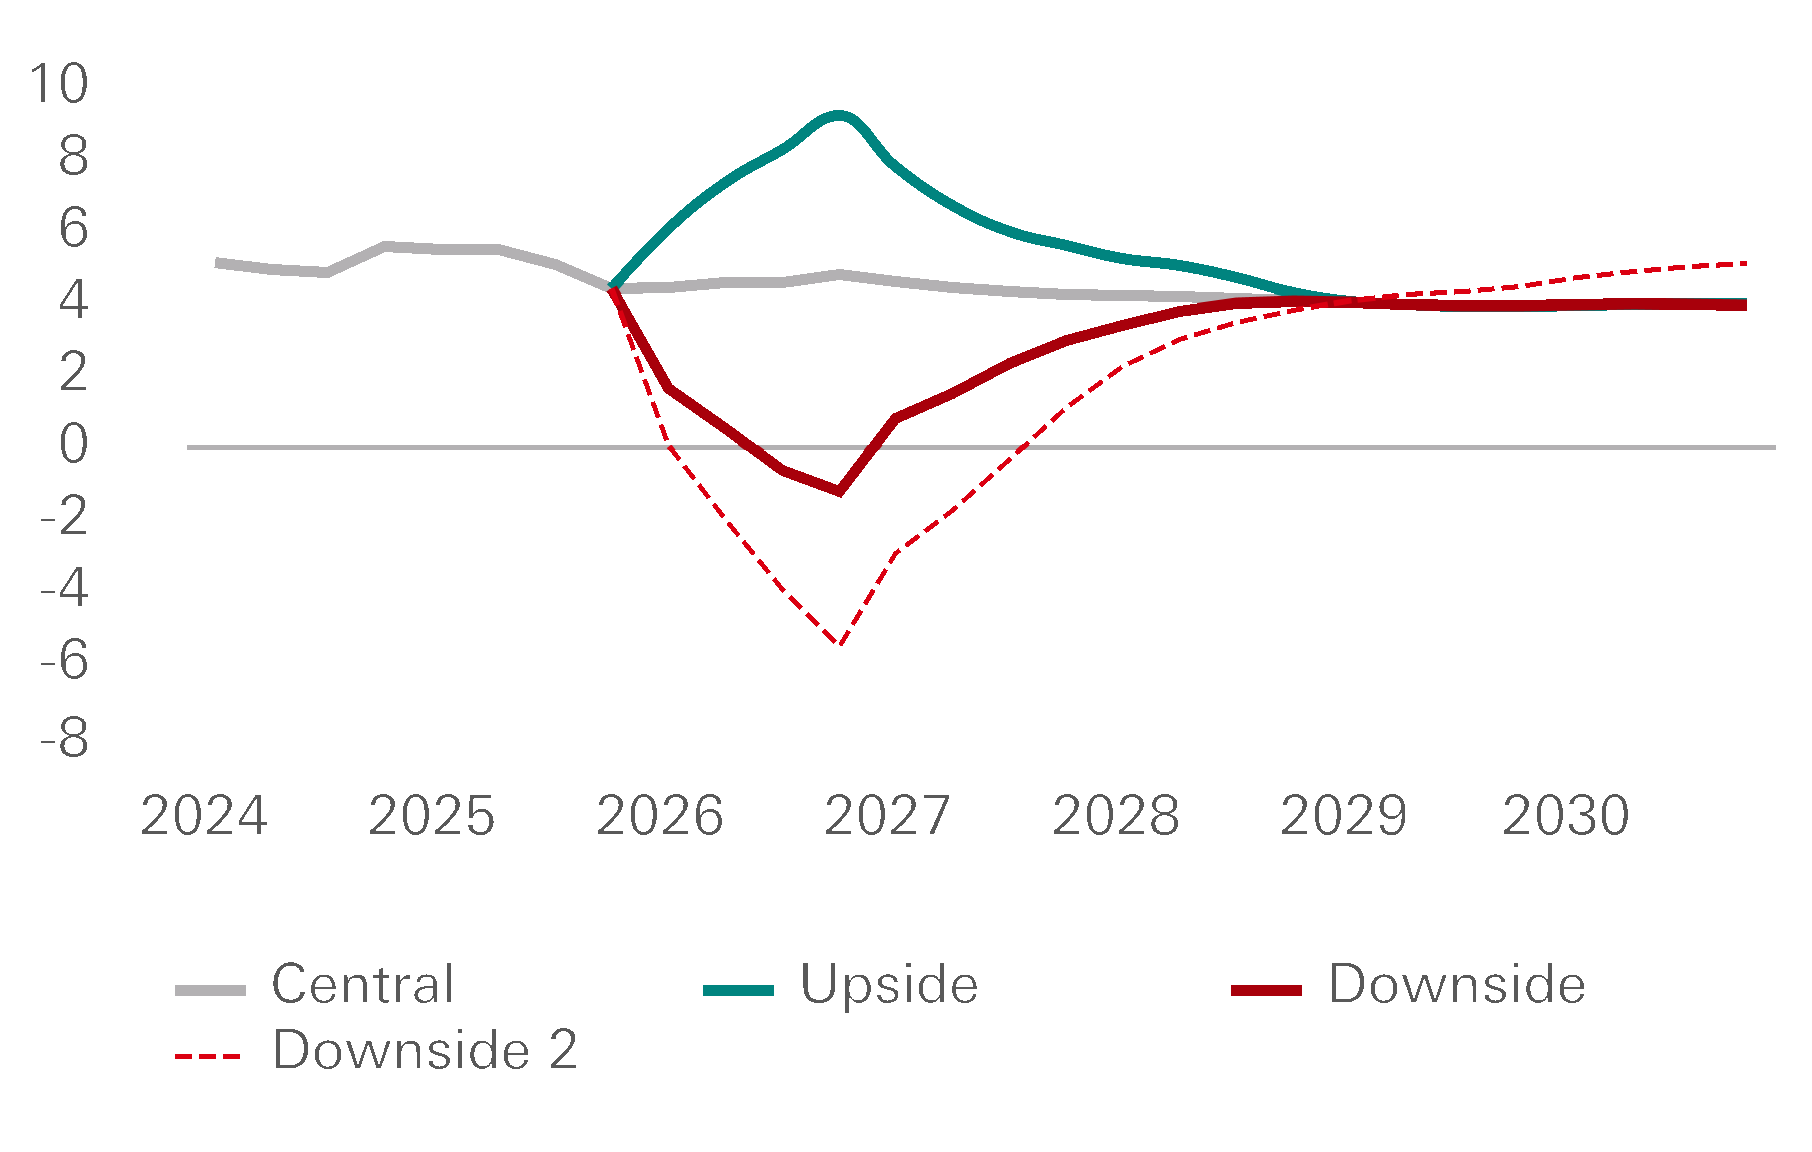
UK |
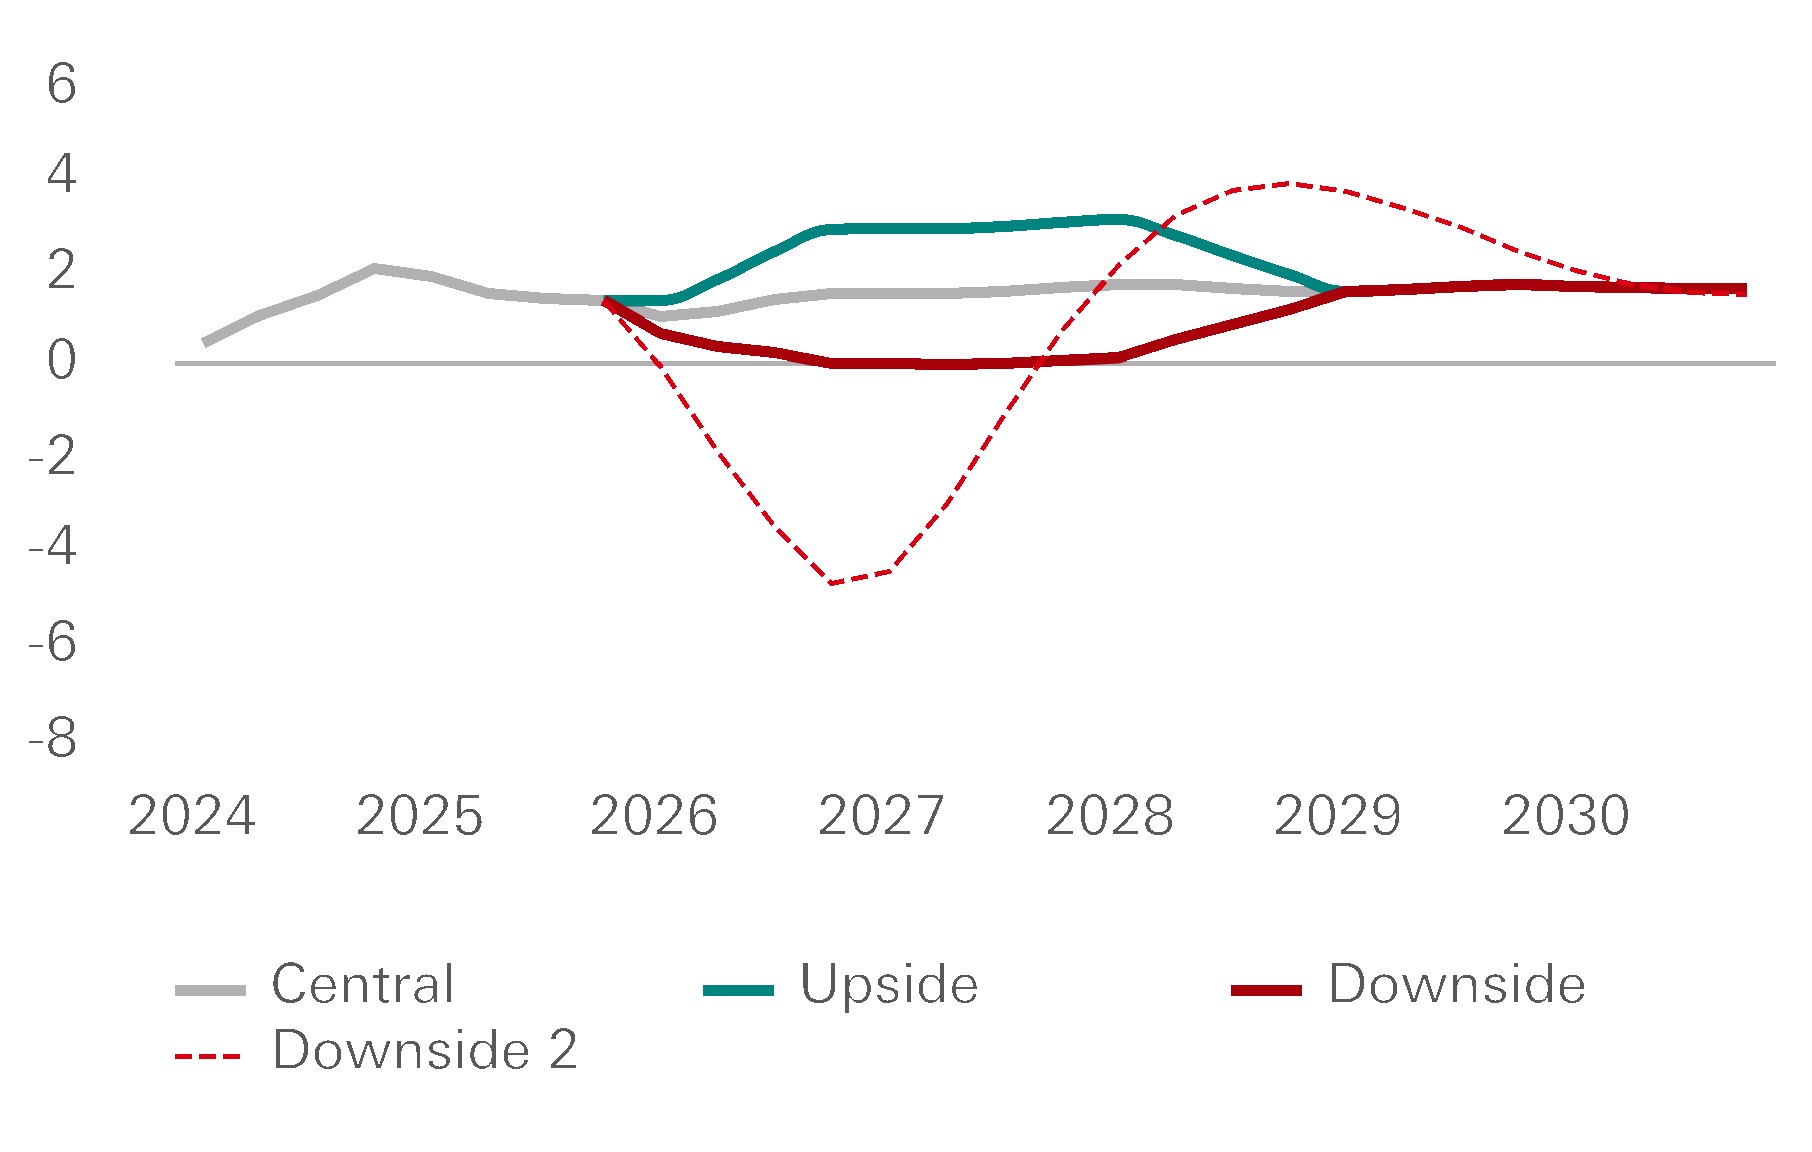
US |
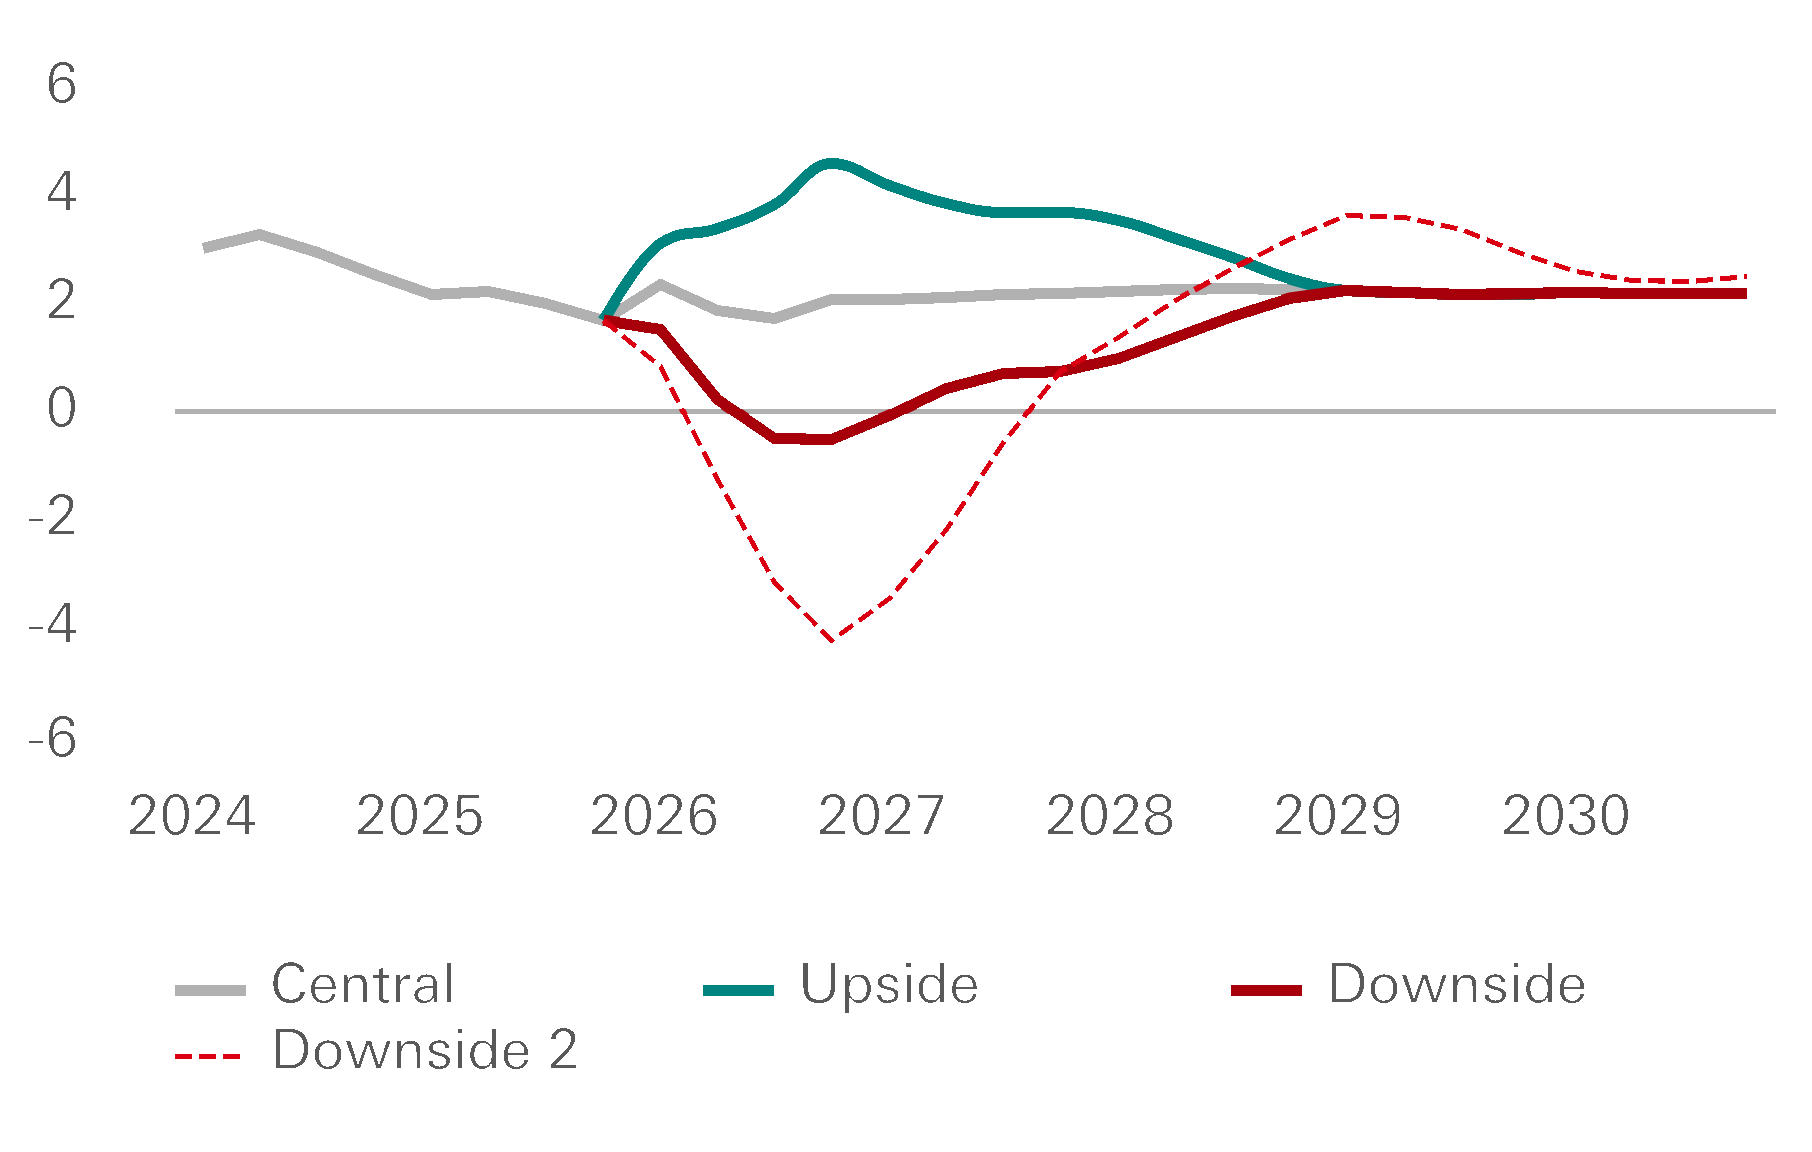
Scenario weightings are calibrated to probabilities that are determined
with reference to consensus forecast probability distributions.
Management may then choose to vary weights if they assess that the
calibration lags more recent events, or does not reflect their view of
the distribution of economic and geopolitical risk. Management’s view
of the scenarios and the probability distribution takes into consideration
the relationship of the consensus scenario to both internal and external
assessments of risk.
For the fourth quarter of 2025, forecast and distributional estimates
were assessed to have incorporated available information around tariffs
and policy uncertainties and no major events had occurred since
scenario production that changed the outlook materially. Forecast
dispersion, financial market volatility and other measures of uncertainty
remained close to their long-term average.
Consequently, there was no variation in scenario weights and they
were aligned to the calibrated probabilities of the scenarios. The
consensus Central scenario was assigned a 75% probability weighting
in our major markets. The consensus Upside scenario was assigned a
10% weighting, and the consensus Downside scenario was given
10%. The Downside 2 was assigned a 5% weighting.
In light of the US intervention in the political leadership and energy
assets of Venezuela during early January 2026, management assessed
the potential implications, including to oil prices, and concluded that
expected spillovers remain within the scope of existing scenarios,
including potentially significantly lower oil prices. Subsequent tariff
developments in relation to Greenland were also assessed on the
same basis and no additional action was deemed necessary for
economic scenarios or weights.
The following tables describe the probabilities assigned in each
scenario.
Scenario weightings, % | ||||||||||||||||
4Q25 | 4Q24 | |||||||||||||||
Standard weights | UK | US | Hong Kong | Mainland China | France | UAE | Mexico | Standard weights | UK | US | Hong Kong | Mainland China | France | UAE | Mexico | |
Upside scenario | 10 | 10 | 10 | 10 | 10 | 10 | 10 | 10 | 10 | 10 | 10 | 10 | 10 | 10 | 10 | 10 |
Central scenario | 75 | 75 | 75 | 75 | 75 | 75 | 75 | 75 | 75 | 75 | 75 | 75 | 75 | 75 | 75 | 75 |
Downside scenario | 10 | 10 | 10 | 10 | 10 | 10 | 10 | 10 | 10 | 10 | 10 | 10 | 10 | 10 | 10 | 10 |
Downside 2 scenario | 5 | 5 | 5 | 5 | 5 | 5 | 5 | 5 | 5 | 5 | 5 | 5 | 5 | 5 | 5 | 5 |
At 31 December 2025, the consensus Upside and Central scenarios for
all markets had a combined weighting of 85%, unchanged from the
weightings at 31 December 2024. Weightings assigned to downside
scenarios also remained unchanged.
Critical estimates and judgementsThe IFRS 9 Expected Credit Losses (‘ECL’) calculation involved
significant judgements, assumptions and estimates. These included
selecting and configuring economic scenarios amid changing
economic conditions and risks and estimating their effects on ECL,
especially when historical conditions are not fully captured by credit
risk models.
How economic scenarios are reflected in ECL calculations
Models are used to reflect economic scenarios for the ECL estimates. We have developed globally consistent methodologies for the
application of forward economic guidance into the calculation of ECL
for wholesale and retail credit risk.
For wholesale portfolios, a global methodology is used for the
estimation of the term structure of probability of default (‘PD’) and loss
given default (‘LGD’). PDs use the correlation of forward economic
guidance with default rates for a particular industry within a country,
and LGDs use the correlation of forward economic guidance with
collateral values and realisation rates for a particular country and
industry. PDs and LGDs are estimated for the entire term structure of
each instrument.
For impaired loans, allowances for ECL estimates are based on
discounted cash flow (‘DCF’) calculations for internal forward-looking
scenarios specific to individual borrower circumstances. Probability-
weighted outcomes are applied and, depending on materiality and the
status of the borrower, the number of scenarios considered will
change. Where relevant for the case being assessed, forward
economic guidance is considered as part of these scenarios. LGD-
driven ECL estimates are used for certain less material cases.
For our retail portfolios, the models are predominantly based on
historical observations and correlations with default rates and collateral
values.
For PD, the impact of economic scenarios is modelled for each
portfolio, using historical relationships between default rates and
macroeconomic variables. These are included within IFRS 9 ECL
estimates using either economic response models or models that
contain internal, external and macroeconomic variables. The
macroeconomic impact on PD is modelled over the period equal to the
remaining maturity of the assets.
For LGD, the impact is modelled for mortgage portfolios by forecasting
future loan-to-value profiles for the remaining maturity of the asset,
using national level house price index forecasts and applying the
corresponding LGD expectation relative to the updated forecast
collateral values.
For unsecured retail portfolios, historically observed recovery rates are
leveraged to measure loss. For both mortgages and unsecured loans, a
limited number of portfolios utilise a stressed LGD applied to the
Downside 2 scenario.
Management judgemental adjustmentsIFRS 9 management judgemental adjustments are typically short-term
increases or decreases to the modelled allowance for ECL at a
customer, segment or portfolio level where management believes
allowances do not sufficiently reflect the ECL at the reporting date.
These relate to risks or uncertainties that are not reflected in the
models or to any late-breaking events with significant uncertainty,
subject to management review and challenge.
Management judgemental adjustments impacts are considered for
both gross balances and allowances for ECL when determining
whether a significant increase in credit risk has occurred, and is
allocated to an appropriate stage in accordance with the internal
adjustments framework.
Management judgemental adjustments are reviewed under the IFRS 9
governance process see page 107. Management’s review and
challenge focuses on the rationale and adjustment amounts and,
where significant, is subject to a further review by the second line of
defence. Internal frameworks establish the conditions where some
management judgemental adjustments should no longer be required
and as such are considered as part of the governance process.
The internal governance process regularly reviews management
judgemental adjustments and, where possible, mitigates these through
a model recalibration or redevelopment.
Management judgemental adjustment drivers evolve as the economic
environment changes and new risks emerge. In addition to
management judgemental adjustments there are also ‘Other
adjustments’, which are made to address process limitations and data/
model deficiencies and can also include, where appropriate, the impact
of new models where governance has sufficiently progressed to allow
an accurate estimate of ECL allowance to be incorporated into the total
reported ECL.
For the wholesale portfolio, management judgemental adjustments
apply to the performing portfolio only as defaulted exposures are
individually assessed.
At 31 December 2025, there was a $0.1bn increase in management
judgemental adjustments compared with 31 December 2024.
Management judgemental adjustments made in estimating the
scenario-weighted reported allowance for ECL at 31 December 2025
are set out in the following table.
Management judgemental adjustments to ECL | ||||||
At 31 December 20251 | At 31 December 20241 | |||||
Retail | Wholesale2 | Total | Retail | Wholesale2 | Total | |
$bn | $bn | $bn | $bn | $bn | $bn | |
Modelled ECL (A)3 | 2.8 | 1.8 | 4.6 | 2.6 | 2.0 | 4.6 |
Banks, sovereigns, government entities and low-risk counterparties | 0.0 | 0.0 | ||||
Corporate lending adjustments | 0.1 | 0.1 | 0.1 | 0.1 | ||
Other credit judgements | 0.1 | 0.1 | 0.0 | 0.0 | ||
Total management judgemental adjustments (B)4 | 0.1 | 0.1 | 0.2 | 0.0 | 0.1 | 0.1 |
Other adjustments (C)5 | (0.0) | 0.1 | 0.1 | (0.0) | 0.1 | 0.1 |
Final ECL (A + B + C)6 | 2.9 | 2.0 | 4.9 | 2.6 | 2.2 | 4.8 |
1Management judgemental adjustments presented in the table reflect increases or (decreases) to allowance for ECL, respectively.
2The wholesale portfolio corresponds to adjustments to the performing portfolio (stage 1 and stage 2).
3(A) refers to probability-weighted allowance for ECL before any adjustments are applied.
4(B) refers to adjustments that are applied where management believes allowance for ECL does not sufficiently reflect the credit risk/ECL of any given portfolio at
the reporting date. These can relate to risks or uncertainties that are not reflected in the model and/or to any late-breaking events.
5(C) refers to adjustments to allowance for ECL made to address process limitations and data/model deficiencies and can also include where appropriate, the impact of
new models where governance has sufficiently progressed to allow an accurate estimate of ECL allowance to be incorporated into the total reported ECL.
Management judgemental adjustments at 31 December 2025 were an
increase to allowance for ECL of $0.1bn for the wholesale portfolio,
and $0.1bn for the retail portfolio.
At 31 December 2025, wholesale management judgemental
adjustments to the allowance for ECL remained stable at $0.1bn,
consistent with the position at 31 December 2024. These were mainly
to corporate exposures to reflect heightened uncertainty in specific
sectors and geographies, including offsetting adjustments to the real
estate sector in mainland China, Hong Kong and the US, and
adjustments to exposures to the automotive and industrial sectors in
Germany.
At 31 December 2025, retail management judgemental adjustments
were an increase to allowance for ECL of $0.1bn (31 December 2024:
$0.0bn). The marginal increase in ‘Other credit judgements’ compared
with 31 December 2024 was in relation to a number of market-specific
adjustments that were not individually significant.
Economic scenarios sensitivity analysis of ECL estimates
Management considered the sensitivity of the ECL outcome against
the economic forecasts as part of the ECL governance process by
recalculating the allowance for ECL under each scenario described
above for selected portfolios, applying a 100% weighting to each
scenario in turn. The weighting is reflected in both the determination of
a significant increase in credit risk and the measurement of the
resulting allowances.
The allowance for ECL calculated for the Upside and Downside
scenarios should not be taken to represent the upper and lower limits
of possible ECL outcomes. The impact of defaults that might occur in
the future under different economic scenarios is captured by
recalculating allowances for loans at the balance sheet date.
There is a particularly high degree of estimation uncertainty in numbers
representing tail risk scenarios when assigned a 100% weighting.
For wholesale credit risk exposures, the sensitivity analysis excludes
allowance for ECL and financial instruments related to defaulted (stage
3) obligors. The measurement of stage 3 ECL is relatively more
sensitive to credit factors specific to the obligor than future economic
scenarios, and therefore the effects of macroeconomic factors are not
necessarily the key consideration when performing individual
assessments of allowances for obligors in default. Loans to defaulted
obligors are a small portion of the overall wholesale lending exposure,
even if representing the majority of the allowance for ECL. Due to the
range and specificity of the credit factors to which the ECL is sensitive,
it is not possible to provide a meaningful alternative sensitivity analysis
for a consistent set of risks across all defaulted obligors.
For retail mortgage exposures the sensitivity analysis includes
allowance for ECL for defaulted obligors of loans and advances. This is
because the retail ECL for secured mortgage portfolios, including loans
in all stages, is sensitive to macroeconomic variables.
Wholesale and retail sensitivityThe wholesale and retail sensitivity tables present the 100% weighted
results for each of our scenarios. These exclude portfolios held by the
insurance business and small portfolios, and as such cannot be directly
compared with personal and wholesale lending presented in other
credit risk tables. In both the wholesale and retail analysis, the
comparative period results for Downside 2 scenarios are also not
directly comparable with the current period, because they reflect
different risks relative to the consensus scenarios for the period end.
The wholesale and retail sensitivity analysis is stated inclusive of
management judgemental adjustments, as appropriate to each
scenario.
For both retail and wholesale portfolios, the gross carrying amount of
financial instruments are the same under each scenario. For exposures
with similar risk profile and product characteristics, the sensitivity
impact is therefore largely the result of changes in macroeconomic
assumptions.
Wholesale analysisIFRS 9 ECL sensitivity to future economic conditions1,2,3 | ||||||
Reported Gross carrying amount4 | Reported allowance for ECL | Consensus Central scenario allowance for ECL | Consensus Upside scenario allowance for ECL | Consensus Downside scenario allowance for ECL | Downside 2 scenario allowance for ECL | |
By geography at 31 Dec 2025 | $m | $m | $m | $m | $m | $m |
UK | 465,228 | 598 | 571 | 513 | 680 | 1,119 |
US | 208,425 | 210 | 194 | 166 | 264 | 563 |
Hong Kong | 472,454 | 439 | 401 | 305 | 570 | 1,143 |
Mainland China | 133,814 | 188 | 176 | 137 | 256 | 397 |
Mexico | 38,076 | 62 | 58 | 47 | 76 | 202 |
UAE | 62,827 | 52 | 51 | 47 | 56 | 82 |
France | 196,137 | 121 | 117 | 103 | 139 | 188 |
Other geographies5 | 487,987 | 234 | 208 | 158 | 358 | 790 |
Total | 2,064,949 | 1,905 | 1,778 | 1,477 | 2,399 | 4,485 |
of which: | ||||||
Stage 1 | 1,940,746 | 690 | 638 | 522 | 830 | 971 |
Stage 2 | 124,203 | 1,214 | 1,139 | 955 | 1,569 | 3,514 |
By geography at 31 Dec 2024 | ||||||
UK | 432,160 | 717 | 667 | 526 | 850 | 2,389 |
US | 202,888 | 216 | 201 | 205 | 247 | 461 |
Hong Kong | 450,966 | 659 | 616 | 465 | 906 | 1,496 |
Mainland China | 137,960 | 178 | 141 | 84 | 329 | 886 |
Mexico | 34,713 | 69 | 61 | 46 | 86 | 302 |
UAE | 58,909 | 51 | 49 | 40 | 58 | 120 |
France | 184,591 | 82 | 80 | 69 | 97 | 125 |
Other geographies5,6 | 455,823 | 234 | 216 | 176 | 304 | 774 |
Total | 1,958,010 | 2,205 | 2,031 | 1,612 | 2,877 | 6,555 |
of which: | ||||||
Stage 1 | 1,830,264 | 689 | 632 | 494 | 797 | 803 |
Stage 2 | 127,746 | 1,516 | 1,399 | 1,118 | 2,080 | 5,751 |
1Allowance for ECL sensitivity includes off-balance sheet financial instruments. These are subject to significant measurement uncertainty.
2Includes low credit-risk financial instruments such as debt instruments at FVOCI, which have high carrying amounts but low ECL under all the above scenarios.
3Excludes defaulted obligors. For a detailed breakdown of performing and non-performing wholesale portfolio exposures, see page 169.
4Staging refers only to probability-weighted/reported gross carrying amount. Stage allocation of gross exposures varies by scenario, with higher allocation to
stage 2 under the Downside 2 scenario.
5Includes small portfolios that use less complex modelling approaches and are not sensitive to macroeconomic changes.
6Includes the Argentina and Armenia businesses, which were sold in 2024.
At 31 December 2025, the highest level of 100% scenario-weighted
allowance for ECL was observed in the UK and Hong Kong under the
Downside 2 scenario, driven primarily by a larger exposure to those
geographies, namely in the real estate sector. In relation to the
underlying exposure, mainland China and Mexico have the higher
Downside 2 ECL coverage, mostly due to the relatively larger
proportion of higher risk exposures in those geographies.
Compared with 31 December 2024, the ECL impact on all consensus
scenarios has decreased due to the effects of enhanced credit risk
models and updates to our forward economic scenarios.
In the wholesale portfolio, off-balance sheet financial instruments have
a lower likelihood to be fully converted to a funded exposure at the
point of default, and consequently the sensitivity of the allowance for
ECL is lower in relation to its nominal amount, when compared with an
on-balance sheet exposure with a similar risk profile.
IFRS 9 ECL sensitivity to future economic conditions1 | ||||||||||||
At 31 Dec 2025 | At 31 Dec 2024 | |||||||||||
Reported gross carrying amount | Reported allowance for ECL | Consensus Central scenario allowance for ECL | Consensus Upside scenario allowance for ECL | Consensus Downside scenario allowance for ECL | Downside 2 scenario allowance for ECL | Reported gross carrying amount | Reported allowance for ECL | Consensus Central scenario allowance for ECL | Consensus Upside scenario allowance for ECL | Consensus Downside scenario allowance for ECL | Downside 2 scenario allowance for ECL | |
By geography | $m | $m | $m | $m | $m | $m | $m | $m | $m | $m | $m | $m |
UK | ||||||||||||
Mortgages | 183,128 | 132 | 124 | 117 | 138 | 274 | 163,541 | 126 | 117 | 107 | 132 | 288 |
Credit cards | 8,317 | 356 | 354 | 338 | 355 | 419 | 7,415 | 280 | 275 | 265 | 276 | 447 |
Other | 9,513 | 265 | 261 | 238 | 276 | 370 | 8,249 | 241 | 233 | 217 | 243 | 351 |
Mexico | ||||||||||||
Mortgages | 8,430 | 190 | 188 | 180 | 193 | 237 | 7,482 | 165 | 162 | 155 | 168 | 215 |
Credit cards | 2,322 | 407 | 403 | 398 | 409 | 514 | 2,227 | 337 | 333 | 330 | 338 | 423 |
Other | 3,727 | 437 | 437 | 435 | 442 | 589 | 3,722 | 419 | 416 | 413 | 422 | 593 |
Hong Kong | ||||||||||||
Mortgages | 106,736 | 5 | 4 | 3 | 6 | 13 | 106,866 | 5 | 5 | 4 | 5 | 10 |
Credit cards | 9,739 | 313 | 306 | 300 | 324 | 496 | 9,419 | 293 | 275 | 268 | 300 | 770 |
Other | 6,085 | 146 | 137 | 136 | 144 | 173 | 6,210 | 106 | 102 | 101 | 105 | 249 |
UAE | ||||||||||||
Mortgages | 2,306 | 6 | 6 | 6 | 6 | 7 | 1,993 | 8 | 8 | 8 | 8 | 8 |
Credit cards | 591 | 39 | 39 | 38 | 40 | 46 | 536 | 31 | 31 | 31 | 31 | 35 |
Other | 620 | 12 | 11 | 11 | 12 | 13 | 688 | 17 | 17 | 17 | 17 | 19 |
US | ||||||||||||
Mortgages | 17,797 | 4 | 4 | 4 | 5 | 8 | 16,965 | 6 | 6 | 6 | 6 | 8 |
Credit cards | 187 | 14 | 14 | 14 | 14 | 16 | 193 | 15 | 14 | 14 | 15 | 17 |
Other geographies | ||||||||||||
Mortgages | 56,067 | 109 | 106 | 102 | 114 | 175 | 51,064 | 131 | 127 | 124 | 136 | 180 |
Credit cards | 3,834 | 175 | 174 | 173 | 179 | 202 | 3,500 | 162 | 159 | 156 | 164 | 223 |
Other | 2,313 | 78 | 78 | 77 | 78 | 85 | 2,292 | 72 | 72 | 69 | 73 | 93 |
Total | 421,712 | 2,688 | 2,646 | 2,570 | 2,735 | 3,637 | 392,361 | 2,413 | 2,351 | 2,285 | 2,440 | 3,928 |
of which: mortgages | 374,464 | 446 | 432 | 412 | 462 | 714 | 347,910 | 440 | 425 | 405 | 456 | 708 |
Stage 1 | 353,960 | 54 | 53 | 50 | 61 | 161 | 311,875 | 51 | 47 | 43 | 58 | 129 |
Stage 2 | 18,056 | 106 | 97 | 88 | 108 | 216 | 33,761 | 126 | 117 | 107 | 129 | 275 |
Stage 3 | 2,448 | 286 | 282 | 274 | 293 | 337 | 2,274 | 263 | 261 | 255 | 269 | 304 |
of which: credit cards | 24,990 | 1,304 | 1,290 | 1,261 | 1,321 | 1,693 | 23,290 | 1,116 | 1,086 | 1,064 | 1,124 | 1,915 |
Stage 1 | 21,258 | 353 | 347 | 335 | 366 | 553 | 19,915 | 276 | 267 | 258 | 284 | 701 |
Stage 2 | 3,450 | 731 | 723 | 706 | 735 | 913 | 3,107 | 655 | 634 | 621 | 656 | 1,027 |
Stage 3 | 282 | 220 | 220 | 220 | 220 | 227 | 267 | 185 | 185 | 185 | 185 | 188 |
of which: others | 22,258 | 938 | 924 | 897 | 952 | 1,230 | 21,161 | 856 | 839 | 816 | 860 | 1,305 |
Stage 1 | 19,494 | 253 | 249 | 233 | 265 | 444 | 18,574 | 216 | 204 | 193 | 217 | 532 |
Stage 2 | 2,177 | 403 | 393 | 382 | 405 | 494 | 2,005 | 360 | 355 | 343 | 363 | 483 |
Stage 3 | 587 | 282 | 282 | 282 | 282 | 292 | 583 | 279 | 279 | 279 | 279 | 290 |
1Allowance for ECL sensitivities exclude portfolios utilising less complex modelling approaches.
Group ECL sensitivity resultsThe allowance for ECL of the scenarios and management judgemental
adjustments is highly sensitive to movements in economic forecasts.
Based upon the sensitivity tables presented above, if the Group
allowance for ECL balance was estimated solely on the basis of the
Central scenario, Downside scenario or the Downside 2 scenario at
31 December 2025, it would increase/(decrease) as presented in the
below table.
Total Group ECL at 31 December 2025 | ||||
At 31 December 2025 | At 31 December 2024 | |||
Retail1 | Wholesale1 | Retail1 | Wholesale1 | |
$bn | $bn | $bn | $bn | |
Reported allowance for ECL | 2.7 | 1.9 | 2.4 | 2.2 |
Scenarios | ||||
100% Consensus Central scenario | (0.0) | 0.0 | (0.1) | (0.2) |
100% Consensus Upside scenario | (0.1) | (0.3) | (0.1) | (0.6) |
100% Consensus Downside scenario | 0.0 | 0.6 | 0.0 | 0.7 |
100% Downside 2 scenario | 0.9 | 2.7 | 1.5 | 4.3 |
1On the same basis as retail and wholesale sensitivity analysis.
At 31 December 2025, the Group allowance for ECL increased in the retail portfolio by $0.3bn and decreased by $0.3bn in the wholesale portfolio,
compared with 31 December 2024.
Compared with 31 December 2024, both the retail and wholesale portfolio Group ECL sensitivity across all consensus scenarios decreased due
to an improving economic outlook. For the retail portfolios the ECL sensitivity decrease across the Downside 2 scenario was primarily due to
improvements in Hong Kong and UK unsecured portfolios. For the wholesale portfolios, the decrease was largely driven by crystallisation of
defaults in certain sectors and an improving economic outlook.
Reconciliation from reported exposure and ECL to sensitised exposure and weighted ECL | ||||||
Wholesale | Retail | Total | ||||
Gross carrying/ nominal amount | Allowance for ECL | Gross carrying/ nominal amount | Allowance for ECL | Gross carrying/ nominal amount | Allowance for ECL | |
$m | $m | $m | $m | $m | $m | |
Included in sensitivity analysis | 2,064,949 | (1,905) | 421,712 | (2,688) | 2,486,661 | (4,593) |
– Exclusions from sensitivity as described in the section above1 | 21,336 | (6,394) | 330,144 | (147) | 351,480 | (6,541) |
– Debt instruments measured at fair value through other comprehensive income2 | (383,568) | 30 | — | — | (383,568) | 30 |
– Performance guarantees2 | (102,684) | 269 | — | — | (102,684) | 269 |
(539,467) | 102 | (616) | 9 | (540,083) | 111 | |
– Other3 | 6,757 | (342) | (2,735) | 1 | 4,022 | (341) |
As reported in the Summary of credit risk (excluding debt instruments measured at FVOCI) by stage distribution and ECL coverage by industry sector at 31 Dec 2025 | 1,067,323 | (8,240) | 748,505 | (2,825) | 1,815,828 | (11,065) |
Other financial assets at amortised cost | 890,326 | (129) | ||||
Total reported in the Summary of credit risk (excluding debt instruments measured at FVOCI) by stage distribution and ECL coverage by industry sector at 31 Dec 2025 | 2,706,154 | (11,194) | ||||
Included in sensitivity analysis | 1,958,010 | (2,205) | 392,361 | (2,413) | 2,350,371 | (4,618) |
– Exclusions from sensitivity as described in the section above1 | 20,409 | (5,419) | 309,178 | (124) | 329,587 | (5,543) |
– Debt instruments measured at fair value through other comprehensive income2 | (346,124) | 54 | — | — | (346,124) | 54 |
– Performance guarantees2 | (92,722) | 311 | — | — | (92,722) | 311 |
(568,668) | 141 | (130) | — | (568,798) | 141 | |
– Other3 | 5,978 | (441) | 498 | (9) | 6,476 | (450) |
As reported in the Summary of credit risk (excluding debt instruments measured at FVOCI) by stage distribution and ECL coverage by industry sector at 31 Dec 2024 | 976,883 | (7,559) | 701,907 | (2,546) | 1,678,790 | (10,105) |
Other financial assets at amortised cost | 828,580 | (92) | ||||
Total reported in the Summary of credit risk (excluding debt instruments measured at FVOCI) by stage distribution and ECL coverage by industry sector at 31 Dec 2024 | 2,507,370 | (10,197) |
1Comprises wholesale defaulted obligors, retail portfolios utilising less complex modelling approaches, private banking and insurance.
2The sensitivity analysis includes certain items reported in ‘Other assets at amortised cost’, which are not allocated to an industry in the credit tables. It also
includes debt instruments measured at FVOCI and performance guarantees, which are presented separately in the credit tables.
3Includes FX and other operational variances.
Reconciliations of changes in gross carrying/nominal amount and allowances The following disclosure provides a reconciliation by stage of the
Group’s gross carrying/nominal amount and allowances for loans and
advances to banks and customers, including loan commitments and
financial guarantees.
In addition, a reconciliation by stage of the Group’s gross carrying
amount and allowances for loans and advances to banks and
customers and a reconciliation by stage of the Group’s nominal amount
and allowances for loan commitments and financial guarantees, were
included in this section following adoption of the recommendations of
the third report from The Taskforce on Disclosures about Expected
Credit Losses (‘DECL’).
Movements are calculated on a quarterly basis and therefore fully
capture stage movements between quarters. If movements were
calculated on a year-to-date basis they would only reflect the opening
and closing position of the financial instrument.
The transfers of financial instruments represents the impact of stage
transfers upon the gross carrying/nominal amount and associated
allowance for ECL.
The net remeasurement of ECL arising from transfer of stage
represents the increase or decrease due to these transfers, for
example, moving from a 12-month (stage 1) to a lifetime (stage 2) ECL
measurement basis. Net remeasurement excludes the underlying
CRR/PD movements of the financial instruments transferring stage.
This is captured, along with other credit quality movements in the
‘changes to risk parameters – credit quality’ line item.
Changes in ‘Net new and further lending/repayments’ represents the
impact from volume movements within the Group’s lending portfolio
and includes new financial assets originated or purchased, further
lending and repayments (including final repayments).
Reconciliation of changes in gross carrying/nominal amount and allowances for loans and advances to banks and customers including loan commitments and financial guarantees | ||||||||||
(Audited) | ||||||||||
Non-credit impaired | Credit impaired | |||||||||
Stage 1 | Stage 2 | Stage 3 | POCI | Total | ||||||
Gross carrying/ nominal amount | Allowance for ECL | Gross carrying/ nominal amount | Allowance for ECL | Gross carrying/ nominal amount | Allowance for ECL | Gross carrying/ nominal amount | Allowance for ECL | Gross carrying/ nominal amount | Allowance for ECL | |
$m | $m | $m | $m | $m | $m | $m | $m | $m | $m | |
At 1 Jan 2025 | 1,489,687 | (1,232) | 115,898 | (2,674) | 23,823 | (6,148) | 93 | (51) | 1,629,501 | (10,105) |
Transfers of financial instruments: | (28,196) | (931) | 18,327 | 2,101 | 9,869 | (1,170) | — | — | — | — |
–transfers from stage 1 to stage 2 | (134,309) | 368 | 134,309 | (368) | — | — | — | — | — | — |
–transfers from stage 2 to stage 1 | 107,223 | (1,233) | (107,223) | 1,233 | — | — | — | — | — | — |
– transfers to stage 3 | (1,873) | 15 | (10,260) | 1,434 | 12,133 | (1,449) | — | — | — | — |
– transfers from stage 3 | 763 | (81) | 1,501 | (198) | (2,264) | 279 | — | — | — | — |
Net remeasurement of ECL arising from transfer of stage | — | 664 | — | (604) | — | (58) | — | — | — | 2 |
Changes due to modifications not derecognised | — | — | — | — | — | — | — | — | — | — |
Net new and further lending/repayments | 107,733 | (178) | (35,843) | 614 | (6,060) | 768 | 238 | 2 | 66,068 | 1,206 |
Changes to risk parameters – credit quality | — | 390 | — | (1,991) | — | (3,737) | — | (24) | — | (5,362) |
Changes to models used for ECL calculation | — | (59) | — | 272 | — | (16) | — | — | — | 197 |
Assets written off | — | — | — | — | (3,569) | 3,569 | — | — | (3,569) | 3,569 |
Credit-related modifications that resulted in derecognition | — | — | — | — | (88) | 9 | — | — | (88) | 9 |
Foreign exchange and others1,2 | 42,772 | (16) | 4,507 | (152) | 1,259 | (410) | 6 | (3) | 48,544 | (581) |
At 31 Dec 2025 | 1,611,996 | (1,362) | 102,889 | (2,434) | 25,234 | (7,193) | 337 | (76) | 1,740,456 | (11,065) |
ECL income statement change for the period | 817 | (1,709) | (3,043) | (22) | (3,957) | |||||
Recoveries | 320 | |||||||||
Others | (248) | |||||||||
Total ECL income statement change for the period | (3,885) | |||||||||
1Total includes $6.0bn of gross carrying loans and advances to customers and banks, which were classified to assets held for sale, and a corresponding
allowance for ECL of $27m, including business disposals as disclosed in Note 23 ‘Assets held for sale and liabilities of disposal groups held for sale’ on page
355.
2This includes $7.2bn of gross carrying loans and advances to customers and corresponding allowance for ECL of $7m in relation to disposal of our retained
home and other retail loans in France as disclosed in Note 23 on page 355.
Reconciliation of changes in gross carrying/nominal amount and allowances for loans and advances to banks and customers including loan commitments and financial guarantees (continued) | |||
(Audited) | |||
At 31 Dec 2025 | 12 months ended 31 Dec 2025 | ||
Gross carrying/ nominal amount | Allowance for ECL | ECL charge | |
$m | $m | $m | |
As above | 1,740,456 | (11,065) | (3,885) |
Other financial assets measured at amortised cost | 890,326 | (129) | (29) |
Non-trading reverse purchase agreement commitments | 75,372 | — | — |
Performance and other guarantees not considered for IFRS 9 | — | — | 46 |
Summary of financial instruments to which the impairment requirements in IFRS 9 are applied/Summary consolidated income statement | 2,706,154 | (11,194) | (3,868) |
Debt instruments measured at FVOCI | 383,568 | (30) | 18 |
Total allowance for ECL/total income statement ECL change for the period | n/a | (11,224) | (3,850) |
Credit quality of financial instruments
(Audited)
We assess the credit quality of all financial instruments that are subject to credit risk. The credit quality of financial instruments is a point-in-time
assessment of PD, whereas stages 1 and 2 are determined based on relative deterioration of credit quality since initial recognition for the majority
of portfolios. Accordingly, for non-credit-impaired financial instruments, there is no direct relationship between the credit quality assessment and
stages 1 and 2, although typically the lower credit quality bands exhibit a higher proportion in stage 2. The five credit quality classifications provided
below each encompass a range of granular internal credit rating grades assigned to wholesale and personal lending businesses and the external
ratings attributed by external agencies to debt securities, as shown in the table on page 172.
Distribution of financial instruments by credit quality | ||||||||||||||||
(Audited) | ||||||||||||||||
At 31 Dec 2025 | At 31 Dec 2024 | |||||||||||||||
Gross carrying/notional amount | Allowance for ECL/ other credit provisions | Net | Gross carrying/notional amount | Allowance for ECL/ other credit provisions | Net | |||||||||||
Strong | Good | Satisfactory | Sub- standard | Credit impaired | Total | Strong | Good | Satisfactory | Sub- standard | Credit impaired | Total | |||||
$m | $m | $m | $m | $m | $m | $m | $m | $m | $m | $m | $m | $m | $m | $m | $m | |
In-scope for IFRS 9 ECL | ||||||||||||||||
Loans and advances to customers held at amortised cost | 545,487 | 215,781 | 191,839 | 21,455 | 24,529 | 999,091 | (10,692) | 988,399 | 515,266 | 193,080 | 186,416 | 22,906 | 22,705 | 940,373 | (9,715) | 930,658 |
– personal | 380,030 | 57,064 | 30,688 | 2,801 | 3,945 | 474,528 | (2,797) | 471,731 | 360,317 | 53,595 | 27,774 | 1,979 | 3,560 | 447,225 | (2,524) | 444,701 |
– corporate and commercial | 113,787 | 132,972 | 139,599 | 18,041 | 20,106 | 424,505 | (7,526) | 416,979 | 114,504 | 118,785 | 138,705 | 20,224 | 18,466 | 410,684 | (6,755) | 403,929 |
– non-bank financial institutions | 51,670 | 25,745 | 21,552 | 613 | 478 | 100,058 | (369) | 99,689 | 40,445 | 20,700 | 19,937 | 703 | 679 | 82,464 | (436) | 82,028 |
Loans and advances to banks held at amortised cost | 97,524 | 6,222 | 4,613 | 109 | 1 | 108,469 | (7) | 108,462 | 92,621 | 4,255 | 5,040 | 134 | 2 | 102,052 | (13) | 102,039 |
Cash and balances at central banks | 242,187 | 590 | 82 | — | — | 242,859 | — | 242,859 | 266,713 | 949 | 12 | — | — | 267,674 | — | 267,674 |
Hong Kong Government certificates of indebtedness | 44,063 | — | — | — | — | 44,063 | — | 44,063 | 42,293 | — | — | — | — | 42,293 | — | 42,293 |
Reverse repurchase agreements – non- trading | 193,352 | 78,296 | 26,740 | 4 | — | 298,392 | — | 298,392 | 155,831 | 70,877 | 25,799 | 42 | — | 252,549 | — | 252,549 |
Financial investments | 171,057 | 654 | 10,390 | — | — | 182,101 | (12) | 182,089 | 146,970 | 3,681 | 3,331 | — | — | 153,982 | (9) | 153,973 |
Assets held for sale | 449 | 2,751 | 864 | — | 51 | 4,115 | (27) | 4,088 | 2,425 | 458 | 367 | 1 | 22 | 3,273 | (4) | 3,269 |
Other assets | 95,589 | 11,950 | 10,789 | 335 | 133 | 118,796 | (90) | 118,706 | 88,338 | 9,735 | 10,151 | 454 | 131 | 108,809 | (79) | 108,730 |
– endorsements and acceptances | 1,504 | 3,331 | 3,624 | 236 | 11 | 8,706 | (11) | 8,695 | 2,101 | 2,663 | 3,090 | 243 | 10 | 8,107 | (14) | 8,093 |
– accrued income and other | 94,085 | 8,619 | 7,165 | 99 | 122 | 110,090 | (79) | 110,011 | 86,237 | 7,072 | 7,061 | 211 | 121 | 100,702 | (65) | 100,637 |
Debt instruments measured at FVOCI1 | 375,950 | 2,592 | 7,572 | 286 | — | 386,400 | (30) | 386,370 | 336,313 | 9,448 | 7,768 | 380 | — | 353,909 | (54) | 353,855 |
Out-of-scope for IFRS 9 ECL | ||||||||||||||||
Trading assets | 143,943 | 22,187 | 22,943 | 603 | 165 | 189,841 | — | 189,841 | 119,546 | 21,951 | 15,804 | 2,300 | 47 | 159,648 | — | 159,648 |
Other financial assets designated and otherwise mandatorily measured at fair value through profit or loss | 61,509 | 13,037 | 5,014 | 351 | 19 | 79,930 | — | 79,930 | 53,282 | 11,862 | 4,390 | 231 | 11 | 69,776 | — | 69,776 |
Derivatives | 194,320 | 33,752 | 9,382 | 283 | 3 | 237,740 | — | 237,740 | 224,870 | 34,124 | 9,373 | 258 | 12 | 268,637 | — | 268,637 |
Assets held for sale | 10 | 103 | — | — | 148 | 261 | — | 261 | 3,019 | — | — | — | — | 3,019 | — | 3,019 |
Total gross carrying amount on balance sheet | 2,165,440 | 387,915 | 290,228 | 23,426 | 25,049 | 2,892,058 | (10,858) | 2,881,200 | 2,047,487 | 360,420 | 268,451 | 26,706 | 22,930 | 2,725,994 | (9,874) | 2,716,120 |
Percentage of total credit quality (%) | 74.9 | 13.4 | 10.0 | 0.8 | 0.9 | 100 | 75.1 | 13.2 | 9.9 | 1.0 | 0.8 | 100 | ||||
Loan and other credit-related commitments | 441,740 | 146,923 | 91,400 | 10,073 | 656 | 690,792 | (315) | 690,477 | 400,120 | 131,396 | 77,220 | 9,670 | 961 | 619,367 | (348) | 619,019 |
Financial guarantees | 7,436 | 4,145 | 5,144 | 559 | 192 | 17,476 | (51) | 17,425 | 7,365 | 4,263 | 4,399 | 723 | 248 | 16,998 | (29) | 16,969 |
In-scope for IFRS 9 ECL | 449,176 | 151,068 | 96,544 | 10,632 | 848 | 708,268 | (366) | 707,902 | 407,485 | 135,659 | 81,619 | 10,393 | 1,209 | 636,365 | (377) | 635,988 |
Loan and other credit-related commitments | 105,985 | 81,431 | 67,475 | 2,702 | 252 | 257,845 | — | 257,845 | 96,952 | 76,340 | 65,619 | 2,847 | 453 | 242,211 | — | 242,211 |
Performance and other guarantees | 47,441 | 33,190 | 19,857 | 1,351 | 845 | 102,684 | (269) | 102,415 | 39,940 | 32,956 | 17,339 | 1,671 | 817 | 92,723 | (312) | 92,411 |
Out-of-scope for IFRS 9 ECL | 153,426 | 114,621 | 87,332 | 4,053 | 1,097 | 360,529 | (269) | 360,260 | 136,892 | 109,296 | 82,958 | 4,518 | 1,270 | 334,934 | (312) | 334,622 |
1For the purposes of this disclosure, gross carrying amount is defined as the amortised cost of a financial asset before adjusting for any loss allowance. As such, the gross carrying amount of debt instruments at FVOCI as presented above
will not reconcile to the balance sheet as it excludes fair value gains and losses.
Distribution of financial instruments to which the impairment requirements in IFRS 9 are applied, by credit quality and stage allocation | ||||||||||||||||
(Audited) | ||||||||||||||||
At 31 Dec 2025 | At 31 Dec 2024 | |||||||||||||||
Gross carrying/notional amount | Allowance for ECL | Net | Gross carrying/notional amount | Allowance for ECL | Net | |||||||||||
Strong | Good | Satisfactory | Sub- standard | Credit impaired | Total | Strong | Good | Satisfactory | Sub- standard | Credit impaired | Total | |||||
$m | $m | $m | $m | $m | $m | $m | $m | $m | $m | $m | $m | $m | $m | $m | $m | |
Loans and advances to customers at amortised cost | 545,487 | 215,781 | 191,839 | 21,455 | 24,529 | 999,091 | (10,692) | 988,399 | 515,266 | 193,080 | 186,416 | 22,906 | 22,705 | 940,373 | (9,715) | 930,658 |
– stage 1 | 540,253 | 194,680 | 152,578 | 5,922 | — | 893,433 | (1,201) | 892,232 | 498,415 | 170,420 | 150,818 | 4,767 | — | 824,420 | (1,078) | 823,342 |
– stage 2 | 5,234 | 21,101 | 39,068 | 15,533 | — | 80,936 | (2,318) | 78,618 | 16,851 | 22,660 | 35,598 | 18,139 | — | 93,248 | (2,546) | 90,702 |
– stage 3 | — | — | — | — | 24,389 | 24,389 | (7,097) | 17,292 | — | — | — | — | 22,615 | 22,615 | (6,040) | 16,575 |
– POCI | — | — | 193 | — | 140 | 333 | (76) | 257 | — | — | — | — | 90 | 90 | (51) | 39 |
97,524 | 6,222 | 4,613 | 109 | 1 | 108,469 | (7) | 108,462 | 92,621 | 4,255 | 5,040 | 134 | 2 | 102,052 | (13) | 102,039 | |
– stage 1 | 97,426 | 6,215 | 4,608 | 87 | — | 108,336 | (4) | 108,332 | 92,528 | 4,226 | 4,981 | 117 | — | 101,852 | (9) | 101,843 |
– stage 2 | 98 | 7 | 5 | 22 | — | 132 | (2) | 130 | 93 | 29 | 59 | 17 | — | 198 | (2) | 196 |
– stage 3 | — | — | — | — | 1 | 1 | (1) | — | — | — | — | — | 2 | 2 | (2) | — |
– POCI | — | — | — | — | — | — | — | — | — | — | — | — | — | — | — | — |
Other financial assets measured at amortised cost | 746,697 | 94,241 | 48,865 | 339 | 184 | 890,326 | (129) | 890,197 | 702,570 | 85,700 | 39,660 | 497 | 153 | 828,580 | (92) | 828,488 |
– stage 1 | 746,536 | 93,759 | 48,121 | 75 | — | 888,491 | (76) | 888,415 | 702,373 | 85,032 | 38,977 | 239 | — | 826,621 | (64) | 826,557 |
– stage 2 | 161 | 482 | 744 | 264 | — | 1,651 | (11) | 1,640 | 197 | 668 | 683 | 258 | — | 1,806 | (5) | 1,801 |
– stage 3 | — | — | — | — | 184 | 184 | (42) | 142 | — | — | — | — | 153 | 153 | (23) | 130 |
– POCI | — | — | — | — | — | — | — | — | — | — | — | — | — | — | — | — |
Loan and other credit-related commitments | 441,740 | 146,923 | 91,400 | 10,073 | 656 | 690,792 | (315) | 690,477 | 400,120 | 131,396 | 77,220 | 9,670 | 961 | 619,367 | (348) | 619,019 |
– stage 1 | 437,973 | 143,849 | 82,145 | 5,681 | — | 669,648 | (149) | 669,499 | 398,779 | 125,956 | 67,949 | 4,547 | — | 597,231 | (137) | 597,094 |
– stage 2 | 3,767 | 3,074 | 9,255 | 4,392 | — | 20,488 | (97) | 20,391 | 1,341 | 5,440 | 9,271 | 5,123 | — | 21,175 | (121) | 21,054 |
– stage 3 | — | — | — | — | 652 | 652 | (69) | 583 | — | — | — | — | 958 | 958 | (90) | 868 |
– POCI | — | — | — | — | 4 | 4 | — | 4 | — | — | — | — | 3 | 3 | — | 3 |
Financial guarantees | 7,436 | 4,145 | 5,144 | 559 | 192 | 17,476 | (51) | 17,425 | 7,365 | 4,263 | 4,399 | 723 | 248 | 16,998 | (29) | 16,969 |
– stage 1 | 7,430 | 4,040 | 4,351 | 92 | — | 15,913 | (8) | 15,905 | 7,352 | 4,192 | 3,625 | 184 | — | 15,353 | (8) | 15,345 |
– stage 2 | 6 | 105 | 793 | 467 | — | 1,371 | (17) | 1,354 | 13 | 71 | 774 | 539 | — | 1,397 | (5) | 1,392 |
– stage 3 | — | — | — | — | 192 | 192 | (26) | 166 | — | — | — | — | 248 | 248 | (16) | 232 |
– POCI | — | — | — | — | — | — | — | — | — | — | — | — | — | — | — | — |
Total | 1,838,884 | 467,312 | 341,861 | 32,535 | 25,562 | 2,706,154 | (11,194) | 2,694,960 | 1,717,942 | 418,694 | 312,735 | 33,930 | 24,069 | 2,507,370 | (10,197) | 2,497,173 |
Debt instruments at FVOCI1 | ||||||||||||||||
– stage 1 | 375,894 | 2,592 | 7,015 | 3 | — | 385,504 | (28) | 385,476 | 336,264 | 9,448 | 7,290 | — | — | 353,002 | (31) | 352,971 |
– stage 2 | 56 | — | 557 | 283 | — | 896 | (2) | 894 | 49 | — | 478 | 380 | — | 907 | (23) | 884 |
– stage 3 | — | — | — | — | — | — | — | — | — | — | — | — | — | — | — | — |
– POCI | — | — | — | — | — | — | — | — | — | — | — | — | — | — | — | — |
Total | 375,950 | 2,592 | 7,572 | 286 | — | 386,400 | (30) | 386,370 | 336,313 | 9,448 | 7,768 | 380 | — | 353,909 | (54) | 353,855 |
1For the purposes of this disclosure, gross carrying amount is defined as the amortised cost of a financial asset before adjusting for any loss allowance. As such, the gross carrying amount of debt instruments at FVOCI as presented above
will not reconcile to the balance sheet as it excludes fair value gains and losses.
Credit-impaired loans(Audited)
We determine that a financial instrument is credit impaired and in stage
3 by considering relevant objective evidence, primarily whether:
–contractual payments of either principal or interest are past due for
more than 90 days;
–there are other indications that the borrower is unlikely to pay, such
as when a concession has been granted to the borrower for
economic or legal reasons relating to the borrower’s financial
condition; and
–the loan is otherwise considered to be in default. If such unlikeliness
to pay is not identified at an earlier stage, it is deemed to occur
when an exposure is 90 days past due. Therefore, the definitions of
credit impaired and default are aligned as far as possible so that
stage 3 represents all loans that are considered defaulted or
otherwise credit impaired.
Collateral and other credit enhancements(Audited)
Although collateral can be an important mitigant of credit risk, it is the
Group’s practice to typically lend on the basis of the customer’s ability
to meet their obligations out of cash flow resources rather than placing
primary reliance on collateral and other credit risk enhancements.
Depending on the customer’s standing and the type of product,
facilities may be provided without any collateral or other credit
enhancements. For other lending, a charge over collateral is obtained
and considered in determining the credit decision and pricing. In the
event of default, the Group may utilise the collateral as a source of
repayment.
Depending on its form, collateral can have a significant financial effect
in mitigating our exposure to credit risk. Where there is sufficient
collateral, an expected credit loss is not recognised. This is the case for
reverse repurchase agreements and for certain loans and advances to
customers where the loan to value (‘LTV’) is very low.
Mitigants may include a charge on borrowers’ specific assets, such as
real estate or financial instruments. Other credit risk mitigants include
short positions in securities and financial assets held as part of linked
insurance/investment contracts where the risk is predominantly borne
by the policyholder. Additionally, risk may be managed by employing
other types of collateral and credit risk enhancements, such as second
charges, other liens and unsupported guarantees. Guarantees are
normally taken from corporates and export credit agencies. Corporates
would normally provide guarantees as part of a parent/subsidiary
relationship and span a number of credit grades. The export credit
agencies will normally be investment grade.
Certain credit mitigants are used strategically in portfolio management
activities. Across Corporate and Institutional Banking, risk limits and
utilisations, maturity profiles and risk quality are monitored and
managed proactively. This process is key to the setting of risk appetite
for these larger, more complex, geographically distributed customer
groups. While the principal form of risk management continues to be at
the point of exposure origination, through the lending decision-making
process, Corporate and Institutional Banking also utilises loan sales and
credit default swap (‘CDS’) hedges to manage concentrations and
reduce risk.
These transactions are the responsibility of a dedicated Corporate and
Institutional Banking portfolio management team. Hedging activity is
carried out within agreed credit parameters, and is subject to market
risk limits and a robust governance structure. Where applicable, CDSs
are entered into directly with a central clearing house counterparty.
Otherwise, the Group’s exposure to CDS protection providers is
diversified among mainly banking counterparties with strong credit
ratings.
CDS mitigants are held at portfolio level and are not included in the
expected credit loss calculations. CDS mitigants are not reported in the
following tables.
Collateral on loans and advances
Collateral held is analysed separately for CRE and for other corporate,
commercial and financial (non-bank) lending. The following tables
include off-balance sheet loan commitments, primarily undrawn credit
lines.
The collateral measured in the following tables consists of fixed first
charges on real estate, and charges over cash and marketable financial
instruments. The values in the tables represent the expected market
value on an open market basis, actual values realised are a function of
market conditions. No adjustment has been made to the collateral for
any expected costs of recovery. Marketable securities are measured at
their fair value.
Other types of collateral, such as unsupported guarantees and floating
charges over the assets of a customer’s business, are not measured in
the following tables. While such mitigants have value, often providing
rights in insolvency, their assignable value is not sufficiently certain and
they are therefore assigned no value for disclosure purposes.
The LTV ratios presented are calculated by directly associating loans
and advances with the collateral that individually and uniquely supports
each facility. When collateral assets are shared by multiple loans and
advances, whether specifically or, more generally, by way of an all
monies charge, the collateral value is pro-rated across the loans and
advances protected by the collateral.
For credit-impaired loans, the collateral values cannot be directly
compared with impairment allowances recognised. The LTV figures use
open market values with no adjustments, actual values realised are a
function of market conditions. Impairment allowances are calculated on
a different basis, by considering other cash flows and adjusting
collateral values for costs of realising collateral as explained further on
page 305.
Mortgage loans
The following table provides a quantification of the value of fixed
charges we hold over specific assets where we have a history
of enforcing, and are able to enforce, collateral in satisfying a debt in
the event of the borrower failing to meet its contractual obligations, and
where the collateral is cash or can be realised by sale in an established
market. The collateral valuation excludes any adjustments for obtaining
and selling the collateral and, in particular, loans shown as not
collateralised or partially collateralised may also benefit from other
forms of credit mitigants.
The quality of both our Hong Kong and UK mortgage books remained
strong, with low levels of impairment allowances. The average LTV
ratio on new mortgage lending in Hong Kong was 70%, compared
with an estimated 60% for the overall mortgage portfolio. The
average LTV ratio on new lending in the UK was 69%, compared with
an estimated 55% for the overall mortgage portfolio.
Commercial real estate loans and advances
The value of CRE collateral is determined by using a combination of
external and internal valuations and physical inspections. For CRE,
where the facility exceeds regulatory threshold requirements, Group
policy requires an independent review of the valuation at least every
three years, or more frequently as the need arises.
In Hong Kong, unsecured lending is typically limited to major property
companies. In Europe, facilities of a working capital nature are generally
not secured by a first fixed charge, and are therefore disclosed as not
collateralised.
Other corporate, commercial and financial (non-bank) loans and
advances
Other corporate, commercial and financial (non-bank) loans are
analysed separately in the following table. For financing activities in
other corporate and commercial lending, collateral value is not strongly
correlated to principal repayment performance. Collateral values are
generally refreshed when an obligor’s general credit performance
deteriorates and we have to assess the likely performance of
secondary sources of repayment should it prove necessary to rely on
them.
Loans and advances to customers including loan commitments by level of collateral for key countries/territories (by stage) at 31 December 2025 | ||||||||||
(Audited) | ||||||||||
Gross carrying/nominal amount | ECL coverage | |||||||||
Stage 1 | Stage 2 | Stage 3 | POCI | Total | Stage 1 | Stage 2 | Stage 3 | POCI | Total | |
$m | $m | $m | $m | $m | % | % | % | % | % | |
Residential mortgages | ||||||||||
Fully collateralised by LTV ratio | 383,401 | 18,150 | 2,573 | 404,124 | — | 0.6 | 10.5 | 0.1 | ||
– less than 50% | 159,089 | 9,161 | 1,336 | 169,586 | — | 0.4 | 8.3 | 0.1 | ||
– 51% to 70% | 125,204 | 5,484 | 751 | 131,439 | — | 0.6 | 11.2 | 0.1 | ||
– 71% to 80% | 46,175 | 1,934 | 258 | 48,367 | — | 0.7 | 13.8 | 0.1 | ||
– 81% to 90% | 37,415 | 971 | 167 | 38,553 | — | 0.9 | 15.9 | 0.1 | ||
– 91% to 100% | 15,518 | 600 | 61 | 16,179 | — | 1.5 | 20.2 | 0.1 | ||
Partially collateralised (A): LTV > 100% | 4,924 | 138 | 97 | 5,159 | — | 2.2 | 44.3 | 0.9 | ||
– collateral value on A | 4,707 | 129 | 66 | 4,902 | ||||||
of which: UK | ||||||||||
Fully collateralised by LTV ratio | 190,214 | 13,257 | 816 | 204,287 | — | 0.3 | 9.7 | 0.1 | ||
– less than 50% | 77,859 | 7,260 | 421 | 85,540 | — | 0.1 | 8.2 | 0.1 | ||
– 51% to 70% | 61,605 | 4,183 | 254 | 66,042 | — | 0.3 | 8.7 | 0.1 | ||
– 71% to 80% | 25,237 | 1,226 | 85 | 26,548 | — | 0.5 | 14.0 | 0.1 | ||
– 81% to 90% | 22,218 | 548 | 46 | 22,812 | — | 0.7 | 16.1 | 0.1 | ||
– 91% to 100% | 3,295 | 40 | 10 | 3,345 | — | 1.0 | 27.0 | 0.1 | ||
Partially collateralised (B): LTV > 100% | 58 | 2 | 8 | 68 | — | 0.6 | 32.5 | 3.8 | ||
– collateral value on B | 29 | 1 | 7 | 37 | ||||||
of which: Hong Kong | ||||||||||
Fully collateralised by LTV ratio | 102,801 | 1,503 | 165 | 104,469 | — | — | 0.7 | — | ||
– less than 50% | 40,518 | 762 | 83 | 41,363 | — | — | 0.2 | — | ||
– 51% to 70% | 31,015 | 345 | 41 | 31,401 | — | — | 0.5 | — | ||
– 71% to 80% | 6,698 | 83 | 17 | 6,798 | — | 0.1 | 1.8 | — | ||
– 81% to 90% | 12,906 | 132 | 12 | 13,050 | — | 0.2 | 0.8 | — | ||
– 91% to 100% | 11,664 | 181 | 12 | 11,857 | — | 0.2 | 2.5 | — | ||
Partially collateralised (C): LTV > 100% | 4,781 | 87 | 18 | 4,886 | — | 0.2 | 8.3 | — | ||
– collateral value on C | 4,593 | 85 | 16 | 4,694 | ||||||
Commercial real estate | ||||||||||
Not collateralised | 36,879 | 3,792 | 1,310 | 6 | 41,987 | 0.1 | 2.7 | 64.6 | — | 2.3 |
Fully collateralised by LTV ratio | 26,814 | 16,633 | 6,942 | 13 | 50,402 | 0.1 | 1.7 | 13.3 | — | 2.4 |
– less than 50% | 13,415 | 10,682 | 2,563 | 13 | 26,673 | 0.1 | 1.4 | 11.0 | — | 1.7 |
– 51% to 75% | 9,168 | 4,770 | 2,755 | — | 16,693 | 0.2 | 2.2 | 13.5 | — | 2.9 |
– 76% to 90% | 2,232 | 915 | 1,055 | — | 4,202 | 0.1 | 1.9 | 13.6 | — | 3.9 |
– 91% to 100% | 1,999 | 266 | 569 | — | 2,834 | 0.1 | 2.3 | 21.6 | — | 4.6 |
Partially collateralised (A): LTV > 100% | 3,635 | 350 | 1,093 | 80 | 5,158 | 0.1 | 3.1 | 35.4 | 57.5 | 8.7 |
– collateral value on A | 2,317 | 240 | 780 | 33 | 3,370 | |||||
of which: UK | ||||||||||
Not collateralised | 8,633 | 389 | 56 | — | 9,078 | 0.2 | 8.2 | 19.6 | — | 0.7 |
Fully collateralised by LTV ratio | 12,426 | 1,661 | 354 | — | 14,441 | 0.2 | 2.6 | 21.8 | — | 1.0 |
– less than 50% | 4,606 | 430 | 36 | — | 5,072 | 0.2 | 1.4 | 38.9 | — | 0.6 |
– 51% to 75% | 5,772 | 914 | 209 | — | 6,895 | 0.2 | 3.8 | 24.9 | — | 1.4 |
– 76% to 90% | 1,511 | 308 | 107 | — | 1,926 | 0.1 | 1.0 | 9.3 | — | 0.7 |
– 91% to 100% | 537 | 9 | 2 | — | 548 | 0.2 | 5.1 | 61.2 | — | 0.4 |
Partially collateralised (B): LTV > 100% | 2,111 | 115 | 67 | 61 | 2,354 | 0.1 | 0.9 | 17.9 | 47.5 | 1.9 |
– collateral value on B | 1,381 | 109 | 42 | 30 | 1,562 | |||||
of which: Hong Kong | ||||||||||
Not collateralised | 14,360 | 2,691 | 1,088 | 6 | 18,145 | — | 2.4 | 66.5 | — | 4.4 |
Fully collateralised by LTV ratio | 5,588 | 12,969 | 5,467 | — | 24,024 | 0.1 | 0.8 | 10.6 | — | 2.9 |
– less than 50% | 4,008 | 9,705 | 2,284 | — | 15,997 | 0.1 | 0.9 | 8.2 | — | 1.8 |
– 51% to 75% | 1,167 | 2,927 | 2,033 | — | 6,127 | 0.2 | 0.5 | 10.9 | — | 3.9 |
– 76% to 90% | 59 | 294 | 705 | — | 1,058 | — | 1.7 | 8.4 | — | 6.0 |
– 91% to 100% | 354 | 43 | 445 | — | 842 | — | 2.3 | 25.2 | — | 13.4 |
Partially collateralised (C): LTV > 100% | 198 | 110 | 1,022 | 19 | 1,349 | — | 0.3 | 36.7 | 84.2 | 29.0 |
– collateral value on C | 149 | 11 | 734 | 3 | 897 | |||||
Not collateralised | 797,344 | 60,899 | 6,186 | 215 | 864,644 | 0.1 | 0.9 | 43.5 | 6.5 | 0.4 |
Fully collateralised by LTV ratio | 88,647 | 13,101 | 3,611 | 29 | 105,388 | 0.1 | 1.6 | 14.5 | 55.2 | 0.8 |
– less than 50% | 37,949 | 5,009 | 1,446 | — | 44,404 | 0.1 | 1.2 | 12.3 | — | 0.6 |
– 51% to 75% | 21,397 | 4,855 | 1,249 | 29 | 27,530 | 0.1 | 2.4 | 16.7 | 55.2 | 1.3 |
– 76% to 90% | 8,253 | 1,318 | 677 | — | 10,248 | 0.1 | 1.5 | 14.0 | — | 1.2 |
– 91% to 100% | 21,048 | 1,919 | 239 | — | 23,206 | — | 0.6 | 16.7 | — | 0.3 |
Partially collateralised (A): LTV > 100% | 53,980 | 6,337 | 2,130 | — | 62,447 | 0.1 | 0.7 | 45.6 | — | 1.7 |
– collateral value on A | 24,763 | 2,942 | 1,199 | — | 28,904 | |||||
Loans and advances to customers including loan commitments by level of collateral for key countries/territories (by stage) at 31 December 2024 | ||||||||||
(Audited) | ||||||||||
Gross carrying/nominal amount | ECL coverage | |||||||||
Stage 1 | Stage 2 | Stage 3 | POCI | Total | Stage 1 | Stage 2 | Stage 3 | POCI | Total | |
$m | $m | $m | $m | $m | % | % | % | % | % | |
Residential mortgages | ||||||||||
Fully collateralised by LTV ratio | 332,641 | 34,203 | 2,371 | 369,215 | — | 0.4 | 10.0 | 0.1 | ||
– less than 50% | 141,331 | 18,076 | 1,238 | 160,645 | — | 0.2 | 7.6 | 0.1 | ||
– 51% to 70% | 111,963 | 11,507 | 698 | 124,168 | — | 0.4 | 11.2 | 0.1 | ||
– 71% to 80% | 39,374 | 3,040 | 242 | 42,656 | — | 0.7 | 13.1 | 0.1 | ||
– 81% to 90% | 25,514 | 1,264 | 131 | 26,909 | — | 0.9 | 15.0 | 0.1 | ||
– 91% to 100% | 14,459 | 316 | 62 | 14,837 | — | 1.8 | 22.4 | 0.1 | ||
Partially collateralised (A): LTV > 100% | 12,031 | 139 | 103 | 12,273 | — | 3.2 | 46.2 | 0.4 | ||
– collateral value on A | 11,274 | 126 | 70 | 11,470 | ||||||
of which: UK | ||||||||||
Fully collateralised by LTV ratio | 151,264 | 30,574 | 747 | 182,585 | — | 0.2 | 8.5 | 0.1 | ||
– less than 50% | 62,753 | 16,689 | 445 | 79,887 | — | 0.1 | 6.9 | 0.1 | ||
– 51% to 70% | 50,374 | 10,456 | 206 | 61,036 | — | 0.2 | 9.7 | 0.1 | ||
– 71% to 80% | 20,552 | 2,423 | 64 | 23,039 | — | 0.4 | 12.1 | 0.1 | ||
– 81% to 90% | 15,965 | 939 | 23 | 16,927 | — | 0.6 | 13.0 | 0.1 | ||
– 91% to 100% | 1,620 | 67 | 9 | 1,696 | — | 0.7 | 16.7 | 0.1 | ||
Partially collateralised (B): LTV > 100% | 146 | 15 | 5 | 166 | — | 1.0 | 27.7 | 0.9 | ||
– collateral value on B | 109 | 12 | 4 | 125 | ||||||
of which: Hong Kong | ||||||||||
Fully collateralised by LTV ratio | 95,751 | 756 | 138 | 96,645 | — | — | 1.3 | — | ||
– less than 50% | 38,894 | 372 | 79 | 39,345 | — | — | 0.4 | — | ||
– 51% to 70% | 30,088 | 227 | 31 | 30,346 | — | — | 0.4 | — | ||
– 71% to 80% | 6,783 | 47 | 11 | 6,841 | — | — | 5.1 | — | ||
– 81% to 90% | 7,602 | 42 | 9 | 7,653 | — | 0.2 | 1.1 | — | ||
– 91% to 100% | 12,384 | 68 | 8 | 12,460 | — | 0.1 | 8.8 | — | ||
Partially collateralised (C): LTV > 100% | 11,744 | 103 | 14 | 11,861 | — | 0.2 | 19.1 | — | ||
– collateral value on C | 11,034 | 96 | 12 | 11,142 | ||||||
Commercial real estate | ||||||||||
Not collateralised | 36,168 | 4,709 | 1,704 | — | 42,581 | 0.1 | 9.0 | 47.5 | — | 3.0 |
Fully collateralised by LTV ratio | 37,090 | 11,909 | 5,254 | — | 54,253 | 0.1 | 1.7 | 7.8 | — | 1.2 |
– less than 50% | 20,522 | 5,154 | 2,413 | — | 28,089 | 0.1 | 1.7 | 5.7 | — | 0.9 |
– 51% to 75% | 11,392 | 3,840 | 1,691 | — | 16,923 | 0.1 | 2.2 | 7.6 | — | 1.3 |
– 76% to 90% | 2,554 | 2,277 | 767 | — | 5,598 | 0.1 | 0.9 | 12.5 | — | 2.1 |
– 91% to 100% | 2,622 | 638 | 383 | — | 3,643 | 0.2 | 2.3 | 12.3 | — | 1.8 |
Partially collateralised (A): LTV > 100% | 2,119 | 698 | 815 | 64 | 3,696 | 0.2 | 2.8 | 19.7 | 45.8 | 5.8 |
– collateral value on A | 1,255 | 457 | 570 | 29 | 2,311 | |||||
of which: UK | ||||||||||
Not collateralised | 4,487 | 1,890 | 127 | — | 6,504 | 0.4 | 3.8 | 27.8 | — | 1.9 |
Fully collateralised by LTV ratio | 9,139 | 3,194 | 305 | — | 12,638 | 0.2 | 1.1 | 8.2 | — | 0.6 |
– less than 50% | 2,903 | 761 | 160 | — | 3,824 | 0.2 | 1.5 | 8.0 | — | 0.8 |
– 51% to 75% | 4,202 | 1,693 | 69 | — | 5,964 | 0.2 | 1.2 | 12.0 | — | 0.6 |
– 76% to 90% | 1,173 | 732 | 24 | — | 1,929 | 0.1 | 0.4 | 10.2 | — | 0.3 |
– 91% to 100% | 861 | 8 | 52 | — | 921 | 0.1 | 7.7 | 2.7 | — | 0.3 |
Partially collateralised (B): LTV > 100% | 503 | 565 | 119 | 46 | 1,233 | 0.2 | 2.9 | 21.1 | 48.6 | 5.3 |
– collateral value on B | 296 | 350 | 69 | 26 | 741 | |||||
of which: Hong Kong | ||||||||||
Not collateralised | 16,380 | 2,312 | 1,404 | — | 20,096 | — | 14.3 | 47.9 | — | 5.0 |
Fully collateralised by LTV ratio | 17,115 | 6,045 | 4,127 | — | 27,287 | 0.1 | 1.4 | 5.8 | — | 1.2 |
– less than 50% | 12,935 | 3,589 | 2,102 | — | 18,626 | 0.1 | 1.3 | 3.8 | — | 0.7 |
– 51% to 75% | 3,534 | 1,059 | 1,243 | — | 5,836 | 0.1 | 2.2 | 6.2 | — | 1.8 |
– 76% to 90% | 336 | 1,050 | 654 | — | 2,040 | 0.1 | 1.1 | 11.8 | — | 4.4 |
– 91% to 100% | 310 | 347 | 128 | — | 785 | — | 0.5 | 2.4 | — | 0.6 |
Partially collateralised (C): LTV > 100% | 185 | 62 | 562 | 18 | 827 | — | 1.9 | 17.6 | 38.1 | 12.9 |
– collateral value on C | 119 | 41 | 397 | 3 | 560 | |||||
Not collateralised | 713,028 | 62,844 | 6,870 | 5 | 782,747 | 0.1 | 0.9 | 41.5 | 14.2 | 0.5 |
Fully collateralised by LTV ratio | 87,488 | 11,992 | 3,394 | 21 | 102,895 | 0.1 | 2.0 | 8.0 | 98.1 | 0.6 |
– less than 50% | 39,432 | 4,360 | 1,703 | — | 45,495 | 0.1 | 1.6 | 6.9 | — | 0.5 |
– 51% to 75% | 20,169 | 4,643 | 778 | 21 | 25,611 | 0.1 | 2.8 | 12.0 | 98.1 | 1.0 |
– 76% to 90% | 9,016 | 1,515 | 512 | — | 11,043 | 0.1 | 1.6 | 7.1 | — | 0.6 |
– 91% to 100% | 18,871 | 1,474 | 401 | — | 20,746 | — | 0.8 | 6.3 | — | 0.2 |
Partially collateralised (A): LTV > 100% | 51,536 | 5,772 | 2,411 | 3 | 59,722 | 0.1 | 0.8 | 34.3 | 7.0 | 1.5 |
– collateral value on A | 22,800 | 2,519 | 1,162 | 1 | 26,482 | |||||
Wholesale lending – reconciliation of changes in gross carrying/nominal amount and allowances for loans and advances to banks and customers including loan commitments and financial guarantees | ||||||||||
(Audited) | ||||||||||
Non-credit impaired | Credit impaired | |||||||||
Stage 1 | Stage 2 | Stage 3 | POCI | Total | ||||||
Gross carrying/ nominal amount | Allowance for ECL | Gross carrying/ nominal amount | Allowance for ECL | Gross carrying/ nominal amount | Allowance for ECL | Gross carrying/ nominal amount | Allowance for ECL | Gross carrying/ nominal amount | Allowance for ECL | |
$m | $m | $m | $m | $m | $m | $m | $m | $m | $m | |
At 1 Jan 2025 | 833,036 | (645) | 74,288 | (1,516) | 20,177 | (5,347) | 93 | (51) | 927,594 | (7,559) |
Transfers of financial instruments: | (35,399) | (267) | 27,793 | 859 | 7,606 | (592) | — | — | — | — |
–transfers from stage 1 to stage 2 | (93,205) | 143 | 93,205 | (143) | — | — | — | — | — | — |
–transfers from stage 2 to stage 1 | 58,517 | (372) | (58,517) | 372 | — | — | — | — | — | — |
– transfers to stage 3 | (1,210) | 4 | (7,605) | 678 | 8,815 | (682) | — | — | — | — |
– transfers from stage 3 | 499 | (42) | 710 | (48) | (1,209) | 90 | — | — | — | — |
Net remeasurement of ECL arising from transfer of stage | — | 253 | — | (226) | — | (49) | — | — | — | (22) |
Net new and further lending/ repayments | 66,354 | (171) | (27,221) | 304 | (5,593) | 690 | 238 | 2 | 33,778 | 825 |
Change to risk parameters – credit quality | — | 181 | — | (826) | — | (2,596) | — | (24) | — | (3,265) |
Changes to models used for ECL calculation | — | (30) | — | 277 | — | — | — | — | — | 247 |
Assets written off | — | — | — | — | (1,928) | 1,928 | — | — | (1,928) | 1,928 |
Credit-related modifications that resulted in derecognition | — | — | — | — | (88) | 9 | — | — | (88) | 9 |
Foreign exchange and others1 | 29,369 | 7 | 2,197 | (66) | 1,023 | (341) | 6 | (3) | 32,595 | (403) |
At 31 Dec 2025 | 893,360 | (672) | 77,057 | (1,194) | 21,197 | (6,298) | 337 | (76) | 991,951 | (8,240) |
ECL income statement change for the period | 233 | (471) | (1,955) | (22) | (2,215) | |||||
Recoveries | 77 | |||||||||
Others | (267) | |||||||||
Total ECL income statement change for the period | (2,405) | |||||||||
1Total includes $3.3bn of gross carrying loans and advances to customers and banks, which were classified to assets held for sale during the year, and a
corresponding allowance for ECL of $11m, reflecting business disposals as disclosed in Note 23 ‘Assets held for sale and liabilities of disposal groups held for
sale’ on page 355.
During the year, there was a net transfer between stage 1 and stage 2 of $34,688m gross carrying/nominal amounts. It was primarily driven by our
entities in Asia ($31,809m) due to credit deterioration and updates to our models used for ECL calculations, in the US ($1,652m) and in Mexico
($1,069m).
ÑA summary of basis of preparation is available on page 158.
Wholesale lending – reconciliation of changes in gross carrying/nominal amount and allowances for loans and advances to banks and customers including loan commitments and financial guarantees (continued) | ||||||||||
(Audited) | ||||||||||
Non-credit impaired | Credit impaired | |||||||||
Stage 1 | Stage 2 | Stage 3 | POCI | Total | ||||||
Gross carrying/ nominal amount | Allowance for ECL | Gross carrying/ nominal amount | Allowance for ECL | Gross carrying/ nominal amount | Allowance for ECL | Gross carrying/ nominal amount | Allowance for ECL | Gross carrying/ nominal amount | Allowance for ECL | |
$m | $m | $m | $m | $m | $m | $m | $m | $m | $m | |
At 1 Jan 2024 | 845,982 | (698) | 102,129 | (1,668) | 16,939 | (6,207) | 85 | (30) | 965,135 | (8,603) |
Transfers of financial instruments: | (17,606) | (214) | 6,997 | 825 | 10,609 | (611) | — | — | — | — |
– transfers from stage 1 to stage 2 | (70,991) | 173 | 70,991 | (173) | — | — | — | — | — | — |
– transfers from stage 2 to stage 1 | 55,182 | (380) | (55,182) | 380 | — | — | — | — | — | — |
– transfers to stage 3 | (2,056) | 7 | (9,515) | 636 | 11,571 | (643) | — | — | — | — |
– transfers from stage 3 | 259 | (14) | 703 | (18) | (962) | 32 | — | — | — | — |
Net remeasurement of ECL arising from transfer of stage | — | 214 | — | (226) | — | (12) | — | — | — | (24) |
Net new and further lending/ repayments | 58,044 | (151) | (29,842) | 311 | (4,450) | 1,219 | 7 | (7) | 23,759 | 1,372 |
Changes to risk parameters – credit quality | — | 112 | — | (899) | — | (2,508) | — | (11) | — | (3,306) |
Changes to models used for ECL calculation | — | 39 | — | 105 | — | — | — | — | — | 144 |
Assets written off | — | — | — | — | (2,925) | 2,925 | — | — | (2,925) | 2,925 |
Credit-related modifications that resulted in derecognition | — | — | — | — | — | — | — | — | — | — |
Foreign exchange and others1,2,3 | (53,384) | 53 | (4,996) | 36 | 4 | (153) | 1 | (3) | (58,375) | (67) |
At 31 Dec 2024 | 833,036 | (645) | 74,288 | (1,516) | 20,177 | (5,347) | 93 | (51) | 927,594 | (7,559) |
ECL income statement change for the period | 214 | (709) | (1,301) | (18) | (1,814) | |||||
Recoveries | 40 | |||||||||
Others | (126) | |||||||||
Total ECL income statement change for the period | (1,900) | |||||||||
1Total includes $2.9bn of gross carrying loans and advances to customers and banks, which were classified to assets held for sale during the year, and a
corresponding allowance for ECL of $23m, reflecting business disposals as disclosed in Note 23 ‘Assets held for sale and liabilities of disposal groups held for
sale’ on page 355.
2Total includes $28.9bn of nominal amount and $20m of corresponding allowance for ECL related to derecognition of loan commitments and financial guarantees
following the sale of our banking business in Canada during 2024.
3Total includes $0.3bn of nominal amount related to derecognition of loan commitments and financial guarantees following the sale of our business in Argentina
during 2024.
Mainland China commercial real estate | ||||||||
(Audited) | At 31 Dec 2025 | At 31 Dec 2024 | ||||||
Hong Kong | Mainland China | Rest of the Group | Total | Hong Kong | Mainland China | Rest of the Group | Total | |
$m | $m | $m | $m | $m | $m | $m | $m | |
Loans and advances to customers1 | 2,079 | 3,474 | 118 | 5,671 | 3,161 | 3,694 | 303 | 7,158 |
Guarantees issued and others2 | 105 | 14 | 12 | 131 | 80 | 16 | 5 | 101 |
Total mainland China commercial real estate exposure | 2,184 | 3,488 | 130 | 5,802 | 3,241 | 3,710 | 308 | 7,259 |
Distribution of mainland China commercial real estate exposure by credit quality | ||||||||
Strong | 293 | 1,818 | 64 | 2,175 | 118 | 1,817 | 109 | 2,044 |
Good | 240 | 583 | — | 823 | 578 | 595 | 1 | 1,174 |
Satisfactory | 154 | 511 | 8 | 673 | 196 | 899 | 49 | 1,144 |
Sub-standard | 87 | 334 | 57 | 478 | 777 | 136 | 149 | 1,062 |
Credit impaired | 1,410 | 242 | 1 | 1,653 | 1,572 | 263 | — | 1,835 |
Total | 2,184 | 3,488 | 130 | 5,802 | 3,241 | 3,710 | 308 | 7,259 |
Allowance for ECL by credit quality | ||||||||
Strong | — | (2) | — | (2) | — | (4) | — | (4) |
Good | — | (4) | — | (4) | — | (3) | — | (3) |
Satisfactory | — | (5) | — | (5) | — | (13) | — | (13) |
Sub-standard | (9) | (99) | (1) | (109) | (261) | (30) | (17) | (308) |
Credit impaired | (799) | (99) | — | (898) | (749) | (81) | — | (830) |
Total | (808) | (209) | (1) | (1,018) | (1,010) | (131) | (17) | (1,158) |
Allowance for ECL by stage distribution | ||||||||
Stage 1 | — | (4) | — | (4) | — | (9) | — | (9) |
Stage 2 | (9) | (106) | (1) | (116) | (261) | (41) | (17) | (319) |
Stage 3 | (783) | (99) | — | (882) | (743) | (81) | — | (824) |
POCI | (16) | — | — | (16) | (6) | — | — | (6) |
Total | (808) | (209) | (1) | (1,018) | (1,010) | (131) | (17) | (1,158) |
ECL coverage % | 37.0 | 6.0 | 0.8 | 17.6 | 31.2 | 3.5 | 5.5 | 16.0 |
1Amounts represent gross carrying amount.
2Amounts represent nominal amount for guarantees and other contingent liabilities.
Personal lending – reconciliation of changes in gross carrying/nominal amount and allowances for loans and advances to customers including loan commitments and financial guarantees | ||||||||||||||||
(Audited) | 2025 | 2024 | ||||||||||||||
Non-credit impaired | Credit impaired | Non-credit impaired | Credit impaired | |||||||||||||
Stage 1 | Stage 2 | Stage 3 | Total | Stage 1 | Stage 2 | Stage 3 | Total | |||||||||
Gross carrying/ nominal amount | Allowance for ECL | Gross carrying/ nominal amount | Allowance for ECL | Gross carrying/ nominal amount | Allowance for ECL | Gross carrying/ nominal amount | Allowance for ECL | Gross carrying/ nominal amount | Allowance for ECL | Gross carrying/ nominal amount | Allowance for ECL | Gross carrying/ nominal amount | Allowance for ECL | Gross carrying/ nominal amount | Allowance for ECL | |
$m | $m | $m | $m | $m | $m | $m | $m | $m | $m | $m | $m | $m | $m | $m | $m | |
At 1 Jan | 656,651 | (587) | 41,610 | (1,158) | 3,646 | (801) | 701,907 | (2,546) | 650,823 | (602) | 50,955 | (1,434) | 3,860 | (856) | 705,638 | (2,892) |
Transfers of financial instruments: | 7,203 | (664) | (9,466) | 1,242 | 2,263 | (578) | — | — | (2,023) | (1,045) | (345) | 1,477 | 2,368 | (432) | — | — |
– transfers from stage 1 to stage 2 | (41,104) | 225 | 41,104 | (225) | — | — | — | — | (45,220) | 246 | 45,220 | (246) | — | — | — | — |
– transfers from stage 2 to stage 1 | 48,706 | (861) | (48,706) | 861 | — | — | — | — | 43,549 | (1,247) | (43,549) | 1,247 | — | — | — | — |
– transfers to stage 3 | (663) | 11 | (2,655) | 756 | 3,318 | (767) | — | — | (743) | 9 | (2,715) | 685 | 3,458 | (694) | — | — |
– transfers from stage 3 | 264 | (39) | 791 | (150) | (1,055) | 189 | — | — | 391 | (53) | 699 | (209) | (1,090) | 262 | — | — |
Net remeasurement of ECL arising from transfer of stage | — | 411 | — | (378) | — | (9) | — | 24 | — | 745 | — | (605) | — | (132) | — | 8 |
Changes due to modifications not derecognised | — | — | — | — | — | — | — | — | — | — | — | — | (25) | — | (25) | — |
Net new and further lending/repayments | 41,379 | (7) | (8,622) | 310 | (467) | 78 | 32,290 | 381 | 29,789 | (17) | (7,889) | 278 | (796) | 470 | 21,104 | 731 |
Change to risk parameters – credit quality | — | 209 | — | (1,165) | — | (1,141) | — | (2,097) | — | 251 | — | (874) | — | (1,437) | — | (2,060) |
Changes to models used for ECL calculation | — | (29) | — | (5) | — | (16) | — | (50) | — | 29 | — | (109) | — | (20) | — | (100) |
Assets written off | — | — | — | — | (1,641) | 1,641 | (1,641) | 1,641 | — | — | — | — | (1,534) | 1,534 | (1,534) | 1,534 |
Foreign exchange and others1,2,3,4 | 13,403 | (23) | 2,310 | (86) | 236 | (69) | 15,949 | (178) | (21,938) | 52 | (1,111) | 109 | (227) | 72 | (23,276) | 233 |
At 31 Dec | 718,636 | (690) | 25,832 | (1,240) | 4,037 | (895) | 748,505 | (2,825) | 656,651 | (587) | 41,610 | (1,158) | 3,646 | (801) | 701,907 | (2,546) |
ECL income statement change for the period | 584 | (1,238) | (1,088) | (1,742) | 1,008 | (1,310) | (1,119) | (1,421) | ||||||||
Recoveries | 243 | 220 | ||||||||||||||
Others | 19 | (32) | ||||||||||||||
Total ECL income statement change for the period | (1,480) | (1,233) | ||||||||||||||
1At 31 December 2025, total includes $2.7bn (31 December 2024: $0.8bn) of gross carrying loans and advances to customers, which were classified to assets held for sale, and a corresponding allowance for ECL of $16m (31 December
2024: $23m), reflecting business disposals, as disclosed in Note 23 ‘Assets held for sale and liabilities of disposal groups held for sale’ on page 355.
2This includes $7.2bn of gross carrying loans and advances to customers and corresponding allowance for ECL of $7m in relation to disposal of our retained portfolio of home and other retail loans in France as disclosed in Note 23 on page
355.
3At 31 December 2024, total includes $6.4bn of nominal amount and $1m of corresponding allowance for ECL related to derecognition of loan commitments and financial guarantees following the sale of our banking business in Canada
during 2024.
4At December 2024, total includes $2.4bn of nominal amount related to derecognition of loan commitments and financial guarantees following the sale of our business in Argentina during 2024.
During the year, there was a net transfer from stage 2 to stage 1 of $7,602m gross carrying/nominal amounts. This was mainly driven by model recalibration for retail portfolios in HSBC UK ($11,245m) where the PD was aligned to the most recent observed performance. This was partly
offset by a net transfer from stage 1 to stage 2 in Hong Kong ($1,152m) primarily due to a new mortgage model implementation and in Mexico
($1,042m) within the unsecured lending portfolios.
First lien residential mortgages – reconciliation of changes in gross carrying/nominal amount and allowances for loans and advances to customers including loan commitments and financial guarantees | ||||||||
Non-credit impaired | Credit impaired | |||||||
Stage 1 | Stage 2 | Stage 3 | Total | |||||
Gross carrying/ nominal amount | Allowance for ECL | Gross carrying/ nominal amount | Allowance for ECL | Gross carrying/ nominal amount | Allowance for ECL | Gross carrying/ nominal amount | Allowance for ECL | |
$m | $m | $m | $m | $m | $m | $m | $m | |
At 1 Jan 2025 | 344,676 | (58) | 34,341 | (130) | 2,474 | (285) | 381,491 | (473) |
Transfers of financial instruments: | 10,647 | (89) | (11,388) | 82 | 741 | 7 | — | — |
– transfers from stage 1 to stage 2 | (29,872) | 9 | 29,872 | (9) | — | — | — | — |
– transfers from stage 2 to stage 1 | 40,658 | (84) | (40,658) | 84 | — | — | — | — |
– transfers to stage 3 | (289) | — | (1,146) | 50 | 1,435 | (50) | — | — |
– transfers from stage 3 | 150 | (14) | 544 | (43) | (694) | 57 | — | — |
Net remeasurement of ECL arising from transfer of stage | — | 52 | — | (31) | — | (1) | — | 20 |
Net new and further lending/repayments | 20,746 | (4) | (6,856) | 29 | (657) | 28 | 13,233 | 53 |
Change to risk parameters – credit quality | — | 39 | — | (43) | — | (104) | — | (108) |
Changes to models used for ECL calculation | — | 5 | — | (4) | — | — | — | 1 |
Assets written off | — | — | — | — | (63) | 63 | (63) | 63 |
Foreign exchange and others1,2 | 12,254 | (5) | 2,190 | (11) | 176 | (20) | 14,620 | (36) |
At 31 Dec 2025 | 388,323 | (60) | 18,287 | (108) | 2,671 | (312) | 409,281 | (480) |
ECL income statement change for the period | 92 | (49) | (77) | (34) | ||||
Recoveries | 6 | |||||||
Others | 4 | |||||||
Total ECL income statement change for the period | (24) | |||||||
1Total includes $2.3bn of gross carrying loans and advances to customers and banks, which were classified to assets held for sale, and a corresponding
allowance for ECL of $2m, including business disposals as disclosed in Note 23 ‘Assets held for sale and liabilities of disposal groups held for sale’ on page 355.
2This includes $0.4bn of gross carrying loans and advances to customers and corresponding allowance for ECL of $1m in relation to disposal of our retained
portfolio of home and other retail loans in France as disclosed in Note 23 on page 355.
First lien residential mortgages – reconciliation of changes in gross carrying/nominal amount and allowances for loans and advances to customers including loan commitments and financial guarantees (continued) | ||||||||
Non-credit impaired | Credit impaired | |||||||
Stage 1 | Stage 2 | Stage 3 | Total | |||||
Gross carrying/ nominal amount | Allowance for ECL | Gross carrying/ nominal amount | Allowance for ECL | Gross carrying/ nominal amount | Allowance for ECL | Gross carrying/ nominal amount | Allowance for ECL | |
$m | $m | $m | $m | $m | $m | $m | $m | |
At 1 Jan 2024 | 340,764 | (109) | 38,513 | (202) | 2,258 | (264) | 381,535 | (575) |
Transfers of financial instruments: | (3,561) | (232) | 2,694 | 232 | 867 | — | — | — |
– transfers from stage 1 to stage 2 | (33,524) | 23 | 33,524 | (23) | — | — | — | — |
– transfers from stage 2 to stage 1 | 30,113 | (244) | (30,113) | 244 | — | — | — | — |
– transfers to stage 3 | (290) | 6 | (1,127) | 90 | 1,417 | (96) | — | — |
– transfers from stage 3 | 140 | (17) | 410 | (79) | (550) | 96 | — | — |
Net remeasurement of ECL arising from transfer of stage | — | 163 | — | (152) | — | (30) | — | (19) |
Net new and further lending/repayments | 14,008 | 20 | (6,336) | 26 | (523) | 33 | 7,149 | 79 |
Change to risk parameters – credit quality | — | 115 | — | (73) | — | (103) | — | (61) |
Changes to models used for ECL calculation | — | (8) | — | 29 | — | 1 | — | 22 |
Assets written off | — | — | — | — | (63) | 63 | (63) | 63 |
Foreign exchange and others | (6,535) | (7) | (530) | 10 | (65) | 15 | (7,130) | 18 |
At 31 Dec 2024 | 344,676 | (58) | 34,341 | (130) | 2,474 | (285) | 381,491 | (473) |
ECL income statement change for the period | 290 | (170) | (99) | 21 | ||||
Recoveries | 7 | |||||||
Others | (1) | |||||||
Total ECL income statement change for the period | 27 | |||||||
Credit cards – reconciliation of changes in gross carrying/nominal amount and allowances for loans and advances to customers including loan commitments | ||||||||
Non-credit impaired | Credit impaired | |||||||
Stage 1 | Stage 2 | Stage 3 | Total | |||||
Gross carrying/ nominal amount | Allowance for ECL | Gross carrying/ nominal amount | Allowance for ECL | Gross carrying/ nominal amount | Allowance for ECL | Gross carrying/ nominal amount | Allowance for ECL | |
$m | $m | $m | $m | $m | $m | $m | $m | |
At 1 Jan 2025 | 156,312 | (280) | 3,760 | (658) | 343 | (199) | 160,415 | (1,137) |
Transfers of financial instruments: | (2,134) | (381) | 1,322 | 742 | 812 | (361) | — | — |
– transfers from stage 1 to stage 2 | (7,206) | 144 | 7,206 | (144) | — | — | — | — |
– transfers from stage 2 to stage 1 | 5,138 | (518) | (5,138) | 518 | — | — | — | — |
– transfers to stage 3 | (122) | 3 | (828) | 408 | 950 | (411) | — | — |
– transfers from stage 3 | 56 | (10) | 82 | (40) | (138) | 50 | — | — |
Net remeasurement of ECL arising from transfer of stage | — | 255 | — | (246) | — | (4) | — | 5 |
Changes due to modifications not derecognised | — | — | — | — | — | — | — | — |
Net new and further lending/repayments | 5,503 | 61 | (758) | 108 | 103 | 34 | 4,848 | 203 |
Change to risk parameters – credit quality | — | 39 | — | (640) | — | (517) | — | (1,118) |
Changes to models used for ECL calculation | — | (34) | — | — | — | (17) | — | (51) |
Assets written off | — | — | — | — | (847) | 847 | (847) | 847 |
Foreign exchange and others | 4,118 | (14) | 147 | (43) | 23 | (14) | 4,288 | (71) |
At 31 Dec 2025 | 163,799 | (354) | 4,471 | (737) | 434 | (231) | 168,704 | (1,322) |
ECL income statement change for the period | 321 | (778) | (504) | (961) | ||||
Recoveries | 123 | |||||||
Others | (5) | |||||||
Total ECL income statement change for the period | (843) | |||||||
At 1 Jan 2024 | 153,292 | (253) | 6,547 | (698) | 450 | (144) | 160,289 | (1,095) |
Transfers of financial instruments: | 796 | (453) | (1,469) | 717 | 673 | (264) | — | — |
– transfers from stage 1 to stage 2 | (6,427) | 129 | 6,427 | (129) | — | — | — | — |
– transfers from stage 2 to stage 1 | 7,255 | (569) | (7,255) | 569 | — | — | — | — |
– transfers to stage 3 | (179) | 2 | (765) | 327 | 944 | (329) | — | — |
– transfers from stage 3 | 147 | (15) | 124 | (50) | (271) | 65 | — | — |
Net remeasurement of ECL arising from transfer of stage | — | 280 | — | (256) | — | (45) | — | (21) |
Changes due to modifications not derecognised | — | — | — | — | (2) | — | (2) | — |
Net new and further lending/repayments | 9,604 | 18 | (1,122) | 127 | (1) | 194 | 8,481 | 339 |
Change to risk parameters – credit quality | — | 79 | — | (476) | — | (694) | — | (1,091) |
Changes to models used for ECL calculation | — | 22 | — | (122) | — | 1 | — | (99) |
Assets written off | — | — | — | — | (736) | 736 | (736) | 736 |
Foreign exchange and others1 | (7,380) | 27 | (196) | 50 | (41) | 17 | (7,617) | 94 |
At 31 Dec 2024 | 156,312 | (280) | 3,760 | (658) | 343 | (199) | 160,415 | (1,137) |
ECL income statement change for the period | 399 | (727) | (544) | (872) | ||||
Recoveries | 106 | |||||||
Others | (10) | |||||||
Total ECL income statement change for the period | (776) |
1Total includes $4.5bn of nominal amount related to derecognition of loan commitments and financial guarantees following the sale of our banking business in
Canada and our business in Argentina during 2024.
Other personal lending – reconciliation of changes in gross carrying/nominal amount and allowances for loans and advances to customers including loan commitments and financial guarantees | ||||||||
Non-credit impaired | Credit impaired | |||||||
Stage 1 | Stage 2 | Stage 3 | Total | |||||
Gross carrying/ nominal amount | Allowance for ECL | Gross carrying/ nominal amount | Allowance for ECL | Gross carrying/ nominal amount | Allowance for ECL | Gross carrying/ nominal amount | Allowance for ECL | |
$m | $m | $m | $m | $m | $m | $m | $m | |
At 1 Jan 2025 | 155,663 | (249) | 3,509 | (370) | 829 | (317) | 160,001 | (936) |
Transfers of financial instruments: | (1,310) | (194) | 600 | 418 | 710 | (224) | — | — |
– transfers from stage 1 to stage 2 | (4,026) | 72 | 4,026 | (72) | — | — | — | — |
– transfers from stage 2 to stage 1 | 2,910 | (259) | (2,910) | 259 | — | — | — | — |
– transfers to stage 3 | (252) | 8 | (681) | 298 | 933 | (306) | — | — |
– transfers from stage 3 | 58 | (15) | 165 | (67) | (223) | 82 | — | — |
Net remeasurement of ECL arising from transfer of stage | — | 104 | — | (101) | — | (4) | — | (1) |
Changes due to modifications not derecognised | — | — | — | — | — | — | — | — |
Net new and further lending/repayments | 15,130 | (64) | (1,008) | 173 | 87 | 16 | 14,209 | 125 |
Change to risk parameters – credit quality | — | 131 | — | (482) | — | (520) | — | (871) |
Changes to models used for ECL calculation | — | — | — | (1) | — | 1 | — | — |
Assets written off | — | — | — | — | (731) | 731 | (731) | 731 |
Foreign exchange and others1,2 | (2,969) | (4) | (27) | (32) | 37 | (35) | (2,959) | (71) |
At 31 Dec 2025 | 166,514 | (276) | 3,074 | (395) | 932 | (352) | 170,520 | (1,023) |
ECL income statement change for the period | 171 | (411) | (507) | (747) | ||||
Recoveries | 114 | |||||||
Others | 20 | |||||||
Total ECL income statement change for the period | (613) | |||||||
1Total includes $0.4bn of gross carrying loans and advances, which were classified to assets held for sale, and a corresponding allowance for ECL of $11m,
reflecting business disposals, as disclosed in Note 23 ‘Assets held for sale and liabilities of disposal groups held for sale’ on page 355.
2This includes $6.8bn of gross carrying loans and advances to customers and corresponding allowance for ECL of $6m in relation to disposal of our retained
portfolio of home and other retail loans in France as disclosed in Note 23 on page 355.
Other personal lending – reconciliation of changes in gross carrying/nominal amount and allowances for loans and advances to customers including loan commitments and financial guarantees (continued) | ||||||||
Non-credit impaired | Credit impaired | |||||||
Stage 1 | Stage 2 | Stage 3 | Total | |||||
Gross carrying/ nominal amount | Allowance for ECL | Gross carrying/ nominal amount | Allowance for ECL | Gross carrying/ nominal amount | Allowance for ECL | Gross carrying/ nominal amount | Allowance for ECL | |
$m | $m | $m | $m | $m | $m | $m | $m | |
At 1 Jan 2024 | 156,767 | (240) | 5,895 | (534) | 1,152 | (448) | 163,814 | (1,222) |
Transfers of financial instruments: | 742 | (360) | (1,570) | 528 | 828 | (168) | — | — |
– transfers from stage 1 to stage 2 | (5,269) | 94 | 5,269 | (94) | — | — | — | — |
– transfers from stage 2 to stage 1 | 6,181 | (434) | (6,181) | 434 | — | — | — | — |
– transfers to stage 3 | (274) | 1 | (823) | 268 | 1,097 | (269) | — | — |
– transfers from stage 3 | 104 | (21) | 165 | (80) | (269) | 101 | — | — |
Net remeasurement of ECL arising from transfer of stage | — | 302 | — | (197) | — | (57) | — | 48 |
Changes due to modifications not derecognised | — | — | — | — | (23) | — | (23) | — |
Net new and further lending/repayments | 6,177 | (55) | (431) | 125 | (272) | 243 | 5,474 | 313 |
Change to risk parameters – credit quality | — | 57 | — | (325) | — | (640) | — | (908) |
Changes to models used for ECL calculation | — | 15 | — | (16) | — | (22) | — | (23) |
Assets written off | — | — | — | — | (735) | 735 | (735) | 735 |
Foreign exchange and others1,2 | (8,023) | 32 | (385) | 49 | (121) | 40 | (8,529) | 121 |
At 31 Dec 2024 | 155,663 | (249) | 3,509 | (370) | 829 | (317) | 160,001 | (936) |
ECL income statement change for the period | 319 | (413) | (476) | (570) | ||||
Recoveries | 107 | |||||||
Others | (21) | |||||||
Total ECL income statement change for the period | (484) | |||||||
1Total includes $0.3bn of gross carrying loans and advances, which were classified to assets held for sale, and a corresponding allowance for ECL of $10m,
reflecting business disposals, as disclosed in Note 23 ‘Assets held for sale and liabilities of disposal groups held for sale’ on page 355.
2Total includes $4.4bn of nominal amount related to derecognition of loan commitments and financial guarantees following the sale of our banking business in
Canada during 2024.
HSBC Holdings(Audited)
Credit risk in HSBC Holdings primarily arises from transactions with
Group subsidiaries.
In HSBC Holdings, the maximum exposure to credit risk arises from
two components:
–financial assets on the balance sheet, where maximum exposure
equals the carrying amount (see page 297); and
–financial guarantees and other guarantees, where the maximum
exposure is the maximum that we would have to pay if the
guarantees were called upon (see Note 33).
In the case of our derivative asset balances (see page 297), there is a
legally enforceable right of offset in the event of counterparty default
and where, as a result, there is a net exposure for credit risk purposes.
However, as there is no intention to settle these balances on a net
basis under normal circumstances, they do not qualify for net
presentation for accounting purposes. These offsets also include
collateral received in cash and other financial assets.
The total offset relating to our derivative asset balances was $1.8bn at
31 December 2025 (2024: $3.0bn).
The credit quality of loans and advances and financial investments,
both of which consist of intra-Group lending and US Treasury bills and
bonds, is assessed as ‘strong’, with 100% of the exposure being
neither past due nor impaired (2024: 100%). For further details of credit
quality classification, see page 141.Approach and policy(Audited)
We manage treasury risks in order to maintain appropriate levels of
capital, liquidity, funding, foreign exchange and non-traded market risk
to support our business strategy, and meet our regulatory and stress
testing-related requirements.
Our approach to treasury risk management is shaped by our
organisational needs and the regulatory, economic and commercial
environment. We aim to maintain a strong capital and liquidity base to
manage inherent business risks and invest in accordance with our
strategy, adhering to both consolidated and local regulatory
requirements at all times.
Our policy is supported by a risk management framework, with further
details provided on page 119.
ÑFor further details, refer to our Pillar 3 Disclosures at 31 December 2025.
Own funds disclosure | |||
(Table audited) | At | ||
31 Dec 2025 | 31 Dec 2024 | ||
Ref* | $m | $m | |
Common equity tier 1 capital: instruments and reserves | |||
1 | Capital instruments and the related share premium accounts | 8,699 | 22,378 |
– ordinary shares | 8,699 | 22,378 | |
2 | Retained earnings | 152,936 | 138,959 |
3 | Accumulated other comprehensive income (and other reserves) | (27) | (8,410) |
5 | Minority interests (amount allowed in consolidated CET1) | 3,303 | 3,960 |
5a | Independently reviewed net profits net of any foreseeable charge or dividend | 8,076 | 7,184 |
6 | Common equity tier 1 capital before regulatory adjustments | 172,987 | 164,071 |
28 | Total regulatory adjustments to common equity tier 1 | (40,394) | (39,160) |
29 | Common equity tier 1 capital | 132,593 | 124,911 |
36 | Additional tier 1 capital before regulatory adjustments | 20,874 | 19,286 |
43 | Total regulatory adjustments to additional tier 1 capital | (70) | (70) |
44 | Additional tier 1 capital | 20,804 | 19,216 |
45 | Tier 1 capital | 153,397 | 144,127 |
51 | Tier 2 capital before regulatory adjustments | 30,167 | 29,334 |
57 | Total regulatory adjustments to tier 2 capital | (1,193) | (1,075) |
58 | Tier 2 capital | 28,974 | 28,259 |
59 | Total capital | 182,371 | 172,386 |
*The references identify lines prescribed in the PRA template, which are applicable and where there is a value.
Funding sources | ||
(Audited) | ||
2025 | 2024 | |
$m | $m | |
Customer accounts | 1,786,828 | 1,654,955 |
Deposits by banks | 97,952 | 73,997 |
Repurchase agreements – non-trading | 204,974 | 180,880 |
Debt securities in issue | 99,675 | 105,785 |
Cash collateral, margin, settlement accounts and items in course of transmission to other banks | 91,087 | 82,732 |
Liabilities of disposal groups held for sale | 23,382 | 29,011 |
Subordinated liabilities | 28,406 | 25,958 |
Financial liabilities designated at fair value | 158,456 | 138,727 |
Insurance contract liabilities | 122,955 | 107,629 |
Trading liabilities | 72,122 | 65,982 |
– repos | 13,113 | 14,806 |
– stock lending | 6,250 | 3,525 |
– other trading liabilities | 52,759 | 47,651 |
Total equity | 205,666 | 192,273 |
Other balance sheet liabilities | 341,531 | 359,119 |
At 31 Dec | 3,233,034 | 3,017,048 |
Funding uses | ||
(Audited) | ||
2025 | 2024 | |
$m | $m | |
Loans and advances to customers | 988,399 | 930,658 |
Loans and advances to banks | 108,462 | 102,039 |
Reverse repurchase agreements – non-trading | 298,392 | 252,549 |
Cash collateral, margin, settlement accounts and items in course of collection from other banks | 87,667 | 78,538 |
Assets held for sale | 11,115 | 27,234 |
Trading assets | 366,153 | 314,842 |
– reverse repos | 18,449 | 16,823 |
– stock borrowing | 14,947 | 8,374 |
– other trading assets | 332,757 | 289,645 |
Financial investments | 567,211 | 493,166 |
Cash and balances with central banks | 242,859 | 267,674 |
Other balance sheet assets | 562,776 | 550,348 |
At 31 Dec | 3,233,034 | 3,017,048 |
Non-trading VaR, 99% 10 day | ||||
(Audited) | ||||
Interest rate | Credit spread | Portfolio diversification1 | Total2 | |
$m | $m | $m | $m | |
Balance at 31 Dec 2025 | 499.6 | 149.6 | (102.5) | 546.6 |
Average | 465.2 | 190.8 | (115.8) | 540.1 |
Maximum | 575.3 | 254.6 | 617.5 | |
Minimum | 378.9 | 93.9 | 458.0 | |
Balance at 31 Dec 2024 | 528.4 | 246.1 | (220.7) | 553.8 |
Average | 603.7 | 315.1 | (222.9) | 695.8 |
Maximum | 1,000.6 | 369.1 | 1,097.6 | |
Minimum | 292.1 | 242.4 | 408.7 | |
1Portfolio diversification is the market risk dispersion effect of holding a portfolio containing different risk types. It represents the reduction in unsystematic
market risk that occurs when combining a number of different risk types – such as interest rate and credit spreads – together in one portfolio. It is measured as
the difference between the sum of the VaR by individual risk type and the combined total VaR. A negative number represents the benefit of portfolio
diversification. As the maximum and minimum occurs on different days for different risk types, it is not meaningful to calculate a portfolio diversification benefit
for these measures.
2The total VaR is non-additive across risk types due to diversification effects.
Value at risk(Audited)
VaR is a technique for estimating potential losses on risk positions as a
result of movements in market rates and prices over a specified time
horizon and to a given level of confidence. The use of VaR is integrated
into market risk management and calculated for all trading positions
regardless of how we capitalise them.
Our models are predominantly based on historical simulation that
incorporates the following features:
–historical market rates and prices, which are calculated with
reference to foreign exchange rates, commodity prices, interest
rates, equity prices and the associated volatilities;
–potential market movements that are calculated with reference to
data from the past two years; and
–calculations to a 99% confidence level and using a one-day holding
period.
The models also incorporate the effect of option features on the
underlying exposures. The nature of the VaR models means that an
increase in observed market volatility will lead to an increase in VaR
without any changes in the underlying positions.
VaR model limitations
Although a valuable guide to risk, VaR is used with awareness of its
limitations. For example:
–The use of historical data as a proxy for estimating future market
moves may not encompass all potential market events, particularly
those that are extreme in nature. As the model is calibrated on the
last 500 business days, it does not adjust instantaneously to a
change in the market regime.
–The use of a one-day holding period for risk management purposes
of trading books assumes that this short period is sufficient to
hedge or liquidate all positions.
–The use of a 99% confidence level by definition does not take into
account losses that might occur beyond this level of confidence.
–VaR is calculated on the basis of exposures outstanding at the close
of business and therefore does not reflect intra-day exposures.
Risk not in VaR framework
The risks not in VaR (‘RNIV’) framework captures and capitalises
material market risks that are not adequately covered in the VaR
model.
Risk factors are reviewed on a regular basis and are either incorporated
directly into the VaR models, where possible, or quantified through
either the VaR-based RNIV approach or a stress test approach within
the RNIV framework. While VaR-based RNIVs are calculated by using
historical scenarios, stress-type RNIVs are estimated on the basis of
stress scenarios whose severity is calibrated to be in line with the
capital adequacy requirements. The outcome of the VaR-based RNIV
approach is included in the overall VaR calculation but excluded from
the VaR measure used for regulatory back-testing.
Stress-type RNIVs include a deal contingent derivatives capital charge
to capture risk for these transactions and a de-peg risk measure to
capture risk to pegged and heavily-managed currencies.
Stress testing
Stress testing is an important procedure that is integrated into our
market risk management framework to evaluate the potential impact
on portfolio values of more extreme, although plausible, events or
movements in a set of financial variables. In such scenarios, losses can
be much greater than those predicted by VaR modelling. Stress testing
and reverse stress testing provide senior management with insights
regarding the ‘tail risk’ beyond VaR.
Stress testing is implemented at legal entity, regional and overall Group
levels. A set of scenarios is used consistently across all regions within
the Group. Market risk stress testing incorporates both historical and
hypothetical events. Market risk reverse stress tests are designed to
identify vulnerabilities in our portfolios by looking for scenarios that lead
to loss levels considered severe for the relevant portfolio. These
scenarios may be local or idiosyncratic in nature and complement the
systematic top-down stress testing.
The risk appetite around potential stress losses for the Group is set and
monitored against limits.
The Group trading VaR for the year is shown in the table below.Trading VaR, 99% 1 day1 | ||||||||||||
(Audited) | At 31 Dec 2025 | At 31 Dec 2024 | ||||||||||
Foreign exchange and commodity | Interest rate | Equity | Credit spread | Portfolio diversification1 | Total2 | Foreign exchange and commodity | Interest rate | Equity | Credit spread | Portfolio diversification1 | Total2 | |
$m | $m | $m | $m | $m | $m | $m | $m | $m | $m | $m | $m | |
Balance | 13.9 | 18.9 | 17.1 | 8.5 | (19.5) | 38.9 | 14.6 | 34.9 | 16.3 | 8.2 | (35.7) | 38.3 |
Average | 13.6 | 27.5 | 16.3 | 10.1 | (29.1) | 38.5 | 15.2 | 48.3 | 14.8 | 9.9 | (35.1) | 53.1 |
Maximum | 26.9 | 54.9 | 24.6 | 17.9 | 57.1 | 29.8 | 78.1 | 20.5 | 13.1 | 83.3 | ||
Minimum | 6.2 | 17.1 | 12.3 | 6.4 | 27.3 | 6.9 | 24.8 | 12.7 | 6.6 | 37.0 | ||
2The total VaR is non-additive across risk types due to diversification effects.
Key risk management processesMarket risk
(Audited)
All our insurance manufacturing subsidiaries have market risk
mandates and limits that specify the investment instruments in which
they are permitted to invest and the maximum quantum of market risk
that they may retain. They manage market risk by using some or all of
the techniques listed below, among others, depending on the nature of
the contracts written.
–We are able to adjust bonus rates and other discretionary benefits
to manage the liabilities to policyholders for products with
participating features. The effect is that a significant proportion of
the market risk is shared with the policyholders.
–We use asset and liability matching where asset portfolios are
structured to support projected liability cash flows.
–We use derivatives and other financial instruments, along with
reinsurance to protect against adverse market movements.
–We design new products to mitigate market risk, such as changing
the investment return sharing proportion between policyholders and
the shareholder.
Credit risk
(Audited)
Our insurance manufacturing subsidiaries also have credit risk
mandates and limits within which they are permitted to operate, which
consider the credit risk exposure, quality and performance of their
investment portfolios. Our assessment of the creditworthiness of
issuers and counterparties is based primarily upon internationally
recognised credit ratings and other publicly available information.
Stress testing is performed on investment credit exposures using
credit spread sensitivities and default probabilities.
We use a number of tools to manage and monitor credit risk. These
include a credit report containing a watch-list of investments with
current credit concerns, primarily investments that may be at risk of
future impairment or where high concentrations to counterparties are
present in the investment portfolio. Sensitivities to credit spread risk
are assessed and monitored regularly.
Capital and liquidity risk
(Audited)
Capital risk for our insurance manufacturing subsidiaries is assessed in
the Group’s ICAAP, based on their financial capacity to support the
risks to which they are exposed. Capital adequacy is assessed on both
the relevant local insurance regulatory basis and an internal capital
basis.
Risk appetite buffers are set to ensure that the operations are able to
remain solvent, allowing for business-as-usual volatility and extreme
but plausible stress events.
Liquidity risk is less material for the insurance business. It is managed
by cash flow matching and maintaining sufficient cash resources,
investing in high credit-quality investments with deep and liquid
markets, monitoring investment concentrations and restricting them
where appropriate, and establishing committed contingency borrowing
facilities.
Insurance manufacturing subsidiaries complete quarterly liquidity risk
reports and an annual review of the liquidity risks to which they are
exposed.
Insurance underwriting risk
(Audited)
Our insurance manufacturing subsidiaries primarily use the following
frameworks and processes to manage and mitigate insurance
underwriting risks:
–a formal approval process for launching new products or making
changes to products to ensure insurance risks are identified and
mitigated;
–a product pricing and profitability framework, which requires initial
and ongoing assessment of the adequacy of premiums charged on
new insurance contracts to meet the risks associated with them;
–a framework for customer underwriting;
–reinsurance, which cedes risks to third-party reinsurers to keep risks
within risk appetite, reduce volatility and improve capital efficiency;
and
–oversight by actuarial review committees in each of our entities of
the methodology and assumptions that underpin IFRS 17 reporting
to ensure that appropriate reserves are established to cover
insurance underwriting risks.
Insurance manufacturing operations risk in 2025
Measurement
The following tables show the composition of the fair value of
underlying items of the Group’s participating contracts at the reporting
date and by the following type of contract:
–‘Life direct participating and investment discretionary participation
feature (‘DPF’) contracts’ are life direct participating contracts and
investment contracts with DPF. These are substantially measured
under the variable fee approach measurement model.
–‘Life other contracts’ are measured under the general measurement
model and mainly include protection insurance contracts as well as
reinsurance contracts. The reinsurance contracts primarily provide
diversification benefits over the life direct participating and
investment DPF contracts.
–‘Other contracts’ includes investment contracts for which HSBC
does not bear significant insurance risk.
Balance sheet of insurance manufacturing subsidiaries by type of contract | |||||
(Audited) | |||||
Life direct participating and investment DPF contracts | Life other contracts | Other contracts | Shareholder assets and liabilities | Total | |
At 31 Dec 2025 | $m | $m | $m | $m | $m |
Financial assets | 111,078 | 5,277 | 5,672 | 5,405 | 127,432 |
–financial assets designated and otherwise mandatorily measured at fair value through profit or loss | 106,705 | 4,984 | 4,337 | 579 | 116,605 |
– derivatives | 136 | 8 | — | — | 144 |
– financial investments – at amortised cost | 609 | 115 | 1,010 | 3,654 | 5,388 |
– financial assets at fair value through other comprehensive income | — | — | 3 | 214 | 217 |
– other financial assets | 3,628 | 170 | 322 | 958 | 5,078 |
Insurance contract assets | 12 | 98 | — | — | 110 |
Reinsurance contract assets | — | 5,948 | — | — | 5,948 |
Assets held for sale1 | 4,748 | 258 | 1,347 | 271 | 6,624 |
Other assets and investment properties | 1,785 | 118 | 45 | 2,696 | 4,644 |
Total assets | 117,623 | 11,699 | 7,064 | 8,372 | 144,758 |
Liabilities under investment contracts designated at fair value | — | — | 5,288 | — | 5,288 |
Insurance contract liabilities | 117,107 | 4,761 | — | — | 121,868 |
Reinsurance contract liabilities | — | 680 | — | — | 680 |
Liabilities of disposal groups held for sale1 | 4,734 | 234 | — | 1,418 | 6,386 |
Other liabilities | — | — | — | 3,821 | 3,821 |
Total liabilities | 121,841 | 5,675 | 5,288 | 5,239 | 138,043 |
Total equity | — | — | — | 6,715 | 6,715 |
Total liabilities and equity | 121,841 | 5,675 | 5,288 | 11,954 | 144,758 |
Balance sheet of insurance manufacturing subsidiaries by type of contract (continued) | |||||
(Audited) | |||||
Life direct participating and investment DPF contracts | Life other contracts | Other contracts | Shareholder assets and liabilities | Total | |
At 31 Dec 2024 | $m | $m | $m | $m | $m |
Financial assets | 98,676 | 4,452 | 6,227 | 5,967 | 115,322 |
– financial assets designated and otherwise mandatorily measured at fair value through profit or loss | 94,327 | 4,233 | 4,839 | 690 | 104,089 |
– derivatives | 207 | 7 | 1 | — | 215 |
– financial investments – at amortised cost | 545 | 90 | 1,060 | 4,335 | 6,030 |
– financial assets at fair value through other comprehensive income | — | — | 6 | 73 | 79 |
– other financial assets | 3,597 | 122 | 321 | 869 | 4,909 |
Insurance contract assets | 14 | 104 | — | — | 118 |
Reinsurance contract assets | — | 5,013 | — | — | 5,013 |
Assets held for sale1 | 22,855 | — | — | 1,367 | 24,222 |
Other assets and investment properties | 1,792 | 64 | 36 | 1,970 | 3,862 |
Total assets | 123,337 | 9,633 | 6,263 | 9,304 | 148,537 |
Liabilities under investment contracts designated at fair value | — | — | 5,931 | — | 5,931 |
Insurance contract liabilities | 102,605 | 4,427 | — | — | 107,032 |
Reinsurance contract liabilities | — | 701 | — | — | 701 |
Liabilities of disposal groups held for sale1 | 21,772 | 39 | — | 1,609 | 23,420 |
Other liabilities | — | — | — | 4,438 | 4,438 |
Total liabilities | 124,377 | 5,167 | 5,931 | 6,047 | 141,522 |
Total equity | — | — | — | 7,015 | 7,015 |
Total liabilities and equity | 124,377 | 5,167 | 5,931 | 13,062 | 148,537 |
1HSBC Life (UK) Limited is classified as held for sale at 31 December 2025. HSBC Assurances Vie (France) was classified as held for sale at 31 December 2024.
Further details are provided on page 355.
Market risk(Audited)
Description and exposure
Market risk is the risk of changes in market factors affecting HSBC’s
capital or profit. Market factors include interest rates, equity and
growth assets, credit spreads and foreign exchange rates.
Our exposure varies depending on the type of contract issued. Our
most significant life insurance products are contracts with participating
features. These products typically include some form of capital
guarantee or guaranteed return on the sums invested by the
policyholders, to which bonuses are added if allowed by the overall
performance of the funds. For contracts without participating features,
some form of guarantee may still exist but HSBC’s ability to share risks
with policyholders will be reduced. Funds supporting these savings
products are invested in a mix of fixed income assets (to support
guarantees) and other asset classes (to provide customers with the
potential for enhanced returns).
These products expose HSBC to the risk of variation in asset returns,
which will impact our participation in the investment performance.
In certain circumstances, asset returns may be insufficient to meet the
policyholders’ guaranteed benefits. For non-participating contracts, any
resulting shortfall is borne by HSBC.
For unit-linked contracts, market risk is substantially borne by the
policyholder, but some market risk exposure typically remains, as fees
earned are typically related to the market value of the linked assets.
SensitivitiesThe following table shows the sensitivity of the CSM, profit and total
equity of our insurance manufacturing subsidiaries to changes in
interest rates, credit spreads, growth assets and foreign exchange
rates. These sensitivities are prepared in accordance with current IFRS
Accounting Standards.
Due in part to the nature of the guarantees, and the reinsurance and
hedging strategies which may be in place, the relationship between the
CSM, profit and total equity is not linear. The sensitivities are before
management actions that may mitigate the effect of changes in the
market environment. The lower profit after tax sensitivity to yield curve
shifts is driven by improved asset and liability matching in mainland
China, partly offset by the impact of methodology updates in Hong
Kong.
The 2025 sensitivities below exclude HSBC Assurances Vie (France)
following completion of its sale on 31 October 2025. Further details are
provided on page 355.
Sensitivity of HSBC’s insurance manufacturing subsidiaries to market risk factors | ||||||
(Audited) | ||||||
2025 | 2024 | |||||
Effect on CSM | Effect on profit after tax for the year | Effect on total equity | Effect on CSM | Effect on profit after tax for the year | Effect on total equity | |
$m | $m | $m | $m | $m | $m | |
+100 basis point parallel shift in yield curves | (370) | 36 | 36 | (155) | 83 | 52 |
-100 basis point parallel shift in yield curves | (51) | (127) | (127) | (249) | (217) | (186) |
+100 basis point shift in credit spreads | (918) | (15) | (15) | (907) | (84) | (115) |
-100 basis point shift in credit spreads | 897 | 74 | 74 | 876 | 60 | 91 |
10% increase in growth assets1 | 461 | 64 | 64 | 467 | 73 | 73 |
10% decrease in growth assets1 | (533) | (75) | (75) | (514) | (79) | (79) |
10% appreciation in US dollar exchange rate against local functional currency | 102 | 20 | 20 | 71 | 17 | 17 |
10% depreciation in US dollar exchange rate against local functional currency | (75) | (15) | (15) | (26) | (3) | (3) |
1‘Growth assets’ primarily comprise equity securities and investment properties. Variability in growth asset fair value constitutes a market risk to insurance
manufacturing subsidiaries.
Credit risk(Audited)
Description and exposure
Credit risk is the risk of financial loss if a customer or counterparty fails
to meet their obligation under a contract. It arises in two main risks for
our insurance manufacturers:
–the risk associated with credit spread volatility and default by debt
security counterparties after investing premiums to generate a
return for policyholders and shareholders; and
–the risk of default by reinsurance counterparties and non-
reimbursement for claims made after ceding insurance risk.
The amounts outstanding at the balance sheet date in respect of these
The credit quality of the reinsurers’ share of liabilities under insurance
contracts is assessed as ‘satisfactory’ or higher (as defined on
page 141), with none of the exposure being either past due or impaired
(2024: none).
Credit risk on assets supporting unit-linked liabilities is predominantly
borne by the policyholders. Therefore, our exposure is primarily related
to liabilities under non-linked insurance and investment contracts and
shareholders’ funds. The credit quality of insurance financial assets is
The risk associated with credit spread volatility is to a large extent
mitigated by holding debt securities to maturity, and sharing a degree
of credit spread experience with policyholders.
Liquidity risk(Audited)
Description and exposure
Liquidity risk is the risk that an insurance operation, though solvent,
either does not have sufficient financial resources available to meet its
obligations when they fall due, or can secure them only at excessive
cost. Liquidity risk may be able to be shared with policyholders for
products with participating features.
The remaining maturity of insurance contract liabilities is included in
Note 4 on page 319.
The amounts of insurance contract liabilities that are payable on demand are set out by the product grouping below and exclude
insurance businesses classified as held for sale (2025: HSBC Life (UK)
Limited; 2024: HSBC Assurances Vie (France). Further details are
provided on page 355.
Amounts payable on demand | ||||
(Audited) | ||||
2025 | 2024 | |||
Amounts payable on demand | Carrying amount for these contracts | Amounts payable on demand | Carrying amount for these contracts | |
$m | $m | $m | $m | |
Life direct participating and investment DPF contracts | 108,416 | 117,107 | 98,275 | 102,605 |
Life other contracts | 3,820 | 4,761 | 2,960 | 4,427 |
At 31 Dec | 112,236 | 121,868 | 101,235 | 107,032 |
(Audited)
Description and exposure
Insurance underwriting risk is the risk of loss through adverse
experience, in either timing or amount, of insurance underwriting
parameters (non-economic assumptions). These parameters include
mortality, morbidity, longevity, lapse and expense rates.
The principal risk we face is that, over time, the cost of the contract,
including claims and benefits, may exceed the total amount of
premiums and investment income received.
exposures by type of contract.
The insurance underwriting risk profile and related exposures remain
largely consistent with those observed at 31 December 2024.
Sensitivities (Audited)
The following table shows the sensitivity of the CSM, profit and total
equity of our insurance manufacturing subsidiaries to changes in non-
economic assumptions, after considering the impacts of reinsurance
contracts held as risk mitigation.
These sensitivities are prepared in accordance with current IFRS
Accounting Standards.
Sensitivity to lapse rates depends on the type of contracts
being written. An increase in lapse rates typically has a negative effect
on CSM (and therefore expected future profits) due to the loss
of future income on the lapsed policies. However, some contract
lapses have a positive effect on profit due to the existence of policy
surrender charges.
Mortality and morbidity risk is typically associated with life insurance
contracts. The effect on profit of an increase in mortality or morbidity
depends on the type of business being written.
Expense rate risk is the exposure to a change in the allocated cost
of administering insurance contracts. To the extent that increased
expenses cannot be passed on to policyholders, an increase in
expense rates will have a negative effect on CSM and profits.
The impact of changing insurance underwriting risk factors is primarily
absorbed within the CSM, unless contracts are onerous in which case
the impact is directly to profit. The impact of changes to the CSM is
released to profits over the expected coverage periods of the related
insurance contracts.
The 2025 sensitivities below exclude HSBC Assurances Vie (France)
following completion of its sale on 31 October 2025. Further details are
provided on page 355.
Sensitivity of HSBC’s insurance manufacturing subsidiaries to insurance underwriting risk factors | |||
(Audited) | |||
Effect on CSM | Effect on profit after tax for the year | Effect on total equity | |
At 31 Dec 2025 | $m | $m | $m |
10% increase in lapse rates | (310) | (6) | (6) |
10% decrease in lapse rates | 322 | 3 | 3 |
5% increase in mortality and/or morbidity rates | (85) | (15) | (17) |
5% decrease in mortality and/or morbidity rates | 87 | 12 | 14 |
10% increase in expense rates | (48) | (14) | (14) |
10% decrease in expense rates | 49 | 12 | 12 |
At 31 Dec 2024 | |||
10% increase in lapse rates | (282) | (21) | (30) |
10% decrease in lapse rates | 297 | 23 | 36 |
5% increase in mortality and/or morbidity rates | (92) | (16) | (20) |
5% decrease in mortality and/or morbidity rates | 102 | 14 | 23 |
10% increase in expense rates | (66) | (11) | (15) |
10% decrease in expense rates | 68 | 12 | 15 |