The bar chart and performance table below illustrate the variability of the Fund’s returns. The bar chart shows changes in the performance of the Fund’s Class C shares for each full calendar year since inception. The returns of the Fund’s other share class will differ from the returns of the Class C shares shown below because the expenses of the classes differ. The performance table shows how the Fund’s average annual total returns for certain time periods compared to the returns of the S&P 500 Total Return Index, a broad-based securities index, and the Dow Jones U.S. Select Dividend Total Return Index, an additional index with characteristics relevant to the Fund. The Fund’s past performance (before and after taxes) does not necessarily indicate how the Fund will perform in the future. The bar chart does not reflect sales load charges. Updated performance information, current through the most recent month end, is available by calling 1-888-229-9448.
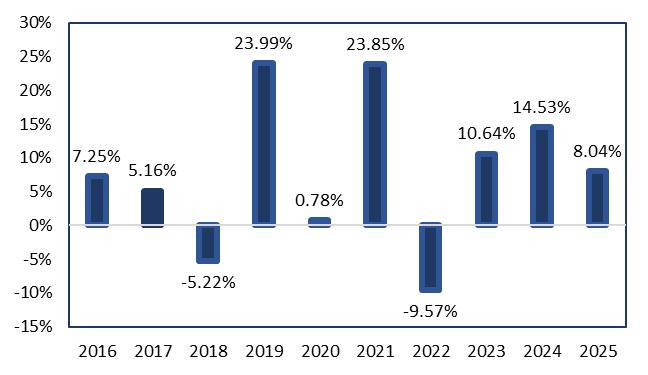
For the periods included in the bar chart:
| Best Quarter: | 11.46%, | |
| Worst Quarter: | (18.43%), |
After-tax returns are calculated using the historical highest federal marginal income tax rates and do not reflect the impact of state and local taxes. Actual after-tax returns depend on the investor’s tax situation and may differ from those shown, and after-tax returns shown are not relevant to investors who hold their Fund shares through tax-deferred arrangements such as 401(k) plans or individual retirement accounts. After-tax returns are shown for Class C shares only and after-tax returns for Class P will vary to the extent that each class has different expenses.
| Class C Shares | 1 Year | 5 Years | 10 Years* | |||
| Return Before Taxes | 7.04% | 8.92% | 7.43% | |||
| Return After Taxes on Distributions | 6.82% | 8.24% | 6.87% | |||
| Return After Taxes on Distributions and Sale of Fund Shares | 4.32% | 6.96% | 5.91% | |||
| S&P 500 Total Return Index* (reflects no deduction for fees, expenses or taxes) |
17.88% | 14.42% | 14.82% | |||
| Dow Jones U.S. Select Dividend Total Return Index (reflects no deduction for fees, expenses or taxes) |
12.12% | 12.43% | 10.83% |
| Class P Shares | 1 Year | 5 Years | 10 Years | |||
| Return Before Taxes | 9.03% | 10.02% | 8.52% | |||
| S&P
500 Total Return Index* (reflects no deduction for fees, expenses or taxes) |
17.88% | 14.42% | 14.82% | |||
| Dow Jones U.S. Select Dividend Total Return Index (reflects no deduction for fees, expenses or taxes) |
12.12% | 12.43% | 10.83% |
| * | Denotes Primary Benchmark |
You cannot invest directly in an index. Unlike mutual funds, an index does not incur expenses. If expenses were deducted, the actual returns of an index would be lower.