Feb. 26, 2026
The Fund's investment objective is to provide total return with a low to moderate correlation to traditional financial market indices.
This table describes the fees and expenses that you may pay if you buy, hold and sell shares of the Fund. Fees and expenses of Invesco Cayman Commodity Fund I Ltd., a wholly-owned subsidiary of the Fund (Subsidiary), are included in the table.
The table and Examples below do not reflect any transaction fees that may be charged by financial intermediaries or commissions that a shareholder may be required to pay directly to its financial intermediary when buying or selling Class Y or Class R6 shares. You may qualify for sales charge discounts if you and your family invest, or agree to invest in the future, at least $50,000 in the Invesco Funds. More information about these and other discounts is available from your financial professional and in the section “Shareholder Account Information – Initial Sales Charges (Class A Shares Only)” on page A-3 of the prospectus and the section “Purchase, Redemption and Pricing of Shares – Purchase and Redemption of Shares” on page L-1 of the statement of additional information (SAI).
| Shareholder Fees (fees paid directly from your investment) | ||||||
| Class: | A | C | R | Y | R5 | R6 |
| Maximum Sales Charge (Load) Imposed on Purchases (as a percentage of offering price) | 5.50 % | None | None | None | None | None |
| | ||||||
| Maximum Deferred Sales Charge (Load) (as a percentage of original purchase price or redemption proceeds, whichever is less) | None1 | 1.00 % | None | None | None | None |
| | ||||||
| Annual Fund Operating Expenses (expenses that you pay each year as a percentage of the value of your investment) | ||||||
| Class: | A | C | R | Y | R5 | R6 |
| Management Fees | 0.92 % | 0.92 % | 0.92 % | 0.92 % | 0.92 % | 0.92 % |
| | ||||||
| Distribution and/or Service (12b-1) Fees | 0.25 | 1.00 | 0.50 | None | None | None |
| | ||||||
| Other Expenses | 0.20 | 0.20 | 0.20 | 0.20 | 0.16 | 0.09 |
| | ||||||
| Acquired Fund Fees and Expenses | 0.09 | 0.09 | 0.09 | 0.09 | 0.09 | 0.09 |
| | ||||||
| Total Annual Fund Operating Expenses | 1.46 | 2.21 | 1.71 | 1.21 | 1.17 | 1.10 |
| | ||||||
| Fee Waiver and/or Expense Reimbursement2 | 0.05 | 0.05 | 0.05 | 0.05 | 0.05 | 0.05 |
| | ||||||
| Total Annual Fund Operating Expenses After Fee Waiver and/or Expense Reimbursement | 1.41 | 2.16 | 1.66 | 1.16 | 1.12 | 1.05 |
| | ||||||
| 1 | A contingent deferred sales charge may apply in some cases. See “Shareholder Account Information-Contingent Deferred Sales Charges (CDSCs).” |
| 2 | Invesco Advisers, Inc. (Invesco or the Adviser) has contractually agreed to waive a portion of the Fund’s management fee in an amount equal to the net management fee that Invesco earns on the Fund’s investments in certain affiliated funds, which will have the effect of reducing the Acquired Fund Fees and Expenses. Unless Invesco continues the fee waiver agreement, it will terminate on August 31, 2027. During its term, the fee waiver agreement cannot be terminated or amended to reduce the advisory fee waiver without approval of the Board of Trustees. |
This Example is intended to help you compare the cost of investing in the Fund with the cost of investing in other mutual funds.
The Example assumes that you invest $10,000 in the Fund for the time periods indicated and then redeem all of your shares at the end of those periods. This Example does not include commissions and/or other forms of compensation that investors may pay on transactions in Class Y and Class R6 shares. The Example also assumes that your investment has a 5% return each year and that the Fund’s operating expenses remain equal to the Total Annual Fund Operating Expenses After Fee Waiver and/or Expense
Reimbursement in the first year and the Total Annual Fund Operating Expenses thereafter.
Although your actual costs may be higher or lower, based on these assumptions, your costs would be:
| | 1 Year | 3 Years | 5 Years | 10 Years |
| Class A | $686 | $982 | $1,299 | $2,196 |
| | ||||
| Class C | $319 | $686 | $1,180 | $2,351 |
| | ||||
| Class R | $169 | $534 | $923 | $2,015 |
| | ||||
| Class Y | $118 | $379 | $660 | $1,462 |
| | ||||
| Class R5 | $114 | $367 | $639 | $1,416 |
| | ||||
| Class R6 | $107 | $345 | $601 | $1,336 |
| | ||||
You would pay the following expenses if you did not redeem your shares:
|
|
1 Year
|
3 Years
|
5 Years
|
10 Years
|
|
Class A
|
$686 |
$982 |
$1,299 |
$2,196 |
|
|
||||
|
Class C
|
$219 |
$686 |
$1,180 |
$2,351 |
|
|
||||
|
Class R
|
$169 |
$534 |
$923 |
$2,015 |
|
|
||||
|
Class Y
|
$118 |
$379 |
$660 |
$1,462 |
|
|
||||
|
Class R5
|
$114 |
$367 |
$639 |
$1,416 |
|
|
||||
|
Class R6
|
$107 |
$345 |
$601 |
$1,336 |
|
|
||||
The Fund pays transaction costs, such as commissions, when it buys and sells securities (or “turns over” its portfolio). A higher portfolio turnover rate may indicate higher transaction costs and may result in higher taxes when Fund shares are held in a taxable account. These costs, which are not reflected in annual fund operating expenses or in the Example, affect the Fund’s performance. During the most recent fiscal year, the Fund’s portfolio turnover rate was 19% of the average value of its portfolio.
The Fund’s investment strategy is designed to provide capital loss protection during down markets by investing across multiple macro factors. Under normal market conditions, the Fund’s portfolio management team allocates across three macro factors: growth, defensive and real return, such that no one macro factor drives the Fund’s performance. The Fund’s exposure to these three macro factors will be achieved primarily through investments in derivative instruments (generally having aggregate notional exposure exceeding 65% of the Fund’s net assets), including but not limited to futures, options, currency forward contracts and swap agreements. The portfolio managers manage the Fund’s portfolio using two different processes. One is strategic asset allocation, which the portfolio managers use to express their long-term views of the market. The portfolio managers apply their strategic process to, on average, approximately 80% of the Fund’s portfolio risk, as determined by the portfolio managers’ proprietary risk analysis. The other process is tactical asset allocation, which is used by the portfolio managers to reflect their shorter-term views of the market. The strategic and tactical processes are intended to adjust the Fund’s portfolio risk in a variety of market conditions.
The portfolio managers implement their investment decisions primarily through the use of derivatives and other investments that create leverage. The Fund uses derivatives and other leveraged instruments to create and adjust exposures to the three macro factors. The portfolio managers make these adjustments to balance risk exposure when they believe it will benefit the Fund. Using derivatives often allows the portfolio managers to implement their views more efficiently and to gain more exposure to the macro factors than investing in more traditional assets such as stocks and bonds would allow. The Fund may hold long and short positions in
derivatives and in investments in each of the three macro factors; however, the Fund will typically maintain net long exposure to each macro factor, such that the Fund is expected to benefit from general price appreciation of investments in that macro factor. The Fund’s use of derivatives and the leveraged investment exposure created by its use of derivatives are expected to be significant and greater than most mutual funds. The Fund may use quantitative models as part of the investment selection process.
The Fund’s net asset value over a short to intermediate term is expected to be volatile because of the significant use of derivatives and other instruments that provide leverage, including futures contracts, options, swaps and commodity-linked notes. Volatility measures the range of returns of a security, fund, index or other investment, as indicated by the annualized standard deviation of its returns. Higher volatility generally indicates higher risk and is often reflected by frequent and sometimes significant movements up and down in value. The Fund will have the potential for greater gains, as well as the potential for greater losses, than if the Fund did not use derivatives or other instruments that have a leveraging effect. Leveraging tends to magnify, sometimes significantly depending on the amount of leverage used, the effect of any increase or decrease in the Fund’s exposure to a macro factor and may cause the Fund’s net asset value to be more volatile than a fund that does not use leverage. For example, if the Fund gains exposure to a specific macro factor through an instrument that provides leveraged exposure to the class, and that leveraged instrument increases in value, the gain to the Fund will be magnified; however, if the leveraged instrument decreases in value, the loss to the Fund will be magnified.
The Adviser’s investment process has three steps. The first step involves investment selection within the three macro factors. The portfolio managers select investments to represent each of the three macro factors from a universe of over fifty investments. The selection process (1) evaluates a particular investment’s theoretical case for long-term excess returns relative to cash; (2) screens the identified investments against minimum liquidity criteria; and (3) reviews the expected correlation among the investments, meaning the likelihood that the value of the investments will move in the same direction at the same time, and the expected risk of each investment to determine whether the selected investments are likely to improve the expected risk adjusted return of the Fund.
The second step in the investment process involves portfolio construction. The portfolio managers use their own estimates for risk and correlation to weight each macro factor and the investments within each macro factor selected in the first step to construct a portfolio that they believe is risk-balanced across the three macro factors. Periodically, the management team re-estimates the risk contributed by each macro factor and investment and rebalances the portfolio; the portfolio also may be rebalanced when the Fund makes new investments. Taken together, the first two steps in the process result in the strategic allocation.
In the third step of the investment process, using a systematic approach based on fundamental principles, the portfolio management team analyzes the macro factors and investments, considering the following factors: valuation, economic environment and historic price movements. Regarding valuation, the portfolio managers evaluate whether a macro factor and investments in that macro factor are attractively priced relative to fundamentals. Next, the portfolio managers assess the economic environment and consider the effect that monetary policy and other determinants of economic growth, inflation and market volatility will have on a macro factor and related investments. Lastly, the portfolio managers assess the impact of historic price movements for each macro factor and related investments on likely future returns.
Utilizing the results from the analysis described above, the portfolio managers determine tactical short-term over-weight positions (incurring additional exposure relative to the strategic allocation) and under-weight positions (incurring less exposure relative to the strategic allocation) for the macro factors and investments. The management team actively adjusts portfolio positions to reflect the near-term market environment, while
remaining consistent with the balanced-risk long-term portfolio structure described in step two above.
The Fund’s growth exposure will be achieved primarily through investments in derivatives that track equity indices comprised of shares of companies in developed and/or emerging market countries, including equity indices that emphasize exposure to companies associated with certain characteristics, known as style factors, including high dividend, quality, value, growth, low volatility, size (large-, mid- or small-cap) and momentum. In addition, the Fund may invest directly in shares of such companies and in exchange-traded funds (ETFs) that provide equity exposure, including ETFs that track factor-based indices that emphasize the style factors noted above. The Fund may also buy and write (sell) put and call options on equities, equity indices and ETFs, including in combination, to adjust the Fund’s equity exposure or to generate income. Additionally, the Fund can use currency forward contracts to hedge against the risk that the value of the foreign currencies in which its equity investments are denominated will depreciate against the U.S. dollar.
The Fund’s defensive exposure will be achieved primarily through derivatives that offer exposure to the debt or credit of issuers in developed and/or emerging markets that are rated investment grade or are unrated but deemed to be investment grade quality by the Adviser, including U.S. and foreign government debt securities having intermediate (5 – 10 years) and long (10 plus years) term maturity.
The Fund’s real return exposure will be achieved primarily through investments in commodity futures and swaps, commodity related ETFs and exchange-traded notes (ETNs) and commodity-linked notes, some or all of which will be owned through Invesco Cayman Commodity Fund I Ltd., a wholly-owned subsidiary of the Fund organized under the laws of the Cayman Islands (Subsidiary). The commodity investments will be focused in four sectors of the commodities market: energy, precious metals, industrial metals and agriculture/livestock.
The Fund will invest in the Subsidiary to gain exposure to commodities markets. The Subsidiary, in turn, will invest in commodity futures and swaps, commodity related ETFs and ETNs and commodity-linked notes. The Subsidiary is advised by the Adviser, has the same investment objective as the Fund and generally employs the same investment strategy. Unlike the Fund, however, the Subsidiary may invest without limitation in commodity-linked derivatives and other investments that may provide leveraged and non-leveraged exposure to commodities. The Subsidiary holds cash and can invest in cash equivalent instruments, including affiliated money market funds, some or all of which may serve as margin or collateral for the Subsidiary’s derivative positions. Because the Subsidiary is wholly-owned by the Fund, the Fund will be subject to the risks associated with any investment by the Subsidiary.
A commodity-linked note is a debt security issued by a bank or other sponsor that pays a return linked to the performance of a commodities index or basket of commodity futures contracts. In some cases, the return will be based on a multiple of the performance of the index or basket and this embedded leverage will magnify the positive return or losses the Fund earns from these notes as compared to the performance of the index or basket.
The Fund generally will maintain a substantial portion of its net assets (including assets held by the Subsidiary) in cash and cash equivalent instruments, including affiliated money market funds, as margin or collateral for the Fund’s obligations under derivative transactions, or for cash management purposes. The larger the value of the Fund’s derivative positions, as opposed to positions held in non-derivative instruments, the more the Fund will be required to maintain cash and cash equivalents as margin or collateral for such derivatives.
The bar chart and performance table provide an indication of the risks of investing in the Fund. The bar chart shows changes in the performance of the Fund from year to year as of December 31. The performance table compares the Fund's performance to that of a style-specific benchmark and a broad-based securities market benchmark (in that order). The Fund's past performance (before and after taxes) is not necessarily an indication of its future performance.
Fund performance reflects any applicable fee waivers and expense reimbursements. Performance returns would be lower without applicable fee waivers and expense reimbursements.
All Fund performance shown assumes the reinvestment of dividends and capital gains and the effect of the Fund’s expenses.
Updated performance information is available on the Fund's website at www.invesco.com/us.
The bar chart does not reflect sales loads. If it did, the annual total returns shown would be lower.
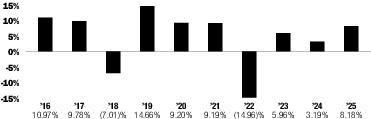
| Class A | Period Ended | Returns |
| Best Quarter | December 31, 2020 | 10.48% |
| Worst Quarter | March 31, 2020 | -12.14% |
| | Inception Date | 1 Year | 5 Years | 10 Years |
| Class A | | | | |
| Return Before Taxes | 6/2/2009 | 2.28 % | 0.75 % | 3.94 % |
| Return After Taxes on Distributions | | 0.91 | -2.30 | 1.41 |
| Return After Taxes on Distributions and Sale of Fund Shares | | 1.34 | -0.63 | 2.05 |
| | ||||
| Class C | 6/2/2009 | 6.34 | 1.12 | 3.91 |
| | ||||
| Class R | 6/2/2009 | 8.00 | 1.63 | 4.27 |
| | ||||
| Class Y | 6/2/2009 | 8.48 | 2.15 | 4.80 |
| | ||||
| Class R5 | 6/2/2009 | 8.40 | 2.17 | 4.83 |
| | ||||
| Class R6 | 9/24/2012 | 8.58 | 2.24 | 4.91 |
| | ||||
| Custom Invesco Balanced Risk Allocation Style Index is composed of 60% MSCI World Index (Net) (reflects reinvested dividends net of withholding taxes, but reflects no deduction for fees, expenses or other taxes) and 40% Bloomberg U.S. Aggregate Bond Index (reflects no deduction for fees, expenses or taxes) | | 15.70 | 7.24 | 8.32 |
| | ||||
| MSCI ACWI Index (Net) (reflects reinvested dividends net of withholding taxes, but reflects no deduction for fees, expenses or other taxes) | | 22.34 | 11.19 | 11.72 |
| | ||||
After-tax returns are calculated using the historical highest individual federal marginal income tax rates and do not reflect the impact of state and local taxes. Actual after-tax returns depend on an investor's tax situation and may differ from those shown, and after-tax returns shown are not relevant to investors who hold their Fund shares through tax-advantaged arrangements, such as 401(k) plans, 529 college savings plans or individual retirement accounts. After-tax returns are shown for Class A shares only and after-tax returns for other classes will vary.