Feb. 26, 2026
The Fund’s investment objective is to seek total return.
This table describes the fees and expenses that you may pay if you buy, hold and sell shares of the Fund.
The table and Examples below do not reflect any transaction fees that may be charged by financial intermediaries or commissions that a shareholder may be required to pay directly to its financial intermediary when buying or selling Class Y or Class R6 shares. You may qualify for sales charge discounts if you and your family invest, or agree to invest in the future, at least $50,000 in the Invesco Funds. More information about these and other discounts is available from your financial professional and in the section “Shareholder Account Information – Initial Sales Charges (Class A Shares Only)” on page A-3 of the prospectus and the section “Purchase, Redemption and Pricing of Shares – Purchase and Redemption of Shares” on page L-1 of the statement of additional information (SAI).
| Shareholder Fees (fees paid directly from your investment) | ||||||
| Class: | A | C | R | Y | R5 | R6 |
| Maximum Sales Charge (Load) Imposed on Purchases (as a percentage of offering price) | 4.25 % | None | None | None | None | None |
| | ||||||
| Maximum Deferred Sales Charge (Load) (as a percentage of original purchase price or redemption proceeds, whichever is less) | None1 | 1.00 % | None | None | None | None |
| | ||||||
| Annual Fund Operating Expenses (expenses that you pay each year as a percentage of the value of your investment) | ||||||
| Class: | A | C | R | Y | R5 | R6 |
| Management Fees | 0.69 % | 0.69 % | 0.69 % | 0.69 % | 0.69 % | 0.69 % |
| | ||||||
| Distribution and/or Service (12b-1) Fees | 0.24 | 1.00 | 0.50 | None | None | None |
| | ||||||
| Other Expenses | 0.61 | 0.61 | 0.61 | 0.61 | 0.42 | 0.42 |
| | ||||||
| Acquired Fund Fees and Expenses | 0.01 | 0.01 | 0.01 | 0.01 | 0.01 | 0.01 |
| | ||||||
| Total Annual Fund Operating Expenses | 1.55 | 2.31 | 1.81 | 1.31 | 1.12 | 1.12 |
| | ||||||
| Fee Waiver and/or Expense Reimbursement2 | 0.35 | 0.36 | 0.36 | 0.36 | 0.37 | 0.37 |
| | ||||||
| Total Annual Fund Operating Expenses After Fee Waiver and/or Expense Reimbursement | 1.20 | 1.95 | 1.45 | 0.95 | 0.75 | 0.75 |
| | ||||||
| 1 | A contingent deferred sales charge may apply in some cases. See “Shareholder Account Information-Contingent Deferred Sales Charges (CDSCs).” |
| 2 | Invesco Advisers, Inc. (Invesco or the Adviser) has contractually agreed, through February 28, 2026, to waive advisory fees and/or reimburse expenses to the extent necessary to limit Total Annual Fund Operating Expenses After Fee Waiver and/or Expense Reimbursement (excluding Acquired Fund Fees and Expenses and certain items discussed in the SAI) of Class A, Class C, Class R, Class Y, Class R5 and Class R6 shares to 1.20%, 1.95%, 1.45%, 0.95%, 0.95% and 0.95%, respectively, of the Fund’s average daily net assets (the “expense limits”). Effective March 1, 2026, the Adviser has contractually agreed to waive advisory fees and/or reimburse expenses to the extent necessary to limit Total Annual Fund Operating Expenses After Fee Waiver and/or Expense Reimbursement (excluding Acquired Fund Fees and Expenses and certain items discussed in the SAI) of Class A, Class C, Class R, Class Y, Class R5 and Class R6 shares to 1.20%, 1.95%, 1.45%, 0.95%, 0.75% and 0.75%, respectively, of the Fund’s average daily net assets. Invesco has also contractually agreed to waive a portion of the Fund’s management fee in an amount equal to the net management fee that Invesco earns on the Fund’s investments in certain affiliated funds, which will have the effect of reducing the Acquired Fund Fees and Expenses. Unless Invesco continues the fee waiver agreements, they will terminate on February 28, 2027 and August 31, 2027, respectively. During their terms, the fee waiver agreements cannot be terminated or amended to increase the expense limits or reduce the advisory fee waiver without approval of the Board of Trustees. |
This Example is intended to help you compare the cost of investing in the Fund with the cost of investing in other mutual funds.
The Example assumes that you invest $10,000 in the Fund for the time periods indicated and then redeem all of your shares at the end of those periods. This Example does not include commissions and/or other forms of compensation that investors may pay on transactions in Class Y and Class R6 shares. The Example also assumes that your investment has a 5% return each year and that the Fund’s operating expenses remain equal to the Total Annual Fund Operating Expenses After Fee Waiver and/or Expense Reimbursement in the first year and the Total Annual Fund Operating Expenses thereafter.
Although your actual costs may be higher or lower, based on these assumptions, your costs would be:
| | 1 Year | 3 Years | 5 Years | 10 Years |
| Class A | $542 | $861 | $1,202 | $2,164 |
| | ||||
| Class C | $298 | $687 | $1,203 | $2,428 |
| | ||||
| Class R | $148 | $534 | $946 | $2,097 |
| | ||||
| Class Y | $97 | $380 | $684 | $1,547 |
| | ||||
| Class R5 | $77 | $319 | $581 | $1,330 |
| | ||||
| Class R6 | $77 | $319 | $581 | $1,330 |
| | ||||
You would pay the following expenses if you did not redeem your shares:
|
|
1 Year
|
3 Years
|
5 Years
|
10 Years
|
|
Class A
|
$542 |
$861 |
$1,202 |
$2,164 |
|
|
||||
|
Class C
|
$198 |
$687 |
$1,203 |
$2,428 |
|
|
||||
|
Class R
|
$148 |
$534 |
$946 |
$2,097 |
|
|
||||
|
Class Y
|
$97 |
$380 |
$684 |
$1,547 |
|
|
||||
|
Class R5
|
$77 |
$319 |
$581 |
$1,330 |
|
|
||||
|
Class R6
|
$77 |
$319 |
$581 |
$1,330 |
|
|
||||
The Fund pays transaction costs, such as commissions, when it buys and sells securities (or “turns over” its portfolio). A higher portfolio turnover rate may indicate higher transaction costs and may result in higher taxes when Fund shares are held in a taxable account. These costs, which are not reflected in annual fund operating expenses or in the Example, affect the Fund’s performance. During the most recent fiscal year, the Fund’s portfolio turnover rate was 114% of the average value of its portfolio.
Under normal market conditions, determined by the Adviser in its discretion, the Fund invests at least 80% of its net assets (plus borrowings for investment purposes) in debt securities that are economically tied to emerging market countries and denominated in local (non-U.S.) currencies, and in derivatives and other instruments that have economic characteristics similar to such securities. The Fund typically invests in at least three emerging market countries, i.e., those that are generally in the early stages of their industrial cycles. Debt securities that the Fund considers to be economically tied to emerging market countries include debt securities issued by sovereign entities of emerging market countries, or corporations that are organized, headquartered or domiciled, or whose principal activities or country of risk, as determined by a third party service provider, are in emerging market countries. The Fund can invest in various types of debt securities, generally referred to as “bonds,” including government bonds, corporate debt obligations, “structured” notes, participation interests in loans, “zero coupon” or “stripped” securities, certain mortgage-related securities or asset-backed securities and other debt obligations.
The Fund may buy securities issued by companies of any size or market capitalization range and at times might emphasize securities of issuers in a
particular capitalization range. It can invest in debt securities having short, intermediate or long maturities.
The Fund does not limit its investments to a particular credit quality or rating category and can invest without limit in securities rated or that are below investment grade (also referred to as “junk bonds”). “Investment grade” debt securities are rated in one of the top four categories by nationally recognized statistical rating organizations such as Moody’s Ratings (Moody’s) or S&P Global Ratings (S&P). If two or more nationally recognized statistical rating organizations have assigned different ratings to a security, the investment adviser uses the highest rating assigned. The Fund may also invest in unrated securities, in which case the Adviser may internally assign ratings to certain of those securities, after assessing their credit quality, in categories similar to those of nationally recognized statistical rating organizations.
The Fund also uses derivatives to seek increased returns or to try manage investment risks, including, for example, options, forward contracts, futures contracts, swaps and “structured” notes.
The Fund is non-diversified, which means it can invest a greater percentage of its assets in a small group of issuers or any one issuer than a diversified fund can.
In selecting securities, the portfolio managers evaluate the overall investment opportunities and risks in individual national economies. The portfolio managers analyze the business cycle, political factors and exchange rates across countries. As part of the Fund’s investment process, to implement its investment strategy in pursuit of its investment objective, the Fund’s portfolio managers also consider both quantitative and qualitative environmental, social and governance (“ESG”) factors they believe to be material to understanding an issuers fundamentals and apply a scoring methodology designed to determine which securities are eligible to include in the Fund's portfolio. The Adviser generally seeks to exclude investments with low ESG scores. This analysis may involve the use of third-party research as well as proprietary research. Consideration of ESG factors is just one component of the portfolio managers’ assessment of issuers eligible for investment and not necessarily determinative of an investment decision. Therefore, the Fund’s portfolio managers may still invest in securities of issuers with a high ESG risk profile. The ESG factors considered by the Fund’s portfolio managers may change over time and one or more factors may not be relevant with respect to all issuers eligible for investment and ESG considerations may not be applied to each issuer or Fund investment.
The Fund currently focuses on investment opportunities for higher yields than are available in U.S. markets and opportunities in investments denominated in foreign currencies that compare favorably to the U.S. dollar. The portfolio managers seek to actively manage foreign currency exposure both to help reduce risk and to seek to enhance return. These factors may vary in particular cases and, along with the Fund’s investment focus, may change over time.
In attempting to meet its investment objective or to manage subscription and redemption requests, the Fund may engage in active and frequent trading of portfolio securities.
The bar chart and performance table provide an indication of the risks of investing in the Fund. The Fund has adopted the performance of the Oppenheimer Emerging Markets Local Debt Fund (the predecessor fund) as the result of a reorganization of the predecessor fund into the Fund, which was consummated after the close of business on May 24, 2019 (the “Reorganization”). Prior to the Reorganization, the Fund had not yet commenced operations. The bar chart shows changes in the performance of the predecessor fund and the Fund from year to year as of December 31. The performance table compares the predecessor fund’s and the Fund’s performance to that of a broad measure of market performance and an additional index with characteristics relevant to the Fund. The Fund’s (and the predecessor fund’s) past performance (before and after taxes) is not necessarily an indication of how the Fund will perform in the future.
Class A, Class C, Class R, Class Y and Class I shares of the predecessor fund were reorganized into Class A, Class C, Class R, Class Y and Class R6 shares, respectively, of the Fund after the close of business on May 24, 2019. Class A, Class C, Class R, Class Y and Class R6 shares’ returns of the Fund will be different from the returns of the predecessor fund as they have different expenses. Performance for Class A shares has been restated to reflect the Fund’s applicable sales charge. Fund performance reflects any applicable fee waivers and expense reimbursements. Performance returns would be lower without applicable fee waivers and expense reimbursements.
All Fund performance shown assumes the reinvestment of dividends and capital gains and the effect of the Fund’s expenses.
Updated performance information is available on the Fund’s website at www.invesco.com/us.
The bar chart does not reflect sales loads. If it did, the annual total returns shown would be lower.
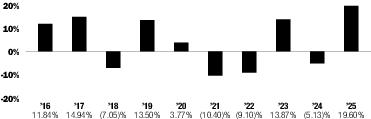
| Class A | Period Ended | Returns |
| Best Quarter | June 30, 2020 | 11.81% |
| Worst Quarter | March 31, 2020 | -15.51% |
| | Inception Date | 1 Year | 5 Years | 10 Years |
| Class A | | | | |
| Return Before Taxes | 6/30/2010 | 14.58 % | 0.16 % | 3.56 % |
| Return After Taxes on Distributions | | 12.29 | -1.34 | 0.30 |
| Return After Taxes on Distributions and Sale of Fund Shares | | 8.55 | -0.56 | 0.74 |
| | ||||
| Class C | 6/30/2010 | 17.48 | 0.25 | 3.32 |
| | ||||
| Class R | 6/30/2010 | 19.07 | 0.76 | 3.70 |
| | ||||
| Class Y | 6/30/2010 | 19.65 | 1.27 | 4.25 |
| | ||||
| Class R5 | 5/24/2019 | 19.65 | 1.35 | 4.20 1 |
| | ||||
| Class R6 | 9/28/2012 | 19.89 | 1.33 | 4.33 |
| | ||||
| JP Morgan Government Bond Index - Emerging Markets (GBI-EM) Global Diversified Index (reflects no deduction for fees, expenses or taxes) | | 19.26 | 1.12 | 3.88 |
| | ||||
| Bloomberg Global Aggregate ex-U.S. Index (reflects no deduction for fees, expenses or taxes) | | 8.85 | -3.59 | 0.56 |
| | ||||
1
Performance shown on or prior to the inception date is that of the predecessor fund's Class A shares at net asset value and includes the 12b-1 fees applicable to that class. Although invested in the same portfolio of securities, Class R5 shares' returns of the Fund will be different from Class A shares' returns of the Fund as they have different expenses.
After-tax returns are calculated using the historical highest individual federal marginal income tax rates and do not reflect the impact of state and local taxes. Actual after-tax returns depend on an investor's tax situation and may differ from those shown, and after-tax returns shown are not relevant to investors who hold their Fund shares through tax-advantaged arrangements, such as 401(k) plans, 529 college savings plans or individual retirement accounts. After-tax returns are shown for Class A shares only and after-tax returns for other classes will vary.