Performance Management
|
Mar. 01, 2026 |
| ACADIAN EMERGING MARKETS PORTFOLIO |
|
| Prospectus [Line Items] |
|
| Bar Chart and Performance Table [Heading] |
Performance Information
|
| Performance Narrative [Text Block] |
The bar chart and the performance table below illustrate the risks and volatility of an investment in the Fund by showing changes in the Fund’s Investor Class Shares’ performance from year to year for the past 10 years and by showing how the Fund’s average annual total returns for 1, 5 and 10 years and since inception compare with those of a broad measure of market performance. Of course, the Fund’s past performance (before and after taxes) does not necessarily indicate how the Fund will perform in the future.
Prior to October 31, 2016, the Fund’s Investor Class Shares were called “Institutional Class Shares,” and were not subject to the shareholder servicing fees currently applicable to Investor Class Shares. The Investor Class Shares performance provided below for the periods prior to October 31, 2016 represents the performance of Investor Class Shares when they were called Institutional Class Shares and does not include the shareholder servicing fees currently applicable to Investor Class Shares.
Updated performance information is available by calling 1-866-AAM-6161.
|
| Performance Past Does Not Indicate Future [Text] |
Of course, the Fund’s past performance (before and after taxes) does not necessarily indicate how the Fund will perform in the future.
|
| Performance Information Illustrates Variability of Returns [Text] |
The bar chart and the performance table below illustrate the risks and volatility of an investment in the Fund by showing changes in the Fund’s Investor Class Shares’ performance from year to year for the past 10 years and by showing how the Fund’s average annual total returns for 1, 5 and 10 years and since inception compare with those of a broad measure of market performance.
|
| Bar Chart Closing [Text Block] |
BEST QUARTER |
WORST QUARTER |
17.71% |
(25.28)% |
12/31/2020 |
3/31/2020 |
|
| Performance Table Heading |
Average Annual Total Returns for Periods Ended December 31, 2025
|
| Performance Table Narrative |
This table compares the Fund’s average annual total returns for the periods ended December 31, 2025 to those of an appropriate broad-based index.
After-tax returns are calculated using the historical highest individual federal marginal income tax rates and do not reflect the impact of state and local taxes. Actual after-tax returns depend on an investor’s tax situation and may differ from those shown. After-tax returns shown are not relevant to investors who hold their Fund shares through tax-deferred arrangements such as 401(k) plans or individual retirement accounts (“IRAs”). After-tax returns are shown for Investor Class Shares only. After-tax returns for Y Class Shares and I Class Shares will vary.
|
| Performance Table Uses Highest Federal Rate |
After-tax returns are calculated using the historical highest individual federal marginal income tax rates and do not reflect the impact of state and local taxes.
|
| Performance Table Not Relevant to Tax Deferred |
After-tax returns shown are not relevant to investors who hold their Fund shares through tax-deferred arrangements such as 401(k) plans or individual retirement accounts (“IRAs”).
|
| Performance Table One Class of after Tax Shown [Text] |
After-tax returns are shown for Investor Class Shares only. After-tax returns for Y Class Shares and I Class Shares will vary.
|
| Performance Availability Phone [Text] |
1-866-AAM-6161
|
| ACADIAN EMERGING MARKETS PORTFOLIO | Investor Class Shares | ACADIAN EMERGING MARKETS PORTFOLIO |
|
| Prospectus [Line Items] |
|
| Highest Quarterly Return, Label [Optional Text] |
BEST QUARTER
|
| Highest Quarterly Return |
17.71%
|
| Highest Quarterly Return, Date |
Dec. 31, 2020
|
| Lowest Quarterly Return, Label [Optional Text] |
WORST QUARTER
|
| Lowest Quarterly Return |
(25.28%)
|
| Lowest Quarterly Return, Date |
Mar. 31, 2020
|
| CAMBIAR OPPORTUNITY FUND |
|
| Prospectus [Line Items] |
|
| Bar Chart and Performance Table [Heading] |
Performance Information
|
| Performance Narrative [Text Block] |
The bar chart and the performance table below illustrate the risks and volatility of an investment in the Fund by showing changes in the Fund’s Investor Class Shares’ performance from year to year for the past 10 years and by showing how the Fund’s average annual total returns for 1, 5 and 10 years and since inception compare with those of a broad measure of equity market performance generally, as well as a narrower index with characteristics more relevant to the Fund’s investment strategies (Russell 1000® Value Index). Of course, the Fund’s past performance (before and after taxes) does not necessarily indicate how the Fund will perform in the future.
Updated performance information is available at www.cambiar.com or by calling 1-866-777-8227.
|
| Performance Past Does Not Indicate Future [Text] |
Of course, the Fund’s past performance (before and after taxes) does not necessarily indicate how the Fund will perform in the future.
|
| Performance Information Illustrates Variability of Returns [Text] |
The bar chart and the performance table below illustrate the risks and volatility of an investment in the Fund by showing changes in the Fund’s Investor Class Shares’ performance from year to year for the past 10 years and by showing how the Fund’s average annual total returns for 1, 5 and 10 years and since inception compare with those of a broad measure of equity market performance generally, as well as a narrower index with characteristics more relevant to the Fund’s investment strategies (Russell 1000® Value Index).
|
| Bar Chart Closing [Text Block] |
During the periods shown in the chart, the Fund’s Investor Class Shares’ highest return for a quarter was 19.25% (quarter ended 6/30/2020) and the lowest return for a quarter was (21.60)% (quarter ended 3/31/2020).
|
| Performance Table Heading |
Average Annual Total Returns for Periods Ended December 31, 2025
|
| Performance Table Narrative |
After-tax returns are calculated using the historical highest individual federal marginal income tax rates and do not reflect the impact of state and local taxes. Actual after-tax returns depend on an investor’s tax situation and may differ from those shown. After-tax returns shown are not relevant to investors who hold their Fund shares through tax-deferred arrangements, such as 401(k) plans or individual retirement accounts (“IRAs”). After-tax returns are shown for only the Investor Class Shares. After-tax returns for Institutional Class Shares will vary.
Institutional
Class Shares of the Fund commenced operations on November 3, 2005. As a result, the performance information provided for Institutional
Class Shares incorporates the returns of Investor Class Shares of the Fund for periods before November 3, 2005. Institutional Class Shares
would have substantially similar performance as Investor Class Shares because the shares are invested in the same portfolio of securities
and the annual returns would generally differ only to the extent that total expenses of Institutional Class Shares are lower.
|
| Performance Table Uses Highest Federal Rate |
After-tax returns are calculated using the historical highest individual federal marginal income tax rates and do not reflect the impact of state and local taxes.
|
| Performance Table Not Relevant to Tax Deferred |
After-tax returns shown are not relevant to investors who hold their Fund shares through tax-deferred arrangements, such as 401(k) plans or individual retirement accounts (“IRAs”).
|
| Performance Table One Class of after Tax Shown [Text] |
After-tax returns are shown for only the Investor Class Shares. After-tax returns for Institutional Class Shares will vary.
|
| Performance Availability Website Address [Text] |
www.cambiar.com
|
| Performance Availability Phone [Text] |
1-866-777-8227
|
| CAMBIAR OPPORTUNITY FUND | INVESTOR CLASS SHARES |
|
| Prospectus [Line Items] |
|
| Highest Quarterly Return, Label [Optional Text] |
highest return for a quarter
|
| Highest Quarterly Return |
19.25%
|
| Highest Quarterly Return, Date |
Jun. 30, 2020
|
| Lowest Quarterly Return, Label [Optional Text] |
lowest return for a quarter
|
| Lowest Quarterly Return |
(21.60%)
|
| Lowest Quarterly Return, Date |
Mar. 31, 2020
|
| CAMBIAR INTERNATIONAL EQUITY FUND |
|
| Prospectus [Line Items] |
|
| Bar Chart and Performance Table [Heading] |
Performance Information
|
| Performance Narrative [Text Block] |
The bar chart and the performance table below illustrate the risks and volatility of an investment in the Fund by showing changes in the Fund’s Investor Class Shares’ performance from year to year for the past 10 years and by showing how the Fund’s average annual total returns for 1, 5 and 10 years and since inception compare with those of a broad measure of market performance. Of course, the Fund’s past performance (before and after taxes) does not necessarily indicate how the Fund will perform in the future.
Updated performance information is available at www.cambiar.com or by calling 1-866-777-8227.
|
| Performance Past Does Not Indicate Future [Text] |
Of course, the Fund’s past performance (before and after taxes) does not necessarily indicate how the Fund will perform in the future.
|
| Performance Information Illustrates Variability of Returns [Text] |
The bar chart and the performance table below illustrate the risks and volatility of an investment in the Fund by showing changes in the Fund’s Investor Class Shares’ performance from year to year for the past 10 years and by showing how the Fund’s average annual total returns for 1, 5 and 10 years and since inception compare with those of a broad measure of market performance.
|
| Bar Chart Closing [Text Block] |
During the periods shown in the chart, the Fund’s Investor Class Shares’ highest return for a quarter was 16.75% (quarter ended 12/31/2022) and the lowest return for a quarter was (27.05)% (quarter ended 3/31/2020).
|
| Performance Table Heading |
Average Annual Total Returns for Periods Ended December 31, 2025
|
| Performance Table Narrative |
After-tax returns are calculated using the historical highest individual federal marginal income tax rates and do not reflect the impact of state and local taxes. Actual after-tax returns depend on an investor’s tax situation and may differ from those shown. After-tax returns shown are not relevant to investors who hold their Fund shares through tax-deferred arrangements, such as 401(k) plans or individual retirement accounts (“IRAs”). After-tax returns are shown for only the Investor Class Shares. After-tax returns for Institutional Class Shares will vary.
Institutional
Class Shares of the Fund commenced operations on November 30, 2012. As a result, the performance information provided for Institutional
Class Shares incorporates the returns of Investor Class Shares of the Fund for periods before November 30, 2012. Institutional Class
Shares would have substantially similar performance as Investor Class Shares because the shares are invested in the same portfolio of
securities and the annual returns would generally differ only to the extent that total expenses of Institutional Class Shares are lower.
|
| Performance Table Uses Highest Federal Rate |
After-tax returns are calculated using the historical highest individual federal marginal income tax rates and do not reflect the impact of state and local taxes.
|
| Performance Table Not Relevant to Tax Deferred |
Actual after-tax returns depend on an investor’s tax situation and may differ from those shown. After-tax returns shown are not relevant to investors who hold their Fund shares through tax-deferred arrangements, such as 401(k) plans or individual retirement accounts (“IRAs”).
|
| Performance Table One Class of after Tax Shown [Text] |
After-tax returns are shown for only the Investor Class Shares. After-tax returns for Institutional Class Shares will vary.
|
| Performance Availability Website Address [Text] |
www.cambiar.com
|
| Performance Availability Phone [Text] |
1-866-777-8227
|
| CAMBIAR INTERNATIONAL EQUITY FUND | INVESTOR CLASS SHARES |
|
| Prospectus [Line Items] |
|
| Highest Quarterly Return, Label [Optional Text] |
highest return for a quarter
|
| Highest Quarterly Return |
16.75%
|
| Highest Quarterly Return, Date |
Dec. 31, 2022
|
| Lowest Quarterly Return, Label [Optional Text] |
lowest return for a quarter
|
| Lowest Quarterly Return |
(27.05%)
|
| Lowest Quarterly Return, Date |
Mar. 31, 2020
|
| CAMBIAR SMALL CAP FUND |
|
| Prospectus [Line Items] |
|
| Bar Chart and Performance Table [Heading] |
Performance Information
|
| Performance Narrative [Text Block] |
The bar chart and the performance table below illustrate the risks and volatility of an investment in the Fund by showing changes in the Fund’s Investor Class Shares’ performance from year to year for the past 10 years and by showing how the Fund’s average annual total returns for 1, 5 and 10 years and since inception compare with those of a broad measure of equity market performance generally, as well as a narrower index with characteristics more relevant to the Fund’s investment strategies (Russell 2000® Value Index). Of course, the Fund’s past performance (before and after taxes) does not necessarily indicate how the Fund will perform in the future.
Updated performance information is available at www.cambiar.com or by calling 1-866-777-8227.
|
| Performance Past Does Not Indicate Future [Text] |
Of course, the Fund’s past performance (before and after taxes) does not necessarily indicate how the Fund will perform in the future.
|
| Performance Information Illustrates Variability of Returns [Text] |
The bar chart and the performance table below illustrate the risks and volatility of an investment in the Fund by showing changes in the Fund’s Investor Class Shares’ performance from year to year for the past 10 years and by showing how the Fund’s average annual total returns for 1, 5 and 10 years and since inception compare with those of a broad measure of equity market performance generally, as well as a narrower index with characteristics more relevant to the Fund’s investment strategies (Russell 2000® Value Index).
|
| Bar Chart Closing [Text Block] |
During the periods shown in the chart, the Fund’s Investor Class Shares’ highest return for a quarter was 24.82% (quarter ended 6/30/2020) and the lowest return for a quarter was (31.44)% (quarter ended 3/31/2020).
|
| Performance Table Heading |
Average Annual Total Returns for Periods Ended December 31, 2025
|
| Performance Table Narrative |
After-tax returns are calculated using the historical highest individual federal marginal income tax rates and do not reflect the impact of state and local taxes. Actual after-tax returns depend on an investor’s tax situation and may differ from those shown. After-tax returns shown are not relevant to investors who hold their Fund shares through tax-deferred arrangements, such as 401(k) plans or individual retirement accounts (“IRAs”). After-tax returns are shown for only the Investor Class Shares. After-tax returns for Institutional Class Shares will vary.
Institutional
Class Shares of the Fund commenced operations on October 31, 2008. As a result, the performance information provided for Institutional
Class Shares incorporates the returns of Investor Class Shares of the Fund for periods before October 31, 2008. Institutional Class Shares
would have substantially similar performance as Investor Class Shares because the shares are invested in the same portfolio of securities
and the annual returns would generally differ only to the extent that total expenses of Institutional Class Shares are lower.
|
| Performance Table Uses Highest Federal Rate |
After-tax returns are calculated using the historical highest individual federal marginal income tax rates and do not reflect the impact of state and local taxes.
|
| Performance Table Not Relevant to Tax Deferred |
After-tax returns shown are not relevant to investors who hold their Fund shares through tax-deferred arrangements, such as 401(k) plans or individual retirement accounts (“IRAs”).
|
| Performance Table One Class of after Tax Shown [Text] |
After-tax returns are shown for only the Investor Class Shares. After-tax returns for Institutional Class Shares will vary.
|
| Performance Availability Website Address [Text] |
www.cambiar.com
|
| Performance Availability Phone [Text] |
1-866-777-8227
|
| CAMBIAR SMALL CAP FUND | INVESTOR CLASS SHARES |
|
| Prospectus [Line Items] |
|
| Highest Quarterly Return, Label [Optional Text] |
highest return for a quarter
|
| Highest Quarterly Return |
24.82%
|
| Highest Quarterly Return, Date |
Jun. 30, 2020
|
| Lowest Quarterly Return, Label [Optional Text] |
lowest return for a quarter
|
| Lowest Quarterly Return |
(31.44%)
|
| Lowest Quarterly Return, Date |
Mar. 31, 2020
|
| CAMBIAR SMID FUND |
|
| Prospectus [Line Items] |
|
| Bar Chart and Performance Table [Heading] |
Performance Information
|
| Performance Narrative [Text Block] |
The bar chart and the performance table below illustrate the risks and volatility of an investment in the Fund by showing changes in the Fund’s Investor Class Shares’ performance from year to year for the past 10 years and by showing how the Fund’s average annual total returns for 1, 5 and 10 years and since inception compare with those of a broad measure of equity market performance generally, as well as a narrower index with characteristics more relevant to the Fund’s investment strategies (Russell 2500® Value Index). Of course, the Fund’s past performance (before and after taxes) does not necessarily indicate how the Fund will perform in the future.
Updated performance information is available at www.cambiar.com or by calling 1-866-777-8227.
|
| Performance Past Does Not Indicate Future [Text] |
Of course, the Fund’s past performance (before and after taxes) does not necessarily indicate how the Fund will perform in the future.
|
| Performance Information Illustrates Variability of Returns [Text] |
The bar chart and the performance table below illustrate the risks and volatility of an investment in the Fund by showing changes in the Fund’s Investor Class Shares’ performance from year to year for the past 10 years and by showing how the Fund’s average annual total returns for 1, 5 and 10 years and since inception compare with those of a broad measure of equity market performance generally, as well as a narrower index with characteristics more relevant to the Fund’s investment strategies (Russell 2500® Value Index).
|
| Bar Chart Closing [Text Block] |
During the periods shown in the chart, the Fund’s Investor Class Shares’ highest return for a quarter was 22.58% (quarter ended 12/31/2020) and the lowest return for a quarter was (31.26)% (quarter ended 3/31/2020).
|
| Performance Table Heading |
Average Annual Total Returns for Periods Ended December 31, 2025
|
| Performance Table Narrative |
After-tax returns are calculated using the historical highest individual federal marginal income tax rates and do not reflect the impact of state and local taxes. Actual after-tax returns depend on an investor’s tax situation and may differ from those shown. After-tax returns shown are not relevant to investors who hold their Fund shares through tax-deferred arrangements, such as 401(k) plans or individual retirement accounts (“IRAs”). After-tax returns are shown for only the Investor Class Shares. After-tax returns for Institutional Class Shares will vary.
Institutional Class Shares of the Fund commenced operations on November 3, 2014. As a result, the performance information provided for Institutional Class Shares incorporates the returns of Investor Class Shares of the Fund for periods before November 3, 2014. Institutional Class Shares would have substantially similar performance as Investor Class Shares because the shares are invested in the same portfolio of securities and the annual returns would generally differ only to the extent that total expenses of Institutional Class Shares are lower.
Returns after taxes on distributions and sale of Fund shares may be higher than before-tax returns when a net capital loss occurs upon the redemption of shares.
|
| Performance Table Uses Highest Federal Rate |
After-tax returns are calculated using the historical highest individual federal marginal income tax rates and do not reflect the impact of state and local taxes.
|
| Performance Table Not Relevant to Tax Deferred |
After-tax returns shown are not relevant to investors who hold their Fund shares through tax-deferred arrangements, such as 401(k) plans or individual retirement accounts (“IRAs”).
|
| Performance Table Explanation after Tax Higher |
Returns after taxes on distributions and sale of Fund shares may be higher than before-tax returns when a net capital loss occurs upon the redemption of shares.
|
| Performance Table One Class of after Tax Shown [Text] |
After-tax returns are shown for only the Investor Class Shares. After-tax returns for Institutional Class Shares will vary.
|
| Performance Availability Website Address [Text] |
www.cambiar.com
|
| Performance Availability Phone [Text] |
1-866-777-8227
|
| CAMBIAR SMID FUND | INVESTOR CLASS SHARES |
|
| Prospectus [Line Items] |
|
| Highest Quarterly Return, Label [Optional Text] |
highest return for a quarter
|
| Highest Quarterly Return |
22.58%
|
| Highest Quarterly Return, Date |
Dec. 31, 2020
|
| Lowest Quarterly Return, Label [Optional Text] |
lowest return for a quarter
|
| Lowest Quarterly Return |
(31.26%)
|
| Lowest Quarterly Return, Date |
Mar. 31, 2020
|
| Cambiar Aggressive Value ETF |
|
| Prospectus [Line Items] |
|
| Bar Chart and Performance Table [Heading] |
Performance Information
|
| Performance Narrative [Text Block] |
Prior to commencing operations, the Fund acquired the assets and liabilities of the Cambiar Aggressive Value Fund (the “Predecessor Fund”), the Fund’s predecessor fund (the “Reorganization”). After being approved by shareholders of the Predecessor Fund, the Reorganization became effective on February 13, 2023. As a result of the Reorganization, shareholders of the Predecessor Fund received shares of the Fund, and the Fund assumed the performance and accounting history of the Predecessor Fund. Accordingly, the performance shown below for periods prior to the Reorganization represents the performance of the Predecessor Fund. The Predecessor Fund had the same investment objective and similar investment policies, guidelines and restrictions as those of the Fund. The principal differences between the Fund’s investment policies, guidelines and restrictions and those of the Predecessor Fund are that: (i) the Fund invests in large capitalization domestic securities to a greater extent than the Predecessor Fund invested, and (ii) the Fund invests in derivative instruments and short sales to a lesser extent than the Predecessor Fund invested.
The Predecessor Fund’s returns in the bar chart and table reflect the Predecessor Fund’s expenses but have not been adjusted to reflect the Fund’s expenses. If the Predecessor Fund’s performance information had been adjusted to reflect the Fund’s expenses, the performance may have been higher or lower for a given period depending on the expenses incurred by the Predecessor Fund for that period. Additionally, if the Predecessor Fund had operated as an ETF, its performance may have differed.
The bar chart and the performance table below illustrate the risks and volatility of an investment in the Fund by showing changes in the performance of the Fund and the Predecessor Fund, as applicable, from year to year for the past 10 years, and by showing how the average annual total returns of the Fund and the Predecessor Fund, as applicable, for 1, 5 and 10 years and since inception compare with those of a broad measure of equity market performance generally, as well as a narrower index with characteristics more relevant to the Fund’s investment strategies (Russell 1000® Value Index). Of course, the Fund’s and the Predecessor Fund’s past performance (before and after taxes) does not necessarily indicate how the Fund will perform in the future.
Updated performance information is available at www.cambiar.com or by calling 1-866-777-8227.
|
| Performance Past Does Not Indicate Future [Text] |
Of course, the Fund’s and the Predecessor Fund’s past performance (before and after taxes) does not necessarily indicate how the Fund will perform in the future.
|
| Performance Information Illustrates Variability of Returns [Text] |
The bar chart and the performance table below illustrate the risks and volatility of an investment in the Fund by showing changes in the performance of the Fund and the Predecessor Fund, as applicable, from year to year for the past 10 years, and by showing how the average annual total returns of the Fund and the Predecessor Fund, as applicable, for 1, 5 and 10 years and since inception compare with those of a broad measure of equity market performance generally, as well as a narrower index with characteristics more relevant to the Fund’s investment strategies (Russell 1000® Value Index).
|
| Bar Chart Closing [Text Block] |
During the periods shown in the chart, the Fund’s or Predecessor Fund’s, as applicable, highest return for a quarter was 22.11% (quarter ended 6/30/2020) and the lowest return for a quarter was (31.93)% (quarter ended 3/31/2020).
|
| Performance Table Heading |
Average Annual Total Returns for Periods Ended December 31, 2025
|
| Performance Table Narrative |
This table compares the average annual total returns of the Fund and Predecessor Fund for the periods ended December 31, 2025 to those of the Russell 3000® Index and the Russell 1000® Value Index.
After-tax returns are calculated using the historical highest individual federal marginal income tax rates and do not reflect the impact of state and local taxes. Actual after-tax returns depend on an investor’s tax situation and may differ from
those
shown. After-tax
returns shown are not relevant to investors who hold their Fund shares through tax-deferred arrangements, such as 401(k) plans or individual
retirement accounts (“IRAs”).
|
| Performance Table Uses Highest Federal Rate |
After-tax returns are calculated using the historical highest individual federal marginal income tax rates and do not reflect the impact of state and local taxes.
|
| Performance Table Not Relevant to Tax Deferred |
After-tax
returns shown are not relevant to investors who hold their Fund shares through tax-deferred arrangements, such as 401(k) plans or individual
retirement accounts (“IRAs”).
|
| Performance Availability Website Address [Text] |
www.cambiar.com
|
| Performance Availability Phone [Text] |
1-866-777-8227
|
| Cambiar Aggressive Value ETF | Cambiar Aggressive Value ETF Shares |
|
| Prospectus [Line Items] |
|
| Highest Quarterly Return, Label [Optional Text] |
highest return
|
| Highest Quarterly Return |
22.11%
|
| Highest Quarterly Return, Date |
Jun. 30, 2020
|
| Lowest Quarterly Return, Label [Optional Text] |
lowest return
|
| Lowest Quarterly Return |
(31.93%)
|
| Lowest Quarterly Return, Date |
Mar. 31, 2020
|
| CIBC Atlas Disciplined Equity Fund |
|
| Prospectus [Line Items] |
|
| Bar Chart and Performance Table [Heading] |
Performance Information
|
| Performance Narrative [Text Block] |
The bar chart and the performance table below illustrate the risks and volatility of an investment in the Fund by showing changes in the Fund’s Institutional Class Shares’ performance from year to year for the past 10 years and by showing how the Fund’s Institutional Class Shares’ average annual total returns for 1, 5 and 10 years and since inception compare with those of a broad measure of market performance. Of course, the Fund’s past performance (before and after taxes) does not necessarily indicate how the Fund will perform in the future.
The Fund acquired the assets and liabilities and assumed the historical performance of the Invesco Disciplined Equity Fund (the “Invesco Predecessor Fund”), a series of AIM Equity Funds (“Invesco Equity Funds”), on January 2, 2014 (the “Disciplined Equity Reorganization”). Accordingly, the performance shown for the periods prior to the Disciplined Equity Reorganization represents the performance of Class Y shares of the Invesco Predecessor Fund, which was the only class of shares of the Invesco Predecessor Fund outstanding at the time of the Disciplined Equity Reorganization. The Invesco Predecessor Fund’s returns in the bar chart and table have not been adjusted to reflect the Fund’s expenses. If the Invesco Predecessor Fund’s performance information had been adjusted to reflect the Fund’s expenses, the performance may have been higher or lower for a given period depending on the expenses incurred by Invesco Predecessor Fund for that period.
As of the date of this Prospectus, Investor Class Shares of the Fund have not commenced operations and therefore have no performance information to report. Investor Class Shares of the Fund would have substantially similar performance as Institutional Class Shares because the shares are invested in the same portfolio of securities and the returns would generally differ only to the extent that expenses of Investor Class Shares are higher than the expenses of Institutional Class Shares, in which case the returns for Investor Class Shares would be lower than those of Institutional Class Shares.
Updated performance information is available by calling 1-855-328-3863.
|
| Performance Past Does Not Indicate Future [Text] |
Of course, the Fund’s past performance (before and after taxes) does not necessarily indicate how the Fund will perform in the future.
|
| Performance Information Illustrates Variability of Returns [Text] |
The bar chart and the performance table below illustrate the risks and volatility of an investment in the Fund by showing changes in the Fund’s Institutional Class Shares’ performance from year to year for the past 10 years and by showing how the Fund’s Institutional Class Shares’ average annual total returns for 1, 5 and 10 years and since inception compare with those of a broad measure of market performance.
|
| Bar Chart [Heading] |
Annual Total Returns
|
| Performance Table Heading |
Average Annual Total Returns for Periods Ended December 31, 2025
|
| Performance Table Narrative |
This table compares the Fund’s Institutional Class Shares’ average annual total returns for the periods ended December 31, 2025 to those of an appropriate broad based index.
After-tax returns are calculated using the historical highest individual federal marginal income tax rates and do not reflect the impact of state and local taxes. Actual after-tax returns depend on an investor’s tax situation and may differ from those shown. After-tax returns shown are not relevant to investors who hold their Fund shares through tax-deferred arrangements, such as 401(k) plans or individual retirement.
|
| Performance Table Uses Highest Federal Rate |
After-tax returns are calculated using the historical highest individual federal marginal income tax rates and do not reflect the impact of state and local taxes.
|
| Performance Table Not Relevant to Tax Deferred |
After-tax returns shown are not relevant to investors who hold their Fund shares through tax-deferred arrangements, such as 401(k) plans or individual retirement.
|
| Performance Availability Phone [Text] |
1-855-328-3863
|
| CIBC Atlas Disciplined Equity Fund | Institutional Class Shares |
|
| Prospectus [Line Items] |
|
| Highest Quarterly Return, Label [Optional Text] |
Best Quarter
|
| Highest Quarterly Return |
19.93%
|
| Highest Quarterly Return, Date |
Jun. 30, 2020
|
| Lowest Quarterly Return, Label [Optional Text] |
Worst Quarter
|
| Lowest Quarterly Return |
(17.79%)
|
| Lowest Quarterly Return, Date |
Mar. 31, 2020
|
| CIBC Atlas Mid Cap Equity Fund |
|
| Prospectus [Line Items] |
|
| Bar Chart and Performance Table [Heading] |
Performance Information
|
| Performance Narrative [Text Block] |
The bar chart and the performance table below illustrate the risks and volatility of an investment in the Fund by showing changes in the Fund’s Institutional Class Shares’ performance from year to year and by showing how the Fund’s Institutional Class Shares’ average annual total returns for 1, 5 and 10 years and since inception compare with those of a broad measure of market performance and a more narrowly based index with characteristics relevant to the Fund’s investment strategies. Of course, the Fund’s past performance (before and after taxes) does not necessarily indicate how the Fund will perform in the future.
As of the date of this Prospectus, Investor Class Shares of the Fund have not commenced operations and therefore have no performance information to report. Investor Class Shares of the Fund would have substantially similar performance as Institutional Class Shares because the shares are invested in the same portfolio of securities and the returns would generally differ only to the extent that expenses of Investor Class Shares are higher than the expenses of Institutional Class Shares, in which case the returns for Investor Class Shares would be lower than those of Institutional Class Shares.
Updated performance information is available by calling 1-855-328-3863.
|
| Performance Past Does Not Indicate Future [Text] |
Of course, the Fund’s past performance (before and after taxes) does not necessarily indicate how the Fund will perform in the future.
|
| Performance Information Illustrates Variability of Returns [Text] |
The bar chart and the performance table below illustrate the risks and volatility of an investment in the Fund by showing changes in the Fund’s Institutional Class Shares’ performance from year to year and by showing how the Fund’s Institutional Class Shares’ average annual total returns for 1, 5 and 10 years and since inception compare with those of a broad measure of market performance and a more narrowly based index with characteristics relevant to the Fund’s investment strategies.
|
| Bar Chart [Heading] |
Annual Total Returns
|
| Performance Table Heading |
Average Annual Total Returns for Periods Ended December 31, 2025
|
| Performance Table Narrative |
This table compares the Fund’s Institutional Class Shares’ average annual total returns for the periods ended December 31, 2025 to those of an appropriate broad based index and a more narrowly based index with characteristics relevant to the Fund’s investment strategies.
After-tax returns are calculated using the historical highest individual federal marginal income tax rates and do not reflect the impact of state and local taxes. Actual after-tax returns depend on an investor’s tax situation and may differ from those shown. After-tax returns shown are not relevant to investors who hold their Fund shares through tax-deferred arrangements, such as 401(k) plans or individual retirement accounts (“IRAs”).
|
| Performance Table Uses Highest Federal Rate |
After-tax returns are calculated using the historical highest individual federal marginal income tax rates and do not reflect the impact of state and local taxes.
|
| Performance Table Not Relevant to Tax Deferred |
After-tax returns shown are not relevant to investors who hold their Fund shares through tax-deferred arrangements, such as 401(k) plans or individual retirement accounts (“IRAs”).
|
| Performance Availability Phone [Text] |
1-855-328-3863
|
| CIBC Atlas Mid Cap Equity Fund | Institutional Class |
|
| Prospectus [Line Items] |
|
| Highest Quarterly Return, Label [Optional Text] |
Best Quarter
|
| Highest Quarterly Return |
21.59%
|
| Highest Quarterly Return, Date |
Jun. 30, 2020
|
| Lowest Quarterly Return, Label [Optional Text] |
Worst Quarter
|
| Lowest Quarterly Return |
(22.71%)
|
| Lowest Quarterly Return, Date |
Mar. 31, 2020
|
| CIBC Atlas Income Opportunities Fund |
|
| Prospectus [Line Items] |
|
| Bar Chart and Performance Table [Heading] |
Performance Information
|
| Performance Narrative [Text Block] |
The bar chart and the performance table below illustrate the risks and volatility of an investment in the Fund by showing changes in the Fund’s Institutional Class Shares’ performance from year to year and by showing how the Fund’s Institutional Class Shares’ average annual total returns for 1, 5 and 10 years and since inception compare with those of a broad measure of market performance and more narrowly based indices with characteristics relevant to the Fund’s investment strategies. Of course, the Fund’s past performance (before and after taxes) does not necessarily indicate how the Fund will perform in the future.
As of the date of this Prospectus, Investor Class Shares of the Fund have not commenced operations and therefore have no performance information to report. Investor Class Shares of the Fund would have substantially similar performance as Institutional Class Shares because the shares are invested in the same portfolio of securities and the returns would generally differ only to the extent that expenses of Investor Class Shares are higher than the expenses of Institutional Class Shares, in which case the returns for Investor Class Shares would be lower than those of Institutional Class Shares.
Updated performance information is available by calling 1-855-328-3863.
|
| Performance Past Does Not Indicate Future [Text] |
Of course, the Fund’s past performance (before and after taxes) does not necessarily indicate how the Fund will perform in the future.
|
| Performance Information Illustrates Variability of Returns [Text] |
The bar chart and the performance table below illustrate the risks and volatility of an investment in the Fund by showing changes in the Fund’s Institutional Class Shares’ performance from year to year and by showing how the Fund’s Institutional Class Shares’ average annual total returns for 1, 5 and 10 years and since inception compare with those of a broad measure of market performance and more narrowly based indices with characteristics relevant to the Fund’s investment strategies.
|
| Bar Chart [Heading] |
Annual Total Returns
|
| Performance Table Heading |
Average Annual Total Returns for Periods Ended December 31, 2025
|
| Performance Table Narrative |
This table compares the Fund’s Institutional Class Shares’ average annual total returns for the periods ended December 31, 2025 to those of an appropriate broad based index and more narrowly based indices with characteristics relevant to the Fund’s investment strategies.
After-tax returns are calculated using the historical highest individual federal marginal income tax rates and do not reflect the impact of state and local taxes. Actual after-tax returns depend on an investor’s tax situation and may differ from those shown. After-tax returns shown are not relevant to investors who hold their Fund shares through tax-deferred arrangements, such as 401(k) plans or individual retirement accounts (“IRAs”).
|
| Performance Table Uses Highest Federal Rate |
After-tax returns are calculated using the historical highest individual federal marginal income tax rates and do not reflect the impact of state and local taxes.
|
| Performance Table Not Relevant to Tax Deferred |
After-tax returns shown are not relevant to investors who hold their Fund shares through tax-deferred arrangements, such as 401(k) plans or individual retirement accounts (“IRAs”).
|
| Performance Availability Phone [Text] |
1-855-328-3863
|
| CIBC Atlas Income Opportunities Fund | Institutional Class |
|
| Prospectus [Line Items] |
|
| Highest Quarterly Return, Label [Optional Text] |
Best Quarter
|
| Highest Quarterly Return |
13.73%
|
| Highest Quarterly Return, Date |
Jun. 30, 2020
|
| Lowest Quarterly Return, Label [Optional Text] |
Worst Quarter
|
| Lowest Quarterly Return |
(15.34%)
|
| Lowest Quarterly Return, Date |
Mar. 31, 2020
|
| CIBC ATLAS ALL CAP GROWTH FUND |
|
| Prospectus [Line Items] |
|
| Bar Chart and Performance Table [Heading] |
Performance Information
|
| Performance Narrative [Text Block] |
The bar chart and the performance table below illustrate the risks and volatility of an investment in the Fund by showing changes in the Fund’s Institutional Class Shares’ performance from year to year and by showing how the Fund’s Institutional Class Shares’ average annual returns for 1, 5 and 10 years and since inception compare with those of a broad measure of market performance and a more narrowly based index with characteristics relevant to the Fund’s investment strategies. Of course, the Fund’s past performance (before and after taxes) does not necessarily indicate how the Fund will perform in the future.
Before the Fund commenced operations, the Fund acquired the assets and liabilities of the Geneva Advisors All Cap Growth Fund (the “All Cap Growth Predecessor Fund”) in a reorganization (the “All Cap Growth Reorganization”). After being approved by shareholders of the All Cap Growth Predecessor Fund, the All Cap Growth Reorganization occurred on February 12, 2018. As a result of the All Cap Growth Reorganization, shareholders of the All Cap Growth Predecessor Fund’s Class I and Class R shares received Institutional Class Shares of the Fund, and the Fund assumed the performance and accounting history of the All Cap Growth Predecessor Fund’s Class I shares prior to the date of the All Cap Growth Reorganization. Accordingly, the performance shown for periods prior to the All Cap Growth Reorganization represents the performance of Class I shares of the All Cap Growth Predecessor Fund. The All Cap Growth Predecessor Fund’s returns in the bar chart and table have not been adjusted to reflect Fund expenses. If the All Cap Growth Predecessor Fund’s performance information had been adjusted to reflect Fund expenses, the performance may have been higher or lower for a given period depending on the expenses incurred by the All Cap Growth Predecessor Fund for that period.
As of the date of this Prospectus, Investor Class Shares of the Fund have not commenced operations and therefore have no performance information to report. Investor Class Shares of the Fund would have substantially similar performance as Institutional Class Shares because the shares are invested in the same portfolio of securities and the annual returns would generally differ only to the extent that the expenses of Investor Class Shares are higher. Updated performance information is available by calling 1-855-328-3863.
|
| Performance Past Does Not Indicate Future [Text] |
Of course, the Fund’s past performance (before and after taxes) does not necessarily indicate how the Fund will perform in the future.
|
| Performance Information Illustrates Variability of Returns [Text] |
The bar chart and the performance table below illustrate the risks and volatility of an investment in the Fund by showing changes in the Fund’s Institutional Class Shares’ performance from year to year and by showing how the Fund’s Institutional Class Shares’ average annual returns for 1, 5 and 10 years and since inception compare with those of a broad measure of market performance and a more narrowly based index with characteristics relevant to the Fund’s investment strategies.
|
| Bar Chart [Heading] |
Annual Total Returns
|
| Performance Table Heading |
Average Annual Total Returns for Periods Ended December 31, 2025
|
| Performance Table Narrative |
This table compares the Fund’s Institutional Class Shares’ average annual total returns for the periods ended December 31, 2025 to those of an appropriate broad based index and a more narrowly based index with characteristics relevant to the Fund’s investment strategies.
After-tax returns are calculated using the historical highest individual federal marginal income tax rates and do not reflect the impact of state and local taxes. Actual after-tax returns depend on an investor’s tax situation and may differ from those shown. After-tax returns shown are not relevant to investors who hold their Fund shares through tax-deferred arrangements, such as 401(k) plans or individual retirement accounts.
|
| Performance Table Uses Highest Federal Rate |
After-tax returns are calculated using the historical highest individual federal marginal income tax rates and do not reflect the impact of state and local taxes.
|
| Performance Table Not Relevant to Tax Deferred |
After-tax returns shown are not relevant to investors who hold their Fund shares through tax-deferred arrangements, such as 401(k) plans or individual retirement accounts.
|
| Performance Availability Phone [Text] |
1-855-328-3863
|
| CIBC ATLAS ALL CAP GROWTH FUND | Institutional Class Shares |
|
| Prospectus [Line Items] |
|
| Highest Quarterly Return, Label [Optional Text] |
Best Quarter
|
| Highest Quarterly Return |
26.55%
|
| Highest Quarterly Return, Date |
Jun. 30, 2020
|
| Lowest Quarterly Return, Label [Optional Text] |
Worst Quarter
|
| Lowest Quarterly Return |
(19.94%)
|
| Lowest Quarterly Return, Date |
Jun. 30, 2022
|
| CIBC ATLAS EQUITY INCOME FUND |
|
| Prospectus [Line Items] |
|
| Bar Chart and Performance Table [Heading] |
Performance Information
|
| Performance Narrative [Text Block] |
The bar chart and the performance table below illustrate the risks and volatility of an investment in the Fund by showing changes in the Fund’s Institutional Class Shares’ performance from year to year and by showing how the Fund’s Institutional Class Shares’ average annual returns for 1, 5 and 10 years and since inception compare with those of a broad measure of market performance. Of course, the Fund’s past performance (before and after taxes) does not necessarily indicate how the Fund will perform in the future.
Before the Fund commenced operations, the Fund acquired the assets and liabilities of the Geneva Advisors Equity Income Fund (the “Equity Income Predecessor Fund”) in a reorganization (the “Equity Income Reorganization”). After being approved by shareholders of the Equity Income Predecessor Fund, the Equity Income Reorganization occurred on February 12, 2018. As a result of the Equity Income Reorganization, shareholders of the Equity Income Predecessor Fund’s Class I and Class R shares received Institutional Class Shares of the Fund, and the Fund assumed the performance and accounting history of the Equity Income Predecessor Fund’s Class I shares prior to the date of the Equity Income Reorganization. Accordingly, the performance shown for periods prior to the Equity Income Reorganization represents the performance of Class I shares of the Equity Income Predecessor Fund. The Equity Income Predecessor Fund’s returns in the bar chart and table have not been adjusted to reflect Fund expenses. If the Equity Income Predecessor Fund’s performance information had been adjusted to reflect Fund expenses, the performance may have been higher or lower for a given period depending on the expenses incurred by the Equity Income Predecessor Fund for that period.
As of the date of this Prospectus, Investor Class Shares of the Fund have not commenced operations and therefore have no performance information to report. Investor Class Shares of the Fund would have substantially similar performance as Institutional Class Shares because the shares are invested in the same portfolio of securities and the annual returns would generally differ only to the extent that the expenses of Investor Class Shares are higher. Updated performance information is available by calling 1-855-328-3863.
|
| Performance Past Does Not Indicate Future [Text] |
Of course, the Fund’s past performance (before and after taxes) does not necessarily indicate how the Fund will perform in the future.
|
| Performance Information Illustrates Variability of Returns [Text] |
The bar chart and the performance table below illustrate the risks and volatility of an investment in the Fund by showing changes in the Fund’s Institutional Class Shares’ performance from year to year and by showing how the Fund’s Institutional Class Shares’ average annual returns for 1, 5 and 10 years and since inception compare with those of a broad measure of market performance.
|
| Bar Chart [Heading] |
Annual Total Returns
|
| Performance Table Heading |
Average Annual Total Returns for Periods Ended December 31, 2025
|
| Performance Table Narrative |
This table compares the Fund’s Institutional Class Shares’ average annual total returns for the periods ended December 31, 2025 to those of an appropriate broad based index.
After-tax returns are calculated using the historical highest individual federal marginal income tax rates and do not reflect the impact of state and local taxes. Actual after-tax returns depend on an investor’s tax situation and may differ from those shown. After-tax returns shown are not relevant to investors who hold their Fund shares through tax-deferred arrangements, such as 401(k) plans or individual retirement accounts (“IRAs”).
|
| Performance Table Uses Highest Federal Rate |
After-tax returns are calculated using the historical highest individual federal marginal income tax rates and do not reflect the impact of state and local taxes.
|
| Performance Table Not Relevant to Tax Deferred |
After-tax returns shown are not relevant to investors who hold their Fund shares through tax-deferred arrangements, such as 401(k) plans or individual retirement accounts (“IRAs”).
|
| Performance Availability Phone [Text] |
1-855-328-3863
|
| CIBC ATLAS EQUITY INCOME FUND | Institutional Class Shares |
|
| Prospectus [Line Items] |
|
| Highest Quarterly Return, Label [Optional Text] |
Best Quarter
|
| Highest Quarterly Return |
18.08%
|
| Highest Quarterly Return, Date |
Jun. 30, 2020
|
| Lowest Quarterly Return, Label [Optional Text] |
Worst Quarter
|
| Lowest Quarterly Return |
(19.67%)
|
| Lowest Quarterly Return, Date |
Mar. 31, 2020
|
| CIBC ATLAS INTERNATIONAL GROWTH FUND |
|
| Prospectus [Line Items] |
|
| Bar Chart and Performance Table [Heading] |
Performance Information
|
| Performance Narrative [Text Block] |
The bar chart and the performance table below illustrate the risks and volatility of an investment in the Fund by showing the Fund’s Institutional Shares’ performance from year to year by showing how the Fund’s Institutional Class Shares’ average annual returns for 1 year, 5 years and since inception compare with those of a broad measure of market performance. Of course, the Fund’s past performance (before and after taxes) does not necessarily indicate how the Fund will perform in the future.
As of the date of this Prospectus, Investor Class Shares of the Fund have not commenced operations and therefore have no performance information to report. Investor Class Shares of the Fund would have substantially similar performance as Institutional Class Shares because the shares are invested in the same portfolio of securities and the annual returns would generally differ only to the extent that the expenses of Investor Class Shares are higher. Updated performance information is available by calling 1-855-328-3863.
|
| Performance Past Does Not Indicate Future [Text] |
Of course, the Fund’s past performance (before and after taxes) does not necessarily indicate how the Fund will perform in the future.
|
| Performance Information Illustrates Variability of Returns [Text] |
The bar chart and the performance table below illustrate the risks and volatility of an investment in the Fund by showing the Fund’s Institutional Shares’ performance from year to year by showing how the Fund’s Institutional Class Shares’ average annual returns for 1 year, 5 years and since inception compare with those of a broad measure of market performance.
|
| Bar Chart [Heading] |
Annual Total Returns
|
| Performance Table Heading |
Average Annual Total Returns for Periods Ended December 31, 2025
|
| Performance Table Narrative |
This table compares the Fund’s Institutional Class Shares’ average annual total returns for the periods ended December 31, 2025 to those of an appropriate broad based index.
After-tax returns are calculated using the historical highest individual federal marginal income tax rates and do not reflect the impact of state and local taxes. Actual after-tax returns depend on an investor’s tax situation and may differ from those shown. After-tax returns shown are not relevant to investors who hold their Fund shares through tax-deferred arrangements, such as 401(k) plans or individual retirement accounts.
|
| Performance Table Uses Highest Federal Rate |
After-tax returns are calculated using the historical highest individual federal marginal income tax rates and do not reflect the impact of state and local taxes.
|
| Performance Table Not Relevant to Tax Deferred |
After-tax returns shown are not relevant to investors who hold their Fund shares through tax-deferred arrangements, such as 401(k) plans or individual retirement accounts.
|
| Performance Availability Phone [Text] |
1-855-328-3863
|
| CIBC ATLAS INTERNATIONAL GROWTH FUND | Institutional Class Shares |
|
| Prospectus [Line Items] |
|
| Highest Quarterly Return, Label [Optional Text] |
Best Quarter
|
| Highest Quarterly Return |
19.75%
|
| Highest Quarterly Return, Date |
Dec. 31, 2020
|
| Lowest Quarterly Return, Label [Optional Text] |
Worst Quarter
|
| Lowest Quarterly Return |
(22.09%)
|
| Lowest Quarterly Return, Date |
Mar. 31, 2020
|
| HAVERFORD QUALITY GROWTH STOCK FUND |
|
| Prospectus [Line Items] |
|
| Bar Chart and Performance Table [Heading] |
Performance Information
|
| Performance Narrative [Text Block] |
The bar chart and the performance table below illustrate the risks and volatility of an investment in the Fund by showing changes in the Fund’s performance from year to year and by showing how the Fund’s average annual total returns for 1, 5 and 10 years and since inception compare with those of a broad measure of market performance. Of course, the Fund’s past performance (before and after taxes) does not necessarily indicate how the Fund will perform in the future. Updated performance information is available on the Fund’s website at www.haverfordfunds.com or by calling 1-866-301-7212.
|
| Performance Past Does Not Indicate Future [Text] |
Of course, the Fund’s past performance (before and after taxes) does not necessarily indicate how the Fund will perform in the future.
|
| Performance Information Illustrates Variability of Returns [Text] |
The bar chart and the performance table below illustrate the risks and volatility of an investment in the Fund by showing changes in the Fund’s performance from year to year and by showing how the Fund’s average annual total returns for 1, 5 and 10 years and since inception compare with those of a broad measure of market performance.
|
| Bar Chart Closing [Text Block] |
BEST QUARTER |
WORST QUARTER |
18.23% |
(20.71)% |
(6/30/2020) |
(3/31/2020) |
|
| Performance Table Narrative |
This table compares the Fund’s average annual total returns for the periods ended December 31, 2025 to those of an appropriate broad based index.
After-tax returns are calculated using the historical highest individual federal marginal income tax rates and do not reflect the impact of state and local taxes. Actual after-tax returns will depend on an investor’s tax situation and may differ from those shown. After-tax returns shown are not relevant to investors who hold their Fund shares through tax-deferred arrangements, such as 401(k) plans or individual retirement accounts (“IRAs”).
|
| Performance Table Uses Highest Federal Rate |
After-tax returns are calculated using the historical highest individual federal marginal income tax rates and do not reflect the impact of state and local taxes.
|
| Performance Table Not Relevant to Tax Deferred |
After-tax returns shown are not relevant to investors who hold their Fund shares through tax-deferred arrangements, such as 401(k) plans or individual retirement accounts (“IRAs”).
|
| Average Annual Return, Caption [Optional Text] |
Average Annual Total Returns for Periods Ended December 31, 2025
|
| Performance Availability Website Address [Text] |
www.haverfordfunds.com
|
| Performance Availability Phone [Text] |
1-866-301-7212
|
| HAVERFORD QUALITY GROWTH STOCK FUND | Haverford Quality Growth Stock Fund Shares |
|
| Prospectus [Line Items] |
|
| Highest Quarterly Return, Label [Optional Text] |
BEST QUARTER
|
| Highest Quarterly Return |
18.23%
|
| Highest Quarterly Return, Date |
Jun. 30, 2020
|
| Lowest Quarterly Return, Label [Optional Text] |
WORST QUARTER
|
| Lowest Quarterly Return |
(20.71%)
|
| Lowest Quarterly Return, Date |
Mar. 31, 2020
|
| Loomis Sayles Full Discretion Institutional Securitized Fund |
|
| Prospectus [Line Items] |
|
| Bar Chart and Performance Table [Heading] |
Performance Information
|
| Performance Narrative [Text Block] |
The bar chart and the performance table below illustrate the risks and volatility of an investment in the Fund by showing changes in the Fund’s performance from year to year and by showing how the Fund’s average annual total returns for 1, 5 and 10 years and since inception compare with those of a broad measure of market performance and a more narrowly based index with characteristics relevant to the Fund’s investment strategies. Of course, the Fund’s past performance (before and after taxes) does not necessarily indicate how the Fund will perform in the future. Updated performance information is available by calling 1-800-343-2029.
|
| Performance Past Does Not Indicate Future [Text] |
Of course, the Fund’s past performance (before and after taxes) does not necessarily indicate how the Fund will perform in the future.
|
| Performance Information Illustrates Variability of Returns [Text] |
The bar chart and the performance table below illustrate the risks and volatility of an investment in the Fund by showing changes in the Fund’s performance from year to year and by showing how the Fund’s average annual total returns for 1, 5 and 10 years and since inception compare with those of a broad measure of market performance and a more narrowly based index with characteristics relevant to the Fund’s investment strategies.
|
| Bar Chart Closing [Text Block] |
BEST QUARTER |
WORST QUARTER |
5.10% |
(9.64)% |
12/31/2024 |
3/31/2020 |
|
| Performance Table Heading |
Average Annual Total Returns for Periods Ended December 31, 2025
|
| Performance Table Narrative |
This table compares the Fund’s Institutional Class Shares’ average annual total returns for periods ended December 31, 2025 to those of an appropriate broad based index and a more narrowly based index with characteristics relevant to the Fund’s investment strategies.
After-tax returns are calculated using the historical highest individual federal marginal income tax rates and do not reflect the impact of state and local taxes. Actual after-tax returns depend on an investor’s tax situation and may differ from those shown. After-tax returns shown are not relevant to investors who hold their Fund shares through tax-deferred arrangements such as 401(k) plans or individual retirement accounts (“IRAs”).
|
| Performance Table Uses Highest Federal Rate |
After-tax returns are calculated using the historical highest individual federal marginal income tax rates and do not reflect the impact of state and local taxes.
|
| Performance Table Not Relevant to Tax Deferred |
After-tax returns shown are not relevant to investors who hold their Fund shares through tax-deferred arrangements such as 401(k) plans or individual retirement accounts (“IRAs”).
|
| Performance Availability Phone [Text] |
1-800-343-2029
|
| Loomis Sayles Full Discretion Institutional Securitized Fund | Institutional Class Shares |
|
| Prospectus [Line Items] |
|
| Highest Quarterly Return, Label [Optional Text] |
BEST QUARTER
|
| Highest Quarterly Return |
5.10%
|
| Highest Quarterly Return, Date |
Dec. 31, 2024
|
| Lowest Quarterly Return, Label [Optional Text] |
WORST QUARTER
|
| Lowest Quarterly Return |
(9.64%)
|
| Lowest Quarterly Return, Date |
Mar. 31, 2020
|
| LSV VALUE EQUITY FUND |
|
| Prospectus [Line Items] |
|
| Bar Chart and Performance Table [Heading] |
Performance Information
|
| Performance Narrative [Text Block] |
The bar chart and the performance table below illustrate the risks and volatility of an investment in the Fund by showing changes in the Fund’s Institutional Class Shares’ performance from year to year for the past ten years and by showing how the Fund’s average annual total returns for 1, 5, and 10 years and since inception compare with those of a broad measure of market performance and a more narrowly based index with characteristics relevant to the Fund’s investment strategies. Of course, the Fund’s past performance (before and after taxes) does not necessarily indicate how the Fund will perform in the future. Updated performance information is available by calling the Fund at 1-888-FUND-LSV.
|
| Performance Past Does Not Indicate Future [Text] |
Of course, the Fund’s past performance (before and after taxes) does not necessarily indicate how the Fund will perform in the future.
|
| Performance Information Illustrates Variability of Returns [Text] |
The bar chart and the performance table below illustrate the risks and volatility of an investment in the Fund by showing changes in the Fund’s Institutional Class Shares’ performance from year to year for the past ten years and by showing how the Fund’s average annual total returns for 1, 5, and 10 years and since inception compare with those of a broad measure of market performance and a more narrowly based index with characteristics relevant to the Fund’s investment strategies.
|
| Bar Chart Closing [Text Block] |
Best Quarter |
Worst Quarter |
20.11% |
(32.25)% |
12/31/2020 |
3/31/2020 |
|
| Performance Table Heading |
Average Annual Total Returns for the Periods Ended December 31, 2025
|
| Performance Table Narrative |
This table compares the Fund’s average annual total returns for the periods ended December 31, 2025 to those of an appropriate broad based index and a more narrowly based index with characteristics relevant to the Fund’s investment strategies.
|
| Performance Table Uses Highest Federal Rate |
After-tax returns are calculated using the historical highest individual federal marginal income tax rates and do not reflect the impact of state and local taxes.
|
| Performance Table Not Relevant to Tax Deferred |
After-tax returns shown are not relevant to investors who hold their Fund shares through tax-deferred arrangements, such as 401(k) plans or individual retirement accounts (“IRAs”).
|
| Performance Table One Class of after Tax Shown [Text] |
After-tax returns are shown only for Institutional Class Shares. After-tax returns for Investor Class Shares will vary.
|
| Performance Availability Website Address [Text] |
1-888-FUND-LSV
|
| LSV VALUE EQUITY FUND | Institutional Class Shares |
|
| Prospectus [Line Items] |
|
| Highest Quarterly Return, Label [Optional Text] |
Best Quarter
|
| Highest Quarterly Return |
20.11%
|
| Highest Quarterly Return, Date |
Dec. 31, 2020
|
| Lowest Quarterly Return, Label [Optional Text] |
Worst Quarter
|
| Lowest Quarterly Return |
(32.25%)
|
| Lowest Quarterly Return, Date |
Mar. 31, 2020
|
| LSV CONSERVATIVE VALUE EQUITY FUND |
|
| Prospectus [Line Items] |
|
| Bar Chart and Performance Table [Heading] |
Performance Information
|
| Performance Narrative [Text Block] |
The bar chart and the performance table below illustrate the risks and volatility of an investment in the Fund by showing changes in the Fund’s Institutional Class Shares’ performance from year to year for the past 10 years and by showing how the Fund’s average annual total returns for 1, 5, and 10 years and since inception compare with those of a broad measure of market performance and a more narrowly based index with characteristics relevant to the Fund’s investment strategies. Of course, the Fund’s past performance (before and after taxes) does not necessarily indicate how the Fund will perform in the future. Updated performance information is available by calling the Fund at 1-888-FUND-LSV.
|
| Performance Past Does Not Indicate Future [Text] |
Of course, the Fund’s past performance (before and after taxes) does not necessarily indicate how the Fund will perform in the future.
|
| Performance Information Illustrates Variability of Returns [Text] |
The bar chart and the performance table below illustrate the risks and volatility of an investment in the Fund by showing changes in the Fund’s Institutional Class Shares’ performance from year to year for the past 10 years and by showing how the Fund’s average annual total returns for 1, 5, and 10 years and since inception compare with those of a broad measure of market performance and a more narrowly based index with characteristics relevant to the Fund’s investment strategies.
|
| Bar Chart Closing [Text Block] |
Best Quarter |
Worst Quarter |
16.90% |
(30.46)% |
12/31/2020 |
3/31/2020 |
|
| Performance Table Heading |
Average Annual Total Returns for the Periods Ended December 31, 2025
|
| Performance Table Narrative |
This table compares the Fund’s average annual total returns for the periods ended December 31, 2025 to those of an appropriate broad based index and a more narrowly based index with characteristics relevant to the Fund’s investment strategies.
After-tax returns are calculated using the historical highest individual federal marginal income tax rates and do not reflect the impact of state and local taxes. Actual after-tax returns will depend on an investor’s tax situation and may differ from those shown. After-tax returns shown are not relevant to investors who
hold their Fund shares through tax-deferred arrangements, such as 401(k) plans or individual retirement accounts (“IRAs”). After-tax returns are shown only for Institutional Class Shares. After-tax returns for Investor Class Shares will vary.
After-tax returns shown are not relevant to
investors who hold their Fund shares through tax-deferred arrangements, such as 401(k) plans or individual retirement accounts (“IRAs”).
Investor Class Shares of the Fund commenced operations on June 10, 2014. As a result, the performance information provided for Investor Class Shares incorporates the returns of Institutional Class Shares of the Fund for periods before June 10, 2014. Investor Class Shares would have substantially similar performance as Institutional Class Shares because the shares are invested in the same portfolio of securities and the annual returns would generally differ only to the extent that expenses of Investor Class Shares are higher.
|
| Performance Table Uses Highest Federal Rate |
After-tax returns are calculated using the historical highest individual federal marginal income tax rates and do not reflect the impact of state and local taxes.
|
| Performance Table Not Relevant to Tax Deferred |
After-tax returns shown are not relevant to
investors who hold their Fund shares through tax-deferred arrangements, such as 401(k) plans or individual retirement accounts (“IRAs”).
|
| Performance Table One Class of after Tax Shown [Text] |
After-tax returns are shown only for Institutional Class Shares. After-tax returns for Investor Class Shares will vary.
|
| Performance Availability Phone [Text] |
1-888-FUND-LSV
|
| LSV CONSERVATIVE VALUE EQUITY FUND | Institutional Class Shares |
|
| Prospectus [Line Items] |
|
| Highest Quarterly Return, Label [Optional Text] |
Best Quarter
|
| Highest Quarterly Return |
16.90%
|
| Highest Quarterly Return, Date |
Dec. 31, 2020
|
| Lowest Quarterly Return, Label [Optional Text] |
Worst Quarter
|
| Lowest Quarterly Return |
(30.46%)
|
| Lowest Quarterly Return, Date |
Mar. 31, 2020
|
| LSV Small Cap Value Fund |
|
| Prospectus [Line Items] |
|
| Bar Chart and Performance Table [Heading] |
Performance Information
|
| Performance Narrative [Text Block] |
The bar chart and the performance table below illustrate the risks and volatility of an investment in the Fund by showing changes in the Fund’s Institutional Class Shares’ performance from year to year and by showing how the Fund’s average annual total returns for 1, 5, and 10 years and since inception compare with those of a broad measure of market performance and a more narrowly based index with characteristics relevant to the Fund’s investment strategies. Of course, the Fund’s past performance (before and after taxes) does not necessarily indicate how the Fund will perform in the future. Updated performance information is available by calling the Fund at 1-888-FUND-LSV.
|
| Performance Past Does Not Indicate Future [Text] |
Of course, the Fund’s past performance (before and after taxes) does not necessarily indicate how the Fund will perform in the future.
|
| Performance Information Illustrates Variability of Returns [Text] |
The bar chart and the performance table below illustrate the risks and volatility of an investment in the Fund by showing changes in the Fund’s Institutional Class Shares’ performance from year to year and by showing how the Fund’s average annual total returns for 1, 5, and 10 years and since inception compare with those of a broad measure of market performance and a more narrowly based index with characteristics relevant to the Fund’s investment strategies.
|
| Bar Chart Closing [Text Block] |
Best Quarter |
Worst Quarter |
30.18% |
(43.65)% |
12/31/2020 |
3/31/2020 |
|
| Performance Table Heading |
Average Annual Total Returns for the Periods Ended December 31, 2025
|
| Performance Table Narrative |
This table compares the Fund’s average annual total returns for the periods ended December 31, 2025 to those of an appropriate broad based index and a more narrowly based index with characteristics relevant to the Fund’s investment strategies.
After-tax returns are calculated using the historical highest individual federal marginal income tax rates and do not reflect the impact of state and local taxes. Actual after-tax returns will depend on an investor’s tax situation and may differ from those shown. After-tax returns shown are not relevant to investors who hold their Fund shares through tax-deferred arrangements, such as 401(k) plans or individual retirement accounts (“IRAs”). After-tax returns are shown only for Institutional Class Shares. After-tax returns for Investor Class Shares will vary.
Investor Class Shares of the Fund commenced operations on June 10, 2014. As a result, the performance information provided for Investor Class Shares incorporates the returns of Institutional Class Shares of the Fund for periods before June 10, 2014. Investor Class Shares would have substantially similar performance as Institutional Class Shares because the shares are invested in the same portfolio of securities and the annual returns would generally differ only to the extent that expenses of Investor Class Shares are higher.
|
| Performance Table Uses Highest Federal Rate |
After-tax returns are calculated using the historical highest individual federal marginal income tax rates and do not reflect the impact of state and local taxes.
|
| Performance Table Not Relevant to Tax Deferred |
After-tax returns shown are not relevant to investors who hold their Fund shares through tax-deferred arrangements, such as 401(k) plans or individual retirement accounts (“IRAs”).
|
| Performance Table One Class of after Tax Shown [Text] |
After-tax returns are shown only for Institutional Class Shares. After-tax returns for Investor Class Shares will vary.
|
| Performance Availability Phone [Text] |
1-888-FUND-LSV
|
| LSV Small Cap Value Fund | Institutional Class Shares |
|
| Prospectus [Line Items] |
|
| Highest Quarterly Return, Label [Optional Text] |
Best Quarter
|
| Highest Quarterly Return |
30.18%
|
| Highest Quarterly Return, Date |
Dec. 31, 2020
|
| Lowest Quarterly Return, Label [Optional Text] |
Worst Quarter
|
| Lowest Quarterly Return |
(43.65%)
|
| Lowest Quarterly Return, Date |
Mar. 31, 2020
|
| LSV U.S. MANAGED VOLATILITY FUND |
|
| Prospectus [Line Items] |
|
| Bar Chart and Performance Table [Heading] |
Performance Information
|
| Performance Narrative [Text Block] |
The bar chart and the performance table below illustrate the risks and volatility of an investment in the Fund by showing changes in the Fund’s Institutional Class Shares’ performance from year to year and by showing how the Fund’s average annual total returns for 1, 5 and 10 years and since inception compare with those of a broad measure of market performance. Of course, the Fund’s past performance (before and after taxes) does not necessarily indicate how the Fund will perform in the future. Updated performance information is available by calling the Fund at 1-888-FUND-LSV.
|
| Performance Past Does Not Indicate Future [Text] |
Of course, the Fund’s past performance (before and after taxes) does not necessarily indicate how the Fund will perform in the future.
|
| Performance Information Illustrates Variability of Returns [Text] |
The bar chart and the performance table below illustrate the risks and volatility of an investment in the Fund by showing changes in the Fund’s Institutional Class Shares’ performance from year to year and by showing how the Fund’s average annual total returns for 1, 5 and 10 years and since inception compare with those of a broad measure of market performance.
|
| Bar Chart Closing [Text Block] |
Best Quarter |
Worst Quarter |
13.47% |
(23.64)% |
12/31/2022 |
3/31/2020 |
|
| Performance Table Heading |
Average Annual Total Returns for the Periods Ended December 31, 2025
|
| Performance Table Narrative |
This table compares the Fund’s average annual total returns for the periods ended December 31, 2025 to those of an appropriate broad based index.
After-tax returns are calculated using the historical highest individual federal marginal income tax rates and do not reflect the impact of state and local taxes. Actual after-tax returns will depend on an investor’s tax situation and may differ from those shown. After-tax returns shown are not relevant to investors who hold their Fund shares through tax-deferred arrangements, such as 401(k) plans or individual retirement accounts (“IRAs”). After-tax returns are shown only for Institutional Class Shares. After-tax returns for Investor Class Shares will vary.
Returns after taxes on distributions and sale of Fund shares may be higher than before-tax returns when a net capital loss occurs upon the redemption of Fund shares.
|
| Performance Table Uses Highest Federal Rate |
After-tax returns are calculated using the historical highest individual federal marginal income tax rates and do not reflect the impact of state and local taxes.
|
| Performance Table Not Relevant to Tax Deferred |
After-tax returns shown are not relevant to investors who hold their Fund shares through tax-deferred arrangements, such as 401(k) plans or individual retirement accounts (“IRAs”).
|
| Performance Table Explanation after Tax Higher |
After-tax returns are shown only for Institutional Class Shares. After-tax returns for Investor Class Shares will vary.
|
| Performance Availability Phone [Text] |
1-888-FUND-LSV
|
| LSV U.S. MANAGED VOLATILITY FUND | Institutional Class Shares |
|
| Prospectus [Line Items] |
|
| Highest Quarterly Return, Label [Optional Text] |
Best Quarter
|
| Highest Quarterly Return |
13.47%
|
| Highest Quarterly Return, Date |
Dec. 31, 2022
|
| Lowest Quarterly Return, Label [Optional Text] |
Worst Quarter
|
| Lowest Quarterly Return |
(23.64%)
|
| Lowest Quarterly Return, Date |
Mar. 31, 2020
|
| LSV GLOBAL MANAGED VOLATILITY FUND |
|
| Prospectus [Line Items] |
|
| Bar Chart and Performance Table [Heading] |
Performance Information
|
| Performance Narrative [Text Block] |
The bar chart and the performance table below illustrate the risks and volatility of an investment in the Fund by showing changes in the Fund’s Institutional Class Shares’ performance from year to year and by showing how the Fund’s average annual total returns for 1, 5 and 10 years and since inception compare with those of a broad measure of market performance. Of course, the Fund’s past performance (before and after taxes) does not necessarily indicate how the Fund will perform in the future. Updated performance information is available by calling the Fund at 1-888-FUND-LSV.
|
| Performance Past Does Not Indicate Future [Text] |
Of course, the Fund’s past performance (before and after taxes) does not necessarily indicate how the Fund will perform in the future.
|
| Performance Information Illustrates Variability of Returns [Text] |
The bar chart and the performance table below illustrate the risks and volatility of an investment in the Fund by showing changes in the Fund’s Institutional Class Shares’ performance from year to year and by showing how the Fund’s average annual total returns for 1, 5 and 10 years and since inception compare with those of a broad measure of market performance.
|
| Bar Chart Closing [Text Block] |
Best Quarter |
Worst Quarter |
14.00% |
(23.20)% |
12/31/2022 |
3/31/2020 |
|
| Performance Table Heading |
Average Annual Total Returns for the Periods Ended December 31, 2025
|
| Performance Table Narrative |
This table compares the Fund’s average annual total returns for the periods ended December 31, 2025 to those of an appropriate broad based index.
After-tax
returns are calculated using the historical highest individual federal marginal income tax rates and do not reflect the impact of state
and local taxes. Actual after-tax returns will depend on an investor’s tax situation and may differ from those shown. After-tax
returns shown are not relevant to investors who hold their Fund shares through tax-deferred arrangements, such as 401(k) plans or individual
retirement accounts (“IRAs”). After-tax
returns are shown only for Institutional Class Shares. After-tax returns for Investor Class Shares will vary.
|
| Performance Table Uses Highest Federal Rate |
After-tax
returns are calculated using the historical highest individual federal marginal income tax rates and do not reflect the impact of state
and local taxes.
|
| Performance Table Not Relevant to Tax Deferred |
After-tax
returns shown are not relevant to investors who hold their Fund shares through tax-deferred arrangements, such as 401(k) plans or individual
retirement accounts (“IRAs”).
|
| Performance Table One Class of after Tax Shown [Text] |
After-tax
returns are shown only for Institutional Class Shares. After-tax returns for Investor Class Shares will vary.
|
| Performance Availability Phone [Text] |
1-888-FUND-LSV
|
| LSV GLOBAL MANAGED VOLATILITY FUND | Institutional Class Shares |
|
| Prospectus [Line Items] |
|
| Highest Quarterly Return, Label [Optional Text] |
Best Quarter
|
| Highest Quarterly Return |
14.00%
|
| Highest Quarterly Return, Date |
Dec. 31, 2022
|
| Lowest Quarterly Return, Label [Optional Text] |
Worst Quarter
|
| Lowest Quarterly Return |
(23.20%)
|
| Lowest Quarterly Return, Date |
Mar. 31, 2020
|
| LSV Global Value Fund |
|
| Prospectus [Line Items] |
|
| Bar Chart and Performance Table [Heading] |
Performance Information
|
| Performance Narrative [Text Block] |
The bar chart and the performance table below illustrate the risks and volatility of an investment in the Fund by showing changes in the Fund’s Institutional Class Shares’ performance from year to year and by showing how the Fund’s average annual total returns for 1, 5 and 10 years and since inception compare with those of a broad measure of market performance. Of course, the Fund’s past performance (before and after taxes) does not necessarily indicate how the Fund will perform in the future. Updated performance information is available by calling the Fund at 1-888-FUND-LSV.
|
| Performance Past Does Not Indicate Future [Text] |
Of course, the Fund’s past performance (before and after taxes) does not necessarily indicate how the Fund will perform in the future.
|
| Performance Information Illustrates Variability of Returns [Text] |
The bar chart and the performance table below illustrate the risks and volatility of an investment in the Fund by showing changes in the Fund’s Institutional Class Shares’ performance from year to year and by showing how the Fund’s average annual total returns for 1, 5 and 10 years and since inception compare with those of a broad measure of market performance.
|
| Bar Chart Closing [Text Block] |
Best Quarter |
Worst Quarter |
20.17% |
(30.69)% |
12/31/2020 |
3/31/2020 |
|
| Performance Table Heading |
Average Annual Total Returns for the Periods Ended December 31, 2025
|
| Performance Table Narrative |
This table compares the Fund’s average annual total returns for the periods ended December 31, 2025 to those of an appropriate broad based index.
After-tax returns are calculated using the historical highest individual federal marginal income tax rates and do not reflect the impact of state and local taxes. Actual after-tax returns will depend on an investor’s tax situation and may differ from those shown. After-tax returns shown are not relevant to investors who hold their Fund shares through tax-deferred arrangements, such as 401(k) plans or individual retirement accounts (“IRAs”). After-tax returns are shown only for Institutional Class Shares. After-tax returns for Investor Class Shares will vary.
|
| Performance Table Uses Highest Federal Rate |
After-tax returns are calculated using the historical highest individual federal marginal income tax rates and do not reflect the impact of state and local taxes.
|
| Performance Table Not Relevant to Tax Deferred |
After-tax returns shown are not relevant to investors who hold their Fund shares through tax-deferred arrangements, such as 401(k) plans or individual retirement accounts (“IRAs”).
|
| Performance Table One Class of after Tax Shown [Text] |
After-tax returns are shown only for Institutional Class Shares. After-tax returns for Investor Class Shares will vary.
|
| Performance Availability Phone [Text] |
1-888-FUND-LSV
|
| LSV Global Value Fund | Institutional Class Shares |
|
| Prospectus [Line Items] |
|
| Highest Quarterly Return, Label [Optional Text] |
Best Quarter
|
| Highest Quarterly Return |
20.17%
|
| Highest Quarterly Return, Date |
Dec. 31, 2020
|
| Lowest Quarterly Return, Label [Optional Text] |
Worst Quarter
|
| Lowest Quarterly Return |
(30.69%)
|
| Lowest Quarterly Return, Date |
Mar. 31, 2020
|
| LSV Emerging Markets Equity Fund |
|
| Prospectus [Line Items] |
|
| Bar Chart and Performance Table [Heading] |
Performance Information
|
| Performance Narrative [Text Block] |
The bar chart and the performance table below illustrate the risks and volatility of an investment in the Fund by showing changes in the Fund’s Institutional Class Shares’ performance from year to year and by showing how the Fund’s average annual total returns for 1 and 5 years and since inception compare with those of a broad measure of market performance. Of course, the Fund’s past performance (before and after taxes) does not necessarily indicate how the Fund will perform in the future. Updated performance information is available by calling the Fund at 1-888-FUND-LSV.
|
| Performance Past Does Not Indicate Future [Text] |
Of course, the Fund’s past performance (before and after taxes) does not necessarily indicate how the Fund will perform in the future.
|
| Performance Information Illustrates Variability of Returns [Text] |
The bar chart and the performance table below illustrate the risks and volatility of an investment in the Fund by showing changes in the Fund’s Institutional Class Shares’ performance from year to year and by showing how the Fund’s average annual total returns for 1 and 5 years and since inception compare with those of a broad measure of market performance.
|
| Bar Chart Closing [Text Block] |
Best Quarter |
Worst Quarter |
21.35% |
(28.64)% |
12/31/2020 |
3/31/2020 |
|
| Performance Table Heading |
Average Annual Total Returns for the Periods Ended December 31, 2025
|
| Performance Table Narrative |
This table compares the Fund’s average annual total returns for the periods ended December 31, 2025 to those of an appropriate broad based index.
After-tax returns are calculated using the historical highest individual federal marginal income tax rates and do not reflect the impact of state and local taxes. Actual after-tax returns will depend on an investor’s tax situation and may differ from those shown. After-tax returns shown are not relevant to investors who hold their Fund shares through tax-deferred arrangements, such as 401(k) plans or individual retirement accounts (“IRAs”). After-tax returns are shown only for Institutional Class Shares. After-tax returns for Investor Class Shares will vary.
|
| Performance Table Uses Highest Federal Rate |
After-tax returns are calculated using the historical highest individual federal marginal income tax rates and do not reflect the impact of state and local taxes.
|
| Performance Table Not Relevant to Tax Deferred |
After-tax returns shown are not relevant to investors who hold their Fund shares through tax-deferred arrangements, such as 401(k) plans or individual retirement accounts (“IRAs”).
|
| Performance Table One Class of after Tax Shown [Text] |
After-tax returns are shown only for Institutional Class Shares. After-tax returns for Investor Class Shares will vary.
|
| Performance Availability Phone [Text] |
1-888-FUND-LSV
|
| LSV Emerging Markets Equity Fund | Institutional Class Shares |
|
| Prospectus [Line Items] |
|
| Highest Quarterly Return, Label [Optional Text] |
Best Quarter
|
| Highest Quarterly Return |
21.35%
|
| Highest Quarterly Return, Date |
Dec. 31, 2020
|
| Lowest Quarterly Return, Label [Optional Text] |
Worst Quarter
|
| Lowest Quarterly Return |
(28.64%)
|
| Lowest Quarterly Return, Date |
Mar. 31, 2020
|
| LSV Disciplined Value ETF |
|
| Prospectus [Line Items] |
|
| Bar Chart and Performance Table [Heading] |
Performance Information
|
| Performance Narrative [Text Block] |
The bar chart and the performance table below illustrate the risks and volatility of an investment in the Fund by showing the Fund’s performance for the 2025 calendar year and by showing how the Fund’s average annual total returns for 1 year and since inception compare with those of a broad measure of market performance. Of course, the Fund’s past performance (before and after taxes) does not necessarily indicate how the Fund will perform in the future.
Current performance information is available by calling the Fund at 1-888-FUND-LSV.
|
| Performance Past Does Not Indicate Future [Text] |
Of course, the Fund’s past performance (before and after taxes) does not necessarily indicate how the Fund will perform in the future.
|
| Performance Information Illustrates Variability of Returns [Text] |
The bar chart and the performance table below illustrate the risks and volatility of an investment in the Fund by showing the Fund’s performance for the 2025 calendar year and by showing how the Fund’s average annual total returns for 1 year and since inception compare with those of a broad measure of market performance.
|
| Bar Chart Closing [Text Block] |
Best Quarter |
Worst Quarter |
10.09% |
(4.63)% |
6/30/2025 |
3/31/2025 |
|
| Performance Table Heading |
Average Annual Total Returns for the Periods Ended December 31, 2025
|
| Performance Table Narrative |
This table compares the Fund’s average annual total returns for the periods ended December 31, 2025 to those of an appropriate broad-based index.
After-tax returns are calculated using the historical highest individual federal marginal income tax rates and do not reflect the impact of state and local taxes. Actual after-tax returns depend on an investor’s tax situation and may differ from those shown. After-tax returns shown are not relevant to investors who hold their Fund shares through tax-deferred arrangements, such as 401(k) plans or individual retirement accounts (“IRAs”).
|
| Performance Table Uses Highest Federal Rate |
After-tax returns are calculated using the historical highest individual federal marginal income tax rates and do not reflect the impact of state and local taxes.
|
| Performance Table Not Relevant to Tax Deferred |
After-tax returns shown are not relevant to investors who hold their Fund shares through tax-deferred arrangements, such as 401(k) plans or individual retirement accounts (“IRAs”).
|
| Performance Availability Phone [Text] |
1-888-FUND-LSV
|
| LSV Disciplined Value ETF | LSV Disciplined Value ETF Shares |
|
| Prospectus [Line Items] |
|
| Highest Quarterly Return, Label [Optional Text] |
Best Quarter
|
| Highest Quarterly Return |
10.09%
|
| Highest Quarterly Return, Date |
Jun. 30, 2025
|
| Lowest Quarterly Return, Label [Optional Text] |
Worst Quarter
|
| Lowest Quarterly Return |
(4.63%)
|
| Lowest Quarterly Return, Date |
Mar. 31, 2025
|
| Sands Capital Global Growth Fund |
|
| Prospectus [Line Items] |
|
| Bar Chart and Performance Table [Heading] |
Performance Information
|
| Performance Narrative [Text Block] |
The bar chart and the performance table below illustrate the risks and volatility of an investment in Institutional Class Shares of the Fund by showing changes in the Fund’s Institutional Class Shares’ performance from year to year and by showing how the Fund’s Institutional Class Shares’ average annual total returns for 1, 5 and 10 years and since inception compare with those of a broad measure of market performance. Of course, the Fund’s past performance (before and after taxes) does not necessarily indicate how the Fund will perform in the future. Updated performance information is available by calling 1-888-826-5646.
Year |
Return |
2016 |
0.45% |
2017 |
38.70% |
2018 |
-2.72% |
2019 |
30.16% |
2020 |
49.56% |
2021 |
9.69% |
2022 |
-43.46% |
2023 |
31.82% |
2024 |
15.61% |
2025 |
10.64% |
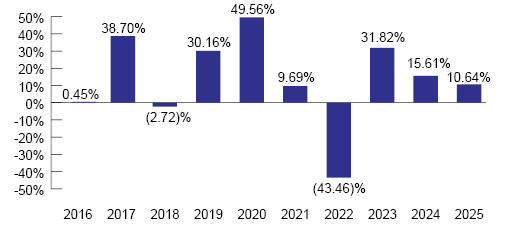
|
| Performance Past Does Not Indicate Future [Text] |
Of course, the Fund’s past performance (before and after taxes) does not necessarily indicate how the Fund will perform in the future.
|
| Performance Information Illustrates Variability of Returns [Text] |
The bar chart and the performance table below illustrate the risks and volatility of an investment in Institutional Class Shares of the Fund by showing changes in the Fund’s Institutional Class Shares’ performance from year to year and by showing how the Fund’s Institutional Class Shares’ average annual total returns for 1, 5 and 10 years and since inception compare with those of a broad measure of market performance.
|
| Performance Table Heading |
Average Annual Total Returns for Periods Ended December 31, 2025
|
| Performance Table Narrative |
This table compares the Fund’s Institutional Class Shares’ average annual total returns for the periods ended December 31, 2025 to those of an appropriate broad based index.
After-tax returns are calculated using the historical highest individual federal marginal income tax rates and do not reflect the impact of state and local taxes. Actual after-tax returns depend on an investor’s tax situation and may differ from those shown. After-tax returns shown are not relevant to investors who hold their Fund shares through tax-deferred arrangements such as 401(k) plans or individual retirement accounts (“IRAs”).
Returns after taxes on distributions and sale of Fund shares may be higher than before-tax returns when a net capital loss occurs upon the redemption of Fund shares.
|
| Performance Table Uses Highest Federal Rate |
After-tax returns are calculated using the historical highest individual federal marginal income tax rates and do not reflect the impact of state and local taxes.
|
| Performance Table Not Relevant to Tax Deferred |
After-tax returns shown are not relevant to investors who hold their Fund shares through tax-deferred arrangements such as 401(k) plans or individual retirement accounts (“IRAs”).
|
| Performance Table Explanation after Tax Higher |
Returns after taxes on distributions and sale of Fund shares may be higher than before-tax returns when a net capital loss occurs upon the redemption of Fund shares.
|
| Performance Availability Phone [Text] |
1-888-826-5646
|
| Sands Capital Global Growth Fund | Institutional Class Shares |
|
| Prospectus [Line Items] |
|
| Highest Quarterly Return, Label [Optional Text] |
BEST QUARTER
|
| Highest Quarterly Return |
35.24%
|
| Highest Quarterly Return, Date |
Jun. 30, 2020
|
| Lowest Quarterly Return, Label [Optional Text] |
WORST QUARTER
|
| Lowest Quarterly Return |
(32.24%)
|
| Lowest Quarterly Return, Date |
Jun. 30, 2022
|
| Investor Class Shares | Sands Capital Global Growth Fund |
|
| Prospectus [Line Items] |
|
| Bar Chart and Performance Table [Heading] |
Performance Information
|
| Performance Narrative [Text Block] |
The bar chart and the performance table below illustrate the risks and volatility of an investment in Investor Class Shares of the Fund by showing changes in the Fund’s Investor Class Shares’ performance from year to year and by showing how the Fund’s Investor Class Shares’ average annual total returns for 1, 5 and 10 years and since inception compare with those of a broad measure of market performance. Of course, the Fund’s past performance (before and after taxes) does not necessarily indicate how the Fund will perform in the future. Updated performance information is available by calling 1-888-826-5646.
|
| Performance Past Does Not Indicate Future [Text] |
Of course, the Fund’s past performance (before and after taxes) does not necessarily indicate how the Fund will perform in the future.
|
| Performance Information Illustrates Variability of Returns [Text] |
The bar chart and the performance table below illustrate the risks and volatility of an investment in Investor Class Shares of the Fund by showing changes in the Fund’s Investor Class Shares’ performance from year to year and by showing how the Fund’s Investor Class Shares’ average annual total returns for 1, 5 and 10 years and since inception compare with those of a broad measure of market performance.
|
| Bar Chart Closing [Text Block] |
BEST QUARTER |
WORST QUARTER |
35.17% |
(32.22)% |
6/30/2020 |
6/30/2022 |
|
| Performance Table Heading |
Average Annual Total Returns for Periods Ended December 31, 2025
|
| Performance Table Narrative |
This table compares the Fund’s Investor Class Shares’ average annual total returns for the periods ended December 31, 2025 to those of an appropriate broad based index.
After-tax returns are calculated using the historical highest individual federal marginal income tax rates and do not reflect the impact of state and local taxes. Actual after-tax returns depend on an investor’s tax situation and may differ from those shown. After-tax returns shown are not relevant to investors who hold their Fund shares through tax-deferred arrangements such as 401(k) plans or individual retirement accounts (“IRAs”).
Returns after taxes on distributions and sale of Fund shares may be higher than before-tax returns when a net capital loss occurs upon the redemption of Fund shares.
|
| Performance Table Uses Highest Federal Rate |
After-tax returns are calculated using the historical highest individual federal marginal income tax rates and do not reflect the impact of state and local taxes.
|
| Performance Table Not Relevant to Tax Deferred |
After-tax returns shown are not relevant to investors who hold their Fund shares through tax-deferred arrangements such as 401(k) plans or individual retirement accounts (“IRAs”).
|
| Performance Availability Phone [Text] |
1-888-826-5646
|
| Investor Class Shares | Sands Capital Global Growth Fund | Investor Class Shares |
|
| Prospectus [Line Items] |
|
| Highest Quarterly Return, Label [Optional Text] |
BEST QUARTER
|
| Highest Quarterly Return |
35.17%
|
| Highest Quarterly Return, Date |
Jun. 30, 2020
|
| Lowest Quarterly Return, Label [Optional Text] |
WORST QUARTER
|
| Lowest Quarterly Return |
(32.22%)
|
| Lowest Quarterly Return, Date |
Jun. 30, 2022
|