Performance Management
|
Oct. 31, 2025 |
| BBH Select Large Cap ETF |
|
| Prospectus [Line Items] |
|
| Bar Chart and Performance Table [Heading] |
Performance of Predecessor Fund
|
| Performance Narrative [Text Block] |
The Fund is the successor to the Predecessor Fund, a mutual fund series of BBH Trust, as a result of the reorganization of the Predecessor Fund into the Fund on November 17, 2025 (the “Reorganization”). The Fund has adopted the Predecessor Fund’s performance history. The Predecessor Fund also was advised by the Investment Adviser and had the same investment objective, investment strategies, and fundamental and non-fundamental investment policies as the Fund. The performance shown for periods prior to the Reorganization represents the performance of the Predecessor Fund.
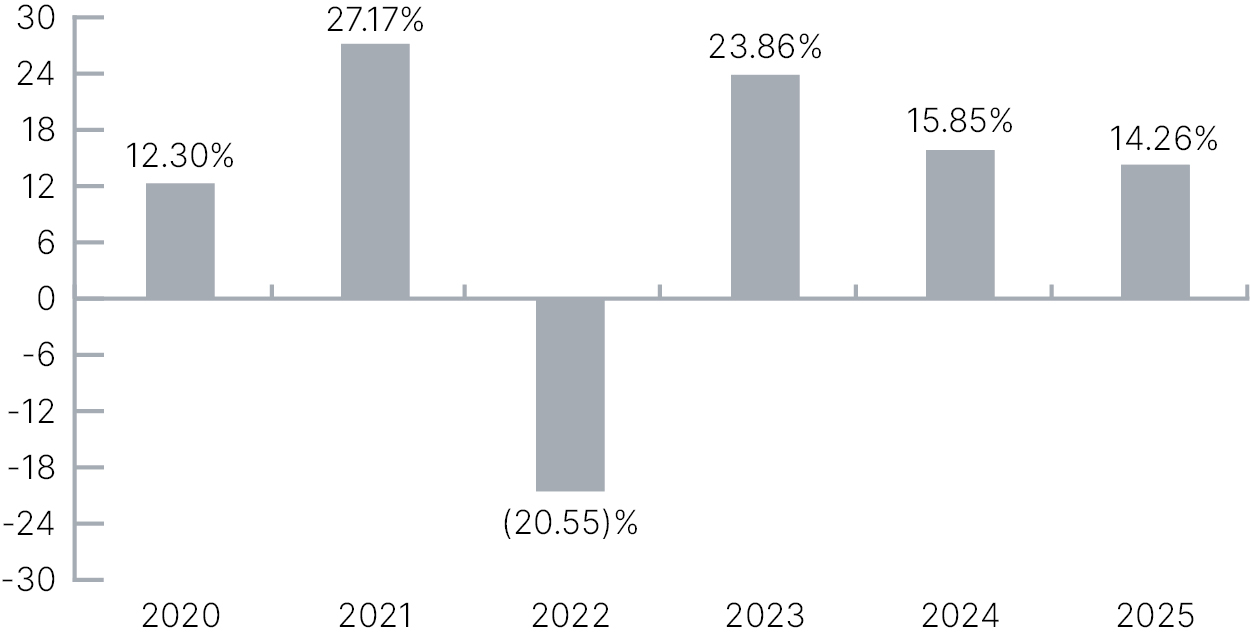
The following bar chart and table give an indication of the risks of investing in the Fund. The bar chart shows changes in the performance of the Fund from year to year. The table shows how the average annual returns of the Fund for the periods indicated compared to a broad-based securities market index. One cannot invest directly in an index.
Past performance, before and after taxes, does not indicate how the Fund will perform in the future. Updated information on the Fund’s performance can be obtained by visiting www.bbhfunds.com or can be obtained by phone at 1-800-575-1265.
|
| Performance Past Does Not Indicate Future [Text] |
Past performance, before and after taxes, does not indicate how the Fund will perform in the future.
|
| Performance Information Illustrates Variability of Returns [Text] |
The following bar chart and table give an indication of the risks of investing in the Fund. The bar chart shows changes in the performance of the Fund from year to year. The table shows how the average annual returns of the Fund for the periods indicated compared to a broad-based securities market index. One cannot invest directly in an index.
|
| Bar Chart [Heading] |
Total Returns for Class I Shares (% Per Calendar Year)
|
| Bar Chart [Table] |
|
| Bar Chart Closing [Text Block] |
Calendar Year Ended December 31
| Highest Performing Quarter: | | 15.49% in 2nd quarter of 2020 | | Lowest Performing Quarter: | | (19.98)% in 1st quarter of 2020 |
|
| Highest Quarterly Return, Label [Optional Text] |
Highest Performing Quarter
|
| Highest Quarterly Return |
15.49%
|
| Highest Quarterly Return, Date |
Jun. 30, 2020
|
| Lowest Quarterly Return, Label [Optional Text] |
Lowest Performing Quarter
|
| Lowest Quarterly Return |
(19.98%)
|
| Lowest Quarterly Return, Date |
Mar. 31, 2020
|
| Performance Table Heading |
Average Annual Total Returns (For the periods ended December 31, 2025)
|
| Performance Table Narrative |
The performance figures assume that all distributions were reinvested. After-tax returns are calculated using the historical highest individual federal marginal income tax rates and do not reflect the impact of state and local taxes. Actual after-tax returns depend on an investor’s tax situation and may differ from those shown. After-tax returns shown are not relevant to investors who hold their shares through tax-deferred arrangements, such as 401(k) plans or IRAs.
|
| Performance Table Uses Highest Federal Rate |
After-tax returns are calculated using the historical highest individual federal marginal income tax rates and do not reflect the impact of state and local taxes.
|
| Performance Table Not Relevant to Tax Deferred |
After-tax returns shown are not relevant to investors who hold their shares through tax-deferred arrangements, such as 401(k) plans or IRAs.
|
| Performance [Table] |
| | | 1 Year | | 5 Years | | Since
Inception of
Predecessor
Fund
(9/9/2019) | | Predecessor Fund | | | | | | | | Return Before Taxes | | 14.26% | | 10.62% | | 11.05% | | Return After Taxes on Distributions | | 11.89% | | 9.69% | | 10.29% | | Return After Taxes on Distributions and Sale of Fund Shares | | 10.08% | | 8.36% | | 8.84% | | S&P 500 Index (reflects no deduction of fees, expenses or taxes) | | 17.88% | | 14.42% | | 15.88% |
|
| Performance Table One Class of after Tax Shown [Text] |
Actual after-tax returns depend on an investor’s tax situation and may differ from those shown.
|
| Index No Deduction for Fees, Expenses, or Taxes [Text] |
reflects no deduction of fees, expenses or taxes
|
| Performance Availability Website Address [Text] |
www.bbhfunds.com
|
| Performance Availability Phone [Text] |
1-800-575-1265
|
| BBH Select Mid Cap ETF |
|
| Prospectus [Line Items] |
|
| Bar Chart and Performance Table [Heading] |
Performance of the Predecessor Fund
|
| Performance Narrative [Text Block] |
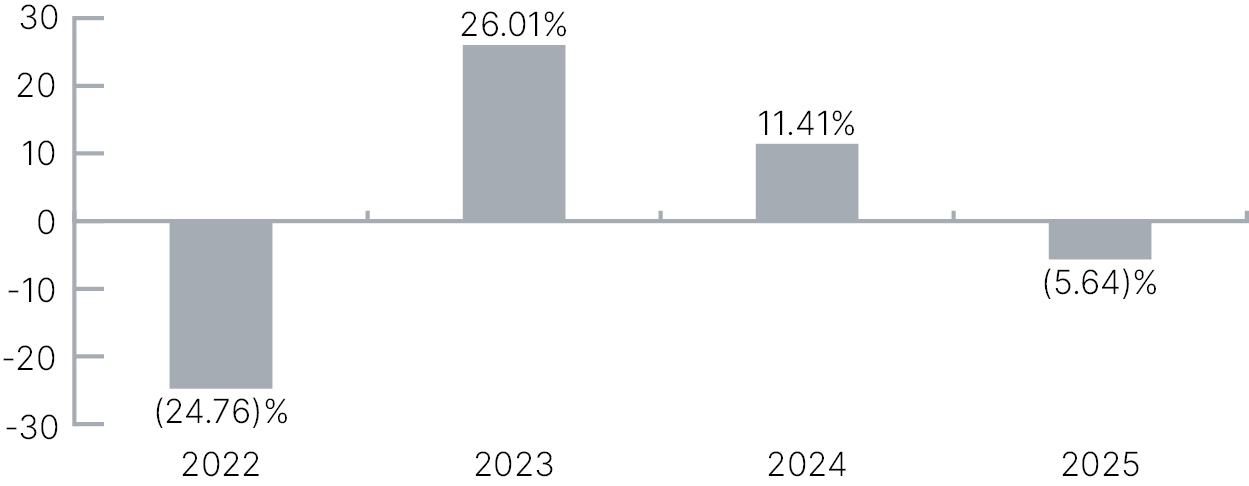
The Fund is the successor to the Predecessor Fund, a mutual fund series of BBH Trust, as a result of the reorganization of the Predecessor Fund into the Fund on November 17, 2025 (the “Reorganization”). The Fund has adopted the Predecessor Fund’s performance history. The Predecessor Fund also was advised by the Investment Adviser and had the same investment objectives, investment strategies, and fundamental and non-fundamental investment policies as the Fund. The performance shown for periods prior to the Reorganization represents the performance of the Predecessor Fund. The following bar chart and table give an indication of the risks of investing in the Fund. The bar chart shows changes in the performance of the Fund from year to year. The table shows how the average annual returns of the Fund for the periods indicated compared to a broad-based securities market index as well as to a mid-cap index to show how the performance compares with the returns of an index of companies that have similar market capitalization to the Fund’s investments. One cannot invest directly in an index.
Past performance, before and after taxes, does not indicate how the Fund will perform in the future. Updated information on the Fund’s performance can be obtained by visiting www.bbhfunds.com or can be obtained by phone at 1-800-575-1265.
|
| Performance Past Does Not Indicate Future [Text] |
Past performance, before and after taxes, does not indicate how the Fund will perform in the future.
|
| Performance Information Illustrates Variability of Returns [Text] |
The following bar chart and table give an indication of the risks of investing in the Fund. The bar chart shows changes in the performance of the Fund from year to year. The table shows how the average annual returns of the Fund for the periods indicated compared to a broad-based securities market index as well as to a mid-cap index to show how the performance compares with the returns of an index of companies that have similar market capitalization to the Fund’s investments. One cannot invest directly in an index.
|
| Bar Chart [Heading] |
Total Return for Class I Shares (% Per Calendar Year)
|
| Bar Chart [Table] |
|
| Bar Chart Closing [Text Block] |
Calendar Year Ended December 31
| Highest Performing Quarter: | | 13.28% in 4th quarter of 2023 | | Lowest Performing Quarter: | | (18.11)% in 2nd quarter of 2022 |
|
| Highest Quarterly Return, Label [Optional Text] |
Highest Performing Quarter
|
| Highest Quarterly Return |
13.28%
|
| Highest Quarterly Return, Date |
Dec. 31, 2023
|
| Lowest Quarterly Return, Label [Optional Text] |
Lowest Performing Quarter
|
| Lowest Quarterly Return |
(18.11%)
|
| Lowest Quarterly Return, Date |
Jun. 30, 2022
|
| Performance Table Heading |
Average Annual Total Returns (For the periods ended December 31, 2025)
|
| Performance Table Narrative |
The performance figures assume that all distributions were reinvested. After-tax returns are calculated using the historical highest individual federal marginal income tax rates and do not reflect the impact of state and local taxes. Actual after-tax returns depend on an investor’s tax situation and may differ from those shown. After-tax returns shown are not relevant to investors who hold their shares through tax-deferred arrangements, such as 401(k) plans or IRAs.
|
| Performance Table Uses Highest Federal Rate |
After-tax returns are calculated using the historical highest individual federal marginal income tax rates and do not reflect the impact of state and local taxes.
|
| Performance Table Not Relevant to Tax Deferred |
After-tax returns shown are not relevant to investors who hold their shares through tax-deferred arrangements, such as 401(k) plans or IRAs.
|
| Performance [Table] |
| | | 1 Year | | Since
Inception of
Predecessor
Fund
(May 24, 2021) | | Predecessor Fund | | | | | | Return Before Taxes | | (5.64)% | | 2.72% | | Return After Taxes on Distributions | | (5.64)% | | 2.69% | | Return After Taxes on Distributions and Sale of Fund Shares | | (3.34)% | | 2.09% | | S&P 500 Index (reflects no deduction for fees, expenses or taxes) | | 17.88% | | 12.85% | | Russell Midcap Total Return Index (reflects no deduction for fees,
expenses or taxes) | | 10.60% | | 6.48% |
|
| Performance Table One Class of after Tax Shown [Text] |
Actual after-tax returns depend on an investor’s tax situation and may differ from those shown.
|
| Index No Deduction for Fees, Expenses, or Taxes [Text] |
reflects no deduction for fees, expenses or taxes
|
| Performance Availability Website Address [Text] |
www.bbhfunds.com
|
| Performance Availability Phone [Text] |
1-800-575-1265
|
| BBH Partner Fund - International Equity |
|
| Prospectus [Line Items] |
|
| Bar Chart and Performance Table [Heading] |
Fund Performance
|
| Performance Narrative [Text Block] |
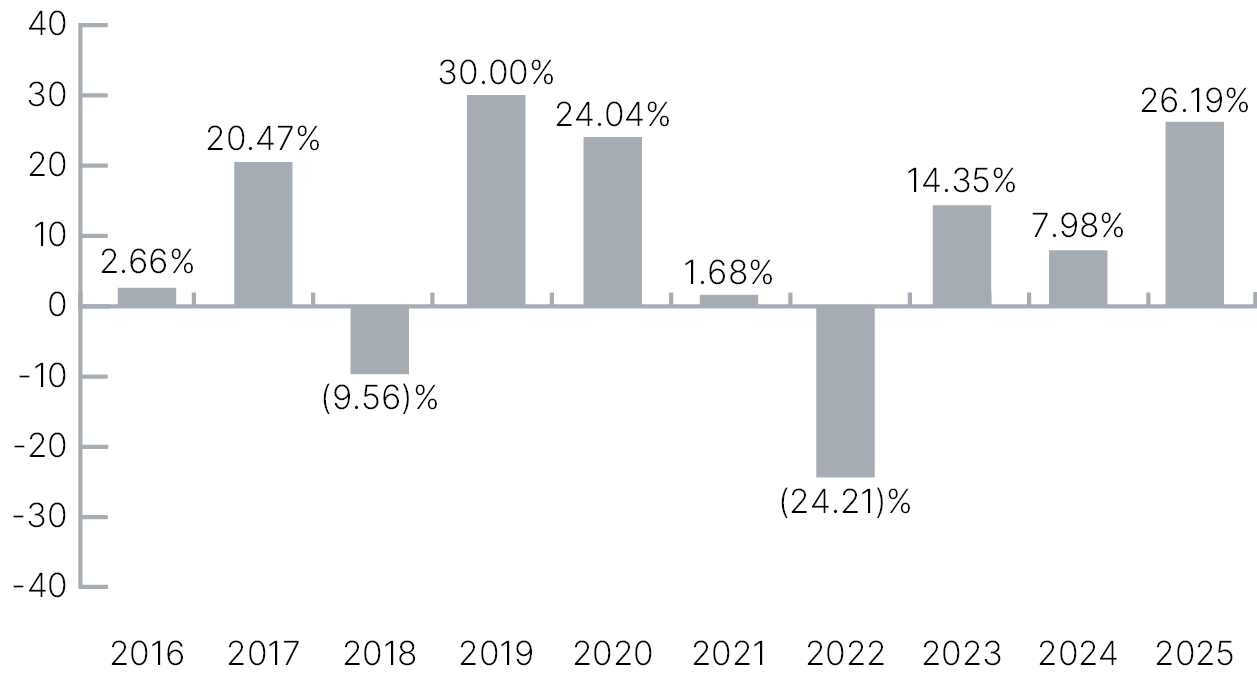
The following bar chart and table give an indication of the risks involved with an investment in the Fund. The bar chart shows changes in the performance of the Fund’s Class I Shares from year to year. The table shows how the average annual returns of the Fund’s Class I Shares for the periods indicated compared to a broad-based securities market index. One cannot invest directly in an index.
When you consider this information, please remember that the Fund’s performance (before and after taxes) in past years is not necessarily an indication of how the Fund will perform in the future. Updated information on the Fund’s performance can be obtained by visiting www.bbhfunds.com or can be obtained by phone at 1-800-575-1265.
|
| Performance Past Does Not Indicate Future [Text] |
When you consider this information, please remember that the Fund’s performance (before and after taxes) in past years is not necessarily an indication of how the Fund will perform in the future.
|
| Performance Information Illustrates Variability of Returns [Text] |
The following bar chart and table give an indication of the risks involved with an investment in the Fund. The bar chart shows changes in the performance of the Fund’s Class I Shares from year to year. The table shows how the average annual returns of the Fund’s Class I Shares for the periods indicated compared to a broad-based securities market index.
|
| Bar Chart [Heading] |
Total Return for Class I Shares (% Per Calendar Year)
|
| Bar Chart [Table] |
|
| Bar Chart Closing [Text Block] |
| Highest Performing Quarter: | | 22.07% in 2nd quarter of 2020 | | Lowest Performing Quarter: | | (17.93)% in 1st quarter of 2020 |
|
| Highest Quarterly Return, Label [Optional Text] |
Highest Performing Quarter
|
| Highest Quarterly Return |
22.07%
|
| Highest Quarterly Return, Date |
Jun. 30, 2020
|
| Lowest Quarterly Return, Label [Optional Text] |
Lowest Performing Quarter
|
| Lowest Quarterly Return |
(17.93%)
|
| Lowest Quarterly Return, Date |
Mar. 31, 2020
|
| Performance Table Heading |
Average Annual Total Returns (For the periods ended December 31, 2025)
|
| Performance Table Narrative |
The Fund’s performance figures assume that all distributions were reinvested in the Fund. After-tax returns are calculated using the historical highest individual federal marginal income tax rates and do not reflect the impact of state and local taxes. Actual after-tax returns depend on an investor’s tax situation and may differ from those shown. After-tax returns shown are not relevant to investors who hold their Fund shares through tax-deferred arrangements, such as 401(k) plans or individual retirement accounts.
|
| Performance Table Uses Highest Federal Rate |
After-tax returns are calculated using the historical highest individual federal marginal income tax rates and do not reflect the impact of state and local taxes.
|
| Performance Table Not Relevant to Tax Deferred |
After-tax returns shown are not relevant to investors who hold their Fund shares through tax-deferred arrangements, such as 401(k) plans or individual retirement accounts.
|
| Performance [Table] |
| | | 1 Year | | 5 Years | | 10 Years | | Class I Shares | | | | | | | | Return Before Taxes | | 26.19% | | 3.72% | | 8.03% | | Return After Taxes on Distributions | | 25.84% | | 2.94% | | 7.06% | | Return After Taxes on Distributions and Sale of Fund Shares | | 16.03% | | 2.78% | | 6.29% | | MSCI-EAFE Index (reflects no deduction for fees, expenses or taxes) | | 31.22% | | 8.92% | | 8.18% |
|
| Performance Table One Class of after Tax Shown [Text] |
Actual after-tax returns depend on an investor’s tax situation and may differ from those shown.
|
| Index No Deduction for Fees, Expenses, or Taxes [Text] |
reflects no deduction for fees, expenses or taxes
|
| Performance Availability Website Address [Text] |
www.bbhfunds.com
|
| Performance Availability Phone [Text] |
1-800-575-1265
|
| BBH Limited Duration Fund |
|
| Prospectus [Line Items] |
|
| Bar Chart and Performance Table [Heading] |
Fund Performance
|
| Performance Narrative [Text Block] |
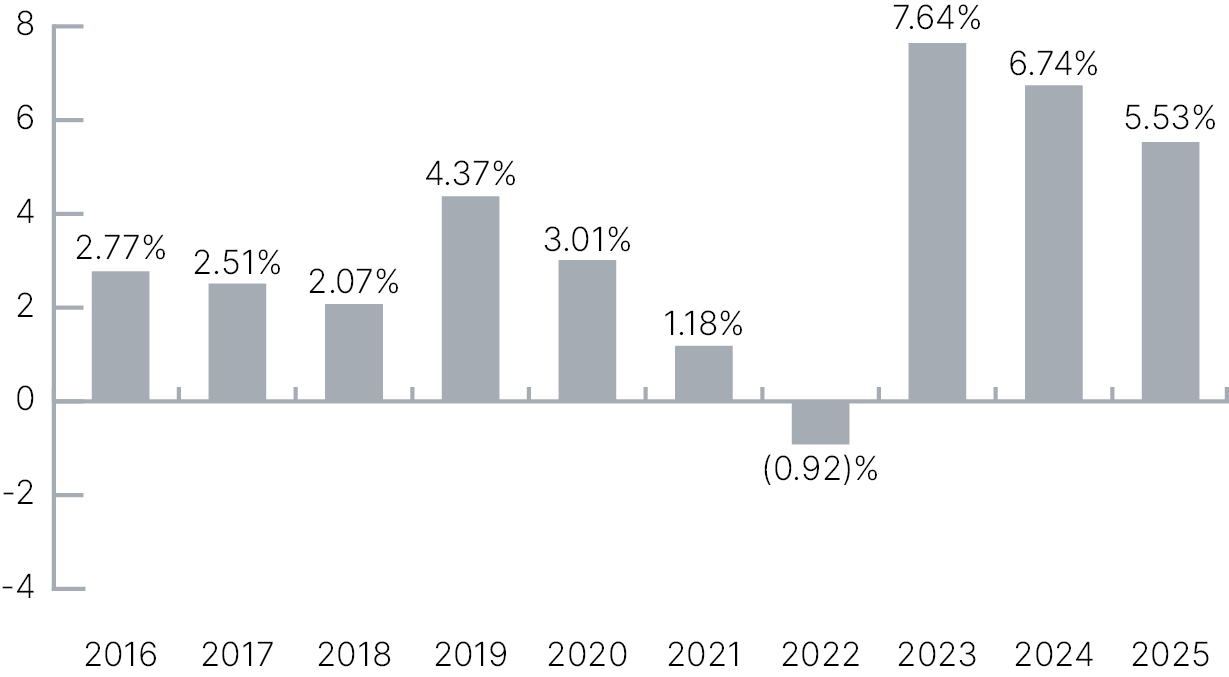
The following bar chart and table give an indication of the risks involved with an investment in the Fund. The bar chart shows changes in the performance of the Fund’s Class I shares from year to year. The table shows how the average annual returns of the Fund’s Class N Shares and Class I Shares for the periods indicated compared to a broad-based securities market index, as well as to a benchmark which reflects the duration of the Fund and a reference benchmark. One cannot invest directly in an index. When you consider this information, please remember that the Fund’s performance (before and after taxes) in past years is not necessarily an indication of how the Fund will perform in the future. Updated information on the Fund’s performance can be obtained by visiting www.bbhfunds.com or can be obtained by phone at 1-800-575-1265.
|
| Performance Past Does Not Indicate Future [Text] |
When you consider this information, please remember that the Fund’s performance (before and after taxes) in past years is not necessarily an indication of how the Fund will perform in the future.
|
| Performance Information Illustrates Variability of Returns [Text] |
The following bar chart and table give an indication of the risks involved with an investment in the Fund. The bar chart shows changes in the performance of the Fund’s Class I shares from year to year. The table shows how the average annual returns of the Fund’s Class N Shares and Class I Shares for the periods indicated compared to a broad-based securities market index, as well as to a benchmark which reflects the duration of the Fund and a reference benchmark.
|
| Bar Chart [Heading] |
Total Return for Class I Shares (% Per Calendar Year)
|
| Bar Chart [Table] |
|
| Bar Chart Closing [Text Block] |
| Highest Performing Quarter: | | 3.98% in 2nd quarter of 2020 | | Lowest Performing Quarter: | | (3.29)% in 1st quarter of 2020 |
|
| Highest Quarterly Return, Label [Optional Text] |
Highest Performing Quarter
|
| Highest Quarterly Return |
3.98%
|
| Highest Quarterly Return, Date |
Jun. 30, 2020
|
| Lowest Quarterly Return, Label [Optional Text] |
Lowest Performing Quarter
|
| Lowest Quarterly Return |
(3.29%)
|
| Lowest Quarterly Return, Date |
Mar. 31, 2020
|
| Performance Table Heading |
Average Annual Total Returns (For the periods ended December 31, 2025)
|
| Performance Table Narrative |
The Fund’s performance figures assume that all distributions were reinvested in the Fund. After-tax returns are calculated using the historical highest individual federal marginal income tax rates and do not reflect the impact of state and local taxes. Actual after-tax returns depend on an investor’s tax situation and may differ from those shown. After-tax returns for Class I Shares will differ from those shown for Class N Shares. After-tax returns shown are not relevant to investors who hold their Fund shares through tax-deferred arrangements, such as 401(k) plans or individual retirement accounts (“IRAs”). After-tax returns are shown for only one class and after-tax returns for other classes will vary.
|
| Performance Table Uses Highest Federal Rate |
After-tax returns are calculated using the historical highest individual federal marginal income tax rates and do not reflect the impact of state and local taxes.
|
| Performance Table Not Relevant to Tax Deferred |
After-tax returns shown are not relevant to investors who hold their Fund shares through tax-deferred arrangements, such as 401(k) plans or individual retirement accounts (“IRAs”).
|
| Performance [Table] |
| | | 1 Year | | 5 Years | | 10 Years | | Class N Shares | | | | | | | | Return Before Taxes | | 5.53% | | 3.94% | | 3.38% | | Return After Taxes on Distributions | | 3.56% | | 2.47% | | 2.15% | | Return After Taxes on Distributions and Sale of Fund Shares | | 3.48% | | 2.40% | | 2.06% | | Class I Shares | | | | | | | | Return Before Taxes | | 5.61% | | 4.00% | | 3.47% | | Bloomberg US Aggregate Index (reflects no deduction for fees, expenses or taxes) | | 7.30% | | (0.36)% | | 2.01% | | Bloomberg U.S. 1-3 Year Treasury Bond Index (reflects no deduction for fees, expenses or taxes) | | 5.17% | | 1.75% | | 1.83% | | Reference Benchmark (an unmanaged weighted index comprised as follows: 40% Bloomberg Short-Term Corporate Index; 40% Bloomberg US Aggregate ABS Index; and 20% Bloomberg US Treasury Bills Index) | | 5.16% | | 2.98% | | 2.60% |
|
| Performance Table One Class of after Tax Shown [Text] |
After-tax returns are shown for only one class and after-tax returns for other classes will vary.
|
| Index No Deduction for Fees, Expenses, or Taxes [Text] |
reflects no deduction for fees, expenses or taxes
|
| Performance Availability Website Address [Text] |
www.bbhfunds.com
|
| Performance Availability Phone [Text] |
1-800-575-1265
|
| BBH INCOME FUND |
|
| Prospectus [Line Items] |
|
| Bar Chart and Performance Table [Heading] |
Fund Performance
|
| Performance Narrative [Text Block] |
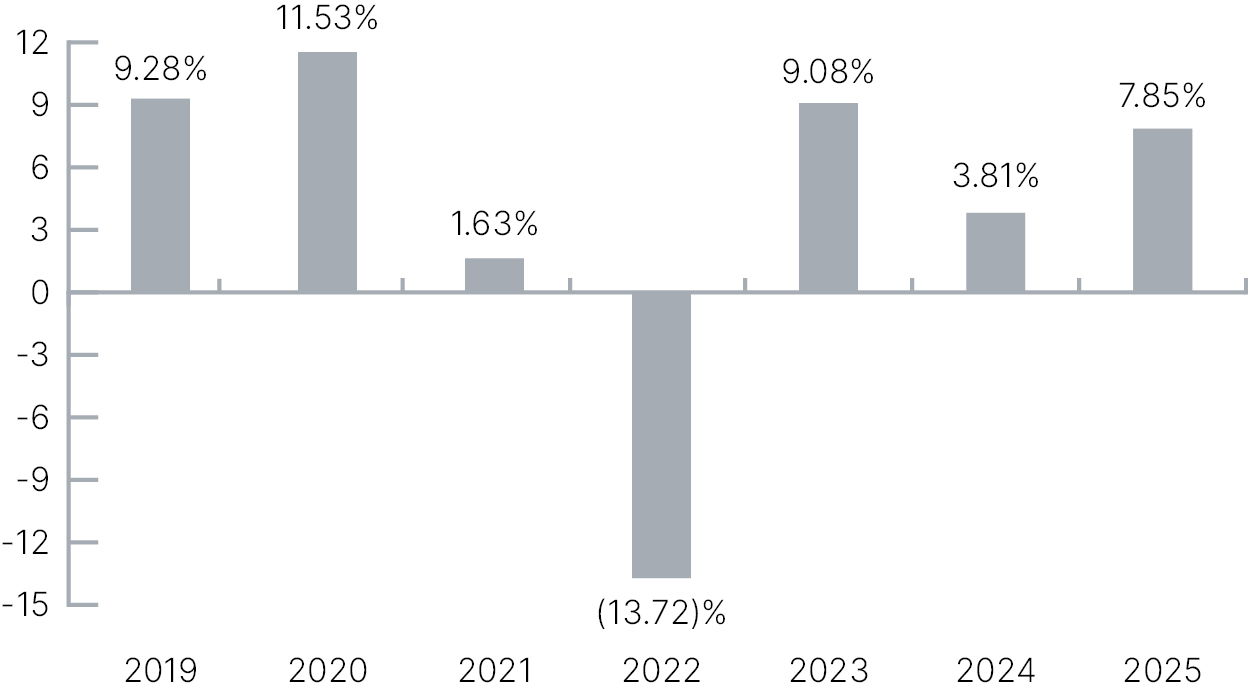
The following bar chart and table give an indication of the risks involved with an investment in the Fund. The bar chart shows changes in the performance of the Fund’s Class I Shares from year to year. The table shows how the average annual returns of the Fund’s Class I Shares for the periods indicated compared to a broad-based securities market index. One cannot invest directly in an index.
When you consider this information, please remember that the Fund’s performance (before and after taxes) in past years is not necessarily an indication of how the Fund will perform in the future. Updated information on the Fund’s performance can be obtained by visiting www.bbhfunds.com or can be obtained by phone at 1-800-575-1265.
|
| Performance Past Does Not Indicate Future [Text] |
When you consider this information, please remember that the Fund’s performance (before and after taxes) in past years is not necessarily an indication of how the Fund will perform in the future.
|
| Performance Information Illustrates Variability of Returns [Text] |
The following bar chart and table give an indication of the risks involved with an investment in the Fund. The bar chart shows changes in the performance of the Fund’s Class I Shares from year to year. The table shows how the average annual returns of the Fund’s Class I Shares for the periods indicated compared to a broad-based securities market index.
|
| Bar Chart [Heading] |
Total Returns for Class I Shares (% Per Calendar Year)
|
| Bar Chart [Table] |
|
| Bar Chart Closing [Text Block] |
| Highest Performing Quarter: | | 7.29% in 4th quarter of 2023 | | Lowest Performing Quarter: | | (6.26)% in 2nd quarter of 2022 |
|
| Highest Quarterly Return, Label [Optional Text] |
Highest Performing Quarter
|
| Highest Quarterly Return |
7.29%
|
| Highest Quarterly Return, Date |
Dec. 31, 2023
|
| Lowest Quarterly Return, Label [Optional Text] |
Lowest Performing Quarter
|
| Lowest Quarterly Return |
(6.26%)
|
| Lowest Quarterly Return, Date |
Jun. 30, 2022
|
| Performance Table Heading |
Average Annual Total Returns (For the periods ended December 31, 2025)
|
| Performance Table Narrative |
The Fund’s performance figures assume that all distributions were reinvested in the Fund. After-tax returns are calculated using the historical highest individual federal marginal income tax rates and do not reflect the impact of state and local taxes. Actual after-tax returns depend on an investor’s tax situation and may differ from those shown. After-tax returns for Class I Shares will differ from those shown for Class N Shares, once that share class is operational. After-tax returns shown are not relevant to investors who hold their Fund shares through tax-deferred arrangements, such as 401(k) plans or individual retirement accounts (“IRAs”). After-tax returns are shown for only one class and after-tax returns for other classes will vary.
|
| Performance Table Uses Highest Federal Rate |
After-tax returns are calculated using the historical highest individual federal marginal income tax rates and do not reflect the impact of state and local taxes.
|
| Performance Table Not Relevant to Tax Deferred |
After-tax returns shown are not relevant to investors who hold their Fund shares through tax-deferred arrangements, such as 401(k) plans or individual retirement accounts (“IRAs”).
|
| Performance [Table] |
| | | 1 Year | | 5 Years | | Since
Inception
(June 27, 2018) | | Class I Shares | | | | | | | | Return Before Taxes | | 7.85% | | 1.38% | | 3.79% | | Return After Taxes on Distributions | | 5.54% | | (0.55)% | | 1.69% | | Return After Taxes on Distributions and Sale of Fund Shares | | 4.91% | | 0.23% | | 2.02% | | Bloomberg US Aggregate Index (reflects no deduction for fees, expenses or taxes) | | 7.30% | | (0.36)% | | 2.07% |
|
| Performance Table One Class of after Tax Shown [Text] |
After-tax returns are shown for only one class and after-tax returns for other classes will vary.
|
| Index No Deduction for Fees, Expenses, or Taxes [Text] |
reflects no deduction for fees, expenses or taxes
|
| Performance Availability Website Address [Text] |
www.bbhfunds.com
|
| Performance Availability Phone [Text] |
1-800-575-1265
|
| BBH Intermediate Municipal Bond Fund |
|
| Prospectus [Line Items] |
|
| Bar Chart and Performance Table [Heading] |
Fund Performance
|
| Performance Narrative [Text Block] |
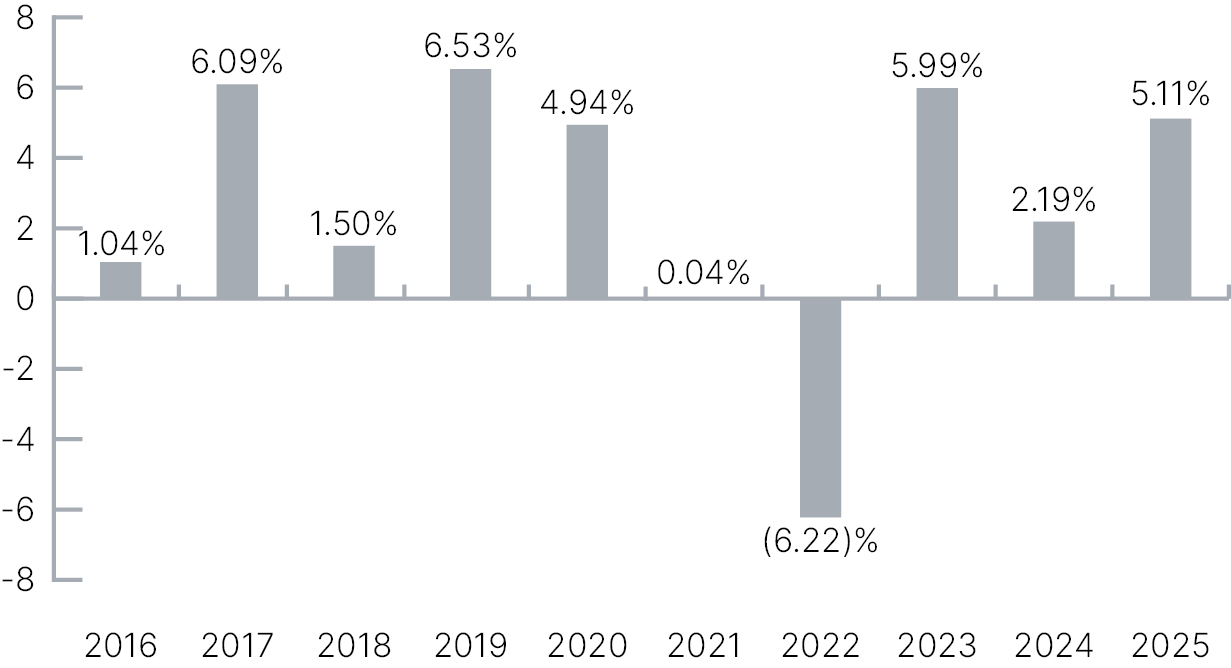
The following bar chart and table are designed to give an indication of the risks involved with an investment in the Fund. The bar chart shows changes in the performance of the Fund’s Class N Shares from year to year. The table shows how the average annual returns of the Fund’s Class N Shares and Class I Shares for the periods indicated compared to a broad-based securities market index. One cannot invest directly in an index.
When you consider this information, please remember that the Fund’s performance (before and after taxes) in past years is not necessarily an indication of how the Fund will perform in the future. Updated information on the Fund’s performance can be obtained by visiting www.bbhfunds.com or can be obtained by phone at 1-800-575-1265.
|
| Performance Past Does Not Indicate Future [Text] |
When you consider this information, please remember that the Fund’s performance (before and after taxes) in past years is not necessarily an indication of how the Fund will perform in the future.
|
| Performance Information Illustrates Variability of Returns [Text] |
The following bar chart and table are designed to give an indication of the risks involved with an investment in the Fund. The bar chart shows changes in the performance of the Fund’s Class N Shares from year to year. The table shows how the average annual returns of the Fund’s Class N Shares and Class I Shares for the periods indicated compared to a broad-based securities market index.
|
| Bar Chart [Heading] |
Total Return for Class N Shares (% Per Calendar Year)
|
| Bar Chart [Table] |
|
| Bar Chart Closing [Text Block] |
| Highest Performing Quarter: | | 6.38% in 4th quarter of 2023 | | Lowest Performing Quarter: | | (5.39)% in 1st quarter of 2022 |
|
| Highest Quarterly Return, Label [Optional Text] |
Highest Performing Quarter
|
| Highest Quarterly Return |
6.38%
|
| Highest Quarterly Return, Date |
Dec. 31, 2023
|
| Lowest Quarterly Return, Label [Optional Text] |
Lowest Performing Quarter
|
| Lowest Quarterly Return |
(5.39%)
|
| Lowest Quarterly Return, Date |
Mar. 31, 2022
|
| Performance Table Heading |
Average Annual Total Returns (For the periods ended December 31, 2025)
|
| Performance Table Narrative |
The Fund’s performance figures assume that all distributions were reinvested in the Fund. After-tax returns are calculated using the historical highest individual federal marginal income tax rates and do not reflect the impact of state and local taxes. Actual after-tax returns depend on an investor’s tax situation and may differ from those shown. After-tax returns shown are not relevant to investors who hold their Fund shares through tax-deferred arrangements, such as 401(k) plans or IRAs. After-tax returns are shown for only one class and after-tax returns for other classes will vary.
|
| Performance Table Uses Highest Federal Rate |
After-tax returns are calculated using the historical highest individual federal marginal income tax rates and do not reflect the impact of state and local taxes.
|
| Performance Table Not Relevant to Tax Deferred |
After-tax returns shown are not relevant to investors who hold their Fund shares through tax-deferred arrangements, such as 401(k) plans or IRAs.
|
| Performance [Table] |
| | | 1 Year | | 5 Years | | 10 Years | | Class N Shares | | | | | | | | Return Before Taxes | | 5.11% | | 1.32% | | 2.65% | | Return After Taxes on Distributions | | 5.02% | | 1.26% | | 2.49% | | Return After Taxes on Distributions and Sale of Fund Shares | | 4.66% | | 1.55% | | 2.48% | | Class I Shares | | | | | | | | Return Before Taxes | | 5.44% | | 1.53% | | 2.84% | | Bloomberg Municipal Bond 1-15 Year Blend Index (reflects no deduction of fees, expenses or taxes) | | 5.18% | | 1.16% | | 2.27% |
|
| Performance Table One Class of after Tax Shown [Text] |
After-tax returns are shown for only one class and after-tax returns for other classes will vary.
|
| Index No Deduction for Fees, Expenses, or Taxes [Text] |
reflects no deduction of fees, expenses or taxes
|
| Performance Availability Website Address [Text] |
www.bbhfunds.com
|
| Performance Availability Phone [Text] |
1-800-575-1265
|
| BBH U.S. Government Money Market Fund |
|
| Prospectus [Line Items] |
|
| Bar Chart and Performance Table [Heading] |
Fund Performance
|
| Performance Narrative [Text Block] |
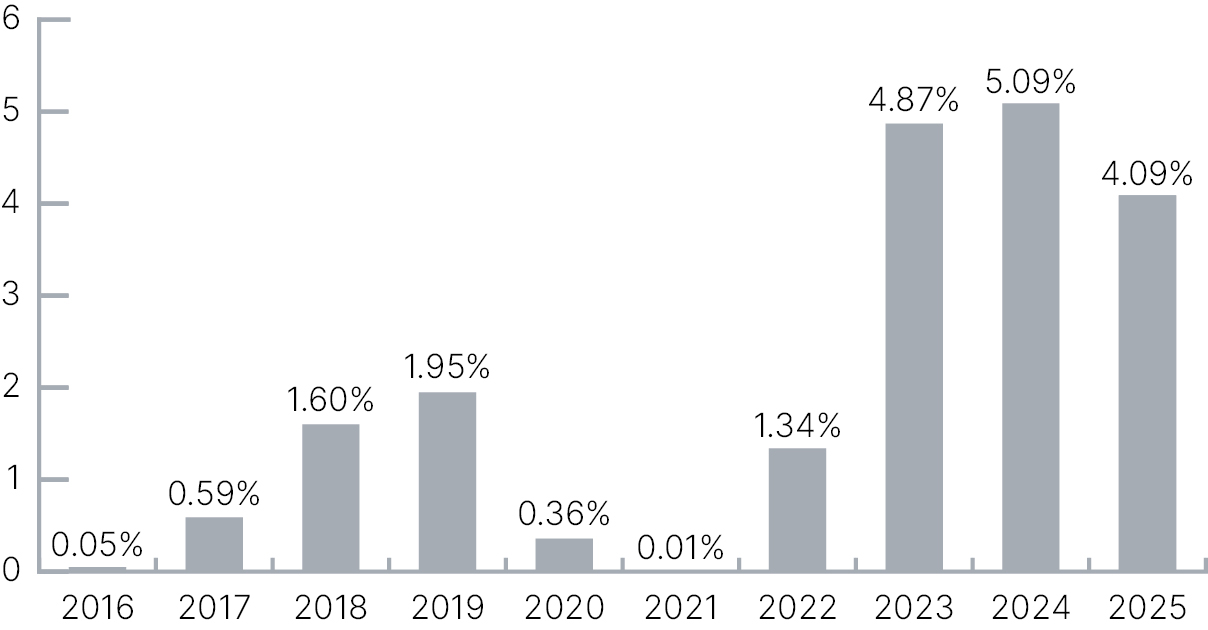
The following bar chart and table give an indication of the risks involved with an investment in the Fund. The bar chart shows changes in the performance of the Fund’s Institutional Shares from year to year. The table shows the average annual returns of the Fund’s Institutional Shares for the periods indicated.
For current yield information, please call 1-800-575-1265 toll free, or contact your account representative. When you consider this information, please remember that the Fund’s performance in past years is not necessarily an indication of how the Fund will perform in the future.
|
| Performance Past Does Not Indicate Future [Text] |
When you consider this information, please remember that the Fund’s performance in past years is not necessarily an indication of how the Fund will perform in the future.
|
| Performance Information Illustrates Variability of Returns [Text] |
The following bar chart and table give an indication of the risks involved with an investment in the Fund. The bar chart shows changes in the performance of the Fund’s Institutional Shares from year to year. The table shows the average annual returns of the Fund’s Institutional Shares for the periods indicated.
|
| Bar Chart [Heading] |
Total Return for Institutional Shares (% Per Calendar Year)
|
| Bar Chart [Table] |
|
| Bar Chart Closing [Text Block] |
| Highest Performing Quarter: | | 1.31% in 4th quarter of 2023 | | Lowest Performing Quarter: | | 0.00% in 1st quarter of 2021 |
|
| Highest Quarterly Return, Label [Optional Text] |
Highest Performing Quarter
|
| Highest Quarterly Return |
1.31%
|
| Highest Quarterly Return, Date |
Dec. 31, 2023
|
| Lowest Quarterly Return, Label [Optional Text] |
Lowest Performing Quarter
|
| Lowest Quarterly Return |
none
|
| Lowest Quarterly Return, Date |
Mar. 31, 2021
|
| Performance Table Heading |
Average Annual Total Returns (For the periods ended December 31, 2025)
|
| Performance [Table] |
|
|
|
1 Year
|
|
5 Years
|
|
10 Years
|
|
Institutional Shares
|
|
4.09% |
|
3.06% |
|
1.98% |
|
| Performance Availability Phone [Text] |
1-800-575-1265
|