Performance Management
|
Oct. 31, 2025 |
| HSBC U.S. Government Money Market Fund |
|
| Prospectus [Line Items] |
|
| Bar Chart and Performance Table [Heading] |
Performance
Bar Chart and Table
|
| Performance Narrative [Text Block] |
The bar chart and table below provide an indication of the risks
of an investment in the Fund by showing changes in the Fund’s year to year performance. Past performance does not indicate how
the Fund will perform in the future.
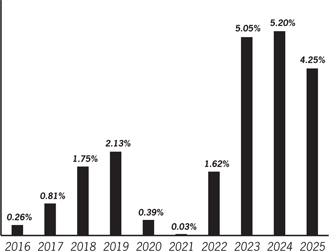
The bar chart below shows the Fund’s annual returns for Class
I Shares and how performance has varied from year to year. The returns for the Fund’s other share classes will differ from the
returns of the Class I Shares shown in the bar chart because the expenses of the classes differ.
|
| Performance Past Does Not Indicate Future [Text] |
Past performance does not indicate how
the Fund will perform in the future.
|
| Performance Information Illustrates Variability of Returns [Text] |
The bar chart and table below provide an indication of the risks
of an investment in the Fund by showing changes in the Fund’s year to year performance.
|
| Bar Chart [Heading] |
Annual
Total Returns as of 12/31 for Class I Shares
Bar chart assumes reinvestment of dividends and distributions
|
| Bar Chart [Table] |
| Year |
Returns |
| 2016 |
0.26% |
| 2017 |
0.81% |
| 2018 |
1.75% |
| 2019 |
2.13% |
| 2020 |
0.39% |
| 2021 |
0.03% |
| 2022 |
1.62% |
| 2023 |
5.05% |
| 2024 |
5.20% |
| 2025 |
4.25% |
|
| Bar Chart Closing [Text Block] |
| Best
Quarter: |
12/31/2023 |
1.34% |
| Worst
Quarter: |
12/31/2021 |
0.01% |
|
| Highest Quarterly Return, Label [Optional Text] |
Best
Quarter:
|
| Highest Quarterly Return |
1.34%
|
| Highest Quarterly Return, Date |
Dec. 31, 2023
|
| Lowest Quarterly Return, Label [Optional Text] |
Worst
Quarter:
|
| Lowest Quarterly Return |
0.01%
|
| Lowest Quarterly Return, Date |
Dec. 31, 2021
|
| Performance Table Heading |
Average
Annual Total Returns^ (for the periods ended December 31, 2025)
|
| Performance Table Narrative |
The table below lists the average annual total returns for each class
of shares for various time periods. As of December 31, 2025, the 7-day yields of the Fund’s Class A, Class I, Intermediary,
Intermediary Service, Class P and Class Y Shares were 3.34%, 3.69%, 3.66%, 3.64%, 3.64% and 3.59%, respectively. The 7-day yield
information reflects any contractual and voluntary fee waivers/expense reimbursements. Without these fee waivers/expense reimbursements,
the yields would have been lower. For current yield information on the Fund, call 1-800-782-8183.
Past performance is not an indication of how the Fund will perform in
the future.
|
| Performance [Table] |
| |
Inception
Date |
1
Year |
5
Years |
10
Years |
Since
Inception |
| Class
A Shares |
Apr.
1, 1999 |
3.89% |
2.93% |
1.85% |
1.77% |
| Class
I Shares |
Dec.
24, 2003 |
4.25% |
3.21% |
2.13% |
1.46% |
| Intermediary
Shares |
July
12, 2016 |
4.22% |
3.18% |
- |
2.21% |
| Intermediary
Service Shares |
July
12, 2016 |
4.20% |
3.17% |
- |
2.19% |
| Class
P Shares |
May
11, 2023 |
4.20% |
- |
- |
4.82% |
| Class
Y Shares |
July
1, 1996 |
4.15% |
3.12% |
2.04% |
2.22% |
| ^ | During
the year ended December 31, 2007, the Fund received a one-time reimbursement from the Adviser
related to past marketing arrangements. During the year ended December 31, 2010, the Fund
also received a one-time payment in respect of a class action settlement. As a result, the
Fund’s total returns for the years ended December 31, 2007 and 2010 were higher than
they would have been had the Fund not received these payments. |
|
| Money Market Seven Day Yield, Caption [Optional Text] |
yields
|
| Money Market Seven Day Yield Phone |
1-800-782-8183
|
| HSBC U.S. Government Money Market Fund | HSBC U.S. Government Money Market Fund Class A Shares |
|
| Prospectus [Line Items] |
|
| Money Market Seven Day Yield |
3.34%
|
| HSBC U.S. Government Money Market Fund | HSBC U.S. Government Money Market Fund Class I Shares |
|
| Prospectus [Line Items] |
|
| Money Market Seven Day Yield |
3.69%
|
| HSBC U.S. Government Money Market Fund | HSBC U.S. Government Money Market Fund Intermediary Class |
|
| Prospectus [Line Items] |
|
| Money Market Seven Day Yield |
3.66%
|
| HSBC U.S. Government Money Market Fund | HSBC U.S. Government Money Market Fund Intermediary Service Class |
|
| Prospectus [Line Items] |
|
| Money Market Seven Day Yield |
3.64%
|
| HSBC U.S. Government Money Market Fund | HSBC U.S. Government Money Market Fund Class P Shares |
|
| Prospectus [Line Items] |
|
| Money Market Seven Day Yield |
3.64%
|
| HSBC U.S. Government Money Market Fund | HSBC U.S. Government Money Market Fund Class Y Shares |
|
| Prospectus [Line Items] |
|
| Money Market Seven Day Yield |
3.59%
|
| HSBC U.S. Treasury Money Market Fund |
|
| Prospectus [Line Items] |
|
| Bar Chart and Performance Table [Heading] |
Performance Bar Chart and Table
|
| Performance Narrative [Text Block] |
The bar chart and table below provide an indication of the risks
of an investment in the Fund by showing changes in the Fund’s year to year performance. Past performance does not indicate how
the Fund will perform in the future.
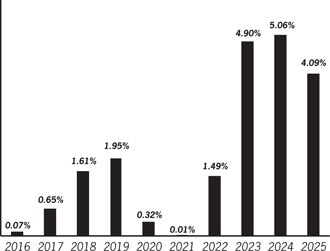
The bar chart below shows the Fund’s annual returns for Class
Y Shares and how performance has varied from year to year. The returns for the Fund’s other share classes will differ from the
returns of the Class Y Shares shown in the bar chart because the expenses of the classes differ.
|
| Performance Past Does Not Indicate Future [Text] |
Past performance does not indicate how
the Fund will perform in the future.
|
| Performance Information Illustrates Variability of Returns [Text] |
The bar chart and table below provide an indication of the risks
of an investment in the Fund by showing changes in the Fund’s year to year performance.
|
| Bar Chart [Heading] |
Annual
Total Returns as of 12/31 for Class Y Shares
Bar chart assumes reinvestment of dividends and distributions
|
| Bar Chart [Table] |
| Year |
Returns |
| 2016 |
0.07% |
| 2017 |
0.65% |
| 2018 |
1.61% |
| 2019 |
1.95% |
| 2020 |
0.32% |
| 2021 |
0.01% |
| 2022 |
1.49% |
| 2023 |
4.90% |
| 2024 |
5.06% |
| 2025 |
4.09% |
|
| Bar Chart Closing [Text Block] |
| Best
Quarter: |
12/31/2023 |
1.31% |
| Worst
Quarter: |
12/31/2021 |
0.00% |
|
| Highest Quarterly Return, Label [Optional Text] |
Best
Quarter:
|
| Highest Quarterly Return |
1.31%
|
| Highest Quarterly Return, Date |
Dec. 31, 2023
|
| Lowest Quarterly Return, Label [Optional Text] |
Worst
Quarter:
|
| Lowest Quarterly Return |
none
|
| Lowest Quarterly Return, Date |
Dec. 31, 2021
|
| Performance Table Heading |
Average
Annual Total Returns^ (for the periods ended December 31, 2025)
|
| Performance Table Narrative |
The table below lists the average annual total
returns for each class of shares for various time periods. As of December 31, 2025, the 7-day yields of the Fund’s Class
A, Class I, Intermediary, Intermediary Service, Class P and Class Y Shares were 3.31%, 3.68%, 3.66%, 3.64%, 3.64% and 3.56%, respectively.
The 7-day yield information reflects any contractual and voluntary fee waivers/expense reimbursements. Without these fee waivers/expense
reimbursements, the yields would have been lower. For current yield information on the Fund, call 1-800-782-8183.
Past performance is not an indication of how
the Fund will perform in the future.
|
| Performance [Table] |
| |
Inception
Date |
1
Year |
5
Years |
10
Years |
Since
Inception |
| Class
A Shares |
May
14, 2001 |
3.83% |
2.90% |
1.81% |
1.35% |
| Class
I Shares |
Dec.
30, 2003 |
4.21% |
3.18% |
2.09% |
1.54% |
| Intermediary
Shares |
July
12, 2016 |
4.19% |
3.16% |
- |
2.17% |
| Intermediary
Service Shares |
July
12, 2016 |
4.17% |
3.15% |
- |
2.17% |
| Class
P Shares |
May
11, 2023 |
4.17% |
- |
- |
4.80% |
| Class
Y Shares |
May
11, 2001 |
4.09% |
3.09% |
2.00% |
1.51% |
| ^ | During
the year ended December 31, 2007, the Fund received a one-time reimbursement from the Adviser
related to past marketing arrangements. During the year ended December 31, 2010, the Fund
also received a one-time payment in respect of a class action settlement. As a result, the
Fund’s total returns for the years ended December 31, 2007 and 2010 were higher than
they would have been had the Fund not received these payments. |
|
| Money Market Seven Day Yield, Caption [Optional Text] |
yields
|
| Money Market Seven Day Yield Phone |
1-800-782-8183
|
| HSBC U.S. Treasury Money Market Fund | HSBC U.S. Treasury Money Market Fund Class A Shares |
|
| Prospectus [Line Items] |
|
| Money Market Seven Day Yield |
3.31%
|
| HSBC U.S. Treasury Money Market Fund | HSBC U.S. Treasury Money Market Fund Class I Shares |
|
| Prospectus [Line Items] |
|
| Money Market Seven Day Yield |
3.68%
|
| HSBC U.S. Treasury Money Market Fund | HSBC U.S. Treasury Money Market Fund Intermediary Class |
|
| Prospectus [Line Items] |
|
| Money Market Seven Day Yield |
3.66%
|
| HSBC U.S. Treasury Money Market Fund | HSBC U.S. Treasury Money Market Fund Intermediary Service Class |
|
| Prospectus [Line Items] |
|
| Money Market Seven Day Yield |
3.64%
|
| HSBC U.S. Treasury Money Market Fund | HSBC U.S. Treasury Money Market Fund Class P Shares |
|
| Prospectus [Line Items] |
|
| Money Market Seven Day Yield |
3.64%
|
| HSBC U.S. Treasury Money Market Fund | HSBC U.S. Treasury Money Market Fund Class Y Shares |
|
| Prospectus [Line Items] |
|
| Money Market Seven Day Yield |
3.56%
|