The following bar chart and table provide an indication of the risks of investing in Third Avenue Value Fund. The bar chart shows changes in the performance of the Fund’s Institutional Class shares from year to year over the past 10 calendar years. The table compares the average annual total returns of the Fund’s Institutional Class, Investor Class and Z Class shares to a broad measure of market performance. All returns assume reinvestment of dividends and distributions. As with all mutual funds, the Fund’s past performance, before and after taxes, is not necessarily an indication of how the Fund will perform in the future. Updated performance information is available at no cost by visiting www.thirdave.com or by calling (800) 443-1021.
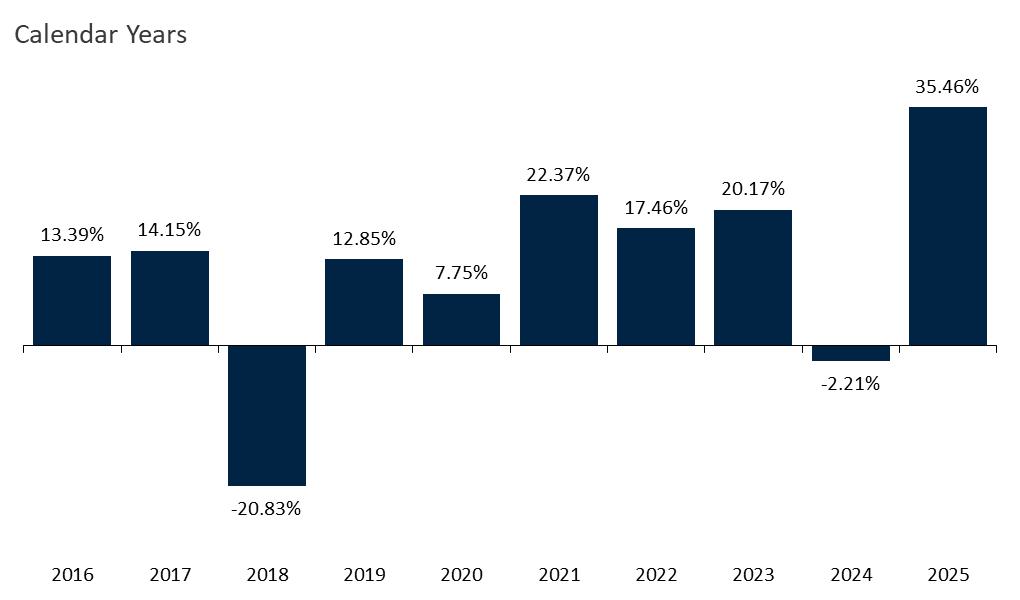
During the period shown in the above bar chart, the highest return for a quarter was 35.84% (quarter ended December 31, 2020) and the lowest return for a quarter was (42.08)% (quarter ended March 31, 2020).
After-tax returns are shown only for Institutional Class shares. After-tax returns of the Fund’s other share classes will vary from those of the Institutional Class. After-tax returns are calculated using the historical highest individual federal marginal income tax rates and do not reflect the impact of state and local taxes. Actual after-tax returns depend on the investor’s tax situation and may differ from those shown, and the after-tax returns shown are not relevant to investors who hold their Fund shares through tax-deferred arrangements, such as 401(k) plans or Individual Retirement Accounts (“IRAs”).
| Average Annual Total Returns For the periods ending 12/31/25 | Inception Date |
One Year |
Five Years |
Ten Years |
Since Inception | |||||
| Institutional Class Before Taxes | 11/1/90 | 35.46% | 18.00% | 11.04% | 10.92% | |||||
| After Taxes on Distributions | 33.36% | 16.31% | 9.39% | 9.57% | ||||||
| After Taxes on Distributions and Sale of Fund Shares | 22.49% | 14.24% | 8.56% | 9.18% | ||||||
| Investor Class Before Taxes | 12/31/09 | 35.15% | 17.70% | 10.76% | 8.35% | |||||
| Z Class Before Taxes | 3/1/18 | 35.56% | 18.11% | 10.71% | ||||||
| MSCI World Index (reflects no deductions for fees, expenses, or taxes)1 | 21.60% | 12.66% | 12.74% | 9.05% (Institutional) 11.27% (Investor) 12.22% (Z Class) |
| 1 | The MSCI World Index captures large and mid-cap representation across 23 Developed Markets countries. With 1,320 constituents, the MSCI World Index covers approximately 85% of the free float-adjusted market capitalization in each country. The MSCI World Index is not a security that can be purchased or sold, and its total returns are reflective of unmanaged portfolios. It is not possible to invest directly in an unmanaged index. |
The following bar chart and table provide an indication of the risks of investing in Third Avenue Small-Cap Value Fund. The bar chart shows changes in the performance of the Fund’s Institutional Class shares from year to year over the past 10 calendar years. The table compares the average annual total returns of the Fund’s Institutional Class, Investor Class and Z Class shares to a broad-based securities market index that reflects the performance of the overall market applicable to the Fund and an additional index that represents the market sectors in which the Fund primarily invests. All returns assume reinvestment of dividends and distributions. As with all mutual funds, the Fund’s past performance, before and after taxes, is not necessarily an indication of how the Fund will perform in the future. Updated performance information is available at no cost by visiting www.thirdave.com or by calling (800) 443-1021.
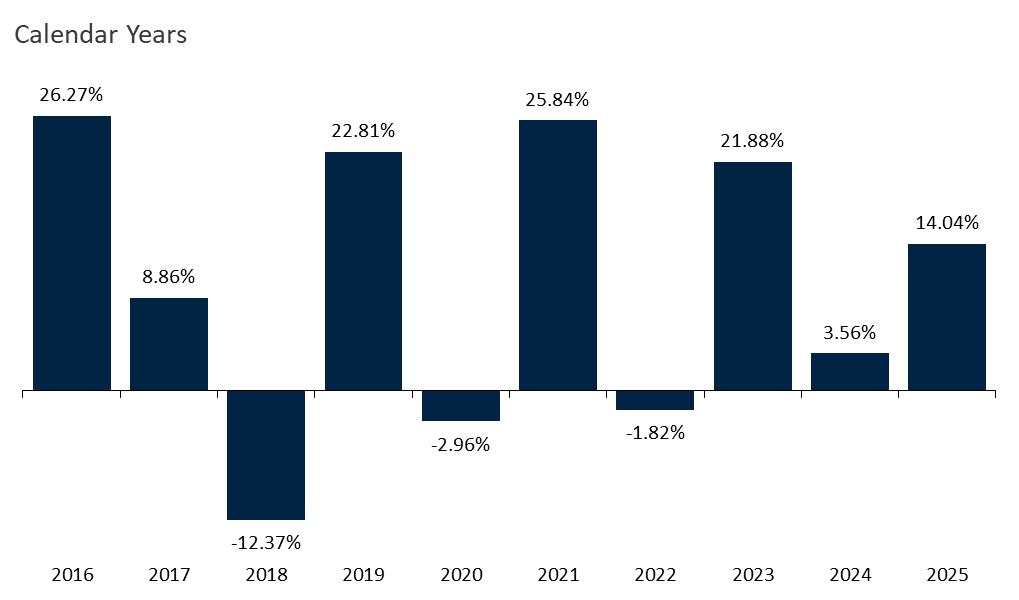
During the period shown in the above bar chart, the highest return for a quarter was 24.04% (quarter ended December 31, 2020) and the lowest return for a quarter was (29.59)% (quarter ended March 31, 2020).
After-tax returns are shown only for Institutional Class shares. After-tax returns of the Fund’s other share classes will vary from those of the Institutional Class. After-tax returns are calculated using the historical highest individual federal marginal income tax rates and do not reflect the impact of state and local taxes. Actual after-tax returns depend on the investor’s tax situation and may differ from those shown, and the after-tax returns shown are not relevant to investors who hold their Fund shares through tax-deferred arrangements, such as 401(k) plans or Individual Retirement Accounts (“IRAs”).
| Average Annual Total Returns For the periods ending 12/31/25 | Inception Date |
One Year |
Five Years |
Ten Years |
Since Inception | |||||
| Institutional Class Before Taxes | 4/1/97 | 14.04% | 12.20% | 9.82% | 8.73% | |||||
| After Taxes on Distributions | 13.07% | 10.06% | 7.72% | 7.30% | ||||||
| After Taxes on Distributions and Sale of Fund Shares | 9.03% | 9.44% | 7.52% | 7.16% | ||||||
| Investor Class Before Taxes | 12/31/09 | 13.71% | 11.92% | 9.55% | 9.11% | |||||
| Z Class Before Taxes | 3/1/18 | 14.11% | 12.31% | 8.48% | ||||||
| MSCI USA All Cap Index (reflects no deductions for fees, expenses, or taxes)1 | 17.27% | 13.29% | 14.39% | N/A (Institutional) N/A (Investor) 13.88% (Z Class) | ||||||
| MSCI USA Small Cap Value Index (reflects no deductions for fees, expenses, or taxes)1 | 10.80% | 10.09% | 9.63% | 9.71% (Institutional) 10.66% (Investor) 8.22% (Z Class) |
| 1 | The MSCI USA All Cap Index captures broad US equity coverage. The index includes 3,356 constituents across large, mid, small and micro capitalizations, representing about 99% of the US equity universe. The Fund will also use the MSCI USA Small Cap Value Index as a secondary benchmark. The MSCI USA Small Cap Value Index captures small cap securities exhibiting overall value style characteristics across the US equity markets. The value investment style characteristics for index construction are defined using three variables: book value to price, 12-month forward earnings to price and dividend yield. The MSCI USA All Cap Index and the MSCI USA Small Cap Value Index are not securities that can be purchased or sold, and their total returns are reflective of unmanaged portfolios. The returns include reinvestment of all distributions. It is not possible to invest directly in an unmanaged index. |
The following bar chart and table provide an indication of the risks of investing in Third Avenue Real Estate Value Fund. The bar chart shows changes in the performance of the Fund’s Institutional Class shares from year to year over the past 10 calendar years. The table compares the average annual total returns of the Fund’s Institutional Class, Investor Class and Z Class shares to a broad-based securities market index that reflects the performance of the overall market applicable to the Fund and an additional index that represents the market sectors in which the Fund primarily invests. All returns assume reinvestment of dividends and distributions. As with all mutual funds, the Fund’s past performance, before and after taxes, is not necessarily an indication of how the Fund will perform in the future. Updated performance information is available at no cost by visiting www.thirdave.com or by calling (800) 443-1021.
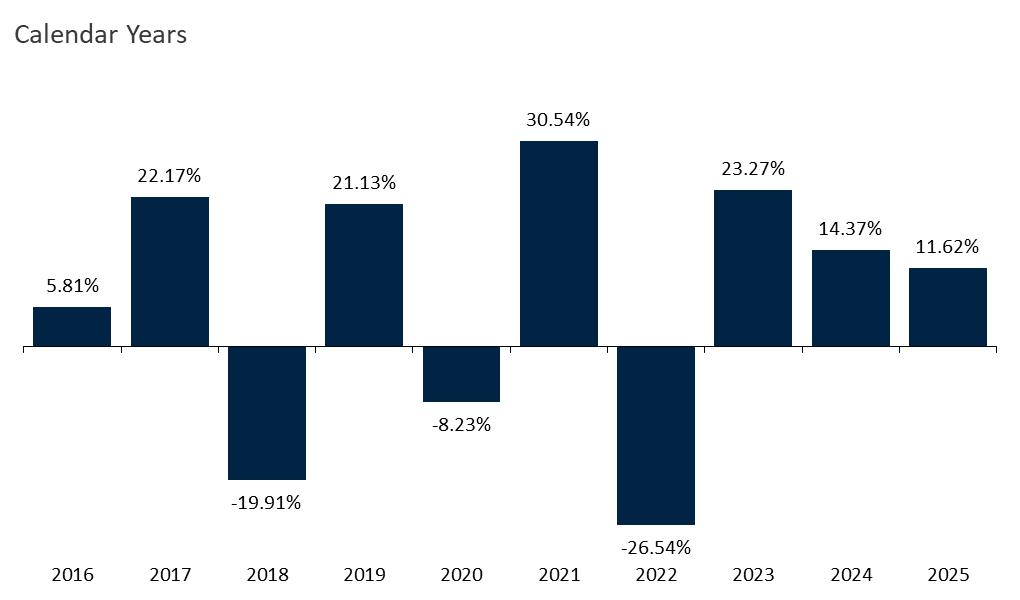
During the period shown in the above bar chart, the highest return for a quarter was 20.67% (quarter ended December 31, 2023) and the lowest return for a quarter was (28.83)% (quarter ended March 31, 2020).
After-tax returns are shown only for Institutional Class shares. After-tax returns of the Fund’s other share classes will vary from those of the Institutional Class. After-tax returns are calculated using the historical highest individual federal marginal income tax rates and do not reflect the impact of state and local taxes. Actual after-tax returns depend on the investor’s tax situation and may differ from those shown, and the after-tax returns shown are not relevant to investors who hold their Fund shares through tax-deferred arrangements, such as 401(k) plans or Individual Retirement Accounts (“IRAs”).
| Average Annual Total Returns For the periods ending 12/31/25 | Inception Date |
One Year |
Five Years |
Ten Years |
Since Inception | |||||
| Institutional Class Before Taxes | 9/17/98 | 11.62% | 8.58% | 5.68% | 8.96% | |||||
| After Taxes on Distributions | 10.16% | 6.80% | 3.93% | 7.59% | ||||||
| After Taxes on Distributions and Sale of Fund Shares | 7.68% | 6.46% | 4.17%1 | 7.41% | ||||||
| Investor Class Before Taxes | 12/31/09 | 11.33% | 8.31% | 5.41% | 7.06% | |||||
| Z Class Before Taxes | 3/1/18 | 11.71% | 8.68% | 4.41% | ||||||
| MSCI World Index (reflects no deductions for fees, expenses, or taxes)2 | 21.60% | 12.66% | 12.74% |
8.27% (Z Class) | ||||||
| MSCI ACWI IMI Core Real Estate Index (reflects no deductions for fees, expenses, or taxes)2 | 10.90% | 3.49% | 4.37% |
7.64% 3.86% |
| 1 | The Return After Taxes on Distributions and Sale of Fund Shares is higher than the Return After Taxes on Distributions because of realized losses that would have been sustained upon the sale of Fund shares immediately after the relevant periods. |
| 2 | The MSCI World Index captures large and mid-cap representation across 23 Developed Markets countries. With 1,320 constituents, the MSCI World Index covers approximately 85% of the free float-adjusted market capitalization in each country. The Fund will also use the MSCI ACWI IMI Core Real Estate Index as a secondary benchmark. The MSCI ACWI IMI Core Real Estate Index is a free float-adjusted market capitalization index that consists of large, mid and small-cap stocks across 23 Developed Markets and 24 Emerging Markets countries engaged in ownership, development and management of specific core property type real estate. The MSCI ACWI IMI Core Real Estate Index excludes companies, such as real estate services and real estate financing companies, that do not own properties. The MSCI World Index and the MSCI ACWI IMI Core Real Estate Index are not securities that can be purchased or sold, and their total returns are reflective of unmanaged portfolios. The returns include reinvestment of all distributions. It is not possible to invest directly in an unmanaged index. |
The following bar chart and table provide an indication of the risks of investing in the Fund. The Fund commenced operations after all of the assets of another investment company advised by the Fund’s investment adviser, the Third Avenue International Real Estate Value Fund (formerly, the REMS International Real Estate Value-Opportunity Fund) (the “Predecessor Fund”), were transferred to the Fund in exchange for Institutional Class and Z Class shares of the Fund, respectively, in a tax-free reorganization on April 12, 2021 (the “Reorganization”). The performance figures for the Fund’s Class Institutional Class shares in the bar chart for periods prior to April 12, 2021 represent the performance of the Predecessor Fund’s Institutional Class shares from year to year.
The table compares the average annual total returns of the Fund’s Institutional Class and Z Class shares (all performance information for periods prior to April 12, 2021 is based on the Predecessor Fund’s Institutional Class and Z Class shares, respectively) to a broad-based securities market index that reflects the performance of the overall market applicable to the Fund and an additional index that represents the market sectors in which the Fund primarily invests. The Fund’s Investor Class shares have not commenced operations as of the date of this Prospectus. All returns assume reinvestment of dividends and distributions. As with all mutual funds, the Fund’s past performance, before and after taxes, is not necessarily an indication of how the Fund will perform in the future. Updated performance information is available at no cost by visiting www.thirdave.com or by calling (800) 443-1021.
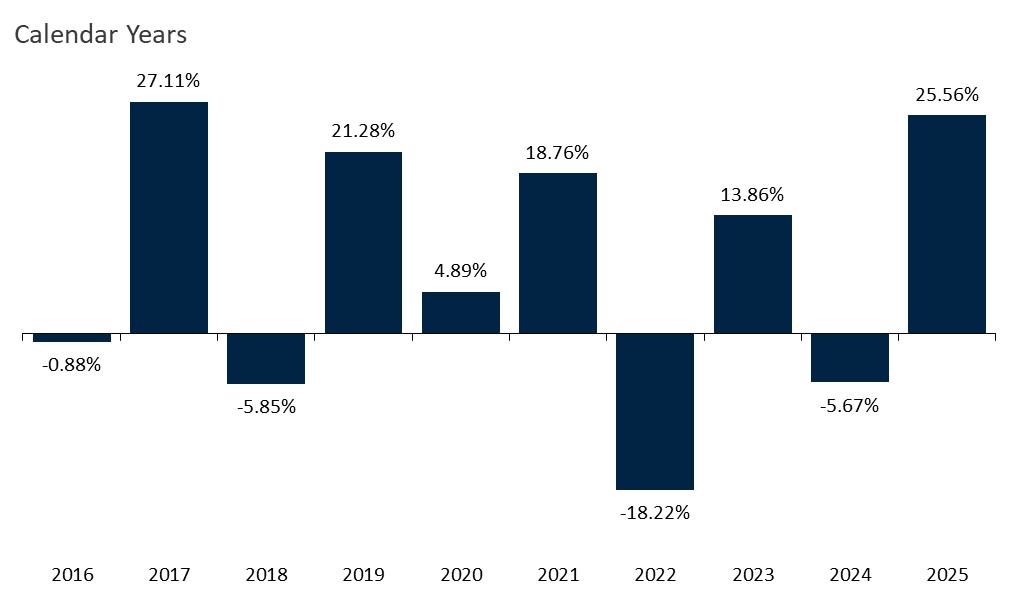
During the periods shown, the highest quarterly return was 17.30% (quarter ended December 31, 2020) and the lowest quarterly return was (25.51%) (quarter ended March 31, 2020).
The table below shows how average annual total returns of the Fund’s Institutional Class shares compared to those of the Fund’s benchmark. All performance information for periods prior to April 12, 2021 is based on the Predecessor Fund’s Institutional Class and Z Class shares, respectively. The table also presents the impact of taxes on the Predecessor Fund’s Institutional Class shares. After-tax returns are calculated using the historical highest individual federal marginal income tax rates and do not reflect the impact of state and local taxes. Actually after-tax returns depend on an investor’s tax situation and may differ from those shown. After-tax returns shown are not relevant to investors who hold their Fund shares through tax-deferred arrangements, such as 401(k) plans or individual retirement accounts. The after-tax returns for the Investor Class shares and Z Class shares will differ from those of the Institutional Shares as the expenses of the classes differ.
| Average Annual Returns for the periods ending 12/31/25 | Inception Date |
One Year |
Five Years |
Ten Years |
Since Inception | |||||
| Institutional Class Before Taxes | 3/19/14 | 25.56% | 5.54% | 7.08% | 5.95% | |||||
| After Taxes on Distributions | 24.84% | 5.06% | 6.08% | 4.99% | ||||||
| After Taxes on Distributions and Sale of Fund Shares | 15.56% | 4.34% | 5.34% | 4.41% | ||||||
| Z Class Shares Before Taxes | 4/20/18 | 25.49% | 5.55% | 5.71% | ||||||
| MSCI World ex USA Index (reflects no deduction for fees, expenses, or taxes)1 | 32.55% | 10.04% | 9.11% | 7.15% (Institutional) 8.28% (Z Class) | ||||||
| MSCI ACWI ex USA IMI Core Real Estate Index (reflects no deduction for fees, expenses, or taxes)1 | 22.14% | 0.36% | 3.03% | 2.99% (Institutional) 0.50% (Z Class) |
| * | As of December 31, 2025, there were no Investor Class shares outstanding for the Fund. |
| 1 | The MSCI World ex USA Index captures large and mid-cap representation across 22 of 23 Developed Market countries, excluding the United States. With 776 constituents, the MSCI World ex USA Index covers approximately 85% of the free float-adjusted market capitalization in each country. The Fund will also use the MSCI ACWI ex US IMI Core Real Estate Index as a secondary benchmark. The MSCI ACWI ex USA IMI Core Real Estate Index is a free float-adjusted market capitalization index that consists of large, mid and small-cap stocks across 22 Developed Markets and 24 Emerging Markets countries engaged in the ownership, development and management of specific core property type real estate. The MSCI ACWI ex USA IMI Core Real Estate Index excludes companies, such as real estate services and real estate financing companies, that do not own properties. The MSCI World ex USA Index and the MSCI ACWI ex USA IMI Core Real Estate Index are not securities that can be purchased or sold, and their total returns are reflective of unmanaged portfolios. The returns include reinvestment of all distributions. It is not possible to invest directly in an unmanaged index. |
| [1] | As of December 31, 2025, there were no Investor Class shares outstanding for the Fund. |