The fund seeks total return.
The accompanying tables describe the fees and expenses that you may pay if you buy, hold and sell shares of the fund.
You may qualify for sales charge discounts if you and your family invest, or agree to invest in the future, at least $50,000 in Credit Suisse Funds. More information about these and other discounts is available from your financial representative and in this Prospectus on page 64 under the heading "Other Shareholder Information—Classes of Shares and Sales Charges" and on page 69 under the heading "Intermediary-Specific Sales Charge Waiver Policies," and in the fund's Statement of Additional Information ("SAI") on page 81 under the heading "Additional Purchase and Redemption Information." You may pay other fees on purchases and sales of Class I shares of the fund, such as brokerage commissions and other fees to financial intermediaries which are not reflected in the table and examples below.
|
Class A |
Class C |
Class I |
|||||||||||||
|
Maximum sales charge (load) imposed on purchases (as a percentage of offering price) |
4.75 |
% |
None |
None |
|||||||||||
|
Maximum deferred sales charge (load) (as a percentage of the lesser of original purchase price or redemption proceeds, as applicable) |
None1 |
1.00 |
%2 |
None |
|||||||||||
|
Maximum sales charge (load) on reinvested distributions (as a percentage of offering price) |
None |
None |
None |
||||||||||||
|
Class A |
Class C |
Class I |
|||||||||||||
|
Management fee |
0.59 |
% |
0.59 |
% |
0.59 |
% |
|||||||||
|
Distribution and service (12b-1) fee |
0.25 |
1.00 |
None |
||||||||||||
|
Other expenses3 |
0.26 |
0.26 |
0.26 |
||||||||||||
|
Total annual fund operating expenses |
1.10 |
1.85 |
0.85 |
||||||||||||
|
Less: amount of fee limitations/expense reimbursements4 |
0.05 |
0.05 |
0.05 |
||||||||||||
|
Total annual fund operating expenses after fee limitations/expense reimbursements |
1.05 |
1.80 |
0.80 |
||||||||||||
1 Purchases of shares of $1 million or more may be subject to a 0.50% deferred sales charge on redemptions within 12 months of purchase.
2 1.00% during the first year.
3 The fund invests in Credit Suisse Cayman Commodity Fund I, Ltd., a wholly-owned subsidiary of the fund organized under the laws of the Cayman Islands (the "Subsidiary"). "Other expenses" include expenses of both the fund and the Subsidiary as well as "Acquired fund fees and expenses," which were less than 0.01% of the average net assets of the fund.
4 Credit Suisse Commodity Strategy Funds (the "Trust") and UBS Asset Management (Americas) LLC ("UBS AM (Americas)") have entered into a written contract limiting operating expenses to 1.05% of the fund's average daily net assets for Class A shares, 1.80% of the fund's average daily net assets for Class C shares and 0.80% of the fund's average daily net assets for Class I shares at least through February 28, 2027. This limit excludes certain expenses, including interest charges on fund borrowings, taxes, brokerage commissions, dealer spreads and other transaction charges, expenditures that are capitalized in accordance with generally accepted accounting principles, acquired fund fees and expenses, short sale dividends, and extraordinary expenses (e.g., litigation and indemnification and any other costs and expenses that may be approved by the Board of Trustees). The Trust is authorized to reimburse UBS AM (Americas) for management fees previously waived and/or for expenses previously paid by UBS AM (Americas), provided, however, that any reimbursement must be paid at a date not more than thirty-six months following the applicable month during which such fees were waived or expenses were paid by UBS AM (Americas) and the reimbursement does not cause the applicable class's aggregate expenses, on an annualized basis to exceed either (i) the applicable expense limited in effect at the time such fees were waived or such expenses were paid by UBS AM (Americas) or (ii) the applicable expense limitation in effect at the time of such reimbursement. This contract may not be terminated before February 28, 2027.
This example is intended to help you compare the cost of investing in the fund with the cost of investing in other mutual funds.
Assume you invest $10,000, the fund returns 5% annually, expense ratios remain the same and you close your account at the end of each of the time periods shown. Although your actual costs may be higher or lower, based on these assumptions, your cost would be:
|
One year |
Three years |
Five years |
Ten years |
||||||||||||||||
| Class A (with or without redemption) |
$ |
577 |
$ |
803 |
$ |
1,048 |
$ |
1,747 |
|||||||||||
| Class C (redemption at end of period) |
283 |
577 |
996 |
2,165 |
|||||||||||||||
| Class C (no redemption) |
183 |
577 |
996 |
2,165 |
|||||||||||||||
| Class I (with or without redemption) |
82 |
266 |
466 |
1,044 |
|||||||||||||||
The computation of the fund's portfolio turnover rate for regulatory purposes excludes trades of derivatives and instruments with a maturity of one year or less. However, the fund expects to engage in frequent trading of derivatives, which could have tax consequences that impact shareholders, such as the realization of taxable short-term capital gains. In addition, the fund could incur transaction costs, such as commissions, when it buys and sells securities and other instruments. Transaction costs, which are not reflected in annual fund operating expenses or in the example, affect the fund's performance. During the most recent fiscal year ended October 31, 2025, the fund's portfolio turnover rate was 60% of the average value of its portfolio.
The fund is designed to achieve positive total return relative to the performance of the Bloomberg Commodity Index Total Return ("BCOM Index"). Total return consists of capital appreciation and income. The fund intends to invest its assets directly and indirectly in a combination of commodity-linked derivative instruments, including commodity-linked notes, futures, options and swap agreements, and fixed income securities. The fund gains exposure to commodities markets by investing through the Subsidiary and in structured notes linked to the BCOM Index, other commodity indices, or the value of a particular commodity or commodity futures contract or subset of commodities or commodity futures contracts. The value of these investments will rise or fall in response to changes in the underlying index or commodity.
The fund may invest up to 25% of its total assets in the Subsidiary, a wholly-owned subsidiary of the fund organized under the laws of the Cayman Islands. The fund will invest in the Subsidiary primarily to gain exposure to the commodities markets within the limitations of the federal tax laws, rules and regulations that apply to regulated investment companies. Generally,
the Subsidiary will invest in commodity-linked derivative instruments, but it will also invest in fixed income instruments, including U.S. government securities, U.S. government agency securities, corporate bonds, debentures and notes, mortgage-backed and other asset-backed securities, event-linked bonds, loan participations, bank certificates of deposit, fixed time deposits, bankers' acceptances, commercial paper and other short-term fixed income securities. The primary purpose of the fixed income instruments held by the Subsidiary will be to serve as collateral for the Subsidiary's derivative positions; however, these instruments are also expected to earn income for the Subsidiary.
The fund invests in a portfolio of fixed income securities normally having an average duration of one year or less, and emphasizes investment-grade fixed income securities.
The fund expects to engage in active and frequent trading of derivatives.
The accompanying bar chart and table provide an indication of the risks of investing in the fund. The bar chart shows you how performance of the fund's Class A shares has varied from year to year for up to 10 years. The table compares the fund's performance (before and after taxes) over time to that of a broad-based securities market index (i.e., a regulatory index). The fund's regulatory index is the Bloomberg US Aggregate Bond Index. The fund's regulatory index is shown in connection with certain regulatory requirements to provide a broad measure of market performance. The table also compares the fund's performance to the BCOM Index, which is currently composed of futures contracts on 25 physical commodities. The after-tax returns are shown for Class A shares only. The after-tax returns of other classes
will vary. As with all mutual funds, past performance (before and after taxes) is not a prediction of future performance.
The fund makes updated performance available at the fund's website (https://us-fund.ubs.com/en/home) or by calling Credit Suisse Funds at 877-870-2874.
Sales charges are not reflected in the accompanying bar chart, and if those charges were included, returns would be less than those shown.
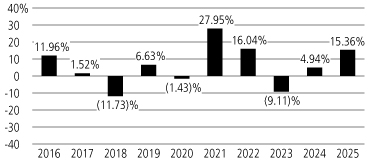
Best quarter: 25.49% (Q1, 2022)
Worst quarter: (22.16)% (Q1, 2020)
Inception date: 12/30/04
|
Period ended 12/31/25: |
One year 2025 |
Five years 2021-2025 |
Ten years 2016-2025 |
||||||||||||
| Class A Return before taxes |
9.88 |
% |
9.26 |
% |
5.08 |
% |
|||||||||
|
Class A Return after taxes on distributions |
7.77 |
4.27 |
2.47 |
||||||||||||
|
Class A Return after taxes on distributions and sale of fund shares |
5.81 |
4.91 |
2.76 |
||||||||||||
| Class C Return before taxes |
13.46 |
9.46 |
4.78 |
||||||||||||
| Class I Return before taxes |
15.65 |
10.57 |
5.86 |
||||||||||||
|
Bloomberg Commodity Index Total Return (reflects no deductions for fees, expenses or taxes) |
15.77 |
10.64 |
5.73 |
||||||||||||
|
Bloomberg US Aggregate Bond Index (reflects no deductions for fees, expenses or taxes) |
7.30 |
-0.36 |
2.01 |
||||||||||||
• After-tax returns are calculated using the historical highest individual federal marginal income tax rates and do not reflect the impact of state and local taxes. Actual after-tax returns depend on an investor's tax situation and may differ from those shown, and after-tax returns shown are not relevant to investors who hold their fund shares through tax-deferred arrangements, such as 401(k) plans or individual retirement accounts ("IRA").