Performance Management
|
Feb. 27, 2026 |
| Institutional Shares And Class A Shares [Member] | Westwood Quality Value Fund |
|
| Prospectus [Line Items] |
|
| Bar Chart and Performance Table [Heading] |
Performance Information
|
| Performance Narrative [Text Block] |
The bar chart and table that follow provide some indication of the risks of investing in the Fund by showing changes in the performance of the Institutional and A Class Shares of the Fund from year-to-year and by showing how the average annual returns for 1-year, 5-years and 10-years of the Fund compare with those of the Russell 3000® Index and the Russell 1000® Value Index. The performance shown in the bar chart and table for periods prior to November 1, 2021 represents the performance of the Institutional and A Class Shares of the Westwood Quality Value Fund, a series of The Advisor’s Inner Circle Fund (the “Predecessor Fund”). The Fund is the successor to the Predecessor Fund through a reorganization with the Fund on November 1, 2021 (the “2021 Reorganization”). How the Fund and the Predecessor Fund have performed in the past (before and after taxes) is not necessarily an indication of how the Fund will perform in the future. Updated performance information is available on the Fund’s website at www.westwoodfunds.com or by calling 1-877-FUND-WHG (1-877-386-3944).
|
| Performance Past Does Not Indicate Future [Text] |
How the Fund and the Predecessor Fund have performed in the past (before and after taxes) is not necessarily an indication of how the Fund will perform in the future.
|
| Performance Information Illustrates Variability of Returns [Text] |
The bar chart and table that follow provide some indication of the risks of investing in the Fund by showing changes in the performance of the Institutional and A Class Shares of the Fund from year-to-year and by showing how the average annual returns for 1-year, 5-years and 10-years of the Fund compare with those of the Russell 3000® Index and the Russell 1000® Value Index.
|
| Bar Chart [Heading] |
Calendar Year Returns - Institutional Shares*
|
| Bar Chart [Table] |
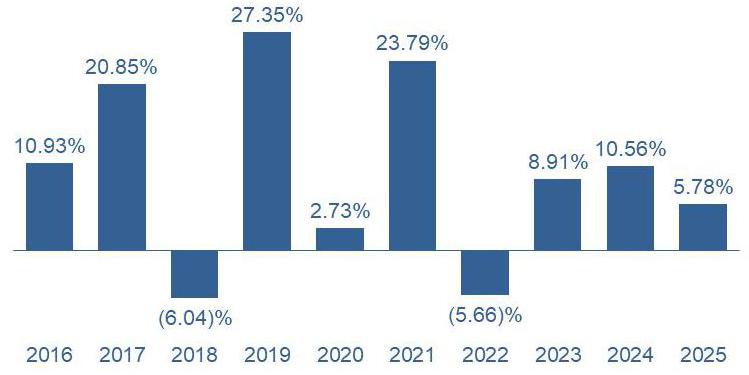
| Year |
Return* |
| Annual return 2016 |
10.93% |
| Annual return 2017 |
20.85% |
| Annual return 2018 |
-6.04% |
| Annual return 2019 |
27.35% |
| Annual return 2020 |
2.73% |
| Annual return 2021 |
23.79% |
| Annual return 2022 |
-5.66% |
| Annual return 2023 |
8.91% |
| Annual return 2024 |
10.56% |
| Annual return 2025 |
5.78% |
|
| Bar Chart Closing [Text Block] |
| * |
The Fund’s year-to-date return through December 31, 2025 was 5.78%. |
| Best Quarter |
Worst Quarter |
| 13.27% |
(23.07)% |
| (12/31/2020) |
(03/31/2020) |
|
| Year to Date Return, Label [Optional Text] |
The Fund’s year-to-date return
|
| Bar Chart, Year to Date Return |
5.78%
|
| Bar Chart, Year to Date Return, Date |
Dec. 31, 2025
|
| Highest Quarterly Return, Label [Optional Text] |
Best Quarter
|
| Highest Quarterly Return |
13.27%
|
| Highest Quarterly Return, Date |
Dec. 31, 2020
|
| Lowest Quarterly Return, Label [Optional Text] |
Worst Quarter
|
| Lowest Quarterly Return |
(23.07%)
|
| Lowest Quarterly Return, Date |
Mar. 31, 2020
|
| Performance Table Heading |
Average Annual Total Returns for Periods Ended December 31, 2025
|
| Performance Table Narrative |
This table compares the Fund’s Institutional and A Class Shares’ average annual total returns for the periods ended December 31, 2025 to those of an appropriate broad-based index and a secondary index.
After-tax returns are calculated using the historical highest individual federal marginal income tax rates and do not reflect the impact of state and local taxes. Your actual after-tax returns will depend on your tax situation and may differ from those shown. After-tax returns shown are not relevant to investors who hold their Fund shares through tax-deferred arrangements, such as 401(k) plans or individual retirement accounts (“IRAs”).
The figures in the average annual total returns table below reflect the A Class Shares maximum front-end sales charge of 3.00%. Prior to March 1, 2020, A Class Shares of the Predecessor Fund were subject to a maximum front-end sales charge of 5.00%. If the prior maximum front-end sales charge of 5.00% was reflected, performance for A Class Shares of the Predecessor Fund in the average annual total returns table would be lower.
Returns after taxes on distributions and sale of Fund shares may be higher than before-tax returns when a net capital loss occurs upon the redemption of Fund shares.
|
| Performance Table Uses Highest Federal Rate |
After-tax returns are calculated using the historical highest individual federal marginal income tax rates and do not reflect the impact of state and local taxes.
|
| Performance Table Not Relevant to Tax Deferred |
Your actual after-tax returns will depend on your tax situation and may differ from those shown. After-tax returns shown are not relevant to investors who hold their Fund shares through tax-deferred arrangements, such as 401(k) plans or individual retirement accounts (“IRAs”).
|
| Performance Table Explanation after Tax Higher |
Returns after taxes on distributions and sale of Fund shares may be higher than before-tax returns when a net capital loss occurs upon the redemption of Fund shares.
|
| Performance [Table] |
| |
|
|
|
|
|
|
| WESTWOOD QUALITY VALUE FUND |
|
1 Year |
|
5 Years |
|
10 Years |
| INSTITUTIONAL |
|
|
|
|
|
|
| Fund Returns Before Taxes |
|
5.78% |
|
8.26% |
|
9.38% |
| Fund Returns After Taxes on Distributions |
|
1.24% |
|
5.80% |
|
7.32% |
| Fund Returns After Taxes on Distributions and Sale of Fund Shares |
|
6.70% |
|
6.27% |
|
7.28% |
| Russell 3000® Index (reflects no deduction for fees, expenses, or taxes) |
|
17.15% |
|
13.15% |
|
14.29% |
| Russell 1000® Value Index (reflects no deduction for fees, expenses, or taxes) |
|
15.91% |
|
11.33% |
|
10.53% |
| |
|
|
|
|
|
|
| A Class |
|
|
|
|
|
|
| Fund Returns Before Taxes |
|
5.61% |
|
8.04% |
|
9.13% |
| Russell 3000® Index (reflects no deduction for fees, expenses, or taxes) |
|
17.15% |
|
13.15% |
|
14.29% |
| Russell 1000® Value Index (reflects no deduction for fees, expenses, or taxes) |
|
15.91% |
|
11.33% |
|
10.53% |
|
| Index No Deduction for Fees, Expenses, or Taxes [Text] |
reflects no deduction for fees, expenses, or taxes
|
| Performance Availability Website Address [Text] |
www.westwoodfunds.com
|
| Performance Availability Phone [Text] |
1-877-FUND-WHG (1-877-386-3944)
|
| Institutional Shares And Class A Shares [Member] | Westwood Multi-Asset Income Fund |
|
| Prospectus [Line Items] |
|
| Bar Chart and Performance Table [Heading] |
Performance Information
|
| Performance Narrative [Text Block] |
The bar chart and table that follow provide some indication of the risks of investing in the Fund by showing changes in the performance of the Institutional and A Class Shares of the Fund from year-to-year and by showing how the average annual returns for 1-year, 5-years, 10-years and since inception of the Fund compare with those of the Russell 3000® Index and the Blended 80/20 Bloomberg U.S. Aggregate Bond Index/S&P 500® Index. The performance shown in bar chart and table for periods prior to November 1, 2021 represents the performance of the Institutional and A Class Shares of the Westwood High Income Fund, a series of The Advisors’ Inner Circle Fund (the “Predecessor Fund”). The Fund is the successor to the Predecessor Fund through a reorganization with the Fund on November 1, 2021 (the “2021 Reorganization”). Prior to August 31, 2019, the Predecessor Fund had a sub-adviser and, prior to November 1, 2019, the Predecessor Fund employed a different investment strategy. Therefore, the past performance shown for periods prior to August 31, 2019 may have differed if the Predecessor Fund had not had a sub-adviser and the Fund’s current investment strategy had been in effect. How the Fund and the Predecessor Fund have performed in the past (before and after taxes) is not necessarily an indication of how the Fund will perform in the future. Updated performance information is available on the Fund’s website at www.westwoodfunds.com or by calling 1-877-FUND-WHG (1-877-386-3944).
|
| Performance Past Does Not Indicate Future [Text] |
How the Fund and the Predecessor Fund have performed in the past (before and after taxes) is not necessarily an indication of how the Fund will perform in the future.
|
| Performance Information Illustrates Variability of Returns [Text] |
The bar chart and table that follow provide some indication of the risks of investing in the Fund by showing changes in the performance of the Institutional and A Class Shares of the Fund from year-to-year and by showing how the average annual returns for 1-year, 5-years, 10-years and since inception of the Fund compare with those of the Russell 3000® Index and the Blended 80/20 Bloomberg U.S. Aggregate Bond Index/S&P 500® Index.
|
| Bar Chart [Heading] |
Calendar Year Returns - Institutional Shares*
|
| Bar Chart [Table] |
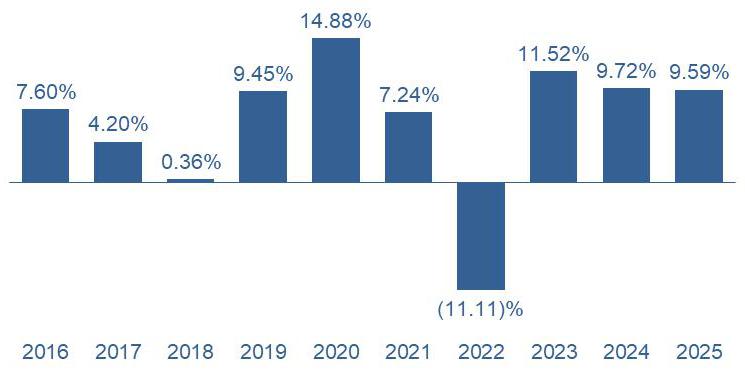
| Year |
Return* |
| Annual Return 2016 |
7.60% |
| Annual Return 2017 |
4.20% |
| Annual Return 2018 |
0.36% |
| Annual Return 2019 |
9.45% |
| Annual Return 2020 |
14.88% |
| Annual Return 2021 |
7.24% |
| Annual Return 2022 |
-11.11% |
| Annual Return 2023 |
11.52% |
| Annual Return 2024 |
9.72% |
| Annual Return 2025 |
9.59% |
|
| Bar Chart Closing [Text Block] |
| * |
The Fund’s year-to-date return through December 31, 2025 was 9.59%. |
| Best Quarter |
Worst Quarter |
| 12.59% |
(10.88)% |
| (6/30/2020) |
(3/31/2020) |
|
| Year to Date Return, Label [Optional Text] |
The Fund’s year-to-date return
|
| Bar Chart, Year to Date Return |
9.59%
|
| Bar Chart, Year to Date Return, Date |
Dec. 31, 2025
|
| Highest Quarterly Return, Label [Optional Text] |
Best Quarter
|
| Highest Quarterly Return |
12.59%
|
| Highest Quarterly Return, Date |
Jun. 30, 2020
|
| Lowest Quarterly Return, Label [Optional Text] |
Worst Quarter
|
| Lowest Quarterly Return |
(10.88%)
|
| Lowest Quarterly Return, Date |
Mar. 31, 2020
|
| Performance Table Heading |
Average Annual Total Returns for Periods Ended December 31, 2025
|
| Performance Table Narrative |
This table compares the Fund’s Institutional and A Class Shares’ average annual total returns for the periods ended December 31, 2025 to those of an appropriate broad-based index and a blended secondary index that represents the investment strategy of the Fund.
After-tax returns are calculated using the historical highest individual federal marginal income tax rates and do not reflect the impact of state and local taxes. Your actual after-tax returns will depend on your tax situation and may differ from those shown. After-tax returns shown are not relevant to investors who hold their Fund shares through tax-deferred arrangements, such as 401(k) plans or individual retirement accounts (“IRAs”).
|
| Performance Table Uses Highest Federal Rate |
After-tax returns are calculated using the historical highest individual federal marginal income tax rates and do not reflect the impact of state and local taxes.
|
| Performance Table Not Relevant to Tax Deferred |
Your actual after-tax returns will depend on your tax situation and may differ from those shown. After-tax returns shown are not relevant to investors who hold their Fund shares through tax-deferred arrangements, such as 401(k) plans or individual retirement accounts (“IRAs”).
|
| Performance [Table] |
| WESTWOOD MULTI-ASSET INCOME FUND |
|
1 Year |
|
5 Years |
|
10 Years |
|
Inception Date |
| Institutional |
|
|
|
|
|
|
|
(December 28, 2011) |
| Fund Returns Before Taxes |
|
9.59% |
|
5.03% |
|
6.10% |
|
N/A |
| Fund Returns After Taxes on Distributions |
|
6.87% |
|
2.94% |
|
4.08% |
|
N/A |
| Fund Returns After Taxes on Distributions and Sale of Fund Shares |
|
5.69% |
|
2.96% |
|
3.84% |
|
N/A |
| Russell 3000® Index (reflects no deduction for fees, expenses, or taxes) |
|
17.15% |
|
13.15% |
|
14.29% |
|
N/A |
| Blended 80/20 Bloomberg U.S. Aggregate Bond Index/S&P 500® Index (reflects no deduction for fees, expenses, or taxes) |
|
9.45% |
|
2.57% |
|
4.62% |
|
N/A |
| Bloomberg U.S. Aggregate Bond Index (reflects no deduction for fees, expenses, or taxes) |
|
7.30% |
|
(0.36)% |
|
2.01% |
|
N/A |
| S&P 500® Index (reflects no deduction for fees, expenses, or taxes) |
|
17.88% |
|
14.42% |
|
14.82% |
|
N/A |
| WESTWOOD MULTI-ASSET INCOME FUND |
|
1 Year |
|
5 Years |
|
10 Years |
|
Inception Date |
| A Class |
|
|
|
|
|
|
|
(June 28, 2013) |
| Fund Returns Before Taxes |
|
9.28% |
|
4.77% |
|
5.87% |
|
N/A |
| Russell 3000® Index (reflects no deduction for fees, expenses, or taxes) |
|
17.15% |
|
13.15% |
|
14.29% |
|
N/A |
| Blended 80/20 Bloomberg U.S. Aggregate Bond Index/S&P 500® Index (reflects no deduction for fees, expenses, or taxes) |
|
9.45% |
|
2.57% |
|
4.62% |
|
N/A |
| Bloomberg U.S. Aggregate Bond Index (reflects no deduction for fees, expenses, or taxes) |
|
7.30% |
|
(0.36)% |
|
2.01% |
|
N/A |
| S&P 500® Index (reflects no deduction for fees, expenses, or taxes) |
|
17.88% |
|
14.42% |
|
14.82% |
|
N/A |
|
| Index No Deduction for Fees, Expenses, or Taxes [Text] |
reflects no deduction for fees, expenses, or taxes
|
| Performance Availability Website Address [Text] |
www.westwoodfunds.com
|
| Performance Availability Phone [Text] |
1-877-FUND-WHG (1-877-386-3944)
|
| Institutional Shares And Class A Shares [Member] | Westwood Alternative Income Fund |
|
| Prospectus [Line Items] |
|
| Bar Chart and Performance Table [Heading] |
Performance Information
|
| Performance Narrative [Text Block] |
The bar chart and table that follow provide some indication of the risks of investing in the Fund by showing changes in the performance of the Institutional and A Class Shares of the Fund from year-to-year and by showing how the average annual returns for 1-year, 5-years, 10-years, and since inception of the Fund compare with those of the Bloomberg U.S. Aggregate Bond Index and the FTSE 1-Month U.S. Treasury Bill Index. The performance shown in bar chart and table for periods prior to November 1, 2021 represents the performance of the Institutional and A Class Shares of the Westwood Alternative Income Fund, a series of The Advisors’ Inner Circle Fund (the “Predecessor Fund”). The Fund is the successor to the Predecessor Fund through a reorganization with the Fund on November 1, 2021 (the “2021 Reorganization”). How the Fund and the Predecessor Fund have performed in the past (before and after taxes) is not necessarily an indication of how the Fund will perform in the future. Updated performance information is available on the Fund’s website at www.westwoodfunds.com or by calling 1-877-FUND-WHG (1-877-386-3944).
|
| Performance Past Does Not Indicate Future [Text] |
How the Fund and the Predecessor Fund have performed in the past (before and after taxes) is not necessarily an indication of how the Fund will perform in the future.
|
| Performance Information Illustrates Variability of Returns [Text] |
The bar chart and table that follow provide some indication of the risks of investing in the Fund by showing changes in the performance of the Institutional and A Class Shares of the Fund from year-to-year and by showing how the average annual returns for 1-year, 5-years, 10-years, and since inception of the Fund compare with those of the Bloomberg U.S. Aggregate Bond Index and the FTSE 1-Month U.S. Treasury Bill Index.
|
| Bar Chart [Heading] |
Calendar Year Returns - Institutional Shares*
|
| Bar Chart [Table] |
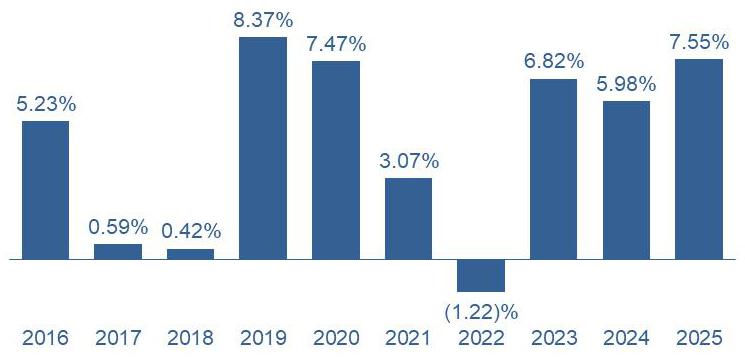
| Year |
Return* |
| Annual Return 2016 |
5.23% |
| Annual Return 2017 |
0.59% |
| Annual Return 2018 |
0.42% |
| Annual Return 2019 |
8.37% |
| Annual Return 2020 |
7.47% |
| Annual Return 2021 |
3.07% |
| Annual Return 2022 |
-1.22% |
| Annual Return 2023 |
6.82% |
| Annual Return 2024 |
5.98% |
| Annual Return 2025 |
7.55% |
|
| Bar Chart Closing [Text Block] |
| * |
The Fund’s year-to-date return through December 31, 2025 was 7.55%. |
| Best Quarter |
Worst Quarter |
| 3.52% |
(2.76)% |
| (9/30/2024) |
(3/31/2020) |
|
| Year to Date Return, Label [Optional Text] |
The Fund’s year-to-date return
|
| Bar Chart, Year to Date Return |
7.55%
|
| Bar Chart, Year to Date Return, Date |
Dec. 31, 2025
|
| Highest Quarterly Return, Label [Optional Text] |
Best Quarter
|
| Highest Quarterly Return |
3.52%
|
| Highest Quarterly Return, Date |
Sep. 30, 2024
|
| Lowest Quarterly Return, Label [Optional Text] |
Worst Quarter
|
| Lowest Quarterly Return |
(2.76%)
|
| Lowest Quarterly Return, Date |
Mar. 31, 2020
|
| Performance Table Heading |
Average Annual Total Returns for Periods Ended December 31, 2025
|
| Performance Table Narrative |
This table compares the Fund’s Institutional and A Class Shares’ average annual total returns for the periods ended December 31, 2025 to those of an appropriate broad-based index and a secondary index.
After-tax returns are calculated using the historical highest individual federal marginal income tax rates and do not reflect the impact of state and local taxes. Your actual after-tax returns will depend on your tax situation and may differ from those shown. After-tax returns shown are not relevant to investors who hold their Fund shares through tax-deferred arrangements, such as 401(k) plans or individual retirement accounts (“IRAs”).
|
| Performance Table Uses Highest Federal Rate |
After-tax returns are calculated using the historical highest individual federal marginal income tax rates and do not reflect the impact of state and local taxes.
|
| Performance Table Not Relevant to Tax Deferred |
Your actual after-tax returns will depend on your tax situation and may differ from those shown. After-tax returns shown are not relevant to investors who hold their Fund shares through tax-deferred arrangements, such as 401(k) plans or individual retirement accounts (“IRAs”).
|
| Performance [Table] |
| WESTWOOD ALTERNATIVE INCOME FUND |
|
1 Year |
|
5 Years |
|
10 Years |
|
Inception Date |
| Institutional |
|
|
|
|
|
|
|
(May 1, 2015) |
| Fund Returns Before Taxes |
|
7.55% |
|
4.39% |
|
4.38% |
|
N/A |
| Fund Returns After Taxes on Distributions |
|
6.53% |
|
2.43% |
|
2.97% |
|
N/A |
| Fund Returns After Taxes on Distributions and Sale of Fund Shares |
|
4.45% |
|
2.48% |
|
2.77% |
|
N/A |
| Bloomberg U.S. Aggregate Bond Index (reflects no deduction for fees, expenses, or taxes) |
|
7.30% |
|
(0.36)% |
|
1.85% |
|
N/A |
| FTSE 1-Month U.S. Treasury Bill Index (reflects no deduction for fees, expenses, or taxes) |
|
4.35% |
|
3.25% |
|
2.17% |
|
N/A |
| |
|
|
|
|
|
|
|
|
| A Class |
|
|
|
|
|
|
|
(March 1, 2020) |
| Fund Returns Before Taxes |
|
7.57% |
|
4.27% |
|
N/A |
|
5.50% |
| Bloomberg U.S. Aggregate Bond Index (reflects no deduction for fees, expenses, or taxes) |
|
7.30% |
|
(0.36)% |
|
N/A |
|
0.40% |
| FTSE 1-Month U.S. Treasury Bill Index (reflects no deduction for fees, expenses, or taxes) |
|
4.35% |
|
3.25% |
|
N/A |
|
2.83% |
|
| Index No Deduction for Fees, Expenses, or Taxes [Text] |
reflects no deduction for fees, expenses, or taxes
|
| Performance Availability Website Address [Text] |
www.westwoodfunds.com
|
| Performance Availability Phone [Text] |
1-877-FUND-WHG (1-877-386-3944)
|
| Institutional Shares And Class A Shares [Member] | Westwood Real Estate Income Fund |
|
| Prospectus [Line Items] |
|
| Bar Chart and Performance Table [Heading] |
Performance Information
|
| Performance Narrative [Text Block] |
The bar chart and table that follow provide some indication of the risks of an investment in the Institutional and A Class Shares of the Fund for 1-year, 5-years and 10-years compared with those of the Bloomberg U.S. Aggregate Bond Index and the ICE BofAML Fixed Rate Preferred Securities Index. The Fund is the successor to the Salient Select Income Fund, a series of Forward Funds (the “Predecessor Fund”) through a reorganization with the Fund on November 18, 2022 (the “2022 Reorganization”). The performance shown in the bar chart and table for periods prior to November 18, 2022 represents the performance of the Institutional Class and Class A shares of the Predecessor Fund. In connection with the 2022 Reorganization, Institutional Class and Class A shares of the Predecessor Fund were exchanged for and renamed Institutional Shares and A
Class Shares of the Fund, respectively. In addition, Investor Class shares of the Predecessor Fund were exchanged for A Class Shares of the Fund. The performance of any index does not reflect deductions for fees, expenses or taxes. If the investment adviser to the Fund and the Predecessor Fund had not agreed to waive or reimburse certain Fund or Predecessor Fund expenses during the period shown, if applicable, the Fund’s and the Predecessor Fund’s returns would have been less than those shown. Past performance, including before- and after-tax returns, is not necessarily an indication of how the Fund will perform in the future. Updated information on the Fund’s performance is available on the Fund’s website at www.westwoodfunds.com or by calling 1-877-FUND-WHG (1-877-386-3944).
The Adviser has served as the investment adviser to the Fund since the 2022 Reorganization and has not used a sub-adviser to manage the Fund since the 2022 Reorganization. This name change does not reflect a change in the Adviser’s role in managing the Fund’s portfolio or the advisory structure.
The bar chart shows the performance of the Fund’s Institutional Shares. The returns for the Fund’s A Class Shares will be lower than the Institutional Shares’ returns shown in the bar chart because the expenses of the classes differ. All returns reflect reinvestment of all dividend and capital gain distributions.
|
| Performance Past Does Not Indicate Future [Text] |
Past performance, including before- and after-tax returns, is not necessarily an indication of how the Fund will perform in the future.
|
| Performance Information Illustrates Variability of Returns [Text] |
The bar chart and table that follow provide some indication of the risks of an investment in the Institutional and A Class Shares of the Fund for 1-year, 5-years and 10-years compared with those of the Bloomberg U.S. Aggregate Bond Index and the ICE BofAML Fixed Rate Preferred Securities Index.
|
| Bar Chart [Heading] |
Calendar Year Returns - Institutional Shares*
|
| Bar Chart [Table] |
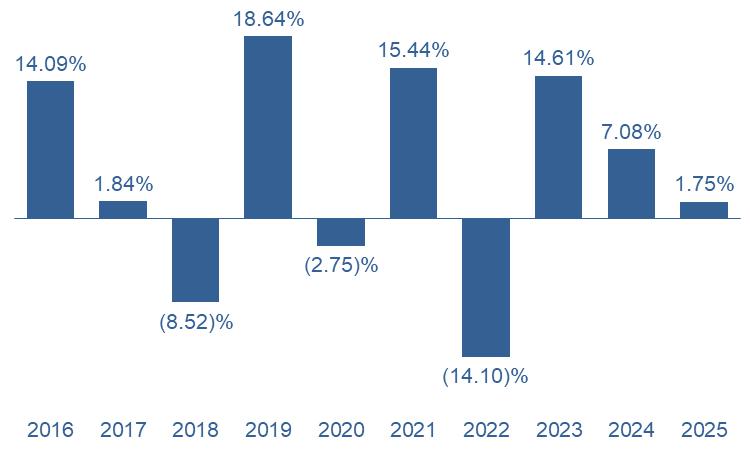
| Years |
Returns* |
| 2016 |
14.09% |
| 2017 |
1.84% |
| 2018 |
-8.52% |
| 2019 |
18.64% |
| 2020 |
-2.75% |
| 2021 |
15.44% |
| 2022 |
-14.10% |
| 2023 |
14.61% |
| 2024 |
7.08% |
| 2025 |
1.75% |
|
| Bar Chart Closing [Text Block] |
| * |
The Fund’s year-to-date return through December 31, 2025 was 1.75%. |
| Best Quarter |
Worst Quarter |
| 20.09% |
(31.56)% |
| June 30, 2020 |
March 31, 2020 |
|
| Year to Date Return, Label [Optional Text] |
The Fund’s year-to-date return
|
| Bar Chart, Year to Date Return |
1.75%
|
| Bar Chart, Year to Date Return, Date |
Dec. 31, 2025
|
| Highest Quarterly Return, Label [Optional Text] |
Best Quarter
|
| Highest Quarterly Return |
20.09%
|
| Highest Quarterly Return, Date |
Jun. 30, 2020
|
| Lowest Quarterly Return, Label [Optional Text] |
Worst Quarter
|
| Lowest Quarterly Return |
(31.56%)
|
| Lowest Quarterly Return, Date |
Mar. 31, 2020
|
| Performance Table Heading |
Average Annual Total Returns For the period ended December 31, 2025
|
| Performance Table Narrative |
This table compares the Fund’s Institutional and A Class Shares’ average annual total returns for the periods ended December 31, 2025 to those of an appropriate broad-based index and a secondary index.
After-tax returns are calculated using the historical highest individual federal marginal income tax rates and do not reflect the impact of state and local taxes. Your actual after-tax returns will depend on your tax situation and may differ from those shown. After-tax returns shown are not relevant to investors who hold their Fund shares through tax-deferred arrangements, such as 401(k) plans or individual retirement accounts (“IRAs”).
|
| Performance Table Uses Highest Federal Rate |
After-tax returns are calculated using the historical highest individual federal marginal income tax rates and do not reflect the impact of state and local taxes.
|
| Performance Table Not Relevant to Tax Deferred |
Your actual after-tax returns will depend on your tax situation and may differ from those shown. After-tax returns shown are not relevant to investors who hold their Fund shares through tax-deferred arrangements, such as 401(k) plans or individual retirement accounts (“IRAs”)
|
| Performance [Table] |
| WESTWOOD REAL ESTATE INCOME FUND |
|
1 Year |
|
5 Years |
|
10 Years |
| Institutional |
|
|
|
|
|
|
| Return Before Taxes |
|
1.75% |
|
4.37% |
|
4.27% |
| Return After Taxes on Distributions |
|
0.46% |
|
3.00% |
|
2.65% |
| Return After Taxes on Distributions and Sale of Fund Shares |
|
1.94% |
|
3.18% |
|
2.87% |
| Bloomberg U.S. Aggregate Bond Index (reflects no deduction for fees, expenses, or taxes) |
|
7.30% |
|
(0.36)% |
|
2.01% |
| ICE BofAML Fixed Rate Preferred Securities Index (reflects no deduction for fees, expenses, or taxes) |
|
5.21% |
|
1.65% |
|
3.99% |
| |
|
|
|
|
|
|
| A Class |
|
|
|
|
|
|
| Return Before Taxes |
|
1.50% |
|
4.03% |
|
3.89% |
| Bloomberg U.S. Aggregate Bond Index (reflects no deduction for fees, expenses, or taxes) |
|
7.30% |
|
(0.36)% |
|
2.01% |
| ICE BofAML Fixed Rate Preferred Securities Index (reflects no deduction for fees, expenses, or taxes) |
|
5.21% |
|
1.65% |
|
3.99% |
|
| Performance Table One Class of after Tax Shown [Text] |
After-tax returns are shown only for Institutional Shares. After-tax returns for other classes will vary. The table includes all applicable fees and sales charges. All returns reflect reinvestment of all dividend and capital gain distributions.
|
| Index No Deduction for Fees, Expenses, or Taxes [Text] |
reflects no deduction for fees, expenses, or taxes
|
| Performance Table Closing [Text Block] |
After-tax returns are calculated using the historical highest individual federal marginal income tax rates and do not reflect the impact of state and local taxes. Actual after-tax returns depend on an investor’s tax situation and may differ from those shown. After-tax returns are not relevant to investors who hold their Fund shares through tax-deferred arrangements, such as 401(k) plans or individual retirement accounts (“IRAs”). After-tax returns are shown only for Institutional Shares. After-tax returns for other classes will vary. The table includes all applicable fees and sales charges. All returns reflect reinvestment of all dividend and capital gain distributions.
|
| Performance Availability Website Address [Text] |
www.westwoodfunds.com
|
| Performance Availability Phone [Text] |
1-877-FUND-WHG (1-877-386-3944)
|
| Institutional Shares [Member] | Westwood Quality Smidcap Fund |
|
| Prospectus [Line Items] |
|
| Bar Chart and Performance Table [Heading] |
Performance Information
|
| Performance Narrative [Text Block] |
The bar chart and table that follow provide some indication of the risks of investing in the Fund by showing changes in the performance of the Institutional Shares of the Fund from year-to-year and by showing how the average annual returns for 1-year, 5-years and 10-years of the Fund compare with those of the Russell 3000® Index and the Russell 2500® Value Index. The performance shown in the bar chart and table for periods prior to November 1, 2021 represents the performance of the Institutional Shares of the Westwood Quality SMidCap Fund, a series of The Advisor’s Inner Circle Fund (the “Predecessor Fund”). The Fund is the successor to the Predecessor Fund through a reorganization with the Fund on November 1, 2021 (the “2021 Reorganization”). How the Fund and the Predecessor Fund have performed in the past (before and after taxes) is not necessarily an indication of how the Fund will perform in the future. Updated performance information is available on the Fund’s website at www.westwoodfunds.com or by calling 1-877-FUND-WHG (1-877-386-3944).
|
| Performance Past Does Not Indicate Future [Text] |
How the Fund and the Predecessor Fund have performed in the past (before and after taxes) is not necessarily an indication of how the Fund will perform in the future.
|
| Performance Information Illustrates Variability of Returns [Text] |
The bar chart and table that follow provide some indication of the risks of investing in the Fund by showing changes in the performance of the Institutional Shares of the Fund from year-to-year and by showing how the average annual returns for 1-year, 5-years and 10-years of the Fund compare with those of the Russell 3000® Index and the Russell 2500® Value Index.
|
| Bar Chart [Heading] |
Calendar Year Returns - Institutional Shares*
|
| Bar Chart [Table] |
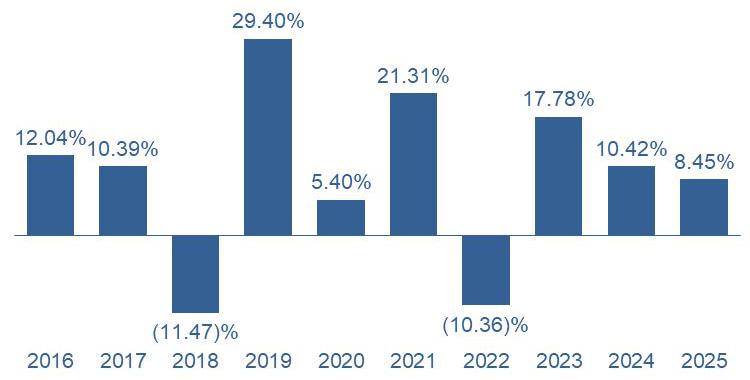
| Year |
Return* |
| Annual Return 2016 |
12.04% |
| Annual Return 2017 |
10.39% |
| Annual Return 2018 |
-11.47% |
| Annual Return 2019 |
29.40% |
| Annual Return 2020 |
5.40% |
| Annual Return 2021 |
21.31% |
| Annual Return 2022 |
-10.36% |
| Annual Return 2023 |
17.78% |
| Annual Return 2024 |
10.42% |
| Annual
Return 2025 |
8.45% |
|
| Bar Chart Closing [Text Block] |
| * |
The Fund’s year-to-date return through December 31, 2025 was 8.45%. |
| Best Quarter |
Worst Quarter |
| 22.59% |
(30.79)% |
| (12/31/2020) |
(3/31/2020) |
|
| Year to Date Return, Label [Optional Text] |
The Fund’s year-to-date return
|
| Bar Chart, Year to Date Return |
8.45%
|
| Bar Chart, Year to Date Return, Date |
Dec. 31, 2025
|
| Highest Quarterly Return, Label [Optional Text] |
Best Quarter
|
| Highest Quarterly Return |
22.59%
|
| Highest Quarterly Return, Date |
Dec. 31, 2020
|
| Lowest Quarterly Return, Label [Optional Text] |
Worst Quarter
|
| Lowest Quarterly Return |
(30.79%)
|
| Lowest Quarterly Return, Date |
Mar. 31, 2020
|
| Performance Table Heading |
Average Annual Total Returns for Periods Ended December 31, 2025
|
| Performance Table Narrative |
This table compares the Fund’s Institutional Shares’ average annual total returns for the periods ended December 31, 2025 to those of an appropriate broad-based index and a secondary index.
After-tax returns are calculated using the historical highest individual federal marginal income tax rates and do not reflect the impact of state and local taxes. Your actual after-tax returns will depend on your tax situation and may differ from those shown. After-tax returns shown are not relevant to investors who hold their Fund shares through tax-deferred arrangements, such as 401(k) plans or individual retirement accounts (“IRAs”).
|
| Performance Table Uses Highest Federal Rate |
After-tax returns are calculated using the historical highest individual federal marginal income tax rates and do not reflect the impact of state and local taxes.
|
| Performance Table Not Relevant to Tax Deferred |
Your actual after-tax returns will depend on your tax situation and may differ from those shown. After-tax returns shown are not relevant to investors who hold their Fund shares through tax-deferred arrangements, such as 401(k) plans or individual retirement accounts (“IRAs”).
|
| Performance [Table] |
| WESTWOOD QUALITY SMIDCAP FUND |
|
1 Year |
|
5 Years |
|
10 Years |
| INSTITUTIONAL |
|
|
|
|
|
|
| Fund Returns Before Taxes |
|
8.45% |
|
8.93% |
|
8.64% |
| Fund Returns After Taxes on Distributions |
|
6.90% |
|
7.38% |
|
6.76% |
| Fund Returns After Taxes on Distributions and Sale of Fund Shares |
|
5.64% |
|
6.63% |
|
6.43% |
| Russell 3000® Index (reflects no deduction for fees, expenses, or taxes) |
|
17.15% |
|
13.15% |
|
14.29% |
| Russell 2500® Value Index (reflects no deduction for fees, expenses, or taxes) |
|
12.73% |
|
10.02% |
|
9.72% |
|
| Index No Deduction for Fees, Expenses, or Taxes [Text] |
reflects no deduction for fees, expenses, or taxes
|
| Performance Availability Website Address [Text] |
www.westwoodfunds.com
|
| Performance Availability Phone [Text] |
1-877-FUND-WHG (1-877-386-3944)
|
| Institutional Shares Class A Shares And Class C Shares [Member] | Westwood Quality SmallCap Fund |
|
| Prospectus [Line Items] |
|
| Bar Chart and Performance Table [Heading] |
Performance Information
|
| Performance Narrative [Text Block] |
The bar chart and table that follow provide some indication of the risks of investing in the Fund by showing changes in the performance of the Institutional, A Class, and C Class Shares of the Fund from year-to-year and by showing how the average annual returns for 1-year, 5-years, 10-years and since inception of the Fund compare with those of the Russell 3000® Index and the Russell 2000® Index. The performance shown in the bar chart and table for period priors to November 1, 2021 represents the performance of the Institutional, A Class, and A Class Shares of the Westwood Quality SmallCap Fund, a series of the Advisors’ Inner Circle Fund (the “Predecessor Fund”). The Fund is the successor to the Predecessor Fund through a reorganization with the Fund on November 1, 2021 (the “2021 Reorganization”). How the Fund and Predecessor Fund have performed in the past (before and after taxes) is not necessarily an indication of how the Fund will perform in the future. Updated performance information is available on the Fund’s website at www.westwoodfunds.com or by calling 1-877-FUND-WHG (1-877-386-3944).
|
| Performance Past Does Not Indicate Future [Text] |
How the Fund and Predecessor Fund have performed in the past (before and after taxes) is not necessarily an indication of how the Fund will perform in the future.
|
| Performance Information Illustrates Variability of Returns [Text] |
The bar chart and table that follow provide some indication of the risks of investing in the Fund by showing changes in the performance of the Institutional, A Class, and C Class Shares of the Fund from year-to-year and by showing how the average annual returns for 1-year, 5-years, 10-years and since inception of the Fund compare with those of the Russell 3000® Index and the Russell 2000® Index.
|
| Bar Chart [Heading] |
Calendar Year Returns - Institutional Shares*
|
| Bar Chart [Table] |
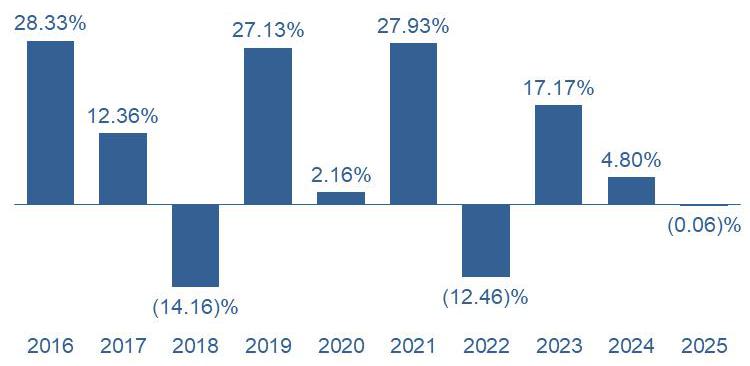
| Year |
Return* |
| Annual Return 2016 |
28.33% |
| Annual Return 2017 |
12.36% |
| Annual Return 2018 |
-14.16% |
| Annual Return 2019 |
27.13% |
| Annual Return 2020 |
2.16% |
| Annual Return 2021 |
27.93% |
| Annual Return 2022 |
-12.46% |
| Annual Return 2023 |
17.17% |
| Annual Return 2024 |
4.80% |
| Annual
Return 2025 |
-0.06% |
|
| Bar Chart Closing [Text Block] |
| * |
The Fund’s year-to-date return through December 31, 2025 was (0.06)%. |
| Best Quarter |
Worst Quarter |
| 25.98% |
(32.64)% |
| (12/31/2020) |
(3/31/2020) |
|
| Year to Date Return, Label [Optional Text] |
The Fund’s year-to-date return
|
| Bar Chart, Year to Date Return |
0.06%
|
| Bar Chart, Year to Date Return, Date |
Dec. 31, 2025
|
| Highest Quarterly Return, Label [Optional Text] |
Best Quarter
|
| Highest Quarterly Return |
25.98%
|
| Highest Quarterly Return, Date |
Dec. 31, 2020
|
| Lowest Quarterly Return, Label [Optional Text] |
Worst Quarter
|
| Lowest Quarterly Return |
(32.64%)
|
| Lowest Quarterly Return, Date |
Mar. 31, 2020
|
| Performance Table Heading |
Average Annual Total Returns for Periods Ended December 31, 2025
|
| Performance Table Narrative |
This table compares the Fund’s Institutional, A Class and C Class Shares’ average annual total returns for the periods ended December 31, 2025 to those of an appropriate broad-based index and a secondary index.
After-tax returns are calculated using the historical highest individual federal marginal income tax rates and do not reflect the impact of state and local taxes. Your actual after-tax returns will depend on your tax situation and may differ from those shown. After-tax returns shown are not relevant to investors who hold their Fund shares through tax-deferred arrangements, such as 401(k) plans or individual retirement accounts (“IRAs”).
|
| Performance Table Uses Highest Federal Rate |
After-tax returns are calculated using the historical highest individual federal marginal income tax rates and do not reflect the impact of state and local taxes.
|
| Performance Table Not Relevant to Tax Deferred |
Your actual after-tax returns will depend on your tax situation and may differ from those shown. After-tax returns shown are not relevant to investors who hold their Fund shares through tax-deferred arrangements, such as 401(k) plans or individual retirement accounts (“IRAs”)
|
| Performance [Table] |
WESTWOOD QUALITY SMALLCAP FUND |
|
1 Year |
|
5 Years |
|
10 Years |
|
Inception Date |
| INSTITUTIONAL |
|
|
|
|
|
|
|
(April 2, 2007) |
| Fund Returns Before Taxes |
|
(0.06)% |
|
6.57% |
|
8.25% |
|
N/A |
| Fund Returns After Taxes on Distributions |
|
(1.58)% |
|
5.23% |
|
7.10% |
|
N/A |
| Fund Returns After Taxes on Distributions and Sale of Fund Shares |
|
0.79% |
|
4.96% |
|
6.47% |
|
N/A |
| Russell 3000® Index (reflects no deduction for fees, expenses, or taxes) |
|
17.15% |
|
13.15% |
|
14.29% |
|
N/A |
| Russell 2000® Value Index (reflects no deduction for fees, expenses, or taxes) |
|
12.59% |
|
8.88% |
|
9.27% |
|
N/A |
| |
|
|
|
|
|
|
|
|
| A Class |
|
|
|
|
|
|
|
(September 3, 2019) |
| Fund Returns Before Taxes |
|
(0.19)% |
|
6.43% |
|
N/A |
|
7.22% |
| Russell 3000® Index (reflects no deduction for fees, expenses, or taxes) |
|
17.15% |
|
13.15% |
|
N/A |
|
15.65% |
| Russell 2000® Value Index (reflects no deduction for fees, expenses, or taxes) |
|
12.59% |
|
8.88% |
|
N/A |
|
10.21% |
| |
|
|
|
|
|
|
|
|
|
C Class |
|
|
|
|
|
|
|
(September 3, 2019) |
| Fund Returns Before Taxes |
|
(0.92)% |
|
5.63% |
|
N/A |
|
6.43% |
| Russell 3000® Index (reflects no deduction for fees, expenses, or taxes) |
|
17.15% |
|
13.15% |
|
N/A |
|
15.65% |
| Russell 2000® Value Index (reflects no deduction for fees, expenses, or taxes) |
|
12.59% |
|
8.88% |
|
N/A |
|
10.21% |
|
| Index No Deduction for Fees, Expenses, or Taxes [Text] |
reflects no deduction for fees, expenses, or taxes
|
| Performance Availability Website Address [Text] |
www.westwoodfunds.com
|
| Performance Availability Phone [Text] |
1-877-FUND-WHG (1-877-386-3944)
|
| Institutional Shares Class A Shares And Class C Shares [Member] | Westwood Income Opportunity Fund |
|
| Prospectus [Line Items] |
|
| Bar Chart and Performance Table [Heading] |
Performance Information
|
| Performance Narrative [Text Block] |
The bar chart and table that follow provide some indication of the risks of investing in the Fund by showing changes in the performance of the Institutional, A Class and C Class Shares of the Fund from year-to-year and by showing how the average annual returns for 1-year, 5-years, 10-years and since inception of the Fund compare with those of the Russell 3000® Index and the Blended 60/40 Bloomberg U.S. Aggregate Bond Index/S&P 500® Index. The performance shown in bar chart and table for periods prior to November 1, 2021 represents the performance of the Institutional, A Class and C Class Shares of the Westwood Income Opportunity Fund, a series of The Advisors’ Inner Circle Fund (the “Predecessor Fund”). The Fund is the successor to the Predecessor Fund through a reorganization with the Fund on November 1, 2021 (the “2021 Reorganization”). How the Fund and the Predecessor Fund have performed in the past (before and after taxes) is not necessarily an indication of how the Fund will perform in the future. Updated performance information is available on the Fund’s website at www.westwoodfunds.com or by calling 1-877-FUND-WHG (1-877-386-3944).
|
| Performance Past Does Not Indicate Future [Text] |
How the Fund and the Predecessor Fund have performed in the past (before and after taxes) is not necessarily an indication of how the Fund will perform in the future.
|
| Performance Information Illustrates Variability of Returns [Text] |
The bar chart and table that follow provide some indication of the risks of investing in the Fund by showing changes in the performance of the Institutional, A Class and C Class Shares of the Fund from year-to-year and by showing how the average annual returns for 1-year, 5-years, 10-years and since inception of the Fund compare with those of the Russell 3000® Index and the Blended 60/40 Bloomberg U.S. Aggregate Bond Index/S&P 500® Index.
|
| Bar Chart [Heading] |
Calendar Year Returns - Institutional Shares*
|
| Bar Chart [Table] |
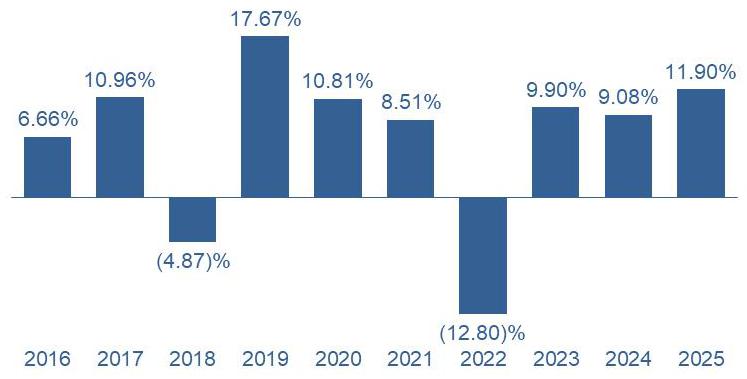
| Year |
Return* |
| Annual Return 2016 |
6.66% |
| Annual Return 2017 |
10.96% |
| Annual Return 2018 |
-4.87% |
| Annual Return 2019 |
17.67% |
| Annual Return 2020 |
10.81% |
| Annual Return 2021 |
8.51% |
| Annual Return 2022 |
-12.80% |
| Annual Return 2023 |
9.90% |
| Annual Return 2024 |
9.08% |
| Annual
Return 2025 |
11.90% |
|
| Bar Chart Closing [Text Block] |
| * |
The Fund’s year-to-date return through December 31, 2025 was 11.90%. |
| Best Quarter |
Worst Quarter |
| 13.16% |
(12.99)% |
| (6/30/2020) |
(3/31/2020) |
|
| Year to Date Return, Label [Optional Text] |
The Fund’s year-to-date return
|
| Bar Chart, Year to Date Return |
11.90%
|
| Bar Chart, Year to Date Return, Date |
Dec. 31, 2025
|
| Highest Quarterly Return, Label [Optional Text] |
Best Quarter
|
| Highest Quarterly Return |
13.16%
|
| Highest Quarterly Return, Date |
Jun. 30, 2020
|
| Lowest Quarterly Return, Label [Optional Text] |
Worst Quarter
|
| Lowest Quarterly Return |
(12.99%)
|
| Lowest Quarterly Return, Date |
Mar. 31, 2020
|
| Performance Table Heading |
Average Annual Total Returns for Periods Ended December 31, 2025
|
| Performance Table Narrative |
This table compares the Fund’s Institutional, A Class and C Class Shares’ average annual total returns for the periods ended December 31, 2025 to those of an appropriate broad-based index and a blended secondary index that represents the investment strategy of the Fund.
After-tax returns are calculated using the historical highest individual federal marginal income tax rates and do not reflect the impact of state and local taxes. Your actual after-tax returns will depend on your tax situation and may differ from those shown. After-tax returns shown are not relevant to investors who hold their Fund shares through tax-deferred arrangements, such as 401(k) plans or individual retirement accounts (“IRAs”).
|
| Performance Table Uses Highest Federal Rate |
After-tax returns are calculated using the historical highest individual federal marginal income tax rates and do not reflect the impact of state and local taxes.
|
| Performance Table Not Relevant to Tax Deferred |
Your actual after-tax returns will depend on your tax situation and may differ from those shown. After-tax returns shown are not relevant to investors who hold their Fund shares through tax-deferred arrangements, such as 401(k) plans or individual retirement accounts (“IRAs”)
|
| Performance [Table] |
WESTWOOD INCOME OPPORTUNITY FUND |
|
1 Year |
|
5 Years |
|
10 Years |
|
Inception Date |
| INSTITUTIONAL |
|
|
|
|
|
|
|
(December 19, 2005) |
| Fund Returns Before Taxes |
|
11.90% |
|
4.89% |
|
6.42% |
|
N/A |
| Fund Returns After Taxes on Distributions |
|
10.77% |
|
3.24% |
|
4.42% |
|
N/A |
| Fund Returns After Taxes on Distributions and Sale of Fund Shares |
|
7.14% |
|
3.17% |
|
4.51% |
|
N/A |
| Russell 3000® Index (reflects no deduction for fees, expenses,or taxes) |
|
17.15% |
|
13.15% |
|
14.29% |
|
N/A |
| Bloomberg U.S. Aggregate Bond Index (reflects no deduction for fees, expenses, or taxes) |
|
7.30% |
|
(0.36)% |
|
2.01% |
|
N/A |
| Blended 60/40 Bloomberg U.S. Aggregate Bond Index/S&P 500® Index (reflects no deduction for fees, expenses, or taxes) |
|
11.58% |
|
5.51% |
|
7.21% |
|
N/A |
| S&P 500 Index (reflects no deduction for fees, expenses, or taxes) |
|
17.88% |
|
14.42% |
|
14.82% |
|
N/A |
| |
|
|
|
|
|
|
|
|
|
A Class |
|
|
|
|
|
|
|
(December 31, 2007) |
| Fund Returns Before Taxes |
|
11.73% |
|
4.68% |
|
6.19% |
|
N/A |
| Russell 3000® Index (reflects no deduction for fees, expenses,or taxes) |
|
17.15% |
|
13.15% |
|
14.29% |
|
N/A |
| Bloomberg U.S. Aggregate Bond Index (reflects no deduction for fees, expenses, or taxes) |
|
7.30% |
|
(0.36)% |
|
2.01% |
|
N/A |
| Blended 60/40 Bloomberg U.S. Aggregate Bond Index/S&P 500® Index (reflects no deduction for fees, expenses, or taxes) |
|
11.58% |
|
5.51% |
|
7.21% |
|
N/A |
| S&P 500 Index (reflects no deduction for fees, expenses, or taxes) |
|
17.88% |
|
14.42% |
|
14.82% |
|
N/A |
| |
|
|
|
|
|
|
|
|
|
C Class |
|
|
|
|
|
|
|
(September 3, 2019) |
| Fund Returns Before Taxes |
|
10.96% |
|
3.92% |
|
N/A |
|
5.19% |
| Russell 3000® Index (reflects no deduction for fees, expenses, or taxes) |
|
17.15% |
|
13.15% |
|
N/A |
|
15.65% |
| Bloomberg U.S. Aggregate Bond Index (reflects no deduction for fees, expenses, or taxes) |
|
7.30% |
|
(0.36)% |
|
N/A |
|
0.77% |
| Blended 60/40 Bloomberg U.S. Aggregate Bond Index/S&P 500® Index (reflects no deduction for fees, expenses, or taxes) |
|
11.58% |
|
5.51% |
|
N/A |
|
7.01% |
| S&P 500® Index (reflects no deduction for fees, expenses, or taxes) |
|
17.88% |
|
14.42% |
|
N/A |
|
16.29% |
|
| Index No Deduction for Fees, Expenses, or Taxes [Text] |
reflects no deduction for fees, expenses, or taxes
|
| Performance Availability Website Address [Text] |
www.westwoodfunds.com
|
| Performance Availability Phone [Text] |
1-877-FUND-WHG (1-877-386-3944)
|
| Institutional Shares Class A Shares And Class C Shares [Member] | Westwood Salient MLP & Energy Infrastructure Fund |
|
| Prospectus [Line Items] |
|
| Bar Chart and Performance Table [Heading] |
Performance Information
|
| Performance Narrative [Text Block] |
The bar chart and table that follow provide some indication of the risks of investing in the Fund by showing changes in the performance of the Institutional Shares of the Fund from year-to-year and by showing how the average annual returns for 1-year, 5-years, and 10-years of the Fund compares with those of the S&P 500® Index and the Alerian Midstream Energy Select Index. The performance shown in the bar chart and the table for periods prior to November 18, 2022 represents performance of the Institutional, A Class, and C Class Shares of the Westwood Salient MLP & Energy Infrastructure Fund, a series of the Salient MF Trust (the “Predecessor Fund”). The Fund is the successor to the Predecessor Fund through a reorganization with the Fund on November 18, 2022 (the “2022 Reorganization”). In connection with the 2022 Reorganization, Class R6 shares of the Predecessor Fund were exchanged for and renamed Ultra Shares of the Fund, respectively. How the Fund and the Predecessor Fund have performed in the past (before and after taxes) is not necessarily an indication of how the Fund will perform in the future. If the investment adviser to Predecessor Fund had not agreed to waive or reimburse certain Predecessor Fund expenses during the period shown, if applicable, the Fund’s and the Predecessor Fund’s returns would have been less than those shown. Updated performance information is available on the Fund’s website at www.westwoodfunds.com or by calling 1-877-FUND-WHG (1-877-386-3944).
|
| Performance Past Does Not Indicate Future [Text] |
How the Fund and the Predecessor Fund have performed in the past (before and after taxes) is not necessarily an indication of how the Fund will perform in the future.
|
| Bar Chart [Heading] |
Calendar Year Returns – Institutional Shares*
|
| Bar Chart [Table] |
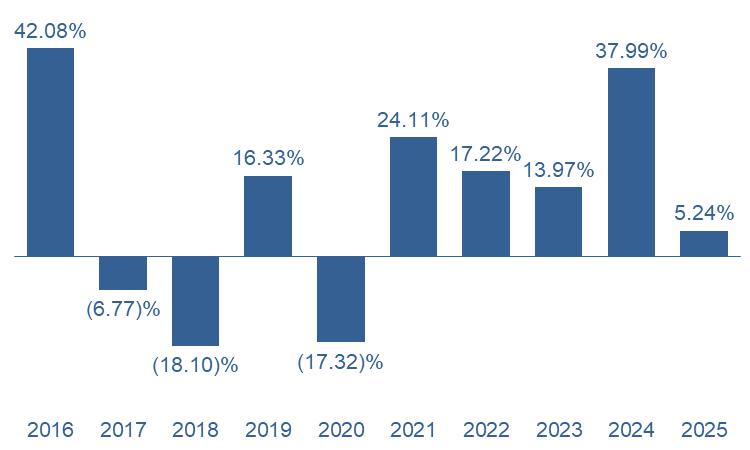
| Years |
Returns |
| 2016 |
42.08% |
| 2017 |
-6.77% |
| 2018 |
-18.10% |
| 2019 |
16.33% |
| 2020 |
-17.32% |
| 2021 |
24.11% |
| 2022 |
17.22% |
| 2023 |
13.97% |
| 2024 |
37.99% |
| 2025 |
5.24% |
| * |
The Fund’s year-to-date return through December 31, 2025 was 5.24%. |
|
| Bar Chart Closing [Text Block] |
| Best Quarter |
Worst Quarter |
| 29.12% |
(42.31)% |
| June 30, 2020 |
March 31, 2020 |
|
| Year to Date Return, Label [Optional Text] |
The Fund’s year-to-date return
|
| Bar Chart, Year to Date Return |
5.24%
|
| Bar Chart, Year to Date Return, Date |
Dec. 31, 2025
|
| Highest Quarterly Return, Label [Optional Text] |
Best Quarter
|
| Highest Quarterly Return |
29.12%
|
| Highest Quarterly Return, Date |
Jun. 30, 2020
|
| Lowest Quarterly Return, Label [Optional Text] |
Worst Quarter
|
| Lowest Quarterly Return |
(42.31%)
|
| Lowest Quarterly Return, Date |
Mar. 31, 2020
|
| Performance Table Heading |
Average Annual Total Returns for Periods ended December 31, 2025
|
| Performance Table Narrative |
This table compares the Fund’s Institutional, A Class and C Class Shares’ average annual total returns for the periods ended December 31, 2025 to those of an appropriate broad-based index and a secondary index.
After-tax returns are calculated using the historical highest individual Federal marginal income tax rates and do not reflect the impact of state and local taxes. Your actual after-tax returns will depend on your tax situation and may differ from those shown. After-tax returns are not relevant to investors who hold their Fund shares through tax-deferred arrangements, such as 401(k) plans or individual retirement accounts (IRAs”).
|
| Performance Table Uses Highest Federal Rate |
After-tax returns are calculated using the historical highest individual Federal marginal income tax rates and do not reflect the impact of state and local taxes.
|
| Performance Table Not Relevant to Tax Deferred |
Your actual after-tax returns will depend on your tax situation and may differ from those shown. After-tax returns are not relevant to investors who hold their Fund shares through tax-deferred arrangements, such as 401(k) plans or individual retirement accounts (IRAs”).
|
| Performance [Table] |
| WESTWOOD SALIENT MLP & ENERGY INFRASTRUCTURE FUND |
|
1 Year |
|
5 Years |
|
10 Years |
| Institutional |
|
|
|
|
|
|
| Return Before Taxes |
|
5.24% |
|
19.22% |
|
9.65% |
| Return After Taxes on Distributions |
|
4.87% |
|
18.44% |
|
9.11% |
| Return After Taxes on Distributions and Sale of Fund Shares |
|
3.36% |
|
15.38% |
|
7.73% |
| S&P
500® Index (reflects
no deduction for fees, expenses or taxes) |
|
17.88% |
|
14.42% |
|
14.82% |
| Alerian
Midstream Energy Select Index (reflects no deduction for fees, expenses or taxes) |
|
6.58% |
|
24.26% |
|
12.70% |
| WESTWOOD SALIENT MLP & ENERGY INFRASTRUCTURE FUND |
|
1 Year |
|
5 Years |
|
10 Years |
| A Class |
|
|
|
|
|
|
| Return Before Taxes |
|
4.95% |
|
18.91% |
|
9.40% |
| S&P
500® Index (reflects no deduction for fees, expenses or taxes) |
|
17.88% |
|
14.42% |
|
14.82% |
| Alerian
Midstream Energy Select Index (reflects no deduction for fees, expenses or taxes) |
|
6.58% |
|
24.26% |
|
12.70% |
| |
|
|
|
|
|
|
| C Class |
|
|
|
|
|
|
| Return Before Taxes |
|
4.18% |
|
18.03% |
|
8.56% |
| S&P
500® Index (reflects no deduction for fees, expenses or taxes) |
|
17.88% |
|
14.42% |
|
14.82% |
| Alerian
Midstream Energy Select Index (reflects no deduction for fees, expenses or taxes) |
|
6.58% |
|
24.26% |
|
12.70% |
|
| Index No Deduction for Fees, Expenses, or Taxes [Text] |
reflects
no deduction for fees, expenses or taxes
|
| Performance Availability Website Address [Text] |
www.westwoodfunds.com
|
| Performance Availability Phone [Text] |
1-877-FUND-WHG (1-877-386-3944)
|
| Institutional Shares A Class C Class [Member] | Westwood Broadmark Tactical Growth Fund |
|
| Prospectus [Line Items] |
|
| Bar Chart and Performance Table [Heading] |
Performance Information
|
| Performance Narrative [Text Block] |
The bar chart and table below provide some indication of the risks of an investment in the Fund by showing changes in the performance of the Institutional, A Class and C Class Shares of the Fund for 1-year, 5-years and 10-years compared with those of the S&P 500® Index and the HFRX Equity Hedge Index. The Fund is the successor to the Salient Tactical Growth Fund, a series of Forward Funds (the “Predecessor Fund”) through a reorganization with the Fund on November 18, 2022 (the “2022 Reorganization”). The performance shown in the bar chart and table for periods prior to November 18, 2022 represents the performance of the Institutional Class, Class A and Class C shares of the Predecessor Fund. In connection with the 2022 Reorganization, Institutional Class, Class A and Class C shares of the Predecessor Fund were exchanged for and renamed Institutional Shares, A Class Shares and C Class Shares of the Fund, respectively. In addition, Investor Class shares of the Predecessor Fund were exchanged for A Class Shares of the Fund. The performance of any index does not reflect deductions for fees, expenses or taxes. If the investment adviser to the Predecessor Fund had not agreed to waive or reimburse certain Predecessor Fund expenses during the period shown, if applicable, the Fund’s and the Predecessor Fund’s returns would have been less than those shown. Past performance, including before- and after-tax returns, is not necessarily an indication of how the Fund will perform in the future. Updated information on the Fund’s performance is available on the Fund’s website at www.westwoodfunds.com or by calling 1-877-FUND-WHG (1-877-386-3944).
The bar chart shows the performance of the Fund’s Institutional Shares. The returns for Fund’s A Class Shares and C Class Shares will be lower than the Institutional Shares’ returns shown in the bar chart because the expenses of the classes differ. All returns reflect reinvestment of all dividend and capital gain distributions.
|
| Performance Past Does Not Indicate Future [Text] |
Past performance, including before- and after-tax returns, is not necessarily an indication of how the Fund will perform in the future.
|
| Performance Information Illustrates Variability of Returns [Text] |
The bar chart and table below provide some indication of the risks of an investment in the Fund by showing changes in the performance of the Institutional, A Class and C Class Shares of the Fund for 1-year, 5-years and 10-years compared with those of the S&P 500® Index and the HFRX Equity Hedge Index.
|
| Bar Chart [Heading] |
Calendar Year Returns - Institutional Shares*
|
| Bar Chart [Table] |
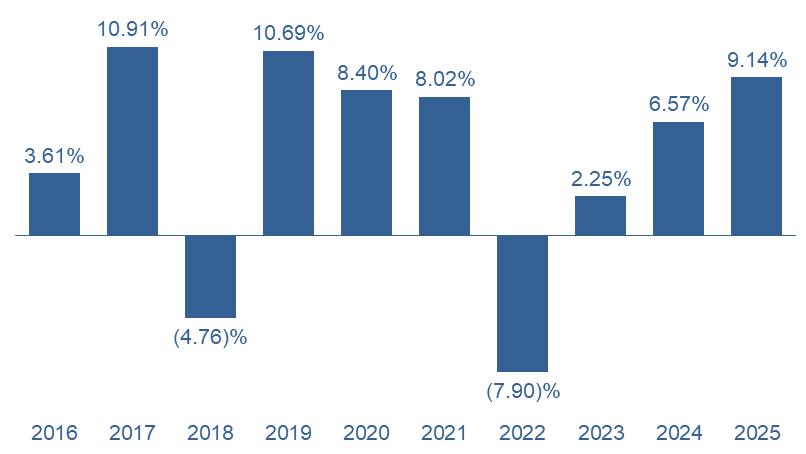
| Years |
Returns |
| 2016 |
3.61% |
| 2017 |
10.91% |
| 2018 |
-4.76% |
| 2019 |
10.69% |
| 2020 |
8.40% |
| 2021 |
8.02% |
| 2022 |
-7.90% |
| 2023 |
2.25% |
| 2024 |
6.57% |
| 2025 |
9.14% |
|
| Bar Chart Closing [Text Block] |
| * |
The Fund’s year-to-date return through December 31, 2025 was 9.14%. |
| Best Quarter |
Worst Quarter |
| 6.49% |
(6.87)% |
| September 30, 2025 |
December 31, 2018 |
|
| Year to Date Return, Label [Optional Text] |
The Fund’s year-to-date return
|
| Bar Chart, Year to Date Return |
9.14%
|
| Bar Chart, Year to Date Return, Date |
Dec. 31, 2025
|
| Highest Quarterly Return, Label [Optional Text] |
Best Quarter
|
| Highest Quarterly Return |
6.49%
|
| Highest Quarterly Return, Date |
Sep. 30, 2025
|
| Lowest Quarterly Return, Label [Optional Text] |
Worst Quarter
|
| Lowest Quarterly Return |
(6.87%)
|
| Lowest Quarterly Return, Date |
Dec. 31, 2018
|
| Performance Table Heading |
Average Annual Total Returns For the period ended December 31, 2025
|
| Performance Table Narrative |
This table compares the Fund’s Institutional, A Class, and C Class Shares’ average annual total returns for the periods ended December 31, 2025 to those of an appropriate broad-based index and a secondary index.
After-tax returns are calculated using the historical highest individual federal marginal income tax rates and do not reflect the impact of state and local taxes. Your actual after-tax returns will depend on your tax situation and may differ from those shown. After-tax returns shown are not relevant to investors who hold their Fund shares through tax-deferred arrangements, such as 401(k) plans or individual retirement accounts (“IRAs”).
|
| Performance Table Uses Highest Federal Rate |
After-tax returns are calculated using the historical highest individual federal marginal income tax rates and do not reflect the impact of state and local taxes.
|
| Performance Table Not Relevant to Tax Deferred |
Your actual after-tax returns will depend on your tax situation and may differ from those shown. After-tax returns shown are not relevant to investors who hold their Fund shares through tax-deferred arrangements, such as 401(k) plans or individual retirement accounts (“IRAs”).
|
| Performance [Table] |
| WESTWOOD BROADMARK TACTICAL GROWTH FUND |
|
1 Year |
|
5 Years |
|
10 Years |
| Institutional |
|
|
|
|
|
|
| Return Before Taxes |
|
9.14% |
|
3.42% |
|
4.50% |
| Return After Taxes on Distributions |
|
8.60% |
|
2.38% |
|
3.30% |
| Return After Taxes on Distributions and Sale of Fund Shares |
|
5.56% |
|
2.27% |
|
3.07% |
| S&P 500® Index (reflects no deduction for fees, expenses, or taxes) |
|
17.88% |
|
14.42% |
|
14.82% |
| HFRX Equity Hedge Index (reflects no deduction for fees, expenses, or taxes) |
|
10.06% |
|
6.61% |
|
4.75% |
| |
|
|
|
|
|
|
| A Class |
|
|
|
|
|
|
| Return Before Taxes |
|
8.83% |
|
3.09% |
|
4.10% |
| S&P 500® Index (reflects no deduction for fees, expenses, or taxes) |
|
17.88% |
|
14.42% |
|
14.82% |
| HFRX Equity Hedge Index (reflects no deduction for fees, expenses, or taxes) |
|
10.06% |
|
6.61% |
|
4.75% |
| |
|
|
|
|
|
|
| C Class |
|
|
|
|
|
|
| Return Before Taxes |
|
8.13% |
|
2.45% |
|
3.49% |
| S&P 500® Index (reflects no deduction for fees, expenses, or taxes) |
|
17.88% |
|
14.42% |
|
14.82% |
| HFRX Equity Hedge Index (reflects no deduction for fees, expenses, or taxes) |
|
10.06% |
|
6.61% |
|
4.75% |
|
| Performance Table One Class of after Tax Shown [Text] |
After-tax returns are shown only for Institutional Shares. After-tax returns for other classes will vary. The table includes all applicable fees and sales charges. All returns reflect reinvestment of all dividend and capital gain distributions.
|
| Index No Deduction for Fees, Expenses, or Taxes [Text] |
reflects no deduction for fees, expenses, or taxes
|
| Performance Table Closing [Text Block] |
After-tax returns are calculated using the historical highest individual Federal marginal income tax rates and do not reflect the impact of state and local taxes. Actual after-tax returns depend on an investor’s tax situation and may differ from those shown. After-tax returns are not relevant to investors who hold their Fund shares through tax-deferred arrangements, such as 401(k) plans or individual retirement accounts (IRAs”). After-tax returns are shown only for Institutional Shares. After-tax returns for other classes will vary. The table includes all applicable fees and sales charges. All returns reflect reinvestment of all dividend and capital gain distributions.
|
| Performance Availability Website Address [Text] |
www.westwoodfunds.com
|
| Performance Availability Phone [Text] |
1-877-FUND-WHG (1-877-386-3944)
|
| Institutional Shares Class A Shares And Class F Shares [Member] | Westwood Broadmark Tactical Plus Fund |
|
| Prospectus [Line Items] |
|
| Bar Chart and Performance Table [Heading] |
Performance Information
|
| Performance Narrative [Text Block] |
The bar chart and table below provide some indication of the risks of an investment in the Fund by showing changes in the performance of the Institutional, A Class and F Class Shares of the Fund for 1-year, 5-years and 10-years compared with those of the S&P 500® Index and the HFRX Equity Hedge Index. The Fund is the successor to the Salient Tactical Plus Fund, a series of Salient MF Trust (the “Predecessor Fund”) through a reorganization with the Fund on November 18, 2022 (the “2022 Reorganization”). The performance shown in the bar chart and table for periods prior to November 18, 2022 represents the performance of the Class I, Class, A, and Class F shares of the Predecessor Fund. In connection with the 2022 Reorganization, Class I, Class A, and Class F shares of the Predecessor Fund were exchanged for and renamed Institutional Shares, A Class Shares, Shares and F Class Shares of the Fund, respectively. The performance of any index does not reflect deductions for fees, expenses or taxes. If the investment adviser to the Fund and the Predecessor Fund had not agreed to waive or reimburse certain Fund or Predecessor Fund expenses during the period shown, if applicable, the Fund’s and the Predecessor Fund’s returns would have been less than those shown. Past performance, including before- and after-tax returns, is not necessarily an indication of how the Fund will perform in the future. Updated information on the Fund’s performance is available on the Fund’s website at www.westwoodfunds.com or by calling 1-877-FUND-WHG (1-877-386-3944).
On December 12, 2014, an earlier iteration of the Fund, named the Broadmark Tactical Plus Fund (the “Old Broadmark Tactical Plus Fund”) was reorganized into the Predecessor Fund (the “Broadmark Reorganization”). In the Broadmark Reorganization, the Old Broadmark Tactical Plus Fund contributed its assets to the Predecessor Fund, and Investor Class and Institutional Class shares of the Old Broadmark Tactical Plus Fund were exchanged for Class F shares of the Predecessor Fund. Following the Broadmark Reorganization, the Predecessor Fund’s investment objective, strategies and policies were in all material respects equivalent to those of the Old Broadmark Tactical Plus Fund. Following the Broadmark Reorganization, the Predecessor Fund was reorganized as the Fund. The Fund’s investment objective and strategies are in all material respects equivalent to those of the Predecessor Fund.
The information below is based on the performance information of the Fund, the Predecessor Fund and the combined fund resulting from the Broadmark Reorganization, and the Old Broadmark Tactical Plus Fund prior to the Broadmark Reorganization (adjusted as necessary to reflect the fees applicable to each of the Predecessor Fund’s classes of shares, respectively). Beginning December 12, 2014, performance reflects the performance of the Predecessor Fund and the actual fees and expenses of each of its share classes.
The bar chart shows the performance of the Fund’s Institutional Shares. The returns for A Class Shares will be lower than the Institutional Shares’ returns shown in the bar chart because the expenses of the classes differ. The returns for F Class Shares will be higher than the Institutional Shares’ returns shown in the bar chart because the expenses of the classes differ. All returns reflect reinvestment of all dividend and capital gain distributions.
|
| Performance Past Does Not Indicate Future [Text] |
Past performance, including before- and after-tax returns, is not necessarily an indication of how the Fund will perform in the future.
|
| Bar Chart [Heading] |
Calendar Year Returns - Institutional Shares*
|
| Bar Chart [Table] |
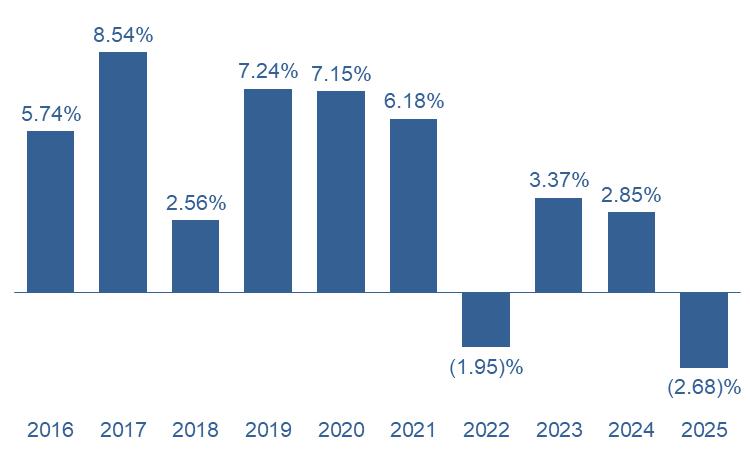
| Years |
Returns |
| 2016 |
5.74% |
| 2017 |
8.54% |
| 2018 |
2.56% |
| 2019 |
7.24% |
| 2020 |
7.15% |
| 2021 |
6.18% |
| 2022 |
-1.95% |
| 2023 |
3.37% |
| 2024 |
2.85% |
| 2025 |
-2.68% |
| * |
The Fund’s year-to-date return through December 31, 2025 was (2.68)%. |
|
| Bar Chart Closing [Text Block] |
| Best Quarter |
Worst Quarter |
| 8.13% |
(3.38)% |
| December 31, 2016 |
March 31, 2020 |
|
| Year to Date Return, Label [Optional Text] |
The Fund’s year-to-date return
|
| Bar Chart, Year to Date Return |
2.68%
|
| Bar Chart, Year to Date Return, Date |
Dec. 31, 2025
|
| Highest Quarterly Return, Label [Optional Text] |
Best Quarter
|
| Highest Quarterly Return |
8.13%
|
| Highest Quarterly Return, Date |
Dec. 31, 2016
|
| Lowest Quarterly Return, Label [Optional Text] |
Worst Quarter
|
| Lowest Quarterly Return |
(3.38%)
|
| Lowest Quarterly Return, Date |
Mar. 31, 2020
|
| Performance Table Heading |
Average Annual Total Returns For the period ended December 31, 2025
|
| Performance Table Narrative |
This table compares the Fund’s Institutional, A Class, and F Class Shares’ average annual total returns for the periods ended December 31, 2025 to those of an appropriate broad-based index and a secondary index.
After-tax returns are calculated using the historical highest individual federal marginal income tax rates and do not reflect the impact of state and local taxes. Your actual after-tax returns will depend on your tax situation and may differ from those shown. After-tax returns shown are not relevant to investors who hold their Fund shares through tax-deferred arrangements, such as 401(k) plans or individual retirement accounts (“IRAs”).
|
| Performance Table Uses Highest Federal Rate |
After-tax returns are calculated using the historical highest individual federal marginal income tax rates and do not reflect the impact of state and local taxes.
|
| Performance Table Not Relevant to Tax Deferred |
Your actual after-tax returns will depend on your tax situation and may differ from those shown. After-tax returns shown are not relevant to investors who hold their Fund shares through tax-deferred arrangements, such as 401(k) plans or individual retirement accounts (“IRAs”).
|
| Performance [Table] |
| WESTWOOD BROADMARK TACTICAL PLUS FUND |
|
1 Year |
|
5 Year |
|
10 Year |
| Institutional |
|
|
|
|
|
|
| Return Before Taxes |
|
(2.68)% |
|
1.50% |
|
3.84% |
| Return After Taxes on Distributions |
|
(3.75)% |
|
0.27% |
|
2.42% |
| Return After Taxes on Distributions and Sale of Fund Shares |
|
(1.55)% |
|
0.75% |
|
2.61% |
| S&P 500 Index (reflects no deduction for fees, expenses or taxes) |
|
17.88% |
|
14.42% |
|
14.82% |
| HFRX
Equity Hedge Index (reflects no deduction for fees, expenses or taxes) |
|
10.06% |
|
6.61% |
|
4.75% |
| |
|
|
|
|
|
|
| A Class |
|
|
|
|
|
|
| Return Before Taxes |
|
(2.94)% |
|
1.23% |
|
3.59% |
| S&P
500 Index (reflects no deduction for fees, expenses or taxes) |
|
17.88% |
|
14.42% |
|
14.82% |
| HFRX
Equity Hedge Index (reflects no deduction for fees, expenses or taxes) |
|
10.06% |
|
6.61% |
|
4.75% |
| |
|
|
|
|
|
|
| F Class |
|
|
|
|
|
|
| Return Before Taxes |
|
(2.44)% |
|
1.80% |
|
4.14% |
| S&P
500 Index (reflects no deduction for fees, expenses or taxes) |
|
17.88% |
|
14.42% |
|
14.82% |
| HFRX
Equity Hedge Index (reflects no deduction for fees, expenses or taxes) |
|
10.06% |
|
6.61% |
|
4.75% |
|
| Performance Table One Class of after Tax Shown [Text] |
After-tax returns are shown only for Institutional Shares. After-tax returns for other classes will vary. The table includes all applicable fees and sales charges.
|
| Index No Deduction for Fees, Expenses, or Taxes [Text] |
reflects no deduction for fees, expenses or taxes
|
| Performance Table Closing [Text Block] |
After-tax returns are calculated using the historical highest individual Federal marginal income tax rates and do not reflect the impact of state and local taxes. Actual after tax-returns depend on an investor’s tax situation and may differ from those shown. After-tax returns are not relevant to investors who hold their Fund shares through tax-deferred arrangements, such as 401(k) plans or individual retirement accounts. After-tax returns are shown only for Institutional Shares. After-tax returns for other classes will vary. The table includes all applicable fees and sales charges.
|
| Performance Availability Website Address [Text] |
www.westwoodfunds.com
|
| Performance Availability Phone [Text] |
1-877-FUND-WHG (1-877-386-3944)
|
| Ultra Shares [Member] | Westwood Quality Value Fund |
|
| Prospectus [Line Items] |
|
| Bar Chart and Performance Table [Heading] |
Performance Information
|
| Performance Narrative [Text Block] |
The bar chart and table that follow provide some indication of the risks of investing in the Fund by showing changes in the performance of the Ultra Shares of the Fund from year-to-year and by showing how the average annual returns for 1-year and since inception of the Fund compare with those of the Russell 3000® Index and Russell 1000® Value Index. The performance shown in the bar chart and table for periods prior to November 1, 2021 represents the performance of the Institutional Shares of the Westwood Quality Value Fund, a series of The Advisors’ Inner Circle Fund (the “Predecessor Fund”). The Fund is the successor to the Predecessor Fund through a reorganization with the Fund on November 1, 2021 (the “2021 Reorganization”). How the Fund and the Predecessor Fund have performed in the past (before and after taxes) is not necessarily an indication of how the Fund will perform in the future. Updated performance information is available on the Fund’s website at www.westwoodfunds.com or by calling 1-877-FUND-WHG (1-877-386-3944).
|
| Performance Past Does Not Indicate Future [Text] |
How the Fund and the Predecessor Fund have performed in the past (before and after taxes) is not necessarily an indication of how the Fund will perform in the future.
|
| Performance Information Illustrates Variability of Returns [Text] |
The bar chart and table that follow provide some indication of the risks of investing in the Fund by showing changes in the performance of the Ultra Shares of the Fund from year-to-year and by showing how the average annual returns for 1-year and since inception of the Fund compare with those of the Russell 3000® Index and Russell 1000® Value Index.
|
| Bar Chart [Heading] |
Calendar Year Returns*
|
| Bar Chart [Table] |
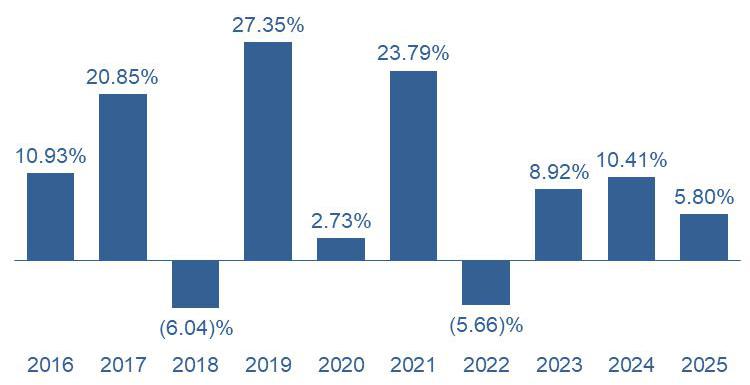
| Year |
Return* |
| Annual Return 2016 |
10.93% |
| Annual Return 2017 |
20.85% |
| Annual Return 2018 |
-6.04% |
| Annual Return 2019 |
27.35% |
| Annual Return 2020 |
2.73% |
| Annual Return 2021 |
23.79% |
| Annual Return 2022 |
-5.66% |
| Annual Return 2023 |
8.92% |
| Annual Return 2024 |
10.41% |
| Annual Return 2025 |
5.80% |
| * |
The Fund’s year-to-date return through December 31, 2025 was 5.80%. |
|
| Bar Chart Closing [Text Block] |
| Best Quarter |
Worst Quarter |
| 8.66% |
(3.17)% |
| (12/31/2023) |
(09/30/2023) |
|
| Year to Date Return, Label [Optional Text] |
The Fund’s year-to-date return
|
| Bar Chart, Year to Date Return |
5.80%
|
| Bar Chart, Year to Date Return, Date |
Dec. 31, 2025
|
| Highest Quarterly Return, Label [Optional Text] |
Best Quarter
|
| Highest Quarterly Return |
8.66%
|
| Highest Quarterly Return, Date |
Dec. 31, 2023
|
| Lowest Quarterly Return, Label [Optional Text] |
Worst Quarter
|
| Lowest Quarterly Return |
(3.17%)
|
| Lowest Quarterly Return, Date |
Sep. 30, 2023
|
| Performance Table Heading |
Average Annual Total Returns for Periods Ended December 31, 2025
|
| Performance Table Narrative |
This table compares the Fund’s Ultra Shares’ average annual total returns for the periods ended December 31, 2025 to those of an appropriate broad-based index and a secondary index.
After-tax returns are calculated using the historical highest individual federal marginal income tax rates and do not reflect the impact of state and local taxes. Your actual after-tax returns will depend on your tax situation and may differ from those shown. After-tax returns shown are not relevant to investors who hold their Fund shares through tax-deferred arrangements, such as 401(k) plans or individual retirement accounts (“IRAs”).
|
| Performance Table Uses Highest Federal Rate |
After-tax returns are calculated using the historical highest individual federal marginal income tax rates and do not reflect the impact of state and local taxes.
|
| Performance Table Not Relevant to Tax Deferred |
Your actual after-tax returns will depend on your tax situation and may differ from those shown. After-tax returns shown are not relevant to investors who hold their Fund shares through tax-deferred arrangements, such as 401(k) plans or individual retirement accounts (“IRAs”).
|
| Performance [Table] |
| WESTWOOD QUALITY VALUE FUND – ULTRA SHARES |
|
1 Year |
|
Since Inception
(November 30, 2022) |
| Fund Returns Before Taxes |
|
5.80% |
|
6.43% |
| Fund Returns After Taxes on Distributions |
|
1.22% |
|
3.89% |
| Fund Returns After Taxes on Distributions and Sale of Fund Shares |
|
6.74% |
|
4.90% |
| Russell 3000® Index (reflects no deduction for fees, expenses, or taxes) |
|
17.15% |
|
19.22% |
| Russell 1000® Value Index (reflects no deduction for fees, expenses, or taxes) |
|
15.91% |
|
11.99% |
|
| Index No Deduction for Fees, Expenses, or Taxes [Text] |
reflects no deduction for fees, expenses, or taxes
|
| Performance Availability Website Address [Text] |
www.westwoodfunds.com
|
| Performance Availability Phone [Text] |
1-877-FUND-WHG (1-877-386-3944)
|
| Ultra Shares [Member] | Westwood Quality Smidcap Fund |
|
| Prospectus [Line Items] |
|
| Bar Chart and Performance Table [Heading] |
Performance Information
|
| Performance Narrative [Text Block] |
The bar chart and table that follow provide some indication of the risks of investing in the Fund by showing changes in the performance of the Ultra Shares of the Fund from year-to-year and by showing how the average annual returns for 1-year, 5-year, and since inception of the Fund compare with those of the Russell 3000® Index and the Russell 2500® Value Index. The performance shown in the bar chart and table for periods prior to November 1, 2021 represents the performance of the Ultra Shares of the Westwood Quality SMidCap Fund, a series of The Advisors’ Inner Circle Fund (the “Predecessor Fund”). The Fund is the successor to the Predecessor Fund through a reorganization with the Fund on November 1, 2021 (the “2021 Reorganization”). How the Fund and the Predecessor Fund have performed in the past (before and after taxes) is not necessarily an indication of how the Fund will perform in the future. Updated performance information is available on the Fund’s website at www.westwoodfunds.com or by calling 1-877-FUND-WHG (1-877-386-3944).
|
| Performance Past Does Not Indicate Future [Text] |
How the Fund and the Predecessor Fund have performed in the past (before and after taxes) is not necessarily an indication of how the Fund will perform in the future.
|
| Performance Information Illustrates Variability of Returns [Text] |
The bar chart and table that follow provide some indication of the risks of investing in the Fund by showing changes in the performance of the Ultra Shares of the Fund from year-to-year and by showing how the average annual returns for 1-year, 5-year, and since inception of the Fund compare with those of the Russell 3000® Index and the Russell 2500® Value Index.
|
| Bar Chart [Heading] |
Calendar Year Returns - Ultra Shares*
|
| Bar Chart [Table] |
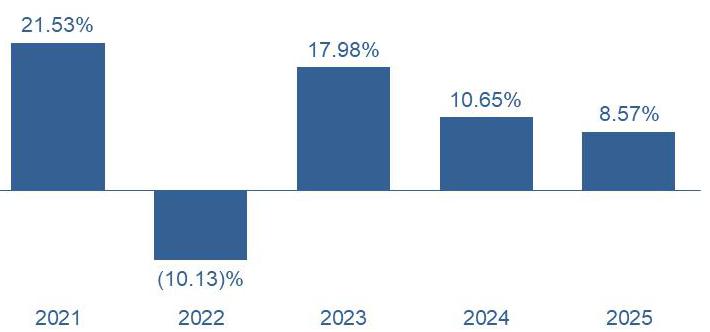
| Year |
Return* |
| Annual Return 2021 |
21.53% |
| Annual Return 2022 |
-10.13% |
| Annual Return 2023 |
17.98% |
| Annual Return 2024 |
10.65% |
| Annual Return 2025 |
8.57% |
| * |
The Fund’s year-to-date return through December 31, 2025 was 8.57%. |
|
| Bar Chart Closing [Text Block] |
| Best Quarter |
Worst Quarter |
| 12.40% |
(14.26)% |
| (12/31/2023) |
(6/30/2022) |
|
| Year to Date Return, Label [Optional Text] |
The Fund’s year-to-date return
|
| Bar Chart, Year to Date Return |
8.57%
|
| Bar Chart, Year to Date Return, Date |
Dec. 31, 2025
|
| Highest Quarterly Return, Label [Optional Text] |
Best Quarter
|
| Highest Quarterly Return |
12.40%
|
| Highest Quarterly Return, Date |
Dec. 31, 2023
|
| Lowest Quarterly Return, Label [Optional Text] |
Worst Quarter
|
| Lowest Quarterly Return |
(14.26%)
|
| Lowest Quarterly Return, Date |
Jun. 30, 2022
|
| Performance Table Heading |
Average Annual Total Returns for Periods Ended December 31, 2025
|
| Performance Table Narrative |
This table compares the Fund’s Ultra Shares’ average annual total returns for the periods ended December 31, 2025 to those of an appropriate broad-based index and a secondary index.
After-tax returns are calculated using the historical highest individual federal marginal income tax rates and do not reflect the impact of state and local taxes. Your actual after-tax returns will depend on your tax situation and may differ from those shown. After-tax returns shown are not relevant to investors who hold their Fund shares through tax-deferred arrangements, such as 401(k) plans or individual retirement accounts (“IRAs”).
|
| Performance Table Uses Highest Federal Rate |
After-tax returns are calculated using the historical highest individual federal marginal income tax rates and do not reflect the impact of state and local taxes.
|
| Performance Table Not Relevant to Tax Deferred |
Your actual after-tax returns will depend on your tax situation and may differ from those shown. After-tax returns shown are not relevant to investors who hold their Fund shares through tax-deferred arrangements, such as 401(k) plans or individual retirement accounts (“IRAs”).
|
| Performance [Table] |
| WESTWOOD QUALITY SMIDCAP FUND – ULTRA SHARES |
|
1 Year |
|
5 Years |
|
Since Inception
(July 31, 2020) |
| Fund Returns Before Taxes |
|
8.57% |
|
9.13% |
|
12.82% |
| Fund Returns After Taxes on Distributions |
|
6.96% |
|
7.52% |
|
11.14% |
| Fund Returns After Taxes on Distributions and Sale of Fund Shares |
|
5.73% |
|
6.78% |
|
9.84% |
| Russell 3000® Index (reflects no deduction for fees, expenses, or taxes) |
|
17.15% |
|
13.15% |
|
15.64% |
| Russell 2500® Value Index (reflects no deduction for fees, expenses, or taxes) |
|
12.73% |
|
10.02% |
|
14.49% |
|
| Index No Deduction for Fees, Expenses, or Taxes [Text] |
reflects no deduction for fees, expenses, or taxes
|
| Performance Availability Website Address [Text] |
www.westwoodfunds.com
|
| Performance Availability Phone [Text] |
1-877-FUND-WHG (1-877-386-3944)
|
| Ultra Shares [Member] | Westwood Quality SmallCap Fund |
|
| Prospectus [Line Items] |
|
| Bar Chart and Performance Table [Heading] |
Performance Information
|
| Performance Narrative [Text Block] |
The bar chart and table that follow provide some indication of the risks of investing in the Fund by showing changes in the performance of the Ultra Shares of the Fund from year-to-year and by showing how the average annual returns for 1-year, 5-year, and since inception of the Fund compare with those of the Russell 3000® Index and the Russell 2000® Index. The performance shown in the bar chart and table for periods prior to November 1, 2021 represents the performance of the Ultra Shares of the Westwood Quality SmallCap Fund, a series of The Advisors’ Inner Circle Fund (the “Predecessor Fund”). The Fund is the successor to the Predecessor Fund through a reorganization with the Fund on November 1, 2021 (the “2021 Reorganization”). How the Fund and Predecessor Fund have performed in the past (before and after taxes) is not necessarily an indication of how the Fund will perform in the future. Updated performance information is available on the Fund’s website at www.westwoodfunds.com or by calling 1-877-FUND-WHG (1-877-386-3944).
|
| Performance Past Does Not Indicate Future [Text] |
How the Fund and Predecessor Fund have performed in the past (before and after taxes) is not necessarily an indication of how the Fund will perform in the future.
|
| Performance Information Illustrates Variability of Returns [Text] |
The bar chart and table that follow provide some indication of the risks of investing in the Fund by showing changes in the performance of the Ultra Shares of the Fund from year-to-year and by showing how the average annual returns for 1-year, 5-year, and since inception of the Fund compare with those of the Russell 3000® Index and the Russell 2000® Index.
|
| Bar Chart [Heading] |
Calendar Year Returns - Ultra Shares*
|
| Bar Chart [Table] |
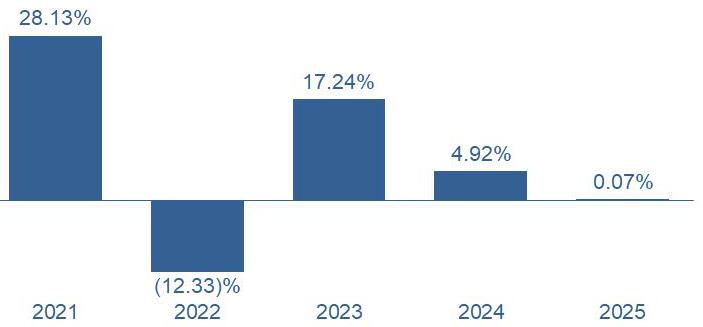
| Year |
Return |
| Annual Return 2021 |
28.13% |
| Annual Return 2022 |
-12.33% |
| Annual Return 2023 |
17.24% |
| Annual Return 2024 |
4.92% |
| Annual Return 2025 |
0.07% |
|
| Bar Chart Closing [Text Block] |
| * |
The Fund’s year-to-date return through December 31, 2025 was 0.07%. |
| Best Quarter |
Worst Quarter |
| 16.99% |
(11.47)% |
| (3/31/2021) |
(6/30/2022) |
|
| Year to Date Return, Label [Optional Text] |
The Fund’s year-to-date return
|
| Bar Chart, Year to Date Return |
0.07%
|
| Bar Chart, Year to Date Return, Date |
Dec. 31, 2025
|
| Highest Quarterly Return, Label [Optional Text] |
Best Quarter
|
| Highest Quarterly Return |
16.99%
|
| Highest Quarterly Return, Date |
Mar. 31, 2021
|
| Lowest Quarterly Return, Label [Optional Text] |
Worst Quarter
|
| Lowest Quarterly Return |
(11.47%)
|
| Lowest Quarterly Return, Date |
Jun. 30, 2022
|
| Performance Table Heading |
Average Annual Total Returns for Periods Ended December 31, 2025
|
| Performance Table Narrative |
This table compares the Fund’s Ultra Shares’ average annual total returns for the periods ended December 31, 2025 to those of an appropriate broad-based index and a secondary index.
After-tax returns are calculated using the historical highest individual federal marginal income tax rates and do not reflect the impact of state and local taxes. Your actual after-tax returns will depend on your tax situation and may differ from those shown. After-tax returns shown are not relevant to investors who hold their Fund shares through tax-deferred arrangements, such as 401(k) plans or individual retirement accounts (“IRAs”).
|
| Performance Table Uses Highest Federal Rate |
After-tax returns are calculated using the historical highest individual federal marginal income tax rates and do not reflect the impact of state and local taxes.
|
| Performance Table Not Relevant to Tax Deferred |
Your actual after-tax returns will depend on your tax situation and may differ from those shown. After-tax returns shown are not relevant to investors who hold their Fund shares through tax-deferred arrangements, such as 401(k) plans or individual retirement accounts (“IRAs”).
|
| Performance [Table] |
| WESTWOOD QUALITY
SMALLCAP FUND – ULTRA SHARES |
|
1
Year |
|
5 Years |
|
Since
Inception
(March
31, 2020) |
| Fund Returns Before Taxes |
|
0.07% |
|
6.70% |
|
13.76% |
| Fund Returns After Taxes on Distributions |
|
(1.49)% |
|
5.32% |
|
12.45% |
| Fund Returns After Taxes on Distributions and Sale of Fund Shares |
|
0.88% |
|
5.06% |
|
10.96% |
| Russell 3000® Index (reflects no deduction for fees, expenses, or taxes) |
|
17.15% |
|
13.15% |
|
19.85% |
| Russell 2000® Value Index (reflects no deduction for fees, expenses, or taxes) |
|
12.59% |
|
8.88% |
|
17.17% |
|
| Index No Deduction for Fees, Expenses, or Taxes [Text] |
reflects no deduction for fees, expenses, or taxes
|
| Performance Availability Website Address [Text] |
www.westwoodfunds.com
|
| Performance Availability Phone [Text] |
1-877-FUND-WHG (1-877-386-3944)
|
| Ultra Shares [Member] | Westwood Income Opportunity Fund |
|
| Prospectus [Line Items] |
|
| Bar Chart and Performance Table [Heading] |
Performance Information
|
| Performance Narrative [Text Block] |
The bar chart and table that follow provide some indication of the risks of investing in the Fund by showing changes in the performance of the Ultra Shares of the Fund from year-to-year and by showing how the average annual returns for 1-year and since inception of the Fund compare with those of the Russell 3000® Index and the Blended 60/40 Bloomberg U.S. Aggregate Bond Index/S&P 500® Index. The performance shown in bar chart and table for periods prior to November 1, 2021 represents the performance of the Institutional Shares of the Westwood Income Opportunity Fund, a series of The Advisors’ Inner Circle Fund (the “Predecessor Fund”). The Fund is the successor to the Predecessor Fund through a reorganization with the Fund on November 1, 2021 (the “2021 Reorganization”). How the Fund and the Predecessor Fund have performed in the past (before and after taxes) is not necessarily an indication of how the Fund will perform in the future. Updated performance information is available on the Fund’s website at www.westwoodfunds.com or by calling 1-877-FUND-WHG (1-877-386-3944).
|
| Performance Past Does Not Indicate Future [Text] |
How the Fund and the Predecessor Fund have performed in the past (before and after taxes) is not necessarily an indication of how the Fund will perform in the future.
|
| Performance Information Illustrates Variability of Returns [Text] |
The bar chart and table that follow provide some indication of the risks of investing in the Fund by showing changes in the performance of the Ultra Shares of the Fund from year-to-year and by showing how the average annual returns for 1-year and since inception of the Fund compare with those of the Russell 3000® Index and the Blended 60/40 Bloomberg U.S. Aggregate Bond Index/S&P 500® Index.
|
| Bar Chart [Heading] |
Calendar Year Returns*
|
| Bar Chart [Table] |
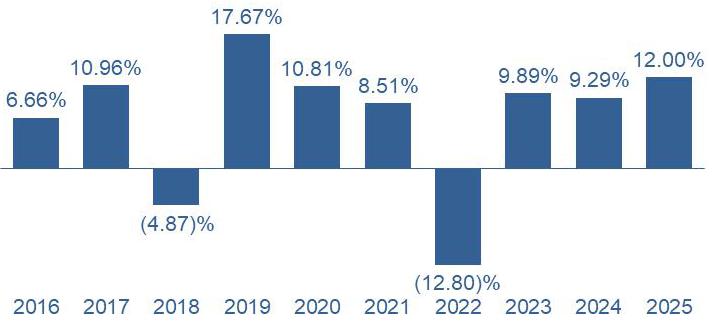
| Year |
Return |
| Annual Return 2016 |
6.66% |
| Annual Return 2017 |
10.96% |
| Annual Return 2018 |
-4.87% |
| Annual Return 2019 |
17.67% |
| Annual Return 2020 |
10.81% |
| Annual Return 2021 |
8.51% |
| Annual Return 2022 |
-12.80% |
| Annual Return 2023 |
9.89% |
| Annual Return 2024 |
9.29% |
| Annual Return 2025 |
12.00% |
|
| Bar Chart Closing [Text Block] |
| * |
The Fund’s year-to-date return through December 31, 2025 was 12.00%. |
| Best Quarter |
Worst Quarter |
| 13.16% |
(12.99)% |
| (6/30/2020) |
(3/31/2020) |
|
| Year to Date Return, Label [Optional Text] |
The Fund’s year-to-date return
|
| Bar Chart, Year to Date Return |
12.00%
|
| Bar Chart, Year to Date Return, Date |
Dec. 31, 2025
|
| Highest Quarterly Return, Label [Optional Text] |
Best Quarter
|
| Highest Quarterly Return |
13.16%
|
| Highest Quarterly Return, Date |
Jun. 30, 2020
|
| Lowest Quarterly Return, Label [Optional Text] |
Worst Quarter
|
| Lowest Quarterly Return |
(12.99%)
|
| Lowest Quarterly Return, Date |
Mar. 31, 2020
|
| Performance Table Heading |
Average Annual Total Returns for Periods Ended December 31, 2025
|
| Performance Table Narrative |
This table compares the Fund’s Ultra Shares’ average annual total returns for the periods ended December 31, 2025 to those of an appropriate broad-based index and a blended secondary index that represents the investment strategy of the Fund.
After-tax returns are calculated using the historical highest individual federal marginal income tax rates and do not reflect the impact of state and local taxes. Your actual after-tax returns will depend on your tax situation and may differ from those shown. After-tax returns shown are not relevant to investors who hold their Fund shares through tax-deferred arrangements, such as 401(k) plans or individual retirement accounts (“IRAs”).
|
| Performance Table Uses Highest Federal Rate |
After-tax returns are calculated using the historical highest individual federal marginal income tax rates and do not reflect the impact of state and local taxes.
|
| Performance Table Not Relevant to Tax Deferred |
Your actual after-tax returns will depend on your tax situation and may differ from those shown. After-tax returns shown are not relevant to investors who hold their Fund shares through tax-deferred arrangements, such as 401(k) plans or individual retirement accounts (“IRAs”).
|
| Performance [Table] |
| WESTWOOD INCOME OPPORTUNITY FUND – ULTRA SHARES |
|
1 Year |
|
Inception Date
(November 30, 2022) |
| Fund Returns Before Taxes |
|
12.00% |
|
9.46% |
| Fund Returns After Taxes on Distributions |
|
10.84% |
|
8.00% |
| Fund Returns After Taxes on Distributions and Sale of Fund Shares |
|
7.20% |
|
6.73% |
| Russell 3000® Index (reflects no deduction for fees, expenses, or taxes) |
|
17.15% |
|
19.22% |
| Blended 60/40 Bloomberg U.S. Aggregate Bond Index/S&P 500® Index (reflects no deduction for fees, expenses, or taxes) |
|
11.58% |
|
10.51% |
| S&P 500 Index (reflects no deduction for fees, expenses, or taxes) |
|
17.88% |
|
19.98% |
Investment Adviser
Westwood Management Corp. is the Fund’s investment adviser.
Portfolio Managers
The Fund is managed by a portfolio team. The professionals primarily responsible for the day-to-day management of the Fund are as follows:
Mr. Adrian Helfert, Senior Vice President and Chief Investment Officer of Alternative and Multi-Asset Investments, has managed the Fund since 2019.*
Mr. Scott Barnard, CFA®, Senior Vice President, Fixed Income Portfolio Manager and Research Analyst, has managed the Fund since 2020.*
Mr. Ben Chittenden, CFA®, Senior Vice President, Portfolio Manager, and Research Analyst, has managed the Fund since November 2024.
| * |
Including managing the Predecessor Fund through its reorganization into the Fund on November 1, 2021. |
For important information about the purchase and sale of Fund shares, taxes and financial intermediary compensation, please turn to the “Summary Information about the Purchase and Sale of Fund Shares, Taxes and Financial Intermediary Compensation” section of the Prospectus.
|
| Index No Deduction for Fees, Expenses, or Taxes [Text] |
reflects no deduction for fees, expenses, or taxes
|
| Performance Availability Website Address [Text] |
www.westwoodfunds.com
|
| Performance Availability Phone [Text] |
1-877-FUND-WHG (1-877-386-3944)
|
| Ultra Shares [Member] | Westwood Alternative Income Fund |
|
| Prospectus [Line Items] |
|
| Bar Chart and Performance Table [Heading] |
Performance Information
|
| Performance Narrative [Text Block] |
The bar chart and table that follow provide some indication of the risks of investing in the Fund by showing changes in the performance of the Ultra Shares of the Fund from year-to-year and by showing how the average annual returns for 1-year, 5-years, and 10-years of the Fund compare with those of the Bloomberg U.S. Aggregate Bond Index and the FTSE 1-Month U.S. Treasury Bill Index. The performance shown in bar chart and table for periods prior to November 1, 2021 represents the performance of the Ultra Shares of the Westwood Alternative Income Fund, a series of The Advisors’ Inner Circle Fund (the “Predecessor Fund”). The Fund is the successor to the Predecessor Fund through a reorganization with the Fund on November 1, 2021 (the “2021 Reorganization”). How the Fund and the Predecessor Fund have performed in the past (before and after taxes) is not necessarily an indication of how the Fund will perform in the future. Updated performance information is available on the Fund’s website at www.westwoodfunds.com or by calling 1-877-FUND-WHG (1-877-386-3944).
|
| Performance Past Does Not Indicate Future [Text] |
How the Fund and the Predecessor Fund have performed in the past (before and after taxes) is not necessarily an indication of how the Fund will perform in the future.
|
| Performance Information Illustrates Variability of Returns [Text] |
The bar chart and table that follow provide some indication of the risks of investing in the Fund by showing changes in the performance of the Ultra Shares of the Fund from year-to-year and by showing how the average annual returns for 1-year, 5-years, and 10-years of the Fund compare with those of the Bloomberg U.S. Aggregate Bond Index and the FTSE 1-Month U.S. Treasury Bill Index.
|
| Bar Chart [Heading] |
Calendar Year Returns - Ultra Shares*
|
| Bar Chart [Table] |
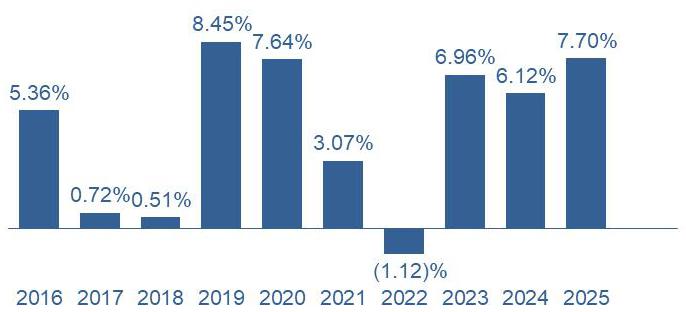
| Year |
Return |
| Annual Return 2016 |
5.36% |
| Annual Return 2017 |
0.72% |
| Annual Return 2018 |
0.51% |
| Annual Return 2019 |
8.45% |
| Annual Return 2020 |
7.64% |
| Annual Return 2021 |
3.07% |
| Annual Return 2022 |
-1.12% |
| Annual Return 2023 |
6.96% |
| Annual Return 2024 |
6.12% |
| Annual Return 2025 |
7.70% |
|
| Bar Chart Closing [Text Block] |
| * |
The Fund’s year-to-date return through December 31, 2025 was 7.70%. |
| Best Quarter |
Worst Quarter |
| 3.55% |
(2.73)% |
| (12/31/2020) |
(3/31/2020) |
|
| Year to Date Return, Label [Optional Text] |
The Fund’s year-to-date return
|
| Bar Chart, Year to Date Return |
7.70%
|
| Bar Chart, Year to Date Return, Date |
Dec. 31, 2025
|
| Highest Quarterly Return, Label [Optional Text] |
Best Quarter
|
| Highest Quarterly Return |
3.55%
|
| Highest Quarterly Return, Date |
Dec. 31, 2020
|
| Lowest Quarterly Return, Label [Optional Text] |
Worst Quarter
|
| Lowest Quarterly Return |
(2.73%)
|
| Lowest Quarterly Return, Date |
Mar. 31, 2020
|
| Performance Table Heading |
Average Annual Total Returns for Periods Ended December 31, 2025
|
| Performance Table Narrative |
This table compares the Fund’s Ultra Shares’ average annual total returns for the periods ended December 31, 2025 to those of an appropriate broad-based index and a secondary index.
After-tax returns are calculated using the historical highest individual federal marginal income tax rates and do not reflect the impact of state and local taxes. Your actual after-tax returns will depend on your tax situation and may differ from those shown. After-tax returns shown are not relevant to investors who hold their Fund shares through tax-deferred arrangements, such as 401(k) plans or individual retirement accounts (“IRAs”).
|
| Performance Table Uses Highest Federal Rate |
After-tax returns are calculated using the historical highest individual federal marginal income tax rates and do not reflect the impact of state and local taxes.
|
| Performance Table Not Relevant to Tax Deferred |
Your actual after-tax returns will depend on your tax situation and may differ from those shown. After-tax returns shown are not relevant to investors who hold their Fund shares through tax-deferred arrangements, such as 401(k) plans or individual retirement accounts (“IRAs”).
|
| Performance [Table] |
| WESTWOOD ALTERNATIVE INCOME FUND – ULTRA |
|
1 Year |
|
5 Years |
|
10 Years |
|
Since
Inception
(May
1, 2015) |
| Fund Returns Before Taxes |
|
7.70% |
|
4.49% |
|
4.49% |
|
N/A |
| Fund Returns After Taxes on Distributions |
|
6.62% |
|
2.49% |
|
3.05% |
|
N/A |
| Fund Returns After Taxes on Distributions and Sale of Fund Shares |
|
4.54% |
|
2.54% |
|
2.84% |
|
N/A |
| Bloomberg U.S. Aggregate Bond Index (reflects no deduction for fees, expenses, or taxes) |
|
7.30% |
|
(0.36)% |
|
2.01% |
|
N/A |
| FTSE 1-Month U.S. Treasury Bill Index (reflects no deduction for fees, expenses, or taxes) |
|
4.35% |
|
3.25% |
|
2.17% |
|
N/A |
|
| Index No Deduction for Fees, Expenses, or Taxes [Text] |
reflects no deduction for fees, expenses, or taxes
|
| Performance Availability Website Address [Text] |
www.westwoodfunds.com
|
| Performance Availability Phone [Text] |
1-877-FUND-WHG (1-877-386-3944)
|
| Ultra Fund [Member] | Westwood Salient MLP & Energy Infrastructure Fund |
|
| Prospectus [Line Items] |
|
| Bar Chart and Performance Table [Heading] |
Performance Information
|
| Performance Narrative [Text Block] |
The bar chart and table that follow provide some indication of the risks of investing in the Fund by showing changes in the performance of the Ultra Shares of the Fund from year-to-year and by showing how the average annual returns for 1-year, 5-years, and since inception of the Fund compares with those of the S&P 500® Index and Alerian Midstream Energy Select Index. The performance shown in the bar chart and the table for periods prior to November 18, 2022 represents performance of the Ultra Shares of the Westwood Salient MLP & Energy Infrastructure Fund, a series of the Salient MF Trust (the “Predecessor Fund”). The Fund is the successor to the Predecessor Fund through a reorganization with the Fund on November 18, 2022 (the “2022 Reorganization”). In connection with the 2022 Reorganization, Class R6 shares of the Predecessor Fund were exchanged for and renamed Ultra Shares of the Fund, respectively. How the Fund and the Predecessor Fund have performed in the past (before and after taxes) is not necessarily an indication of how the Fund will perform in the future. If the investment adviser to Predecessor Fund had not agreed to waive or reimburse certain Predecessor Fund expenses during the period shown, if applicable, the Fund’s and the Predecessor Fund’s returns would have been less than those shown. Updated performance information is available on the Fund’s website at www.westwoodfunds.com or by calling 1-877-FUND-WHG (1-877-386-3944).
|
| Performance Past Does Not Indicate Future [Text] |
How the Fund and the Predecessor Fund have performed in the past (before and after taxes) is not necessarily an indication of how the Fund will perform in the future.
|
| Bar Chart [Heading] |
Calendar Year Returns - Ultra Shares*
|
| Bar Chart [Table] |
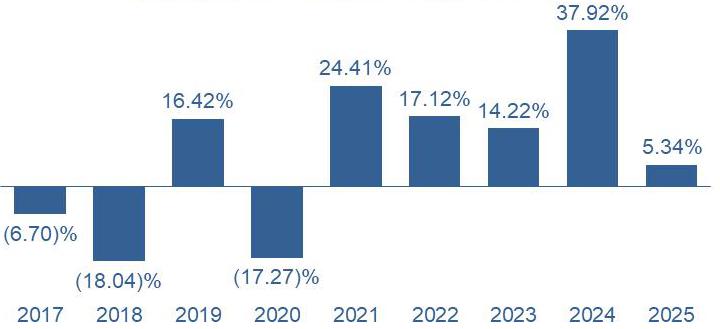
| Years |
Returns |
| 2017 |
-6.70% |
| 2018 |
18.04% |
| 2019 |
16.42% |
| 2020 |
17.27% |
| 2021 |
24.41% |
| 2022 |
17.12% |
| 2023 |
14.22% |
| 2024 |
37.92% |
| 2025 |
5.34% |
|
| Bar Chart Closing [Text Block] |
| * |
The Fund’s year-to-date return through December 31, 2025 was 5.34%. |
| Best Quarter |
Worst Quarter |
| 29.13% |
(42.30)% |
| June 30, 2020 |
March 31, 2020 |
|
| Year to Date Return, Label [Optional Text] |
The Fund’s year-to-date return
|
| Bar Chart, Year to Date Return |
5.34%
|
| Bar Chart, Year to Date Return, Date |
Dec. 31, 2025
|
| Highest Quarterly Return, Label [Optional Text] |
Best Quarter
|
| Highest Quarterly Return |
29.13%
|
| Highest Quarterly Return, Date |
Jun. 30, 2020
|
| Lowest Quarterly Return, Label [Optional Text] |
Worst Quarter
|
| Lowest Quarterly Return |
(42.30%)
|
| Lowest Quarterly Return, Date |
Mar. 31, 2020
|
| Performance Table Heading |
Average Annual Total Returns for Periods ended December 31, 2025
|
| Performance Table Narrative |
This table compares the Fund’s Ultra Shares’ average annual total returns for the periods ended December 31, 2025 to those of an appropriate broad-based index and a secondary index.
After-tax returns are calculated using the historical highest individual Federal marginal income tax rates and do not reflect the impact of state and local taxes. Your actual after-tax returns will depend on your tax situation and may differ from those shown. After-tax returns are not relevant to investors who hold their Fund shares through tax-deferred arrangements, such as 401(k) plans or individual retirement accounts (IRAs”).
|
| Performance Table Uses Highest Federal Rate |
After-tax returns are calculated using the historical highest individual Federal marginal income tax rates and do not reflect the impact of state and local taxes.
|
| Performance Table Not Relevant to Tax Deferred |
Your actual after-tax returns will depend on your tax situation and may differ from those shown. After-tax returns are not relevant to investors who hold their Fund shares through tax-deferred arrangements, such as 401(k) plans or individual retirement accounts (IRAs”).
|
| Performance [Table] |
| WESTWOOD SALIENT MLP & ENERGY INFRASTRUCTURE FUND – ULTRA SHARES |
|
1 Year |
|
5 Years |
|
Since Inception
(January 4, 2016) |
| Return Before Taxes |
|
5.34% |
|
19.31% |
|
9.67% |
| Return After Taxes on Distributions |
|
4.96% |
|
18.53% |
|
9.11% |
| Return After Taxes on Distributions and Sale of Fund Shares |
|
3.42% |
|
15.46% |
|
7.73% |
| S&P 500® Index (reflects no deduction for fees, expenses, or taxes) |
|
17.88% |
|
14.42% |
|
15.01% |
| Alerian Midstream Energy Select Index (reflects no deduction for fees, expenses or taxes) |
|
6.58% |
|
24.26% |
|
12.63% |
|
| Index No Deduction for Fees, Expenses, or Taxes [Text] |
reflects no deduction for fees, expenses, or taxes
|
| Performance Availability Website Address [Text] |
www.westwoodfunds.com
|
| Performance Availability Phone [Text] |
1-877-FUND-WHG (1-877-386-3944)
|
| Westwood Salient Enhanced Midstream Income E T F [Member] | Westwood Salient Enhanced Midstream Income ETF |
|
| Prospectus [Line Items] |
|
| Bar Chart and Performance Table [Heading] |
Performance
|
| Performance Narrative [Text Block] |
The bar chart and table that follow provide some indication of the risks of investing in the Fund by showing changes in the performance of the Fund from year-to-year and by showing how the Fund’s average annual returns for one year and since inception compares with those of a broad-based securities market index. How the Fund has performed in the past (before and after taxes) is not necessarily an indication of how the Fund will perform in the future. Updated performance information, current through
the most recent month end, is available by calling 1-800-994-0755 or by visiting www.westwoodetfs.com.
|
| Performance Past Does Not Indicate Future [Text] |
How the Fund has performed in the past (before and after taxes) is not necessarily an indication of how the Fund will perform in the future.
|
| Performance Information Illustrates Variability of Returns [Text] |
The bar chart and table that follow provide some indication of the risks of investing in the Fund by showing changes in the performance of the Fund from year-to-year and by showing how the Fund’s average annual returns for one year and since inception compares with those of a broad-based securities market index.
|
| Bar Chart [Heading] |
Annual
Total Return Year/Period Ended December 31
Calendar Year Returns*
|
| Bar Chart [Table] |
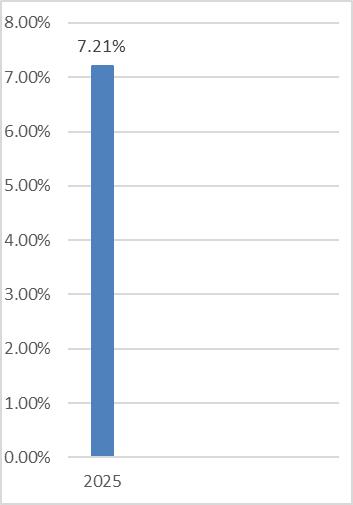
|
| Bar Chart Closing [Text Block] |
|
* |
The Fund’s year-to-date return through December 31, 2025 was 7.21%. |
Quarterly Returns During this Time Period
| Highest |
5.71% (quarter ended March 31, 2025) |
| Lowest |
(0.36)% (quarter ended June 30, 2025) |
|
| Year to Date Return, Label [Optional Text] |
The Fund’s year-to-date return
|
| Bar Chart, Year to Date Return |
7.21%
|
| Bar Chart, Year to Date Return, Date |
Dec. 31, 2025
|
| Highest Quarterly Return, Label [Optional Text] |
Highest
|
| Highest Quarterly Return |
5.71%
|
| Highest Quarterly Return, Date |
Mar. 31, 2025
|
| Lowest Quarterly Return, Label [Optional Text] |
Lowest
|
| Lowest Quarterly Return |
(0.36%)
|
| Lowest Quarterly Return, Date |
Jun. 30, 2025
|
| Performance Table Heading |
Average Annual total Returns for Periods Ended December 31, 2025
|
| Performance [Table] |
| Average Annual total Returns for Periods Ended December 31, 2025 |
One Year |
|
Since Inception
(March 8, 2024) |
| Return Before Taxes |
7.21% |
|
13.59% |
| Return After Taxes on Distributions |
6.64% |
|
12.49% |
| Return After Taxes on Distributions and Sale of Fund Shares |
4.66% |
|
10.23% |
S&P 500® Index
(reflect no deduction for fees, expenses or taxes) |
17.88% |
|
18.72% |
|
| Index No Deduction for Fees, Expenses, or Taxes [Text] |
reflect no deduction for fees, expenses or taxes
|
| Performance Availability Website Address [Text] |
www.westwoodetfs.com
|
| Performance Availability Phone [Text] |
1-800-994-0755
|
| Westwood Salient Enhanced Energy Income E T F [Member] | Westwood Salient Enhanced Energy Income ETF |
|
| Prospectus [Line Items] |
|
| Bar Chart and Performance Table [Heading] |
Performance
|
| Performance Narrative [Text Block] |
The bar chart and table that follow provide some indication of the risks of investing in the Fund by showing changes in the performance of the Fund from year-to-year and by showing how the Fund’s average annual returns for one year and since inception compares with those of a broad-based securities market index. How the Fund has performed in the past (before and after taxes) is not necessarily an indication of how the Fund will perform in the future. Updated performance information, current through the most recent month end, is available by calling 1-800-994-0755 or by visiting www.westwoodetfs.com.
|
| Performance Past Does Not Indicate Future [Text] |
How the Fund has performed in the past (before and after taxes) is not necessarily an indication of how the Fund will perform in the future.
|
| Performance Information Illustrates Variability of Returns [Text] |
The bar chart and table that follow provide some indication of the risks of investing in the Fund by showing changes in the performance of the Fund from year-to-year and by showing how the Fund’s average annual returns for one year and since inception compares with those of a broad-based securities market index.
|
| Bar Chart [Heading] |
Annual Total Return Year/Period Ended December 31
Calendar Year Returns*
|
| Bar Chart [Table] |
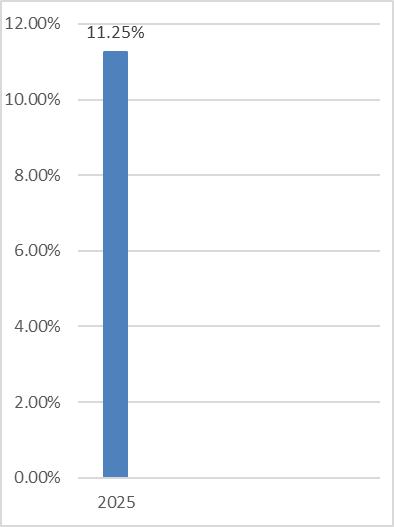
| Years |
Returns |
| 2025 |
11.25% |
|
| Bar Chart Closing [Text Block] |
|
* |
The Fund’s year-to-date return through December 31, 2025 was 11.25%. |
Quarterly Returns During this Time Period
| Highest |
8.63% (quarter ended March 31, 2025) |
| Lowest |
(6.47)% (quarter ended June 30, 2025) |
|
| Year to Date Return, Label [Optional Text] |
The Fund’s year-to-date
|
| Bar Chart, Year to Date Return |
11.25%
|
| Bar Chart, Year to Date Return, Date |
Dec. 31, 2025
|
| Highest Quarterly Return, Label [Optional Text] |
Highest
|
| Highest Quarterly Return |
8.63%
|
| Highest Quarterly Return, Date |
Mar. 31, 2025
|
| Lowest Quarterly Return, Label [Optional Text] |
Lowest
|
| Lowest Quarterly Return |
(6.47%)
|
| Lowest Quarterly Return, Date |
Jun. 30, 2025
|
| Performance Table Heading |
Average Annual total Returns for Periods Ended December 31, 2025
|
| Performance [Table] |
| Average Annual total Returns for Periods Ended December 31, 2025 |
One Year |
|
Since Inception
(March 8, 2024) |
| Return Before Taxes |
11.25% |
|
3.87% |
| Return After Taxes on Distributions |
9.04% |
|
2.19% |
| Return After Taxes on Distributions and Sale of Fund Shares |
7.15% |
|
2.52% |
S&P 500® Index
(reflect no deduction for fees, expenses or taxes) |
17.88% |
|
21.77% |
|
| Index No Deduction for Fees, Expenses, or Taxes [Text] |
reflect no deduction for fees, expenses or taxes
|
| Performance Availability Website Address [Text] |
www.westwoodetfs.com
|
| Performance Availability Phone [Text] |
1-800-994-0755
|