The bar chart below shows how the Fund’s investment results have varied from year to year as represented by the performance of Institutional Class shares. The table below shows how the Fund’s average annual total returns for the one-year, five-year, and ten-year periods compare to those of a broad-based securities market index. This information provides some indication of the risks of investing in the Fund. Past performance (before and after taxes) of the Fund is not necessarily an indication of how it will perform in the future.
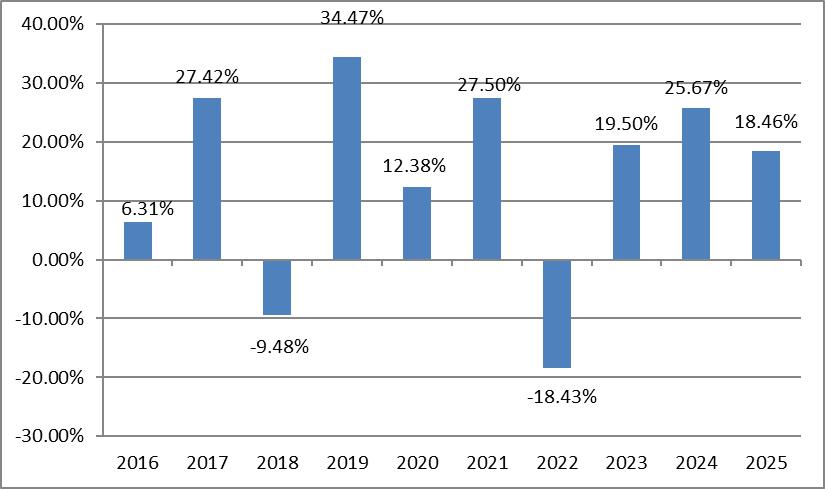
Highest/Lowest quarterly results during this time period were:
Best Quarter: , 21.11%
Worst Quarter: , (22.12%)
| Fund | One Year | Five Years | Ten Years | |||
| Return Before Taxes | 18.46% | 13.09% | 13.11% | |||
| Return After Taxes on Distributions | 14.02% | 9.33% | 10.37% | |||
| Return After Taxes on Distributions and Sale of Fund Shares | 13.91% | 9.69% | 10.17% | |||
| S&P 500® Index | 17.88% | 14.42% | 14.82% |
After-tax returns are calculated using the historical highest individual federal marginal income tax rates in effect and do not reflect the impact of state and local taxes. Actual after-tax returns depend on an investor’s tax situation and may differ from those shown. After-tax returns shown are not relevant to investors who hold their Fund shares through tax-advantaged arrangements, such as 401(k) plans or individual retirement accounts (“IRAs”).
Current performance of the Fund may be lower or higher than the performance quoted above. Performance data current to the most recent month end may be obtained by calling (855) 280-9648. Performance data current to the most recent quarter end may be obtained on the Fund’s website at www.danafunds.com.
The bar chart below shows how the Fund’s investment results have varied from year to year as represented by the performance of Institutional Class shares. The table below shows how the Fund’s average annual total returns for the one-year, five-year and since inception periods compare to those of a broad-based securities market index and a style-specific secondary index. This information provides some indication of the risks of investing in the Fund. Past performance (before and after taxes) of the Fund is not necessarily an indication of how it will perform in the future. During the period from inception of the Fund to November 1, 2020, the Fund was known as the Dana Small Cap Equity Fund, and during the period from inception of the Fund to October 1, 2020, the Fund’s investment strategy did not include an ESG or faith-based component. During the period from November 1, 2020 to February 28, 2024, the Fund was known as the Dana Epiphany ESG Small Cap Equity Fund, and during the period from October 1, 2020 to February 28, 2024, its investment strategy included both an ESG and a faith-based component. If the Fund’s current strategy was used, its performance during the periods presented below may have been different.
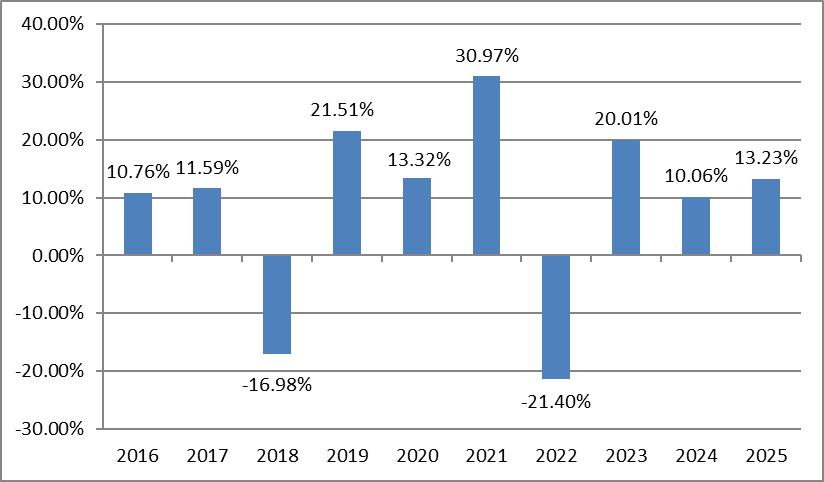
Highest/Lowest quarterly results during this time period were:
Best Quarter: , 29.04%
Worst Quarter: , (33.46%)
| Fund | One Year | Five Years | Ten Years | |||
| Return Before Taxes | 13.23% | 9.01% | 8.08% | |||
| Return After Taxes on Distributions | 11.71% | 7.78% | 7.25% | |||
| Return After Taxes on Distributions and Sale of Fund Shares | 8.94% | 6.98% | 6.42% | |||
| S&P 500® Index | 17.88% | 14.42% | 14.82% | |||
| S&P Small Cap 600® Index | 6.02% | 7.31% | 9.81% |
After-tax returns are calculated using the historical highest individual federal marginal income tax rates in effect and do not reflect the impact of state and local taxes. Actual after-tax returns depend on an investor’s tax situation and may differ from those shown. After-tax returns shown are not relevant to investors who hold their Fund shares through tax-advantaged arrangements, such as 401(k) plans or individual retirement accounts (“IRAs”).
Current performance of the Fund may be lower or higher than the performance quoted above. Performance data current to the most recent month end may be obtained by calling (855) 280-9648. Performance data current to the most recent quarter end may be obtained on the Fund’s website at www.danafunds.com.
As the result of a reorganization, which occurred on December 19, 2018, the Fund adopted the historical performance of the Epiphany FFV Fund (the “Predecessor Fund”), a series of Epiphany Funds.
The returns presented below for the Fund reflect the performance of the Predecessor Fund for periods prior to December 19, 2018. The Fund has adopted the performance of the Predecessor Fund as the result of a reorganization consummated after the close of business on December 19, 2018, in which the Fund acquired all or substantially all of the assets and all of the stated liabilities included in the financial statements of the Predecessor Fund (the “Reorganization”). The performance of the Institutional Class shares of the Fund is based on the performance of the Class I shares of the Predecessor Fund. Prior to the Reorganization, the Fund was a “shell” fund with no assets and had not commenced operations.
The Predecessor Fund was managed by a different investment adviser and different portfolio managers than the Fund. The performance information below is intended to serve as an illustration of the variability of the Fund’s returns since the Fund is a continuation of the Predecessor Fund and has the same investment objective and, prior to February 28, 2024 substantially similar strategies as the Predecessor Fund. While the Fund was substantially similar to the Predecessor Fund and theoretically would have invested in a similar portfolio of securities, the Fund’s performance during the same time period may have been different than the performance of the Predecessor Fund due to, among other things, differences in strategies, fees and expenses.
Prior to February 28, 2024, the Fund’s investment strategy included both an ESG and a faith-based component. If the Fund’s current strategy was used during that period, its performance during the periods presented below may have been different.
The bar chart below shows how the Fund’s investment results have varied from year to year as represented by the performance of its Institutional Class shares. Results prior to December 19, 2018 are for the Class I shares of the Predecessor Fund. The table below shows how the Fund’s average annual total returns for the one-year, five-year, and ten-year periods compare to those of a broad-based securities market index. Results prior to December 19, 2018 are for the Predecessor Fund. Past performance (before and after taxes) of the Fund and the Predecessor Fund is not necessarily an indication of how the Fund will perform in the future. Prior to May 31, 2017, the Predecessor Fund’s Class I shares were called Class C shares, and the fee structure was different. Those shares sold before May 31, 2017 were subject to a contingent deferred sales load, which is not reflected in the returns set forth in the table below. If the contingent deferred sales load was included, the returns would be less than those shown.
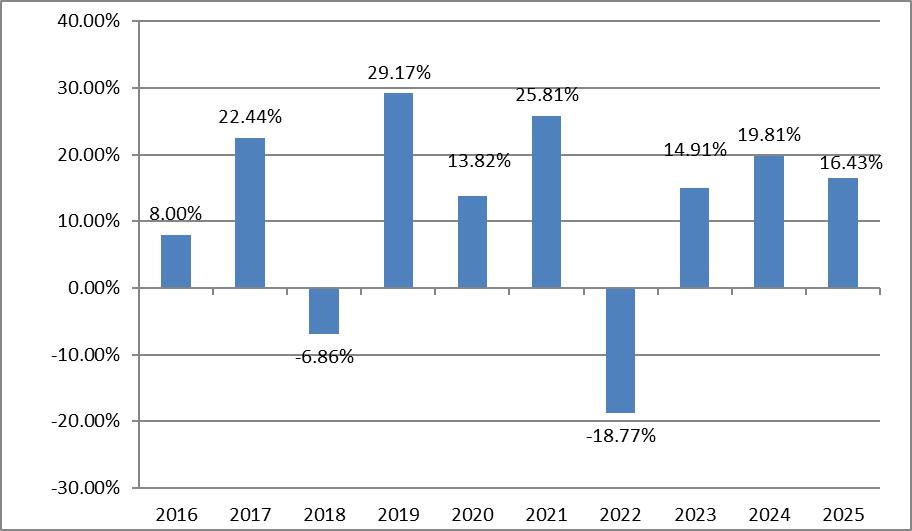
Highest/Lowest quarterly results during this time period were:
Best Quarter: , 21.91%
Worst Quarter: , (21.67%)
| Fund | One Year | Five Years | Ten Years | |||
| Return Before Taxes1 | 16.43% | 10.38% | 11.49% | |||
| Return After Taxes on Distributions | 14.68% | 9.75% | 9.73% | |||
| Return After Taxes On Distributions and Sale of Fund Shares | 10.99% | 8.19% | 8.81% | |||
| S&P 500® Index | 17.88% | 14.42% | 14.82% |
| 1 | Returns shown for periods prior to December 19, 2018 are for Class I shares of the Predecessor Fund. |
After-tax returns are calculated using the historical highest individual federal marginal income tax rates in effect and do not reflect the impact of state and local taxes. Actual after-tax returns depend on an investor’s tax situation and may differ from those shown. After-tax returns shown are not relevant to investors who hold their Fund shares through tax-advantaged arrangements, such as 401(k) plans or individual retirement accounts (“IRAs”).
Current performance of the Fund may be lower or higher than the performance quoted above. Performance data current to the most recent month end may be obtained by calling (855) 280-9648. Performance data current to the most recent quarter end may be obtained on the Fund’s website at www.danafunds.com.