The bar chart and table below illustrate the annual calendar year returns of the Fund based on NAV as well as the average annual Fund returns. The bar chart and table provide an indication of the risks of investing in the Fund by showing changes in the Fund’s performance from year-to-year and by showing how the Fund’s average annual total returns based on NAV compared to those of a broad-based market index, specifically the S&P 500® Index. Additionally, the Fund has also included two additional indices for these purposes: the Dow Jones Global Index and the Nasdaq-100® Index. Further, on or about December 1, 2025 the Fund ceased tracking the Deepwater Frontier Tech Index and began pursuing an active investment strategy. Therefore, the Fund’s performance and historical
returns shown below are not necessarily indicative of the performance that the Fund, based on its current strategy, would have generated. The Fund’s performance information is accessible on the Fund’s website at www.innovatoretfs.com.
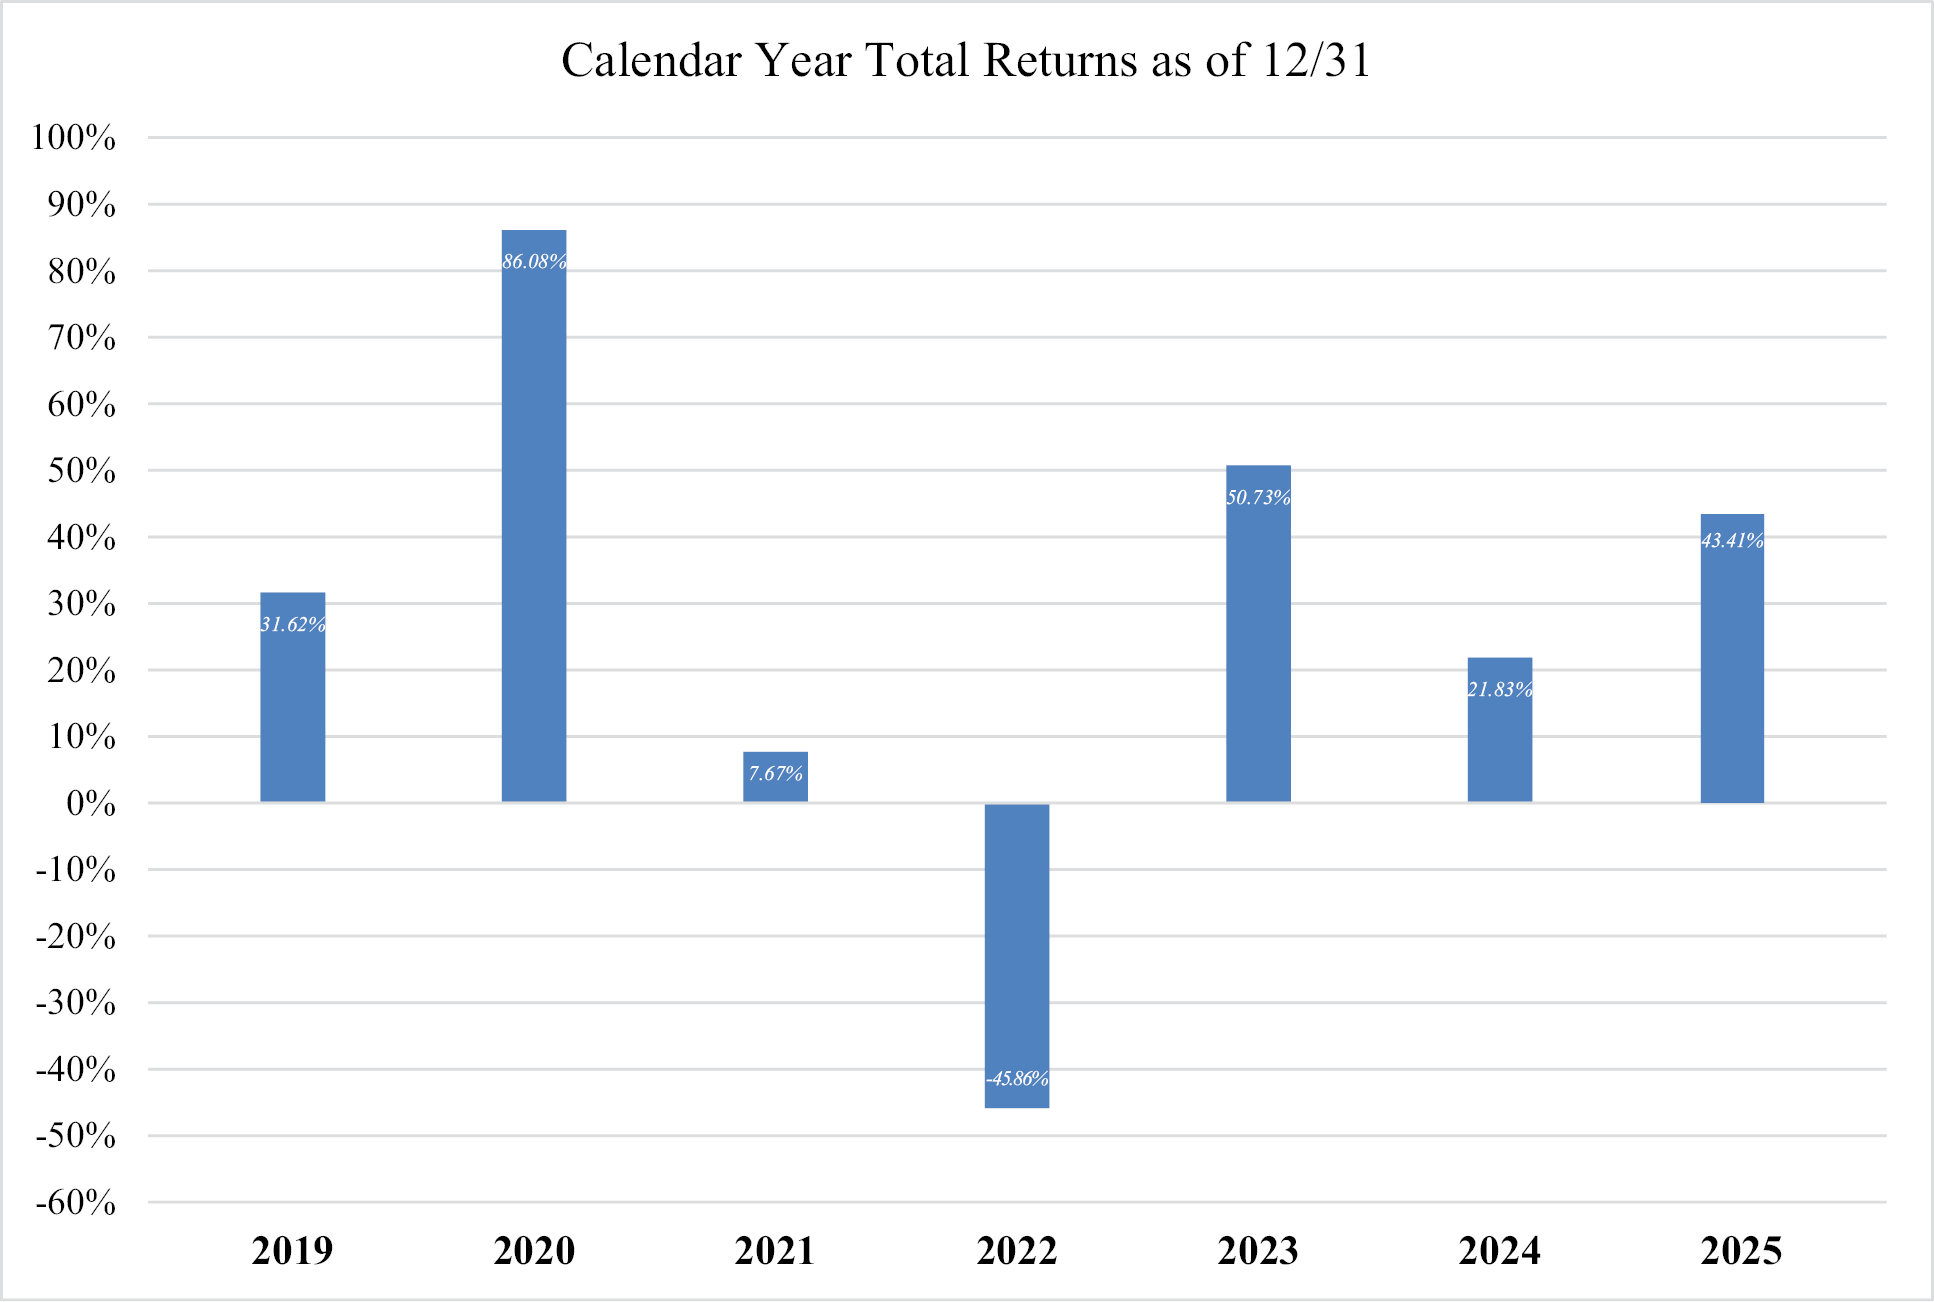
The Fund’s highest quarterly return was 43.85% (quarter ended December 31, 2020) and the Fund’s lowest quarterly return was (35.02)% (quarter ended June 30, 2022).
| Average Annual Total Return as of December 31, 2025 | |||
| Innovator Deepwater Frontier Tech ETF | 1 Year | 5 Years | Since |
| Return Before Taxes | 43.41% | 8.95% | 16.22% |
| Return After Taxes on Distributions | 43.41% | 8.95% | 16.22% |
| Return After Taxes on Distributions and Sale of Fund Shares | 25.70% | 7.08% | 13.52% |
| Deepwater Frontier Tech Index(1) (reflects no deduction for fees, expenses or taxes) | 44.63% | 9.72% | 17.02% |
| Dow Jones Global Index (reflects no deduction for fees, expenses or taxes) | 22.41% | 11.00% | 11.11% |
| NASDAQ-100 Total Return Index (reflects no deduction for fees, expenses or taxes) | 21.02% | 15.30% | 18.95% |
| S&P 500 Total Return Index (reflects no deduction for fees, expenses, or taxes) | 17.88% | 14.42% | 14.51% |
(1) On or about December 1, 2025, the Fund ceased tracking the Deepwater Frontier Tech Index. Therefore, the Fund’s performance and historical returns shown for periods prior to December 1, 2025, are not indicative of the performance that the Fund, based on its current investment strategies, would have generated.
The Fund’s past performance (before and after taxes) is not necessarily an indication of how the Fund will perform in the future.
Returns before taxes do not reflect the effects of any income or capital gains taxes. All after-tax returns are calculated using the historical highest individual federal marginal income tax rates and do not reflect the impact of any state or local tax. Returns after taxes on distributions reflect the taxed return on the payment of dividends and capital gains.
Your own actual after-tax returns will depend on your specific tax situation and may differ from what is shown here. After-tax returns are not relevant to investors who hold Shares in tax-deferred accounts such as individual retirement accounts (IRAs) or employee-sponsored retirement plans.
As of the date of this prospectus, the Fund has been in operation for less than one full calendar year and therefore does not report its performance information. Once available, the Fund’s performance information will be accessible on the Fund’s website at www.innovatoretfs.com and will provide some indication of the risks of investing in the Fund.
As of the date of this prospectus, the Fund has been in operation for less than one full calendar year and therefore does not report its performance information. Once available, the Fund’s performance information will be accessible on the Fund’s website at www.innovatoretfs.com and will provide some indication of the risks of investing in the Fund.
The bar chart and table below illustrate the annual calendar year returns of the Fund based on NAV as well as the average annual Fund returns. The bar chart and table provide an indication of the risks of investing in the Fund by showing changes in the Fund’s performance from year-to-year and by showing how the Fund’s average annual total returns based on NAV compared to those of a market index and a broad-based market index. The Fund’s performance information is accessible on the Fund’s website at www.innovatoretfs.com.
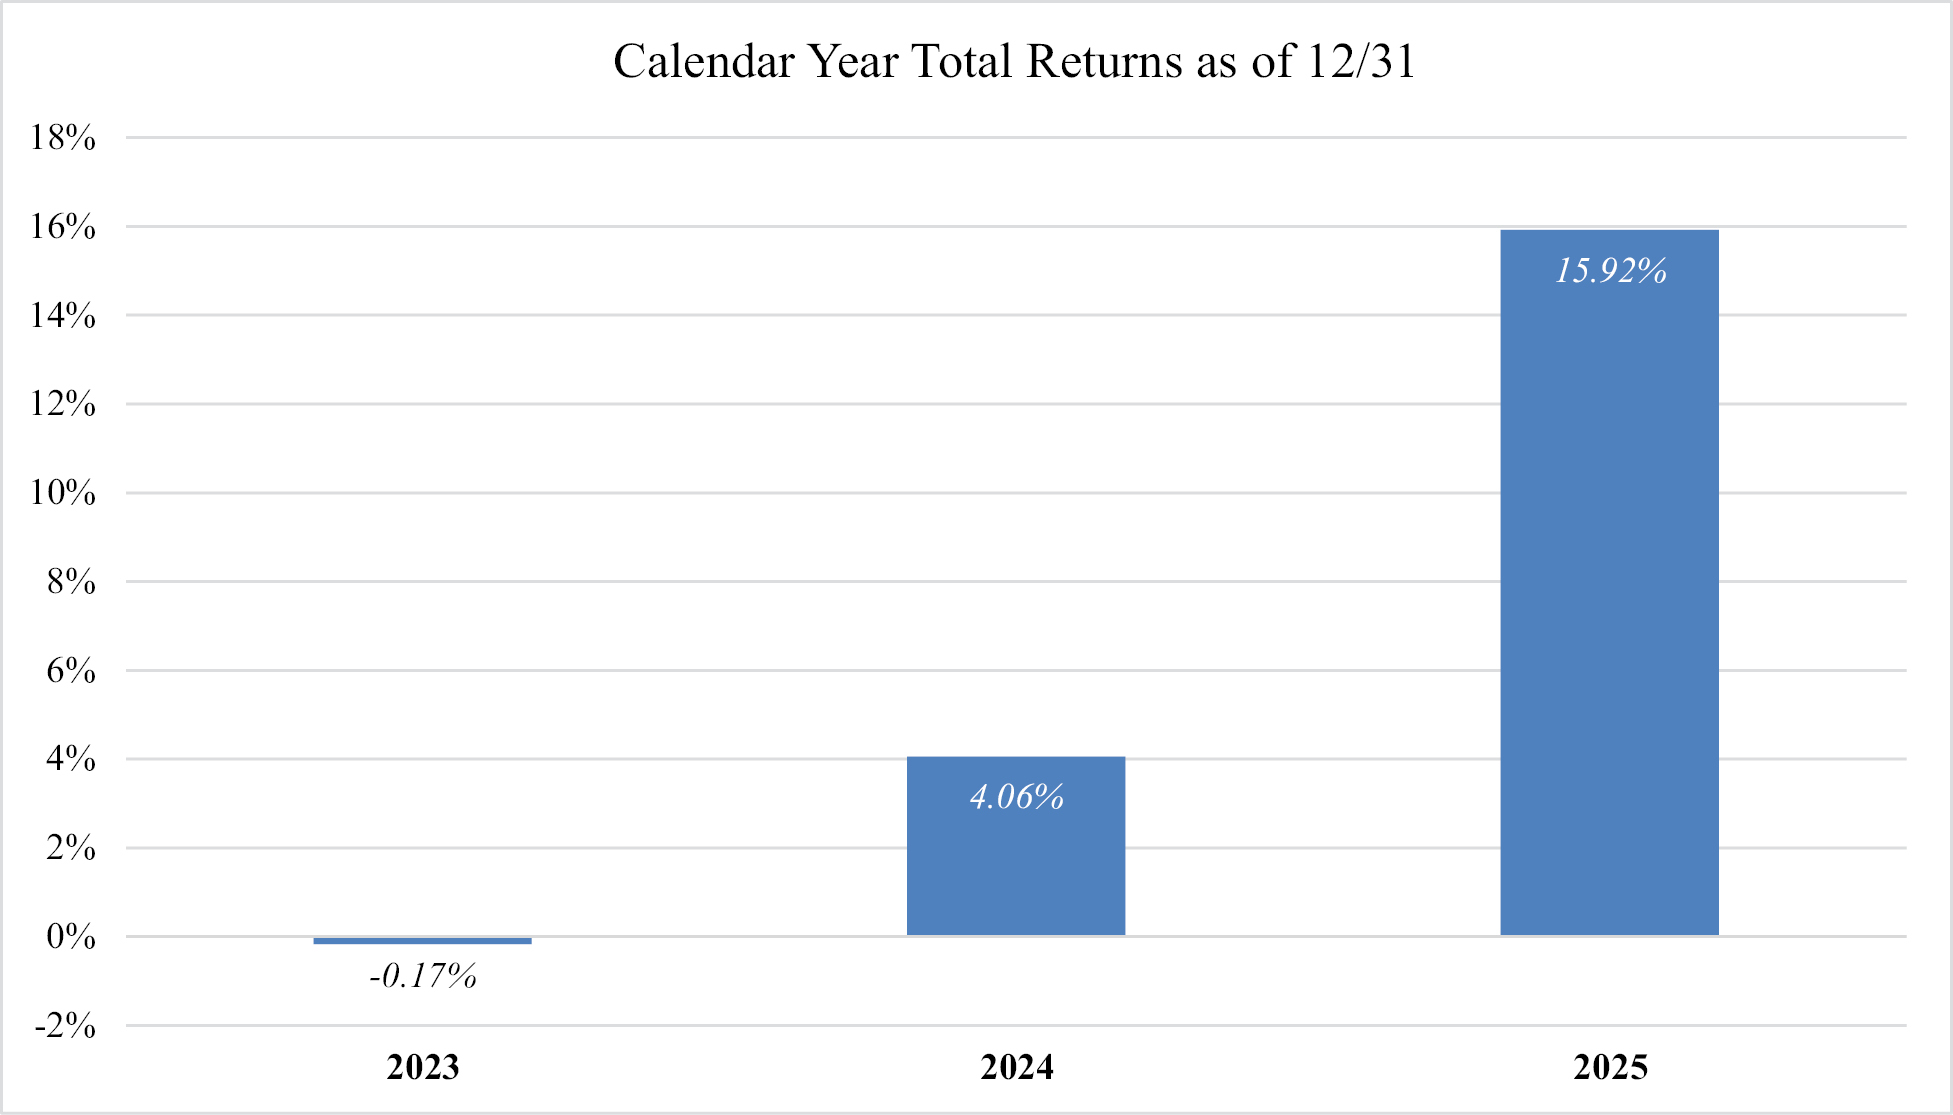
The Fund’s highest quarterly return was 15.42% (quarter ended March 31, 2024) and the Fund’s lowest quarterly return was (11.29)% (quarter ended December 31, 2024).
| Average Annual Total Return as of December 31, 2025 | ||
| Innovator Gradient Tactical Rotation Strategy ETF | 1 Year | Since |
| Return Before Taxes | 15.92% | 5.46% |
| Return After Taxes on Distributions | 15.70% | 5.20% |
| Return After Taxes on Distributions and Sale of Fund Shares | 9.58% | 4.25% |
| S&P Global Broad Market Index – Total Return (reflects no deduction for fees, expenses or taxes) | 22.47% | 18.91% |
| S&P 500® Total Return Index (reflects no deduction for fees, expenses or taxes) | 17.88% | 20.90% |
The Fund’s past performance (before and after taxes) is not necessarily an indication of how the Fund will perform in the future.
Returns before taxes do not reflect the effects of any income or capital gains taxes. All after-tax returns are calculated using the historical highest individual federal marginal income tax rates and do not reflect the impact of any state or local tax. Returns after taxes on distributions reflect the taxed return on the payment of dividends and capital gains.
Your own actual after-tax returns will depend on your specific tax situation and may differ from what is shown here. After-tax returns are not relevant to investors who hold Shares in tax-deferred accounts such as individual retirement accounts (IRAs) or employee-sponsored retirement plans.
The bar chart and table below illustrate the annual calendar year returns of the Fund based on NAV as well as the average annual Fund and Index returns. The bar chart and table provide an indication of the risks of investing in the Fund by showing changes in the Fund’s performance from year-to-year and by showing how the Fund’s average annual total returns based on NAV compared to those of
the Index and a broad-based market index. Prior to November 20, 2017, the Fund was actively managed using a quantitative strategy substantially similar to the methodology of the Index. The Fund’s performance information is accessible on the Fund’s website at www.innovatoretfs.com.
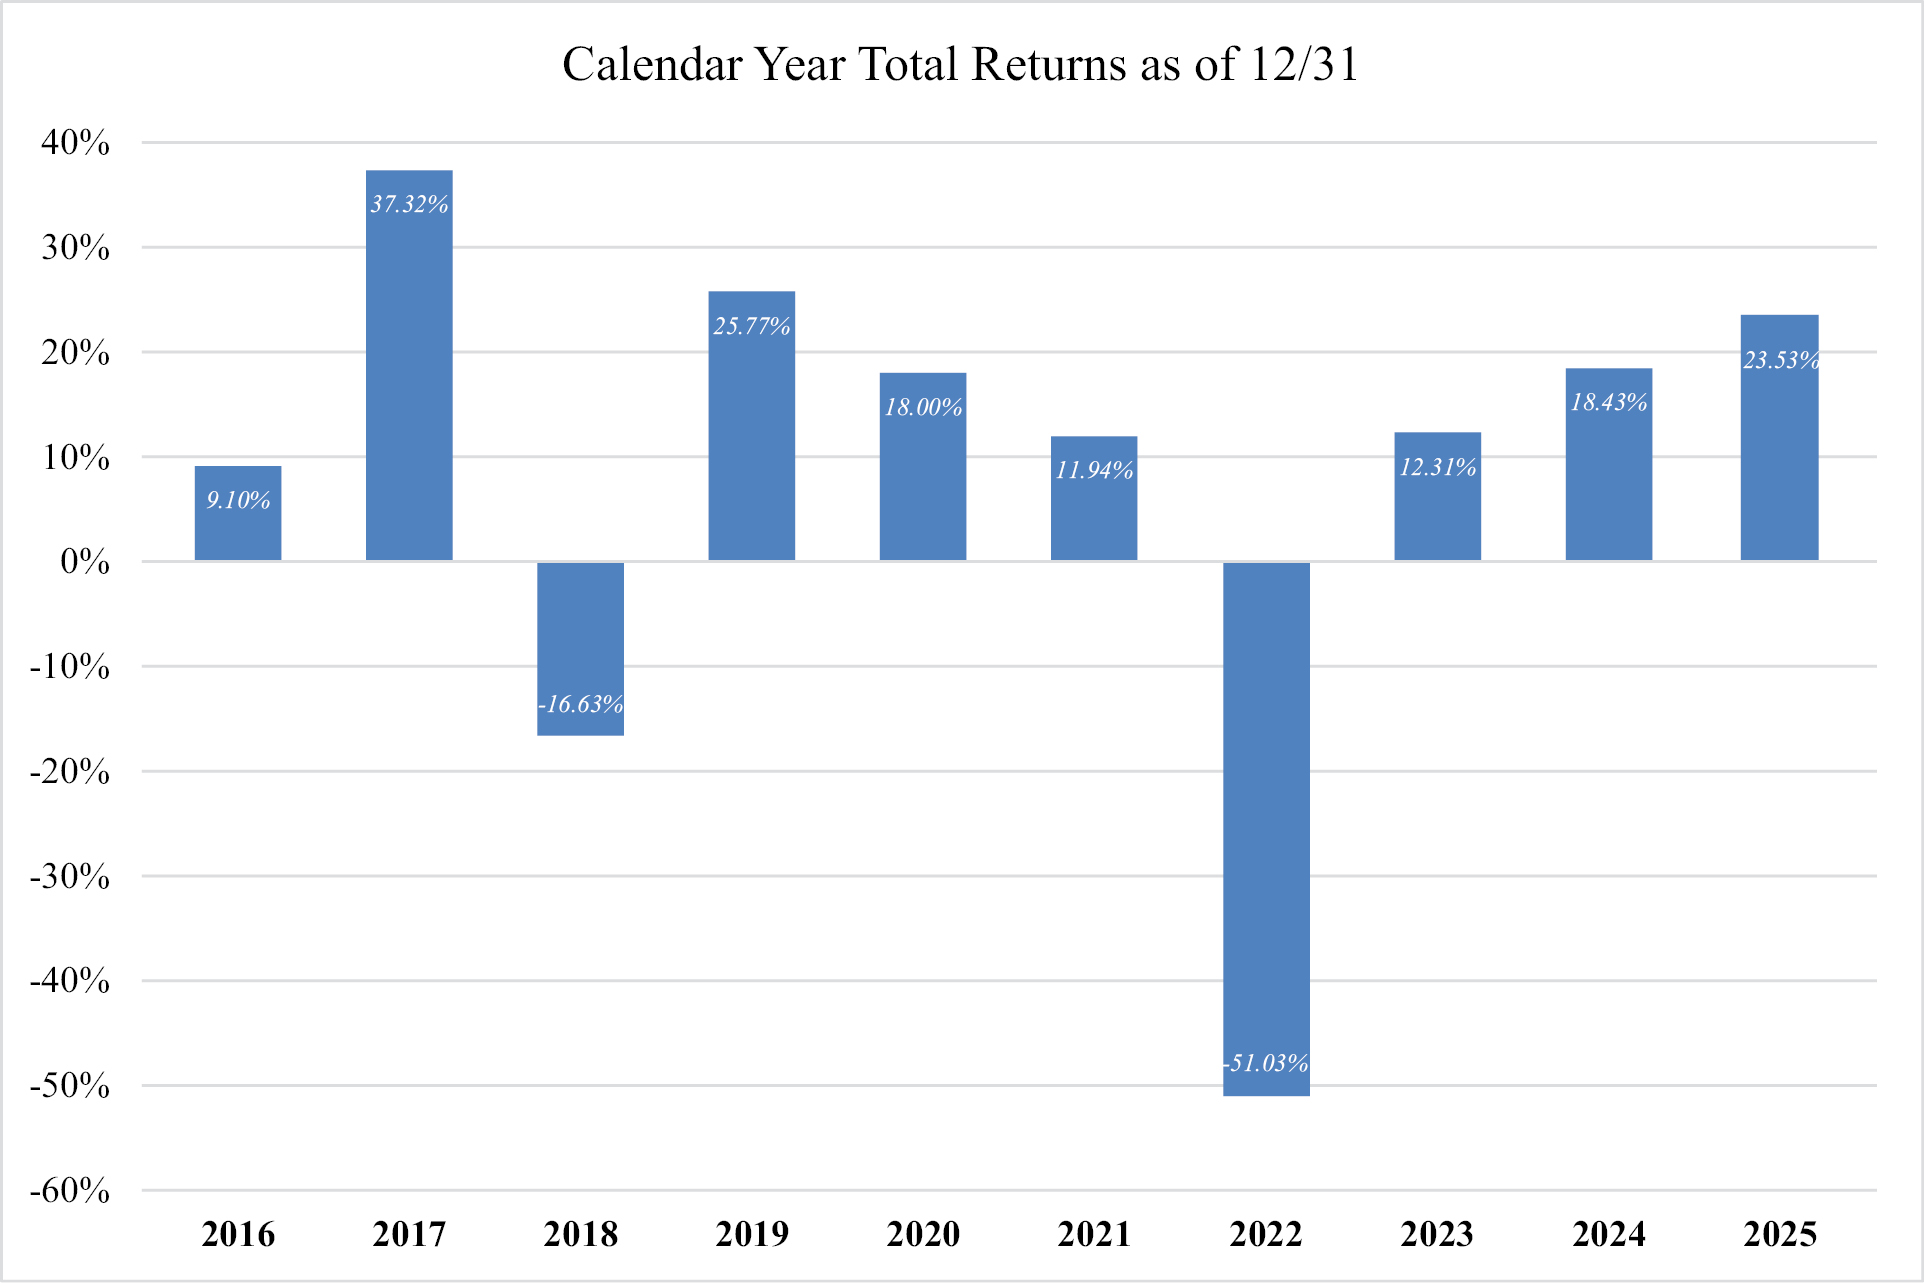
The Fund’s highest quarterly return was 23.20% (quarter ended June 30, 2020) and the Fund’s lowest quarterly return was (31.23)% (quarter ended June 30, 2022).
| Average Annual Total Return as of December 31, 2025 | ||||
| Innovator IBD® 50 ETF | 1 Year | 5 Years | 10 Years | Since |
| Return Before Taxes | 23.53% | -2.07% | 5.26% | 3.72% |
| Return After Taxes on Distributions | 22.89% | -2.46% | 5.04% | 3.53% |
| Return After Taxes on Distributions and Sale of Fund Shares | 13.96% | -1.72% | 4.11% | 2.86% |
| IBD® 50 Index (reflects no deduction for fees, expenses or taxes) | 24.06% | -1.38% | ||
| S&P 500® Total Return Index (reflects no deduction for fees, expenses or taxes) | 17.88% | 14.42% | 14.82% | 13.71% |
(1) On November 20, 2017, the Fund began tracking the IBD® 50 Index. Because the IBD® 50 Index had an inception date of October 27, 2017, performance information is not included above.
(2) Performance data is not available for all the periods shown in the table for the index because performance data does not exist for the entire period.
The Fund’s past performance (before and after taxes) is not necessarily an indication of how the Fund will perform in the future.
Returns before taxes do not reflect the effects of any income or capital gains taxes. All after-tax returns are calculated using the historical highest individual federal marginal income tax rates and do not reflect the impact of any state or local tax. Returns after taxes on distributions reflect the taxed return on the payment of dividends and capital gains.
Your own actual after-tax returns will depend on your specific tax situation and may differ from what is shown here. After-tax returns are not relevant to investors who hold Shares in tax-deferred accounts such as individual retirement accounts (IRAs) or employee-sponsored retirement plans.
The bar chart and table below illustrate the annual calendar year returns of the Fund based on NAV as well as the average annual Fund and Index returns. The bar chart and table provide an indication of the risks of investing in the Fund by showing changes in the Fund’s performance from year-to-year and by showing how the Fund’s average annual total returns based on NAV compared to those of the Index and a broad-based market index. The Fund’s performance information is accessible on the Fund’s website at www.innovatoretfs.com.
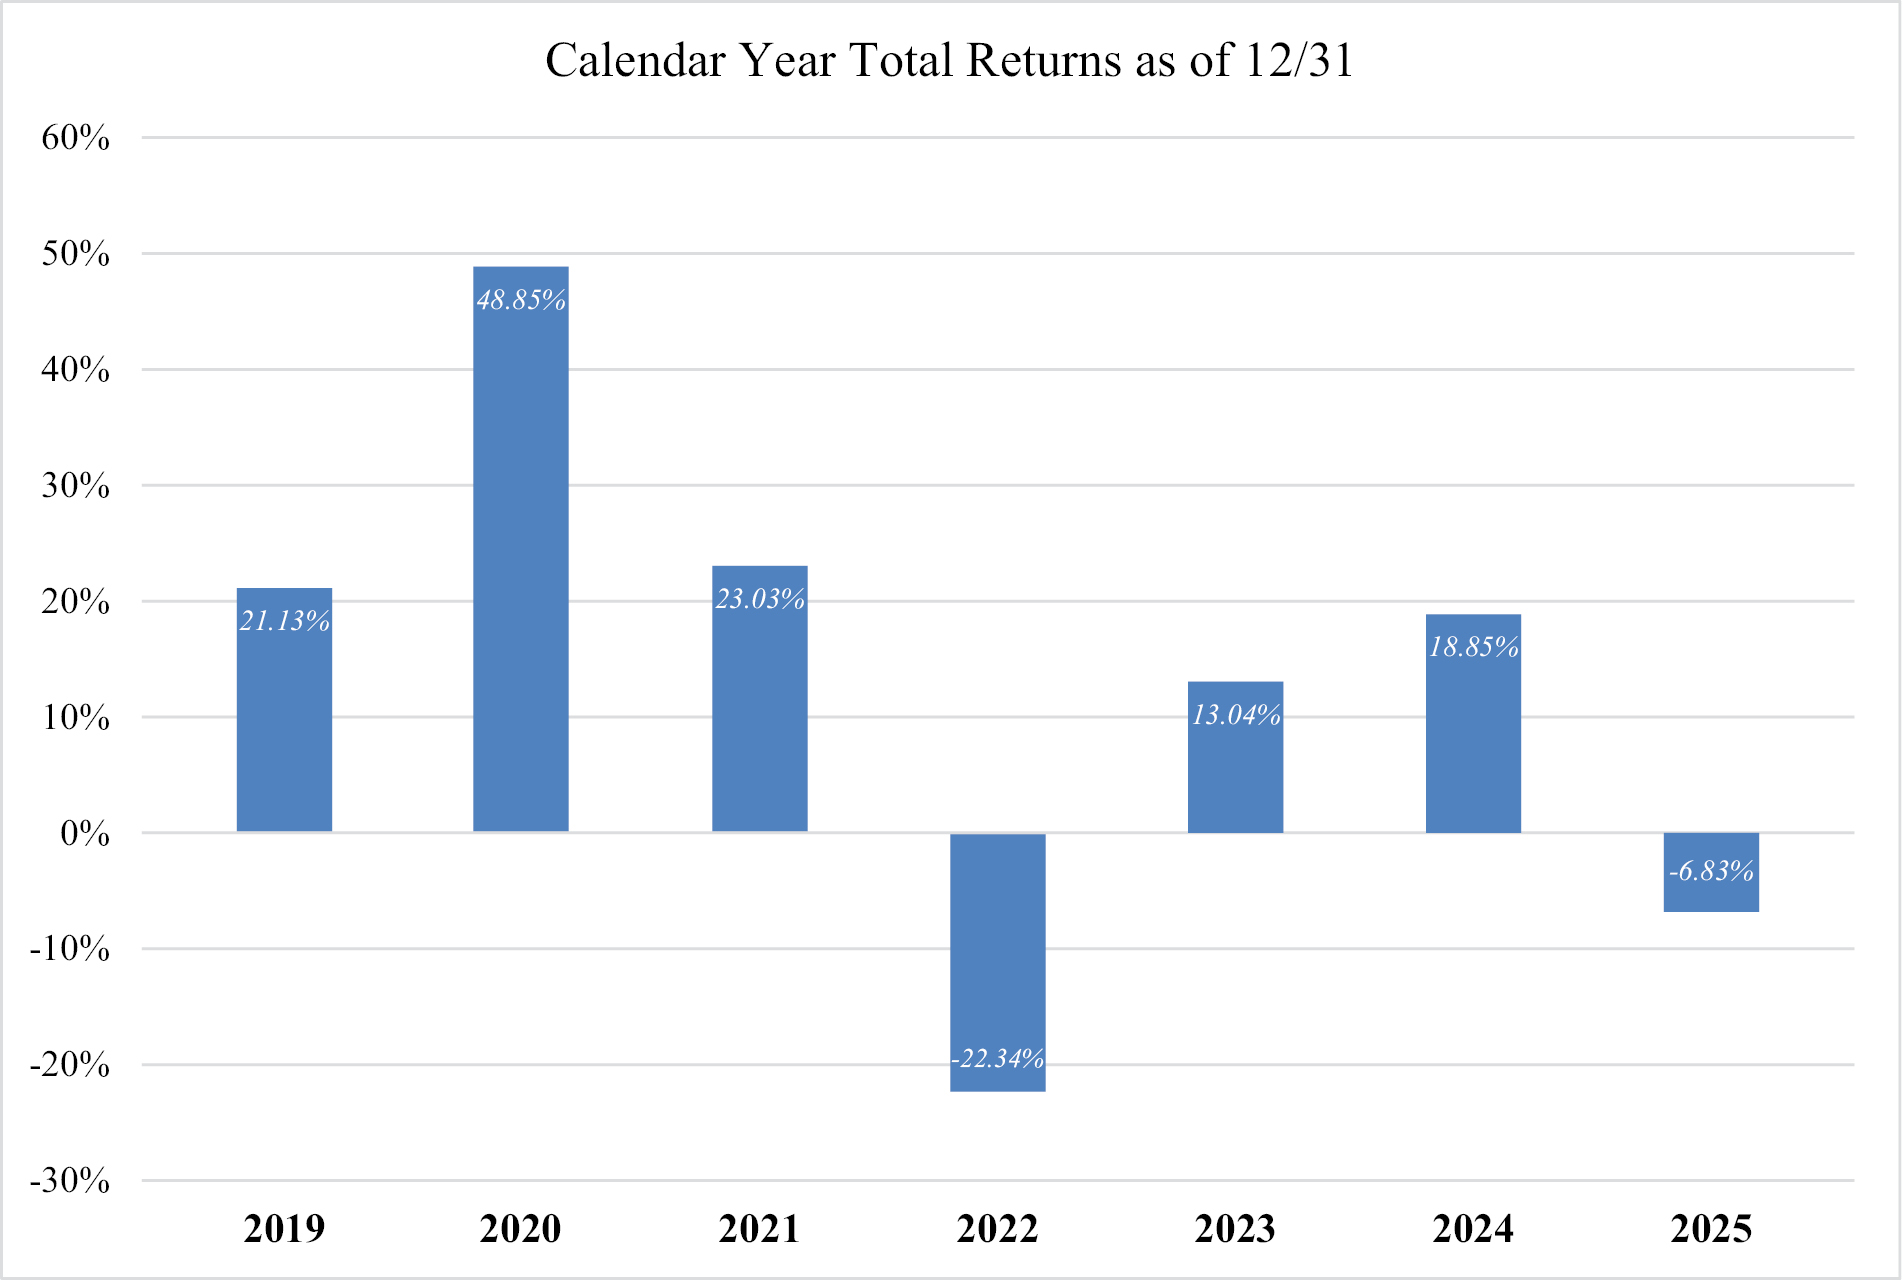
The Fund’s highest quarterly return was 32.61% (quarter ended December 31, 2020) and the Fund’s lowest quarterly return was (20.54)% (quarter ended June 30, 2022).
| Average Annual Total Return as of December 31, 2025 | |||
| Innovator IBD® Breakout Opportunities ETF | 1 Year | 5 Years | Since |
| Return Before Taxes | -6.83% | 3.65% | 5.79% |
| Return After Taxes on Distributions | -6.95% | 3.37% | 5.59% |
| Return After Taxes on Distributions and Sale of Fund Shares | -4.04% | 2.71% | 4.50% |
| IBD® Breakout Stocks Index (reflects no deduction for fees, expenses or taxes) | -5.68% | 5.00% | 7.15% |
| S&P 500® Total Return Index (reflects no deduction for fees, expenses or taxes) | 17.88% | 14.42% | 14.37% |
The Fund’s past performance (before and after taxes) is not necessarily an indication of how the Fund will perform in the future.
Returns before taxes do not reflect the effects of any income or capital gains taxes. All after-tax returns are calculated using the historical highest individual federal marginal income tax rates and do not reflect the impact of any state or local tax. Returns after taxes on distributions reflect the taxed return on the payment of dividends and capital gains.
Your own actual after-tax returns will depend on your specific tax situation and may differ from what is shown here. After-tax returns are not relevant to investors who hold Shares in tax-deferred accounts such as individual retirement accounts (IRAs) or employee-sponsored retirement plans.
As of the date of this prospectus, the Fund has been in operation for less than one full calendar year and therefore does not report its performance information. Once available, the Fund’s performance information will be accessible on the Fund’s website at www.innovatoretfs.com and will provide some indication of the risks of investing in the Fund.
The bar chart and table below illustrate the annual calendar year returns of the Fund based on NAV as well as the average annual Fund and Index returns. The bar chart and table provide an indication of the risks of investing in the Fund by showing changes in the Fund’s performance from year-to-year and by showing how the Fund’s average annual total returns based on NAV compared to those of the Index and a broad-based market index. The Fund’s performance information is accessible on the Fund’s website at www.innovatoretfs.com.
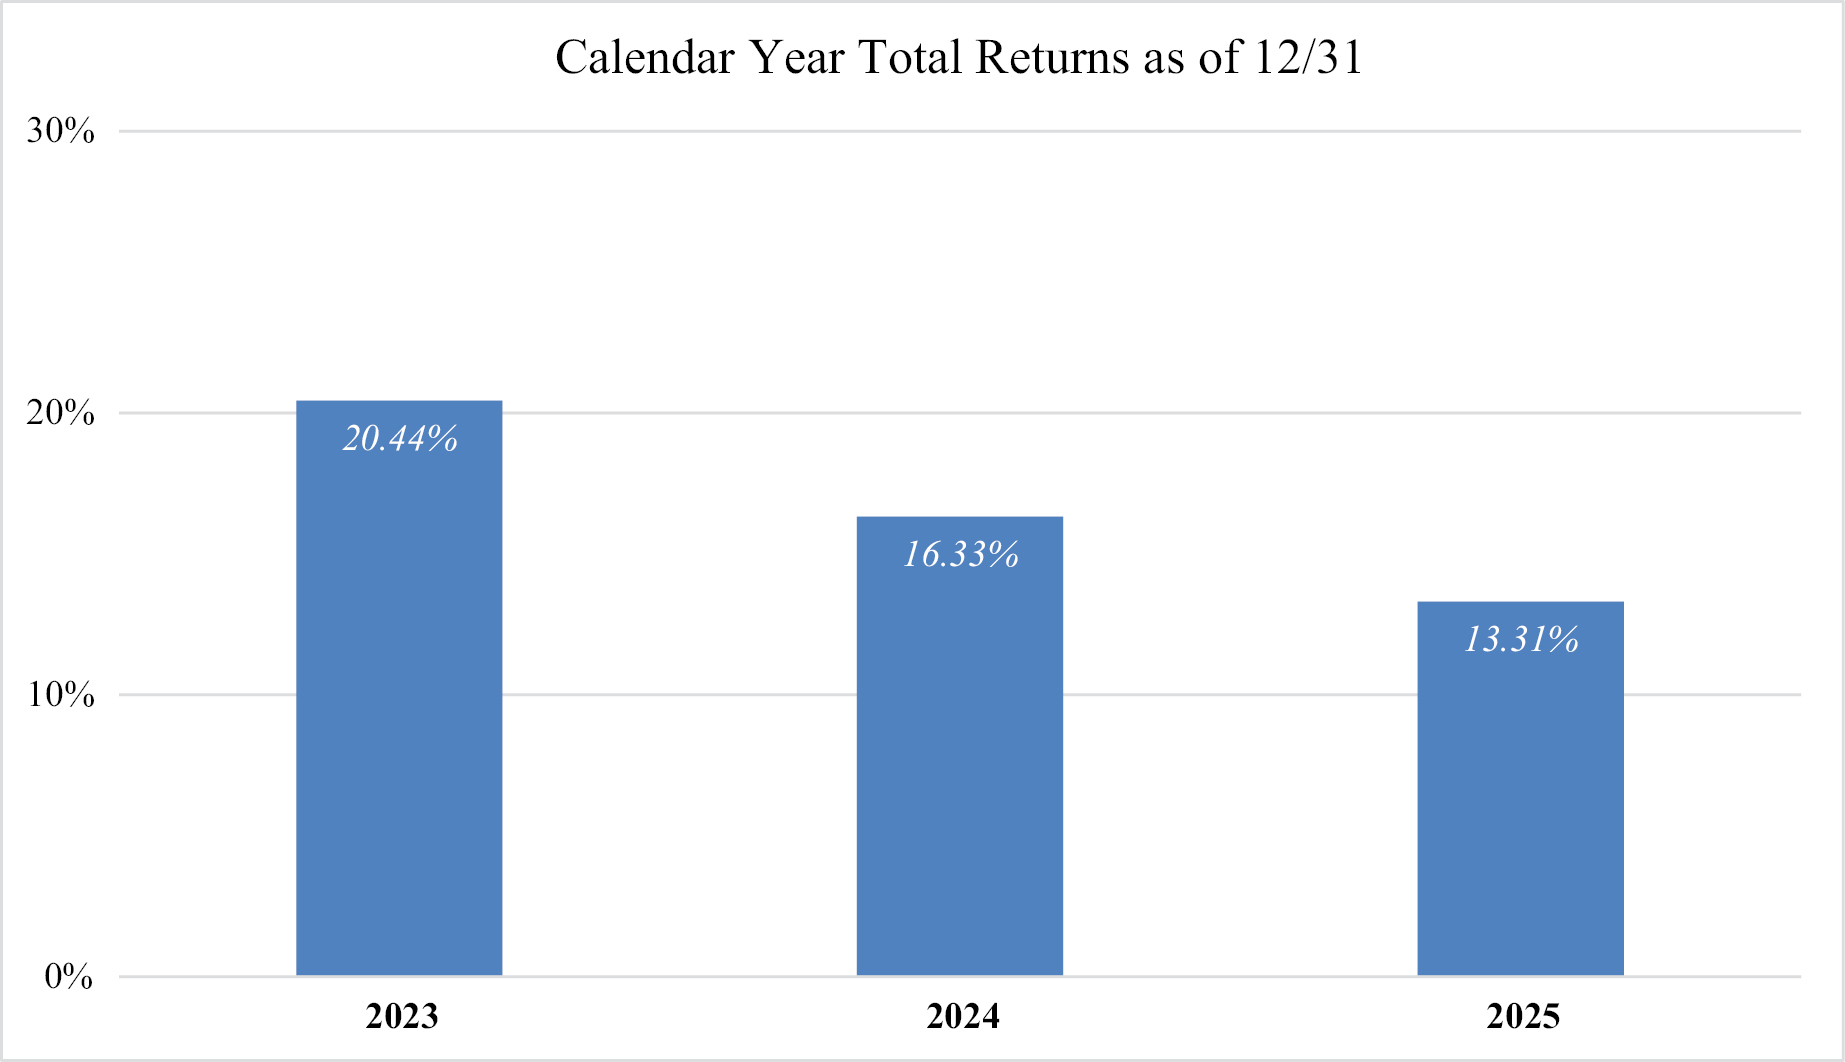
The Fund’s highest quarterly return was 9.03% (quarter ended December 31, 2023) and the Fund’s lowest quarterly return was (2.72)% (quarter ended March 31, 2025).
| Average Annual Total Return as of December 31, 2025 | ||
| Innovator Laddered Allocation Buffer ETF™ | 1 Year | Since |
| Return Before Taxes | 13.31% | 10.39% |
| Return After Taxes on Distributions | 13.31% | 10.39% |
| Return After Taxes on Distributions and Sale of Fund Shares | 7.88% | 8.17% |
| MerQube U.S. Large Cap Equity Buffer Laddered Index (reflects no deduction for fees, expenses or taxes) | 13.40% | 10.49% |
| S&P 500® Total Return Index (reflects no deduction for fees, expenses or taxes) | 17.88% | 12.92% |
The Fund’s past performance (before and after taxes) is not necessarily an indication of how the Fund will perform in the future.
Returns before taxes do not reflect the effects of any income or capital gains taxes. All after-tax returns are calculated using the historical highest individual federal marginal income tax rates and do not reflect the impact of any state or local tax. Returns after taxes on distributions reflect the taxed return on the payment of dividends and capital gains.
Your own actual after-tax returns will depend on your specific tax situation and may differ from what is shown here. After-tax returns are not relevant to Fund shareholders who hold Shares in tax-deferred accounts such as individual retirement accounts (IRAs) or employee-sponsored retirement plans.
The bar chart and table below illustrate the annual calendar year returns of the Fund based on NAV as well as the average annual Fund and Index returns. The bar chart and table provide an indication of the risks of investing in the Fund by showing changes in the Fund’s performance from year-to-year and by showing how the Fund’s average annual total returns based on NAV compared to those of the Index and a broad-based market index. On or about February 9, 2022, the Fund changed its name from “Innovator Laddered Fund of U.S. Equity Power Buffer ETFs™” to “Innovator Laddered Allocation Power Buffer ETF™”. The Fund was reorganized on or about October 14, 2021 from Innovator Laddered Fund of U.S. Equity Power Buffer ETFs™ (the “Predecessor Fund”), a series of Innovator ETFs Trust II, into Innovator ETFs Trust, a Delaware statutory trust. The Fund is a continuation of the Predecessor Fund and therefore adopts the performance information of the Predecessor Fund (as shown below). On or about August 25, 2021,
the Predecessor Fund changed its name from “Innovator Laddered Fund of S&P 500 Power Buffer ETFs™” to “Innovator Laddered Fund of U.S. Equity Power Buffer ETFs™”. On August 11, 2020, the Predecessor Fund ceased tracking the Lunt Capital US Large Cap Equity Rotation Index, a U.S. large cap equity index, and began pursuing its investment strategy of investing in the ETFs that comprise the Index. Therefore, the Fund’s performance and historical returns shown below are not necessarily indicative of the performance that the Fund, based on the current strategy, would have generated. The Fund’s performance information is accessible on the Fund’s website at www.innovatoretfs.com.
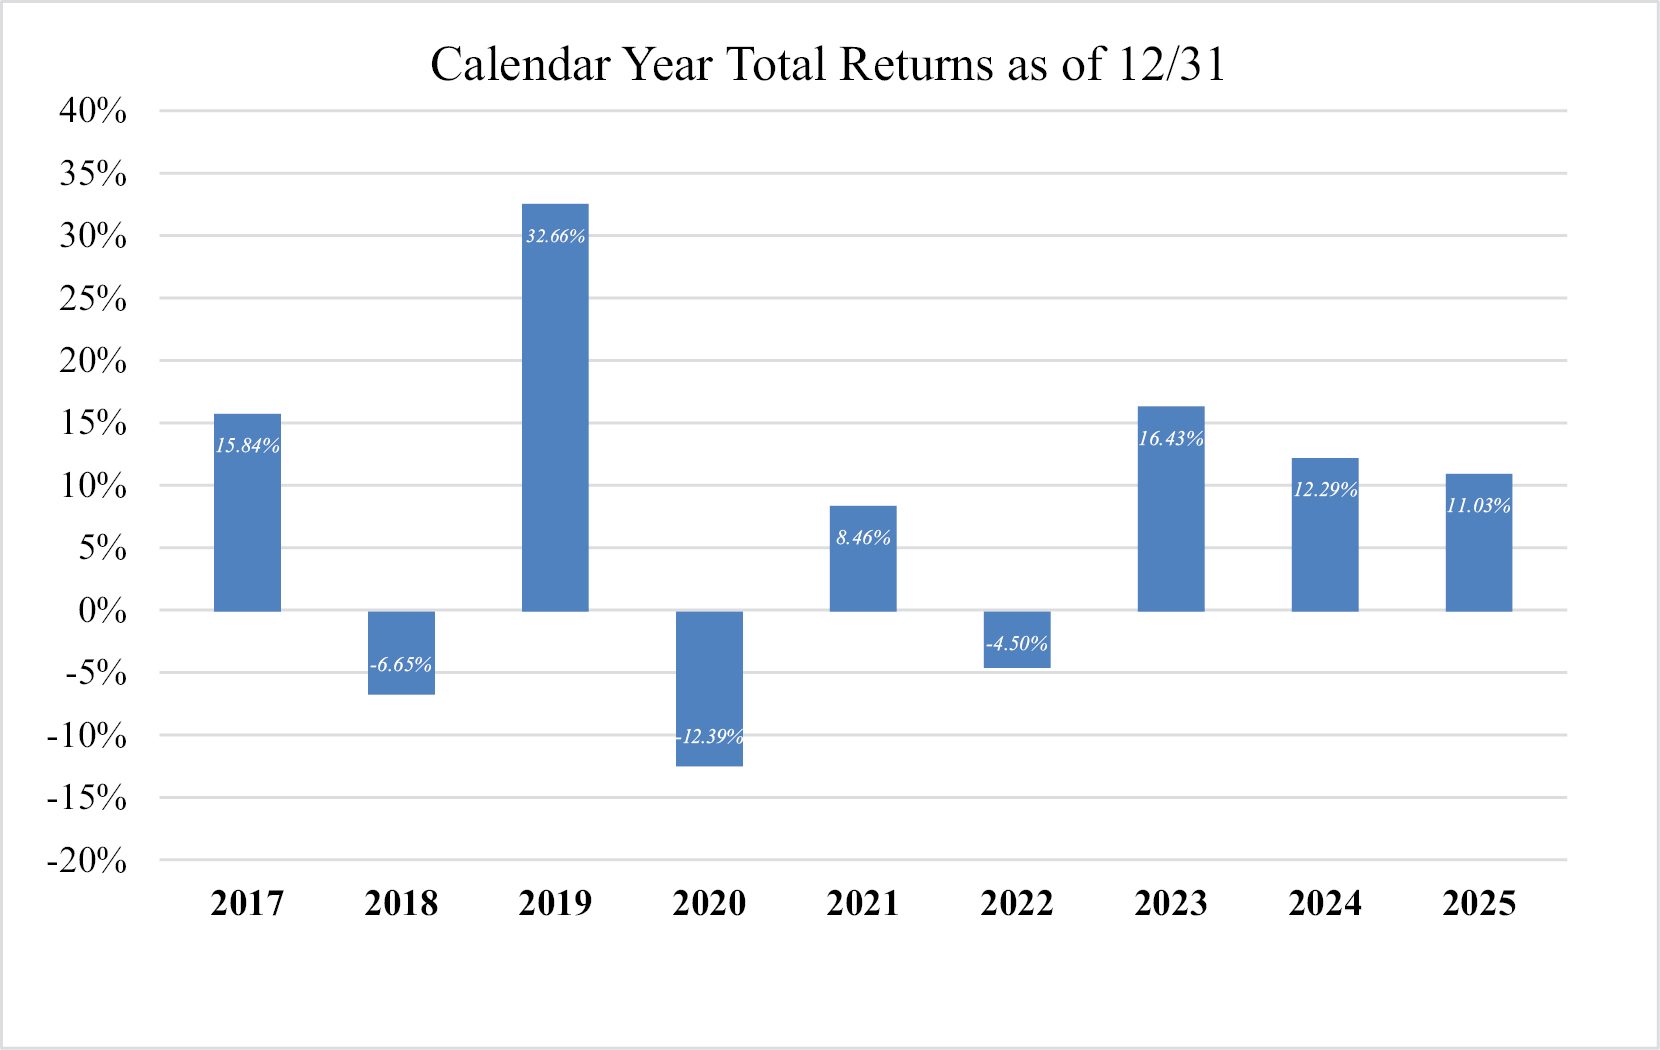
The Fund’s highest quarterly return was 24.24% (quarter ended June 30, 2020) and the Fund’s lowest quarterly return was (34.91)% (quarter ended March 31, 2020).
| Average Annual Total Return as of December 31, 2025 | |||
| Innovator Laddered Allocation Power Buffer ETF™ | 1 Year | 5 Years | Since |
| Return Before Taxes | 11.03% | 8.50% | 8.50% |
| Return After Taxes on Distributions | 11.03% | 8.50% | 8.27% |
| Return After Taxes on Distributions and Sale of Fund Shares | 6.53% | 6.71% | 6.83% |
| FTSE Laddered Power Buffer Strategy Price Return Index(1)(2) (reflects no deduction for fees, expenses or taxes) | 11.11% | 8.58% | |
| S&P 500® Total Return Index (reflects no deduction for fees, expenses or taxes) | 17.88% | 14.42% | 15.39% |
(1) On August 11, 2020, the Fund’s underlying index changed from the Lunt Capital U.S. Large Cap Equity Rotation Index to the Refinitiv Laddered Power Buffer Strategy Index. Therefore, the Fund’s performance and historical returns shown for the periods prior to August 11, 2020 are not indicative of the performance that the Fund, based on its current index, would have generated.
(2) On November 18, 2023, the name of the Index changed from Refinitiv Laddered Power Buffer Strategy Index to FTSE Laddered Power Buffer Strategy Price Return Index.
The Fund’s past performance (before and after taxes) is not necessarily an indication of how the Fund will perform in the future.
Returns before taxes do not reflect the effects of any income or capital gains taxes. All after-tax returns are calculated using the historical highest individual federal marginal income tax rates and do not reflect the impact of any state or local tax. Returns after taxes on distributions reflect the taxed return on the payment of dividends and capital gains.
Your own actual after-tax returns will depend on your specific tax situation and may differ from what is shown here. After-tax returns are not relevant to Fund shareholders who hold Shares in tax-deferred accounts such as individual retirement accounts (IRAs) or employee-sponsored retirement plans.
The bar chart and table below illustrate the annual calendar year returns of the Fund based on NAV as well as the average annual Fund and Index returns. The bar chart and table provide an indication of the risks of investing in the Fund by showing changes in the Fund’s performance from year-to-year and by showing how the Fund’s average annual total returns based on NAV compared to those of the Index, a market index and a broad-based market index. The Fund was reorganized on or about October 14, 2021, from Innovator S&P Investment Grade Preferred ETF (the “Predecessor Fund”), a series of Innovator ETFs Trust II, into Innovator ETFs Trust, a
Delaware statutory trust. The Fund is a continuation of the Predecessor Fund and therefore adopts the performance information of the Predecessor Fund (as shown below). The Fund’s performance information is accessible on the Fund’s website at www.innovatoretfs.com.
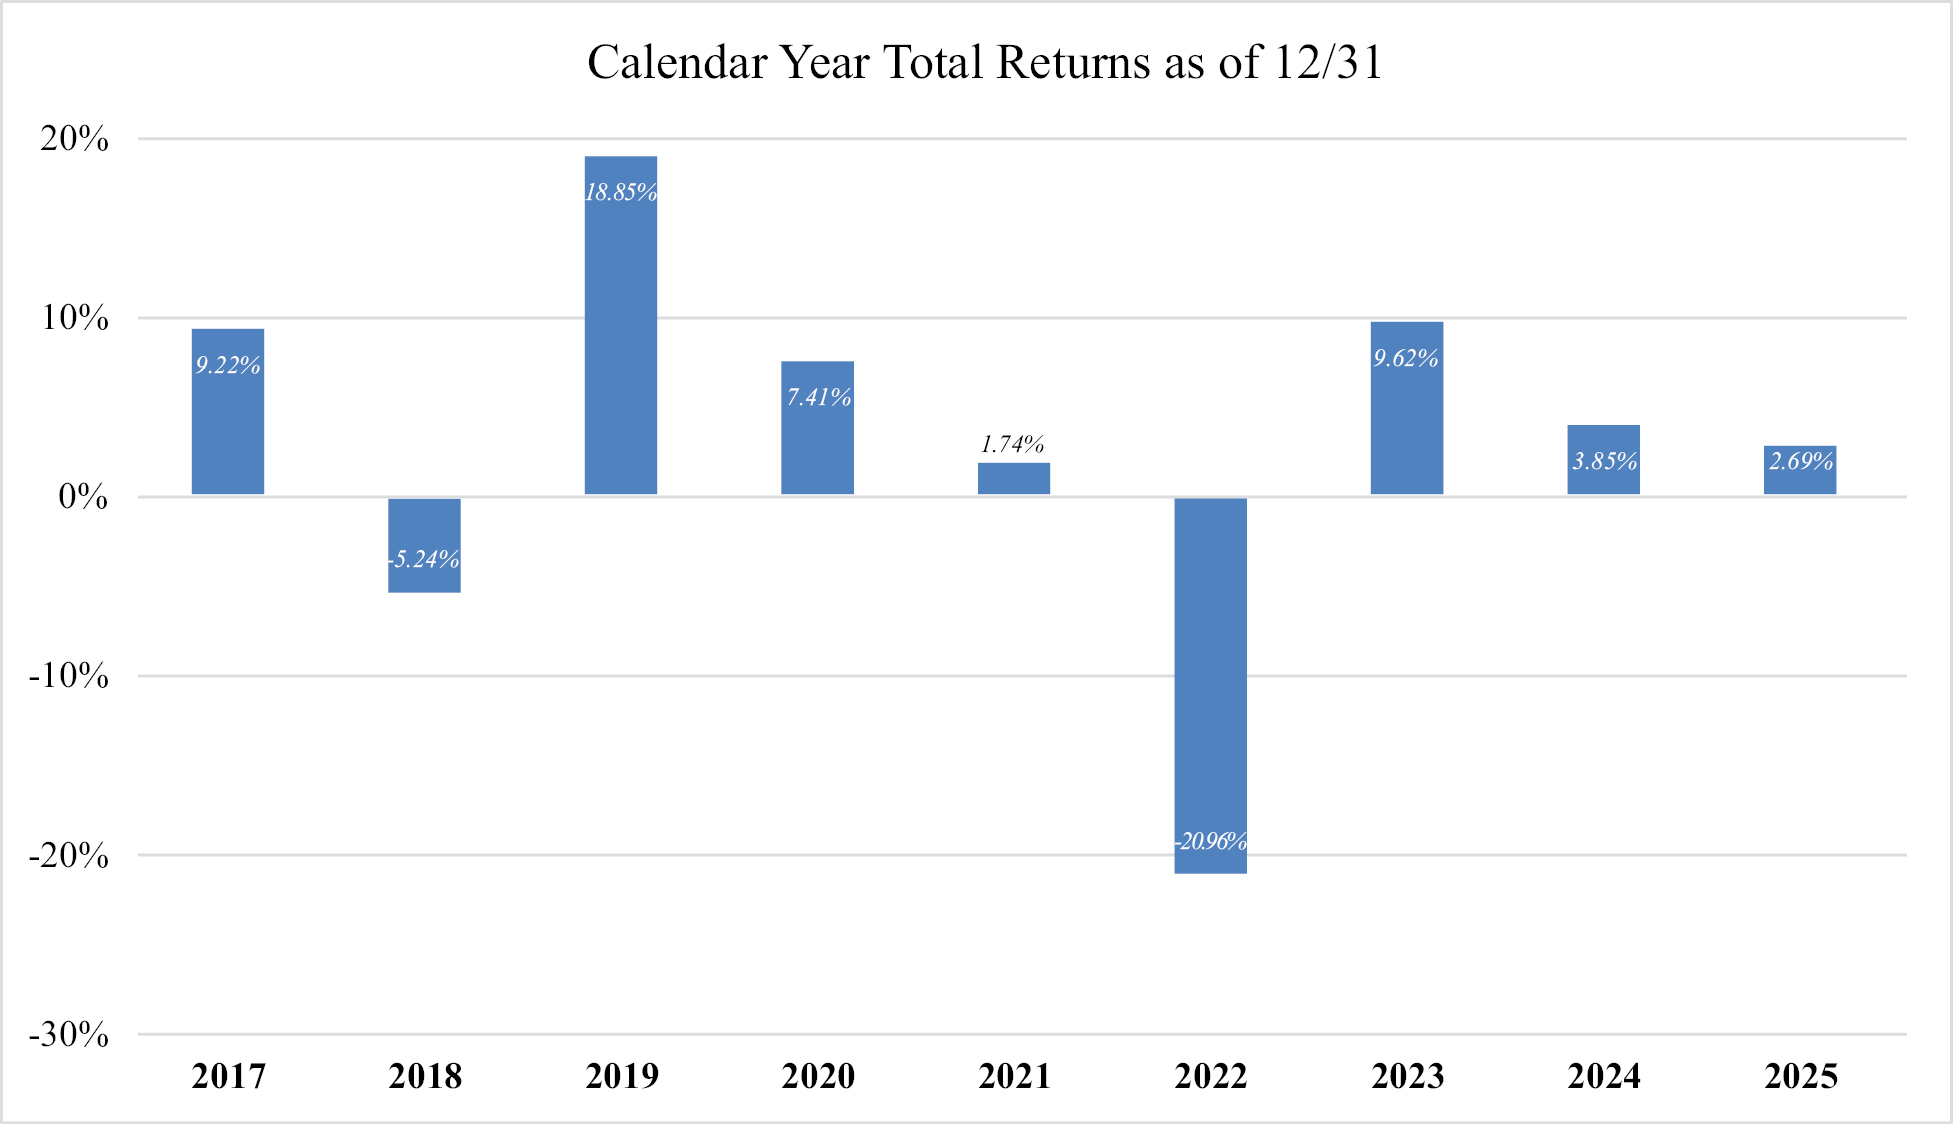
The Fund’s highest quarterly return was 9.53% (quarter ended March 31, 2019) and the Fund’s lowest quarterly return was (8.94)% (quarter ended March 31, 2020).
| Average Annual Total Return as of December 31, 2025 | |||
| Innovator S&P Investment Grade Preferred ETF | 1 Year | 5 Years | Since |
| Return Before Taxes | 2.69% | (1.23)% | 1.75% |
| Return After Taxes on Distributions | 0.97% | (2.83)% | 0.16% |
| Return After Taxes on Distributions and Sale of Fund Shares | 2.30% | (1.30)% | 1.00% |
| S&P 500® Total Return Index (reflects no deduction for fees, expenses or taxes) | 17.88% | 14.42% | 15.34% |
| S&P U.S. Aggregate Bond Index (reflects no deduction for fees, expenses or taxes) | 7.07% | 0.00% | 1.86% |
| S&P U.S. High Quality Preferred Stock Index (reflects no deduction for fees, expenses or taxes) | (0.80)% | (1.67)% | 1.78% |
| S&P U.S. Preferred Stock Index (reflects no deduction for fees, expenses or taxes) | 5.01% | 2.12% | 3.98% |
The Fund’s past performance (before and after taxes) is not necessarily an indication of how the Fund will perform in the future.
Returns before taxes do not reflect the effects of any income or capital gains taxes. All after-tax returns are calculated using the historical highest individual federal marginal income tax rates and do not reflect the impact of any state or local tax. Returns after taxes on distributions reflect the taxed return on the payment of dividends and capital gains.
Your own actual after-tax returns will depend on your specific tax situation and may differ from what is shown here. After-tax returns are not relevant to investors who hold Shares in tax-deferred accounts such as individual retirement accounts (IRAs) or employee-sponsored retirement plans.