The bar chart and performance table below show the variability of the Fund’s returns, which is some indication of the risks of investing in the Fund. The bar chart shows performance of the Fund’s Class Y shares for each calendar year since the Fund’s inception. Class I and Class N shares, which are not presented in the bar chart, would have similar annual returns to Class Y shares because the Classes are invested in the same portfolio of securities and would differ only to the extent that the Classes do not have the same expenses. The performance table includes a comparison of the performance of the Fund over time to the performance of a broad-based market index, as well as a performance index which the Adviser believes better represents the Fund’s investment strategy. You should be aware the Fund’s past performance (before and after taxes) may not be an indication of how the Fund will perform in the future. Updated performance information is available at no cost by visiting https://www.redwoodmutualfunds.com/ or by calling 1-855-RED-FUND (733-3863).
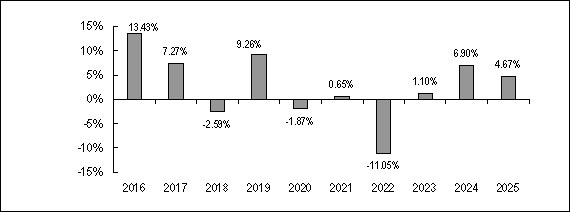
| Highest Quarter: | 6/30/2016 | 5.20% |
| Lowest Quarter: | 6/30/2022 | -6.89% |
| Class Y Shares | One Year | Five Years | Ten Years | Since Inception(1) |
| Class Y Return before taxes | 4.67% | 0.25% | 2.55% | 1.86% |
| Class Y Return after taxes on Distributions | 2.64% | -1.66% | 0.66% | 0.16% |
| Class Y Return after taxes on Distributions and Sale of Fund Shares | 2.73% | -0.63% | 1.15% | 0.69% |
| Class I Return before taxes | 4.76% | 0.15% | 2.47% | 1.75% |
| Class N Return before taxes | 4.38% | -0.10% | 2.21% | 1.50% |
| ICE
BofA US Treasuries 3-5 Yr Index(2) (reflects no deductions for fees, expenses or taxes) |
6.74% | 0.61% | 1.79% | 1.77% |
| Bloomberg
U.S. Aggregate Bond Index(3) (reflects no deductions for fees, expenses or taxes) |
4.23% | -0.36% | 2.01% | 2.19% |
| (1) | The inception date of the Fund is December 19, 2013. |
| (2) | The ICE BofA US Treasuries 3-5 Yr Index is an unmanaged index which includes U.S. Treasury securities with maturities of 3 to 4.99 years. The index is produced by Bank of America Merrill Lynch, Pierce, Fenner & Smith, Inc. Investors cannot invest directly in an index or benchmark. Index returns are gross of any fees, brokerage commissions or other expenses of investing. |
| (3) | The Fund’s regulatory broad-based benchmark is the Bloomberg U.S. Aggregate Bond Index. The Bloomberg U.S. Aggregate Bond Index is a broad-based benchmark that measures the investment grade, U.S. dollar denominated, fixed-rate taxable bond market. This includes, treasuries, government-related and corporate securities, mortgage-backed securities, asset-backed securities and collateralized mortgage-backed securities. Investors cannot invest directly in an index or benchmark. Index returns are gross of any fees, brokerage commissions, or other expenses of investing. |
After-tax returns are shown for Class Y shares only, and after-tax returns for other classes will vary. After-tax returns were calculated using the historical highest individual federal marginal income tax rates and do not reflect the impact of state and local taxes. Actual after-tax returns depend on an investor’s tax situation and may differ from those shown, and after-tax returns shown are not relevant to investors who hold shares of the Fund through tax-deferred arrangements, such as 401(k) plans or individual retirement accounts.
The bar chart and performance table below show the variability of the Fund’s returns, which is some indication of the risks of investing in the Fund. The bar chart shows performance of the Fund’s Class I shares for each calendar year since the Fund’s inception. The performance table includes a comparison of the performance of the Fund over time to the performance of a broad-based market index. You should be aware the Fund’s past performance (before and after taxes) may not be an indication of how the Fund will perform in the future. Updated performance information is available at no cost by visiting https://www.redwoodmutualfunds.com/ or by calling 1-855-RED-FUND (733-3863).
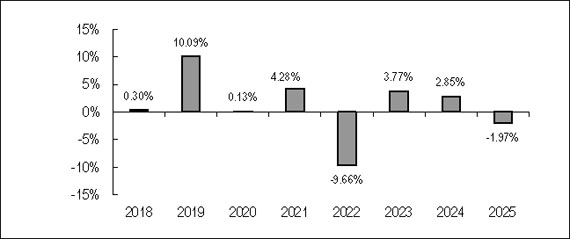
| Highest Quarter: | 12/31/2023 | 5.80% |
| Lowest Quarter: | 6/30/2022 | -5.78% |
| Class I Shares | One Year | Five Years | Since Inception(1) |
| Class I Return before taxes | -1.97% | -0.29% | 1.72% |
| Class I Return after taxes on Distributions | -3.11% | -1.30% | 0.66% |
| Class I Return after taxes on Distributions and Sale of Fund Shares | -1.17% | -0.44% | 0.99% |
| Bloomberg
U.S. Municipal Bond Index(2) (reflects no deduction for fees, expenses, or taxes) |
4.25% | 0.80% | 2.58% |
| (1) | The inception date of the Fund is March 9, 2017. |
| (2) | The Bloomberg U.S. Municipal Bond Index measures the performance of the Bloomberg U.S. Municipal bond market, which covers the U.S. dollar denominated long-term tax-exempt bond market. The index has four main sectors: state and local general obligation bonds, revenue bonds insured bonds, and pre-refunded bonds. Investors cannot invest directly in an index or benchmark. Index returns are gross of any fees, brokerage commissions or other expenses of investing. |
After-tax returns are shown for Class I shares only, and after-tax returns for other classes will vary. After-tax returns were calculated using the historical highest individual federal marginal income tax rates and do not reflect the impact of state and local taxes. Actual after-tax returns depend on an investor’s tax situation and may differ from those shown, and after-tax returns shown are not relevant to investors who hold shares of the Fund through tax-deferred arrangements, such as 401(k) plans or individual retirement accounts.
The bar chart and performance table below show the variability of the Fund’s returns, which is some indication of the risks of investing in the Fund. The bar chart shows performance of the Fund’s Class I shares for each calendar year since the Fund’s inception. The performance table includes a comparison of the performance of the Fund over time to the performance of a broad-based market index. You should be aware the Fund’s past performance (before and after taxes) may not be an indication of how the Fund will perform in the future. Updated performance information is available at no cost by visiting https://www.redwoodmutualfunds.com/ or by calling 1-855-RED-FUND (733-3863).
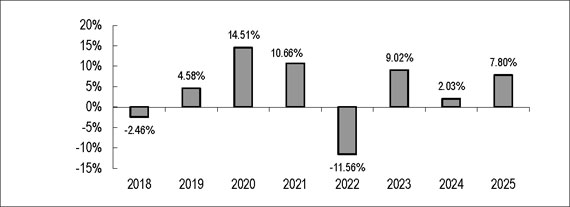
| Highest Quarter: | 12/31/2020 | 15.60% |
| Lowest Quarter: | 06/20/2022 | -10.42% |
| Class I Shares | One Year | Five Years | Since Inception(1) |
| Class I Return before taxes | 7.80% | 3.25% | 4.11% |
| Class I Return after taxes on Distributions | 4.70% | 0.42% | 1.91% |
| Class I Return after taxes on Distributions and Sale of Fund Shares | 5.06% | 1.41% | 2.32% |
| Redwood
AlphaFactor® Tactical International Index(2) (reflects no deduction for fees, expenses or taxes) |
14.00% | 6.65% | 7.76% |
| MSCI
AC World Index ex-USA(3) (reflects no deduction for fees, expenses or taxes) |
32.28% | 7.91% | 6.94% |
| (1) | The inception date of the Fund is November 2, 2017. |
| (2) | The Redwood AlphaFactor® Tactical International Index, the Fund Adviser’s proprietary index, utilizes a quantitative, factor-based, investment methodology focused on large and middle capitalization stocks of both developed and emerging markets outside of the U.S. typically of companies with market capitalizations of greater than $2 billion. Investors cannot invest directly in an index or benchmark. Index returns are gross of any fees, brokerage commissions or other expenses of investing. |
| (3) | The Morgan Stanley Capital International All Country World Index ex-USA. (MSCI ACWI ex-USA.) is a market-capitalization-weighted index maintained by Morgan Stanley Capital International (MSCI). It is designed to provide a broad measure of stock performance throughout the world, with the exception of U.S.-based companies. The MSCI All Country World Index ex-U.S.A. includes both developed and emerging markets. Investors cannot invest directly in an index or benchmark. Index returns are gross of any fees, brokerage commissions or other expenses of investing. |
After-tax returns are shown for Class I shares only, and after-tax returns for other classes will vary. After-tax returns were calculated using the historical highest individual federal marginal income tax rates and do not reflect the impact of state and local taxes. Actual after-tax returns depend on an investor’s tax situation and may differ from those shown, and after-tax returns shown are not relevant to investors who hold shares of the Fund through tax-deferred arrangements, such as 401(k) plans or individual retirement accounts.
The bar chart and performance table below show the variability of the Fund’s returns, which is some indication of the risks of investing in the Fund. The bar chart shows performance of the Fund’s Class I shares for each calendar year since the Fund’s inception. The performance table includes a comparison of the performance of the Fund over time to the performance of two broad-based market indices. The performance table also includes a comparison of the Fund’s performance to a composite index and to another index reflecting the Fund’s investment strategy category. You should be aware the Fund’s past performance (before and after taxes) may not be an indication of how the Fund will perform in the future. Updated performance information is available at no cost by visiting https://www.redwoodmutualfunds.com/ or by calling 1-855-RED-FUND (733-3863).
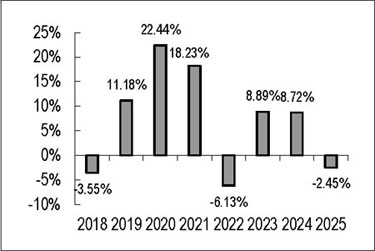
| Highest Quarter: | 12/31/2020 | 16.76% |
| Lowest Quarter: | 03/31/2022 | -9.55% |
| Class I Shares | One Year | Five Years | Since Inception(1) |
| Class I Return before taxes | -2.45% | 5.09% | 6.73% |
| Class I Return after taxes on Distributions | -3.51% | 2.72 | 4.62% |
| Class I Return after taxes on Distributions and Sale of Fund Shares | -0.79% | 3.19% | 4.56% |
| Class N Return before taxes | -2.45% | 5.09% | 6.73% |
| MS Category Avg. Tactical Allocation Index(2) | 11.79% | 5.33% | 5.30% |
| Composite Index(3) | 12.15% | 4.38% | 6.24% |
| S&P 500 Total Return Index(4) | 17.88% | 14.42% | 14.58% |
| Bloomberg Global Aggregate Bond Index(5) | 7.30% | -0.36% | 1.73% |
| S&P 500 Equal Weight Index(6) | 11.43% | 10.48% | 10.91% |
| (1) | The inception date of the Fund is November 2, 2017. |
| (2) | The MS Category Avg. Tactical Allocation Index is the average of all funds categorized as Tactical Allocation by Morningstar. Tactical asset allocation strategy is the process by which the asset of a fund is changed on a short-term basis to take advantage of perceived differences in relative values of the various asset classes. Investors cannot invest directly in an index or benchmark. Index returns are gross of any fees, brokerage commissions or other expenses of investing. |
| (3) | The Composite Index represents a blend of 40% S&P 500 Total Return Index and 60% Bloomberg Global Aggregate Bond Index. The Composite Index has comparable return characteristics as the Fund and shows how the Fund’s performance directly compares to a blend of the returns of broad-based indices widely recognized in the industry. Investors cannot invest directly in an index or benchmark. Index returns are gross of any fees, brokerage commissions or other expenses of investing. |
| (4) | S&P 500 Total Return Index is a capitalization-weighted index of 500 stocks. The index is designed to measure performance of the broad domestic economy through changes in the aggregate market value of 500 stocks representing all major industries. Investors cannot invest directly in an index or benchmark. Index returns are gross of any fees, brokerage commissions or other expenses of investing. |
| (5) | The Bloomberg Global Aggregate Bond Index is a measure of global investment grade debt from twenty-four local currency markets. This multi-currency benchmark includes treasury, government-related, corporate, and securitized fixed-rate bonds from both developed and emerging markets issuers. Investors cannot invest directly in an index or benchmark. Index returns are gross of any fees, brokerage commissions or other expenses of investing. |
| (6) | In response to regulatory requirements, the Fund’s regulatory broad-based index was changed to the S&P 500 Equal Weight Index. The S&P 500 Equal Weight Index is the equal-weight version of the S&P 500. This index includes the same constituents as the capitalization weighted S&P 500, but each company in the S&P 500 Equal Weight Index is allocated a fixed weight – or 0.2% of the index total at each quarterly rebalance. Investors may not invest directly in an index. Index returns are gross of any fees, brokerage commissions or other expenses of investing. |
After-tax returns are shown for Class I shares only, and after-tax returns for other classes will vary. After-tax returns were calculated using the historical highest individual federal marginal income tax rates and do not reflect the impact of state and local taxes. Actual after-tax returns depend on an investor’s tax situation and may differ from those shown, and after-tax returns shown are not relevant to investors who hold shares of the Fund through tax-deferred arrangements, such as 401(k) plans or individual retirement accounts.