The bar chart and performance table below show the variability of the Fund’s returns, which is some indication of the risks of investing in the Fund. The Fund has adopted the accounting history and performance of the predecessor mutual fund, the Conductor Global Equity Value Fund (the “Predecessor Fund”) as the result of a reorganization of the Predecessor Fund into the Fund which was effective as of August 1, 2022 (the “Reorganization”). Prior to the Reorganization, the Fund had not yet commenced operations. The performance information shown in the bar chart below for the periods prior to August 1, 2022, is for the Predecessor Fund’s Class Y shares. In connection with the Reorganization, the other share classes of the Predecessor Fund were converted into Class Y shares prior to the effective date of the Reorganization. The performance information and figures shown below for periods prior to April 19, 2016, reflect the performance of the Class I shares, the oldest class of the Predecessor Fund which commenced operations on December 27, 2013. The performance figures for periods from December 27, 2013 to April 19, 2016, have not been adjusted to reflect the Fund’s current fees and expenses of Class Y shares of the Fund. If these returns had been adjusted, the performance information for the period would be higher than the returns shown based on differences in the classes’ fee and expense structures. The Performance reflects fee waivers or expense limitations, if any, that were in effect during the periods presented. Returns in the bar chart and table for the Predecessor Fund have not been adjusted to reflect the Fund’s current fees and expenses. The annual returns bar chart demonstrates the risks of investing in the Fund by showing how the Fund and Predecessor Fund’s performance has varied from year to year. The performance table includes a comparison of the performance of the Fund and the Predecessor Fund over time to the performance of the MSCI All Country World Small/Mid (ACWI SMID) Value Index, which the Adviser believes better represents the Fund’s investment strategy. The performance table also compares the performance of the Fund and the Predecessor Fund over time to the performance of the MSCI All Country World Index, which serves as the Fund’s regulatory index and provides a broad measure of market performance. The Fund does not seek to track the regulatory index. You should be aware that the Predecessor Fund’s past performance (before and after taxes) may not be an indication of how the Fund, an exchange-traded fund, will perform in the future. Updated performance information is available at no cost by visiting conductoretfs.com or by calling 1-615-200-0057.
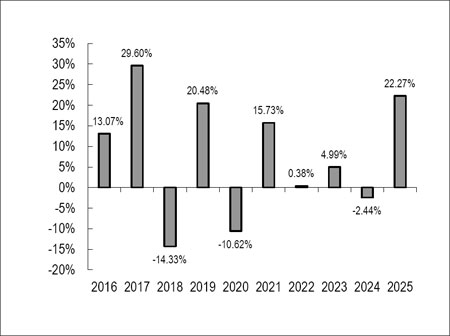
| Highest Quarter: | 12/31/2019 | 13.02% |
| Lowest Quarter: | 03/31/2020 | -29.46% |
| Conductor Global Equity Value ETF | One Year |
Five Years |
Ten
Years |
Since Inception(1) |
| Return before taxes | 22.27% | 7.79% | 7.00% | 5.81% |
| Return after taxes on Distributions | 20.62% | 7.02% | 6.25% | 5.19% |
| Return after taxes on Distributions and Sale of Fund Shares | 13.79% | 6.02% | 5.51% | 4.58% |
| MSCI
ACWI SMID Value Index(2) (reflects no deduction for fees, expenses or taxes) |
18.79% | 9.01% | 8.43% | 6.89% |
| MSCI
All Country World Index(3) (reflects no deduction for fees, expenses or taxes) |
22.34% | 11.19% | 11.72% | 9.86% |
| (1) | The Predecessor Fund’s Class I shares commenced operations on December 27, 2013. The Predecessor Fund’s Class Y shares commenced operations on April 19, 2016. Date used to calculate performance since inception for the Fund and the indices is the commencement date of the Predecessor Fund’s Class I shares. |
| (2) | The MSCI ACWI SMID Value Index captures mid and small cap representation across 23 Developed Markets and 24 Emerging Markets countries. With 7,156 constituents, the index covers approximately 28% of the free float-adjusted market capitalization in each country. Investors cannot invest directly in an index or benchmark. Index returns are gross of any fees, brokerage commissions or other expense of investing. |
| (3) | The MSCI All Country World (MSCI ACWI) Index captures large and mid-cap securities exhibiting overall value style characteristics across 23 Developed Markets countries and 24 Emerging Markets countries. Investors cannot invest directly in an index or benchmark. Index returns are gross of any fees, brokerage commissions or other expense of investing. |
After-tax returns presented in the table for the Predecessor Fund were calculated using the historical highest individual federal marginal income tax rates and do not reflect the impact of state and local taxes. Actual after-tax returns depend on an investor’s tax situation and may differ from those shown, and after-tax returns shown are not relevant to investors who hold shares of the Predecessor Fund through tax-deferred arrangements, such as 401(k) plans or individual retirement accounts.