The Fund’s goal is to seek long-term capital appreciation.
This table describes the fees and expenses that you may pay if you buy, hold and sell shares of the Fund. You may pay other fees, such as brokerage commissions and other fees to financial intermediaries, which are not reflected in the table or example below.
| Management Fees | 0.85 | % |
| Other Expenses | 0.29 | % |
| Acquired Fund Fees and Expenses | 0.02 | % |
| Total Annual Fund Operating Expenses(1) | 1.16 | % |
| Less Fee Waiver(2) | (0.04 | )% |
| Total Annual Fund Operating Expenses After Fee Waiver(2) | 1.12 | % |
| (1) | Total Annual Fund Operating Expenses will not agree with the ratio of expenses to average net assets before expense waiver in the Fund’s Financial Highlights, as the Financial Highlights reflect actual direct operating expenses of the Fund and do not include Acquired Fund Fees and Expenses. |
| (2) | The Adviser has contractually committed through October 31, 2028 to waive its advisory fees to the extent necessary to maintain the net operating expense ratio of the Fund, excluding Fund transaction costs, investment interest expense, dividend expenses associated with securities sold short and Acquired Fund Fees and Expenses (if any), at 1.10%. This commitment may not be changed or terminated at any time before October 31, 2028 without the approval of the Board of Directors. |
This Example is intended to help you compare the cost of investing in the Fund with the cost of investing in other mutual funds. The Example assumes that you invest $10,000 in the Fund for the time periods indicated below and then redeem all of your shares at the end of these periods. The Example also assumes that your investment has a 5% return each year and that the Fund’s operating expenses remain the same (taking into account the contractual fee waiver for the current duration of the arrangement only). Although your actual costs may be higher or lower, based on these assumptions your costs would be:
| 1 Year | 3 Years | 5 Years | 10 Years |
| $114 | $365 | $634 | $1,405 |
The Fund pays transaction costs, such as commissions, when it buys and sells securities (or “turns over” its portfolio). A higher portfolio turnover rate may indicate higher transactions costs and may result in higher taxes when Fund shares are held in a taxable account. These costs, which are not reflected in Annual Fund Operating Expenses or in the Example, affect the Fund’s performance. During the fiscal year ended October 31, 2025, the Fund’s portfolio turnover rate was 61% of the average value of its portfolio.
The Fund invests in a broad, diversified portfolio of securities of small and medium capitalization companies traded on a principal U.S. exchange or U.S. over-the-counter market, and securities of small and medium capitalization non-U.S. companies in foreign countries, including emerging market countries. Under normal circumstances, the Fund invests at least 80% of its net assets, including borrowings for investment purposes, in securities of small and medium capitalization companies. The Adviser currently defines small and medium capitalization companies as companies having, at the time of initial investment, a market capitalization not greater than the smallest 40% by market capitalization of the companies that comprise the MSCI ACWI Investable Market Index (IMI). The Fund may continue to hold securities whose market capitalizations exceed the foregoing threshold subsequent to the Fund’s investment in such securities. As of December 31, 2025, the largest market capitalization in this group was $70.4 billion. This capitalization range will change as the size of the companies in the index changes with market conditions and the composition of the index.
The Fund may employ a quantitative strategy. Under a quantitative strategy, the Fund may invest in U.S. and non-U.S. equity securities with a minimum market capitalization of $250 million.
The Fund invests primarily in securities listed on securities exchanges or actively traded in over-the-counter markets either within or outside the issuer’s domicile country. The securities may be listed or traded in the form of American Depositary Receipts (“ADRs”), European Depositary Receipts (“EDRs”) and Global Depositary Receipts (“GDRs”), or other types of depositary receipts (including non-voting depositary receipts) or dual listed securities. The Fund also may invest in government fixed income securities, exchange-traded funds (“ETFs”), real estate investment trusts (“REITs”) and REIT-like entities, corporate bonds, and a variety of derivatives, including futures, options, swaps and other derivative instruments, to seek to increase return, seek to hedge, or protect, its exposure to, for example, interest rate movements, movements in the commodities or securities markets and currency value fluctuations. Fixed income securities held by the Fund may be of any maturity or quality, including investment grade securities, below investment grade rated securities (sometimes referred to as “junk bonds”) and unrated securities determined by the Adviser or sub-advisers to be of comparable quality.
The Adviser has engaged sub-advisers to make the day-to-day investment decisions for portions of the Fund’s portfolio.
The bar chart and the performance table shown below provide some indication of the risks of investing in the Fund by showing changes in its performance from year to year and by comparing the Fund’s performance to the MSCI ACWI Investable Market Index
(Net) and the MSCI ACWI SMID Cap Index (Net). The MSCI ACWI Investable Market Index (Net) serves as the Fund’s regulatorily-required broad-based securities market index and provides a broad measure of market performance. The MSCI ACWI SMID Cap Index (Net) is the Fund’s additional index and is generally more representative of the Fund’s investment universe than the regulatory index. The Net performance figures of each index reflect no deductions for fees, expenses or income taxes, except foreign withholding taxes. For additional information about the indexes, please see the section entitled “Index Descriptions.”
Past performance (before and after taxes) does not necessarily predict future performance. Fund performance shown below reflects fees, waivers and/or expense reimbursements during such period and reinvestment of distributions, if any. Without waivers/reimbursements, performance would have been lower.
Prior to December 30, 2016, the Fund was named the Old Westbury Small & Mid Cap Fund and operated under a different investment strategy. The performance information shown below before such date represents the Fund’s prior investment strategies.
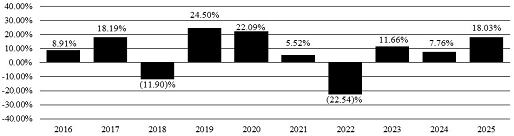
During the periods shown in the bar chart, the highest return for a quarter was 23.72% (quarter ended 6/30/2020) and the lowest return for a quarter was (24.78)% (quarter ended 3/31/2020).
| Average Annual Total Returns (for the periods ended 12/31/2025) | 1 Year | 5 Years | 10 Years | |||
| Fund Return Before Taxes | 18.03% | 3.03% | 7.18% | |||
| Fund Return After Taxes on Distributions | 15.82% | 2.01% | 5.84% | |||
| Fund Return After Taxes on Distributions and Sale of Shares | 12.20% | 2.24% | 5.52% | |||
| MSCI ACWI Investable Market Index (Net) (reflects no deduction for fees, expenses or income taxes, except foreign withholding taxes)* | 22.06% | 10.75% | 11.45% | |||
| MSCI ACWI SMID Cap Index (Net) (reflects no deduction for fees, expenses or income taxes, except foreign withholding taxes) | 19.29% | 7.28% | 9.19% |
| * | As a result of new regulatory requirements, the Fund’s regulatory or primary index previously changed from the MSCI ACWI SMID Cap Index (Net) to the MSCI ACWI Investable Market Index (Net). |
After-tax returns are calculated using the historical highest individual federal marginal income tax rate, and do not reflect the impact of state and local taxes. Actual after-tax returns depend on the investor’s tax situation and may differ from those shown. After-tax returns shown are not relevant to shareholders who hold Fund shares through tax-deferred arrangements such as 401(k) plans or Individual Retirement Accounts. The Fund Return After Taxes on Distributions and Sale of Shares may be higher than other return figures when a capital loss occurs upon the redemption of Fund shares.