The Fund’s primary investment objective is income.
This table describes the fees and expenses that you may pay if you buy, hold and sell shares of the Fund. You may pay other fees, such as brokerage commissions and other fees to financial intermediaries, which are not reflected in the table or example below.
| Management Fees | 0.58 | % | |
| Other Expenses | 0.28 | % | |
| Acquired Fund Fees and Expenses | 0.06 | % | |
| Total Annual Fund Operating Expenses(1) | 0.92 | % | |
| Less Fee Waiver(2) | (0.01 | )% | |
| Total Annual Fund Operating Expenses After Fee Waiver(2) | 0.91 | % | |
| (1) | Total Annual Fund Operating Expenses will not agree with the ratio of expenses to average net assets in the Fund’s Financial Highlights, as the Financial Highlights reflect actual direct operating expenses of the Fund and do not include Acquired Fund Fees and Expenses. |
| (2) | The Adviser has contractually committed through October 31, 2028 to waive its advisory fees to the extent necessary to maintain the net operating expense ratio of the Fund, excluding Fund transaction costs, investment interest expense, dividend expenses associated with securities sold short and Acquired Fund Fees and Expenses (if any), at 0.85%. This commitment may not be changed or terminated at any time before October 31, 2028 without the approval of the Board of Directors. |
This Example is intended to help you compare the cost of investing in the Fund with the cost of investing in other mutual funds. The Example assumes that you invest $10,000 in the Fund for the time periods indicated below and then redeem all of your shares at the end of these periods. The Example also assumes that your investment has a 5% return each year and that the Fund’s operating expenses remain the same (taking into account the contractual fee waiver for the current duration of the arrangement only). Although your actual costs may be higher or lower, based on these assumptions your costs would be:
| 1 Year | 3 Years | 5 Years | 10 Years | |||
| $93 | $292 | $508 | $1,130 |
The Fund pays transaction costs, such as commissions, when it buys and sells securities (or “turns over” its portfolio). A higher portfolio turnover rate may indicate higher transactions costs and may result in higher taxes when Fund shares are held in a taxable account. These costs, which are not reflected in Annual Fund Operating Expenses or in the Example, affect the Fund’s performance. During the fiscal year ended October 31, 2025, the Fund’s portfolio turnover rate was 14% of the average value of its portfolio.
The Fund may invest in debt or debt linked instruments of any credit rating, and there are no limits on the Fund’s investments in high-yield (“junk”) bonds. The Fund defines credit instruments broadly to include any debt or debt linked instrument, including corporate and sovereign bonds, leveraged loans (or bank loans), municipal securities, preferred securities, convertible securities, and securitized instruments (including mortgage- and asset-backed securities). The Fund, under normal market circumstances invests at least 80% of its net assets (including any borrowing for investment purposes) in credit instruments and derivative instruments that are linked to, or provide investment exposure to, credit instruments, including short exposure. Additionally, the Adviser, as part of the Fund’s overall portfolio construction, may invest in various securities with an aim of managing risk and overall volatility similar to the ICE BofA 1-10 Year U.S. Corporate Index over a business cycle. There is no limit on the Fund’s investments in securities issued by foreign issuers, including issuers in emerging markets, although the Fund’s overall net exposure to non-U.S. currencies through direct holdings and derivatives is normally limited to 25% of its net assets. The Fund may invest up to 20% of its net assets in long and short positions in equity securities, including common stocks, warrants, and other equity securities in addition to derivatives that provide exposure to equity securities.
High yield instruments are rated below investment grade (BB and lower, or an equivalent rating), and tend to provide higher income relative to investment-grade debt instruments in an effort to compensate investors for their higher risk of default, which is the failure to make required interest or principal payments. High yield instruments in which the Fund may invest include bonds, leveraged loans, and securities in default. The Fund may invest in debt instruments of any maturity or duration, although the Fund expects to normally maintain an effective duration between 2 and 8 years. Duration is an estimate of a security’s (or portfolio of securities) sensitivity to changes in prevailing interest rates, with securities with a longer duration generally tending to be more sensitive to changes in prevailing interest rates.
The Adviser employs sub-advisers for some asset classes, or segments of specific asset classes, and allocates the Fund’s portfolio investments and assets on an opportunistic basis intended to achieve attractive relative returns among asset classes and investments. The Adviser’s investment process consists of fundamental research as well as the use of proprietary quantitative models that evaluate a universe of securities based on factors such as credit quality, maturity, valuation, revenues, earnings, capital discipline, financial leverage and volatility.
The Fund’s investment approach provides the Fund the flexibility to invest across a wide variety of global credit instruments without constraints to particular benchmarks, asset classes, or sectors. Through this flexibility, and the use of active risk management and hedging positions, the Fund attempts to benefit from the upsides of the fixed income credit markets while avoiding some of the downsides over a full market cycle.
When deciding whether to adjust allocations among the various sectors and asset classes (such as high yield corporate bonds, mortgage- and asset-backed securities, international bonds, sovereign bonds, municipal securities, and leveraged loans) or duration (which measures the Fund’s price sensitivity to interest rate changes), the Adviser may consider factors such as expected interest rate movements and currency valuations, the outlook for inflation and the economy, and the yield advantage and potential for increased returns that lower rated bonds may offer over investment-grade bonds.
The Fund may purchase or sell mortgage-backed securities on a delayed delivery or forward commitment basis through the “to-be-announced” (TBA) market. With TBA transactions, the particular securities to be delivered are not identified at the trade date but the delivered securities must meet specified terms and standards.
Bank loans represent amounts generally borrowed by banks and leveraged loans represent amounts generally borrowed by companies and other entities. These loans have floating interest rates that reset periodically (typically quarterly or monthly) and are often rated below investment grade (sometimes referred to as “junk bonds”). In many cases, the borrowing companies have significantly more debt than equity and the loans have been issued in connection with recapitalizations, acquisitions, leveraged buyouts, or refinancings. Leveraged loans may be acquired directly through an agent acting on behalf of the lenders participating in the loan, as an assignment from another lender who holds a direct interest in the loan, or as a participation interest in another lender’s portion of the loan.
While most assets are typically invested in bonds and other debt instruments, the Fund also may use credit default swaps (on both indexes and specific bonds or issuers), total return swaps (on both indexes and specific bonds or issuers), interest rate futures, interest rate swaps, forward currency exchange contracts, and options on such instruments. The Fund intends to buy or sell credit default and total return swaps in order to seek to generate returns, adjust the Fund’s overall credit quality, or protect the value of certain portfolio holdings, as well as to seek to profit from expected deterioration in the credit quality of an issuer or the widening of credit spreads. Total return swaps may also be used in order to seek to obtain a short position with respect to a particular instrument. Interest rate futures and interest rate swaps are primarily used to seek to manage the Fund’s exposure to interest rate changes and to seek to limit overall volatility by adjusting the portfolio’s duration and extending or shortening the overall maturity of the Fund. Forward currency exchange contracts may be used to seek to limit overall volatility by protecting the Fund’s non-U.S. dollar-denominated holdings from adverse currency movements relative to the U.S. dollar or to seek to generate returns by gaining long or short exposure to certain currencies expected to increase or decrease in value relative to other currencies. In addition, the Fund may take a short position in a currency, which means that the Fund could sell a currency in excess of its assets denominated in that currency (or the Fund might sell a currency even if it doesn’t own any assets denominated in the currency).
The bar chart and the performance table shown below provide some indication of the risks of investing in the Fund by showing changes in its performance from year to year and by comparing the Fund’s performance to the ICE BofA U.S. Broad Market Index and the ICE BofA 1-10 Year U.S. Corporate Index. The ICE BofA U.S. Broad Market Index serves as the Fund’s regulatorily-required broad-based securities market index and provides a broad measure of market performance. The ICE BofA 1-10 Year U.S. Corporate Index is the Fund’s additional index and is generally more representative of the Fund’s investment universe than the regulatory index. For additional information about the indexes, please see the section entitled “Index Descriptions.”
Past performance (before and after taxes) does not necessarily predict future performance. Fund performance shown below reflects fees, waivers and/or expense reimbursements during such period and reinvestment of distributions, if any. Without waivers/reimbursements, performance would have been lower.
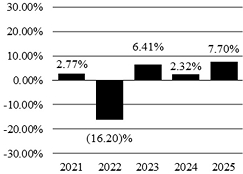
During the periods shown in the bar chart, the highest return for a quarter was 7.31% (quarter ended 12/31/2023) and the lowest return for a quarter was (7.36)% (quarter ended 6/30/2022).
| Average Annual Total Returns (for the periods ended 12/31/2025) | 1 Year | 5 Year | Since Commencement of Operations (10/1/2020) | |||
| Fund Return Before Taxes | 7.70% | 0.20% | 0.79% | |||
| Fund Return After Taxes on Distributions | 5.31% | (1.83)% | (1.23)% | |||
| Fund Return After Taxes on Distributions and Sale of Shares | 4.52% | (0.70)% | (0.25)% | |||
| ICE BofA U.S. Broad Market Index (reflects no deduction for fees, expenses, or income and withholding taxes)* | 7.15% | (0.42)% | (0.29)% | |||
| ICE BofA 1-10 Year U.S. Corporate Index (reflects no deduction for fees, expenses, or income and withholding taxes) | 7.89% | 1.64% | 1.91% |
| * | As a result of new regulatory requirements, the Fund’s regulatory or primary index previously changed from the ICE BofA 1-10 Year U.S. Corporate Index to the ICE BofA U.S. Broad Market Index. |
After-tax returns are calculated using the historical highest individual federal marginal income tax rate, and do not reflect the impact of state and local taxes. Actual after-tax returns depend on the investor’s tax situation and may differ from those shown. After-tax returns shown are not relevant to shareholders who hold Fund shares through tax-deferred arrangements such as 401(k) plans or Individual Retirement Accounts. The Fund Return After Taxes on Distributions and Sale of Shares may be higher than other return figures when a capital loss occurs upon the redemption of Fund shares.