Performance Management |
Oct. 31, 2025 |
|||||||||||||||||||||||||||||||||||||||||||||
|---|---|---|---|---|---|---|---|---|---|---|---|---|---|---|---|---|---|---|---|---|---|---|---|---|---|---|---|---|---|---|---|---|---|---|---|---|---|---|---|---|---|---|---|---|---|---|
| Old Westbury All Cap Core Fund | Old Westbury All Cap Core Fund | ||||||||||||||||||||||||||||||||||||||||||||||
| Prospectus [Line Items] | ||||||||||||||||||||||||||||||||||||||||||||||
| Bar Chart and Performance Table [Heading] | Performance Information | |||||||||||||||||||||||||||||||||||||||||||||
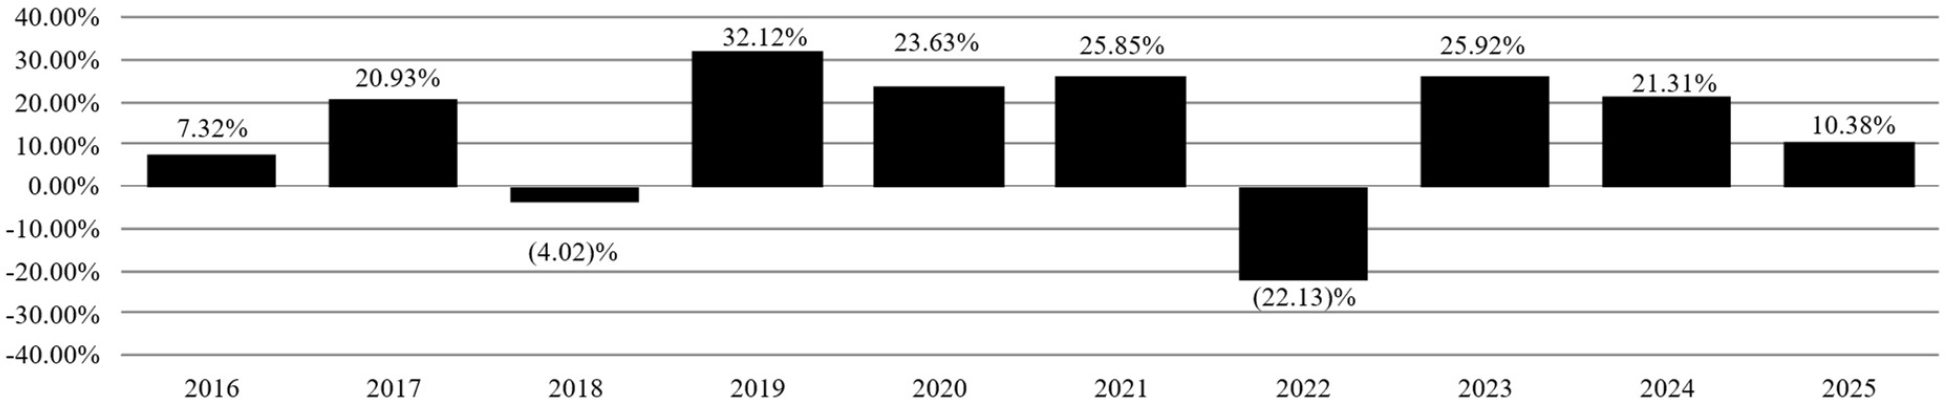
| Performance Narrative [Text Block] | The bar chart and the performance table shown below provide some indication of the risks of investing in the Fund by showing changes in its performance from year to year and by comparing the Fund’s performance to a broad-based securities index, the MSCI ACWI Investable Market Index (Net). In addition, the Fund compares its performance to a blended benchmark, as an additional benchmark, consisting of a 90% weighting in the MSCI USA Index (Gross) and a 10% weighting in the MSCI ACWI ex USA Index (Net). The Net performance figures of each index reflect no deductions for fees, expenses or income taxes, except foreign withholding taxes. For additional information about the indexes, please see the section entitled “Index Descriptions.”
Past performance (before and after taxes) does not necessarily predict future performance. Fund performance shown below reflects fees, waivers and/or expense reimbursements during such period and reinvestment of distributions, if any. Without waivers/reimbursements, performance would have been lower. Prior to December 30, 2016, the Fund was named the Old Westbury Large Cap Core Fund and operated under a different investment strategy. The performance information shown below before such date represents the Fund’s prior investment strategies. |
|||||||||||||||||||||||||||||||||||||||||||||
| Performance Past Does Not Indicate Future [Text] | Past performance (before and after taxes) does not necessarily predict future performance. | |||||||||||||||||||||||||||||||||||||||||||||
| Performance Information Illustrates Variability of Returns [Text] | The bar chart and the performance table shown below provide some indication of the risks of investing in the Fund by showing changes in its performance from year to year and by comparing the Fund’s performance to a broad-based securities index, the MSCI ACWI Investable Market Index (Net). | |||||||||||||||||||||||||||||||||||||||||||||
| Performance Additional Market Index [Text] | In addition, the Fund compares its performance to a blended benchmark, as an additional benchmark, consisting of a 90% weighting in the MSCI USA Index (Gross) and a 10% weighting in the MSCI ACWI ex USA Index (Net). | |||||||||||||||||||||||||||||||||||||||||||||
| Bar Chart [Heading] | Annual Total Returns (for calendar years ended December 31st) | |||||||||||||||||||||||||||||||||||||||||||||
| Bar Chart [Table] |
|
|||||||||||||||||||||||||||||||||||||||||||||
| Bar Chart Closing [Text Block] | During the periods shown in the bar chart, the highest return for a quarter was 23.76% (quarter ended 6/30/2020) and the lowest return for a quarter was (17.97)% (quarter ended 3/31/2020). |
|||||||||||||||||||||||||||||||||||||||||||||
| Highest Quarterly Return, Label [Optional Text] | highest return for a quarter | |||||||||||||||||||||||||||||||||||||||||||||
| Highest Quarterly Return | 23.76% | |||||||||||||||||||||||||||||||||||||||||||||
| Highest Quarterly Return, Date | Jun. 30, 2020 | |||||||||||||||||||||||||||||||||||||||||||||
| Lowest Quarterly Return, Label [Optional Text] | lowest return for a quarter | |||||||||||||||||||||||||||||||||||||||||||||
| Lowest Quarterly Return | (17.97%) | |||||||||||||||||||||||||||||||||||||||||||||
| Lowest Quarterly Return, Date | Mar. 31, 2020 | |||||||||||||||||||||||||||||||||||||||||||||
| Performance Table Uses Highest Federal Rate | After-tax returns are calculated using the historical highest individual federal marginal income tax rate, and do not reflect the impact of state and local taxes. | |||||||||||||||||||||||||||||||||||||||||||||
| Performance Table Not Relevant to Tax Deferred | Actual after-tax returns depend on the investor’s tax situation and may differ from those shown. After-tax returns shown are not relevant to shareholders who hold Fund shares through tax-deferred arrangements such as 401(k) plans or Individual Retirement Accounts. | |||||||||||||||||||||||||||||||||||||||||||||
| Performance Table Explanation after Tax Higher | The Fund Return After Taxes on Distributions and Sale of Shares may be higher than other return figures when a capital loss occurs upon the redemption of Fund shares. | |||||||||||||||||||||||||||||||||||||||||||||
| Performance [Table] |
|
|||||||||||||||||||||||||||||||||||||||||||||
| Average Annual Return, Caption [Optional Text] | Average Annual Total Returns (for the periods ended 12/31/2025) | |||||||||||||||||||||||||||||||||||||||||||||
| Index No Deduction for Fees, Expenses, or Taxes [Text] | (reflects no deduction for fees, expenses or income taxes, except foreign withholding taxes) | |||||||||||||||||||||||||||||||||||||||||||||
| Performance Table Closing [Text Block] | After-tax returns are calculated using the historical highest individual federal marginal income tax rate, and do not reflect the impact of state and local taxes. Actual after-tax returns depend on the investor’s tax situation and may differ from those shown. After-tax returns shown are not relevant to shareholders who hold Fund shares through tax-deferred arrangements such as 401(k) plans or Individual Retirement Accounts. The Fund Return After Taxes on Distributions and Sale of Shares may be higher than other return figures when a capital loss occurs upon the redemption of Fund shares. |
|||||||||||||||||||||||||||||||||||||||||||||
| Old Westbury Large Cap Strategies Fund | Old Westbury Large Cap Strategies Fund | ||||||||||||||||||||||||||||||||||||||||||||||
| Prospectus [Line Items] | ||||||||||||||||||||||||||||||||||||||||||||||
| Bar Chart and Performance Table [Heading] | Performance Information | |||||||||||||||||||||||||||||||||||||||||||||
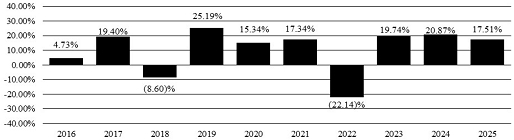
| Performance Narrative [Text Block] | The bar chart and the performance table shown below provide some indication of the risks of investing in the Fund by showing changes in its performance from year to year and by comparing the Fund’s performance to the MSCI ACWI Investable Market Index (Net) and the MSCI ACWI Large Cap Index (Net). The MSCI ACWI Investable Market Index (Net) serves as the Fund’s regulatorily-required broad-based securities market index and provides a broad measure of market performance. The MSCI ACWI Large Cap Index (Net) is the Fund’s additional index and is generally more representative of the Fund’s investment universe than the regulatory index. The Net performance figures of each index reflect no deductions for fees, expenses or income taxes, except foreign withholding taxes. For additional information about the indexes, please see the section entitled “Index Descriptions.”
Past performance (before and after taxes) does not necessarily predict future performance. Fund performance shown below reflects fees, waivers and/or expense reimbursements during such period and reinvestment of distributions, if any. Without waivers/reimbursements, performance would have been lower. |
|||||||||||||||||||||||||||||||||||||||||||||
| Performance Past Does Not Indicate Future [Text] | Past performance (before and after taxes) does not necessarily predict future performance. | |||||||||||||||||||||||||||||||||||||||||||||
| Performance Information Illustrates Variability of Returns [Text] | The bar chart and the performance table shown below provide some indication of the risks of investing in the Fund by showing changes in its performance from year to year and by comparing the Fund’s performance to the MSCI ACWI Investable Market Index (Net) and the MSCI ACWI Large Cap Index (Net). | |||||||||||||||||||||||||||||||||||||||||||||
| Bar Chart [Heading] | Annual Total Returns (for calendar years ended December 31st) | |||||||||||||||||||||||||||||||||||||||||||||
| Bar Chart [Table] |
|
|||||||||||||||||||||||||||||||||||||||||||||
| Bar Chart Closing [Text Block] | During the periods shown in the bar chart, the highest return for a quarter was 19.01% (quarter ended 6/30/2020) and the lowest return for a quarter was (20.77)% (quarter ended 3/31/2020). |
|||||||||||||||||||||||||||||||||||||||||||||
| Highest Quarterly Return, Label [Optional Text] | highest return for a quarter | |||||||||||||||||||||||||||||||||||||||||||||
| Highest Quarterly Return | 19.01% | |||||||||||||||||||||||||||||||||||||||||||||
| Highest Quarterly Return, Date | Jun. 30, 2020 | |||||||||||||||||||||||||||||||||||||||||||||
| Lowest Quarterly Return, Label [Optional Text] | lowest return for a quarter | |||||||||||||||||||||||||||||||||||||||||||||
| Lowest Quarterly Return | (20.77%) | |||||||||||||||||||||||||||||||||||||||||||||
| Lowest Quarterly Return, Date | Mar. 31, 2020 | |||||||||||||||||||||||||||||||||||||||||||||
| Performance Table Market Index Changed | As a result of new regulatory requirements, the Fund’s regulatory or primary index previously changed from the MSCI ACWI Large Cap Index (Net) to the MSCI ACWI Investable Market Index (Net). | |||||||||||||||||||||||||||||||||||||||||||||
| Performance Table Uses Highest Federal Rate | After-tax returns are calculated using the historical highest individual federal marginal income tax rate, and do not reflect the impact of state and local taxes. | |||||||||||||||||||||||||||||||||||||||||||||
| Performance Table Not Relevant to Tax Deferred | Actual after-tax returns depend on the investor’s tax situation and may differ from those shown. After-tax returns shown are not relevant to shareholders who hold Fund shares through tax-deferred arrangements such as 401(k) plans or Individual Retirement Accounts. | |||||||||||||||||||||||||||||||||||||||||||||
| Performance Table Explanation after Tax Higher | The Fund Return After Taxes on Distributions and Sale of Shares may be higher than other return figures when a capital loss occurs upon the redemption of Fund shares. | |||||||||||||||||||||||||||||||||||||||||||||
| Performance [Table] |
|
|||||||||||||||||||||||||||||||||||||||||||||
| Average Annual Return, Caption [Optional Text] | Average Annual Total Returns (for the periods ended 12/31/2025) | |||||||||||||||||||||||||||||||||||||||||||||
| Index No Deduction for Fees, Expenses, or Taxes [Text] | (reflects no deduction for fees, expenses or income taxes, except foreign withholding taxes) | |||||||||||||||||||||||||||||||||||||||||||||
| Performance Table Closing [Text Block] | After-tax returns are calculated using the historical highest individual federal marginal income tax rate, and do not reflect the impact of state and local taxes. Actual after-tax returns depend on the investor’s tax situation and may differ from those shown. After-tax returns shown are not relevant to shareholders who hold Fund shares through tax-deferred arrangements such as 401(k) plans or Individual Retirement Accounts. The Fund Return After Taxes on Distributions and Sale of Shares may be higher than other return figures when a capital loss occurs upon the redemption of Fund shares. |
|||||||||||||||||||||||||||||||||||||||||||||
| Old Westbury Small & Mid Cap Strategies Fund | Old Westbury Small & Mid Cap Strategies Fund | ||||||||||||||||||||||||||||||||||||||||||||||
| Prospectus [Line Items] | ||||||||||||||||||||||||||||||||||||||||||||||
| Bar Chart and Performance Table [Heading] | Performance Information | |||||||||||||||||||||||||||||||||||||||||||||
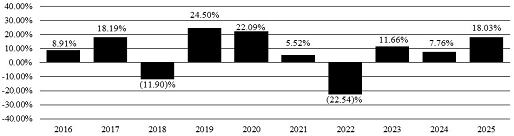
| Performance Narrative [Text Block] | The bar chart and the performance table shown below provide some indication of the risks of investing in the Fund by showing changes in its performance from year to year and by comparing the Fund’s performance to the MSCI ACWI Investable Market Index (Net) and the MSCI ACWI SMID Cap Index (Net). The MSCI ACWI Investable Market Index (Net) serves as the Fund’s regulatorily-required broad-based securities market index and provides a broad measure of market performance. The MSCI ACWI SMID Cap Index (Net) is the Fund’s additional index and is generally more representative of the Fund’s investment universe than the regulatory index. The Net performance figures of each index reflect no deductions for fees, expenses or income taxes, except foreign withholding taxes. For additional information about the indexes, please see the section entitled “Index Descriptions.”
Past performance (before and after taxes) does not necessarily predict future performance. Fund performance shown below reflects fees, waivers and/or expense reimbursements during such period and reinvestment of distributions, if any. Without waivers/reimbursements, performance would have been lower. Prior to December 30, 2016, the Fund was named the Old Westbury Small & Mid Cap Fund and operated under a different investment strategy. The performance information shown below before such date represents the Fund’s prior investment strategies. |
|||||||||||||||||||||||||||||||||||||||||||||
| Performance Past Does Not Indicate Future [Text] | Past performance (before and after taxes) does not necessarily predict future performance. | |||||||||||||||||||||||||||||||||||||||||||||
| Performance Information Illustrates Variability of Returns [Text] | The bar chart and the performance table shown below provide some indication of the risks of investing in the Fund by showing changes in its performance from year to year and by comparing the Fund’s performance to the MSCI ACWI Investable Market Index(Net) and the MSCI ACWI SMID Cap Index (Net). | |||||||||||||||||||||||||||||||||||||||||||||
| Bar Chart [Heading] | Annual Total Returns (for calendar years ended December 31st) | |||||||||||||||||||||||||||||||||||||||||||||
| Bar Chart [Table] |
|
|||||||||||||||||||||||||||||||||||||||||||||
| Bar Chart Closing [Text Block] | During the periods shown in the bar chart, the highest return for a quarter was 23.72% (quarter ended 6/30/2020) and the lowest return for a quarter was (24.78)% (quarter ended 3/31/2020). |
|||||||||||||||||||||||||||||||||||||||||||||
| Highest Quarterly Return, Label [Optional Text] | highest return for a quarter | |||||||||||||||||||||||||||||||||||||||||||||
| Highest Quarterly Return | 23.72% | |||||||||||||||||||||||||||||||||||||||||||||
| Highest Quarterly Return, Date | Jun. 30, 2020 | |||||||||||||||||||||||||||||||||||||||||||||
| Lowest Quarterly Return, Label [Optional Text] | lowest return for a quarter | |||||||||||||||||||||||||||||||||||||||||||||
| Lowest Quarterly Return | (24.78%) | |||||||||||||||||||||||||||||||||||||||||||||
| Lowest Quarterly Return, Date | Mar. 31, 2020 | |||||||||||||||||||||||||||||||||||||||||||||
| Performance Table Market Index Changed | As a result of new regulatory requirements, the Fund’s regulatory or primary index previously changed from the MSCI ACWI SMID Cap Index (Net) to the MSCI ACWI Investable Market Index (Net). | |||||||||||||||||||||||||||||||||||||||||||||
| Performance Table Uses Highest Federal Rate | After-tax returns are calculated using the historical highest individual federal marginal income tax rate, and do not reflect the impact of state and local taxes. | |||||||||||||||||||||||||||||||||||||||||||||
| Performance Table Not Relevant to Tax Deferred | Actual after-tax returns depend on the investor’s tax situation and may differ from those shown. After-tax returns shown are not relevant to shareholders who hold Fund shares through tax-deferred arrangements such as 401(k) plans or Individual Retirement Accounts. | |||||||||||||||||||||||||||||||||||||||||||||
| Performance Table Explanation after Tax Higher | The Fund Return After Taxes on Distributions and Sale of Shares may be higher than other return figures when a capital loss occurs upon the redemption of Fund shares. | |||||||||||||||||||||||||||||||||||||||||||||
| Performance [Table] |
|
|||||||||||||||||||||||||||||||||||||||||||||
| Average Annual Return, Caption [Optional Text] | Average Annual Total Returns (for the periods ended 12/31/2025) | |||||||||||||||||||||||||||||||||||||||||||||
| Index No Deduction for Fees, Expenses, or Taxes [Text] | (reflects no deduction for fees, expenses or income taxes, except foreign withholding taxes) | |||||||||||||||||||||||||||||||||||||||||||||
| Performance Table Closing [Text Block] | After-tax returns are calculated using the historical highest individual federal marginal income tax rate, and do not reflect the impact of state and local taxes. Actual after-tax returns depend on the investor’s tax situation and may differ from those shown. After-tax returns shown are not relevant to shareholders who hold Fund shares through tax-deferred arrangements such as 401(k) plans or Individual Retirement Accounts. The Fund Return After Taxes on Distributions and Sale of Shares may be higher than other return figures when a capital loss occurs upon the redemption of Fund shares. |
|||||||||||||||||||||||||||||||||||||||||||||
| Old Westbury Total Equity Fund | Old Westbury Total Equity Fund | ||||||||||||||||||||||||||||||||||||||||||||||
| Prospectus [Line Items] | ||||||||||||||||||||||||||||||||||||||||||||||
| Bar Chart and Performance Table [Heading] | Performance Information | |||||||||||||||||||||||||||||||||||||||||||||
| Performance Narrative [Text Block] | The Fund commenced operations on February 28, 2025, and therefore does not have a full calendar year of performance. Accordingly, no performance information is shown. Performance information will be available after the Fund has a full calendar year of performance. |
|||||||||||||||||||||||||||||||||||||||||||||
| Performance One Year or Less [Text] | The Fund commenced operations on February 28, 2025, and therefore does not have a full calendar year of performance. Accordingly, no performance information is shown. | |||||||||||||||||||||||||||||||||||||||||||||
| Old Westbury Credit Income Fund | Old Westbury Credit Income Fund | ||||||||||||||||||||||||||||||||||||||||||||||
| Prospectus [Line Items] | ||||||||||||||||||||||||||||||||||||||||||||||
| Bar Chart and Performance Table [Heading] | Performance Information | |||||||||||||||||||||||||||||||||||||||||||||
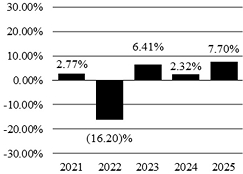
| Performance Narrative [Text Block] | The bar chart and the performance table shown below provide some indication of the risks of investing in the Fund by showing changes in its performance from year to year and by comparing the Fund’s performance to the ICE BofA U.S. Broad Market Index and the ICE BofA 1-10 Year U.S. Corporate Index. The ICE BofA U.S. Broad Market Index serves as the Fund’s regulatorily-required broad-based securities market index and provides a broad measure of market performance. The ICE BofA 1-10 Year U.S. Corporate Index is the Fund’s additional index and is generally more representative of the Fund’s investment universe than the regulatory index. For additional information about the indexes, please see the section entitled “Index Descriptions.”
Past performance (before and after taxes) does not necessarily predict future performance. Fund performance shown below reflects fees, waivers and/or expense reimbursements during such period and reinvestment of distributions, if any. Without waivers/reimbursements, performance would have been lower. |
|||||||||||||||||||||||||||||||||||||||||||||
| Performance Past Does Not Indicate Future [Text] | Past performance (before and after taxes) does not necessarily predict future performance. | |||||||||||||||||||||||||||||||||||||||||||||
| Performance Information Illustrates Variability of Returns [Text] | The bar chart and the performance table shown below provide some indication of the risks of investing in the Fund by showing changes in its performance from year to year and by comparing the Fund’s performance to the ICE BofA U.S. Broad Market Index and the ICE BofA 1-10 Year U.S. Corporate Index. | |||||||||||||||||||||||||||||||||||||||||||||
| Bar Chart [Heading] | Annual Total Return (for calendar years ended December 31st) | |||||||||||||||||||||||||||||||||||||||||||||
| Bar Chart [Table] |
|
|||||||||||||||||||||||||||||||||||||||||||||
| Bar Chart Closing [Text Block] | During the periods shown in the bar chart, the highest return for a quarter was 7.31% (quarter ended 12/31/2023) and the lowest return for a quarter was (7.36)% (quarter ended 6/30/2022). |
|||||||||||||||||||||||||||||||||||||||||||||
| Highest Quarterly Return, Label [Optional Text] | highest return for a quarter | |||||||||||||||||||||||||||||||||||||||||||||
| Highest Quarterly Return | 7.31% | |||||||||||||||||||||||||||||||||||||||||||||
| Highest Quarterly Return, Date | Dec. 31, 2023 | |||||||||||||||||||||||||||||||||||||||||||||
| Lowest Quarterly Return, Label [Optional Text] | lowest return for a quarter | |||||||||||||||||||||||||||||||||||||||||||||
| Lowest Quarterly Return | (7.36%) | |||||||||||||||||||||||||||||||||||||||||||||
| Lowest Quarterly Return, Date | Jun. 30, 2022 | |||||||||||||||||||||||||||||||||||||||||||||
| Performance Table Market Index Changed | As a result of new regulatory requirements, the Fund’s regulatory or primary index previously changed from the ICE BofA 1-10 Year U.S. Corporate Index to the ICE BofA U.S. Broad Market Index. | |||||||||||||||||||||||||||||||||||||||||||||
| Performance Table Uses Highest Federal Rate | After-tax returns are calculated using the historical highest individual federal marginal income tax rate, and do not reflect the impact of state and local taxes. | |||||||||||||||||||||||||||||||||||||||||||||
| Performance Table Not Relevant to Tax Deferred | Actual after-tax returns depend on the investor’s tax situation and may differ from those shown. After-tax returns shown are not relevant to shareholders who hold Fund shares through tax-deferred arrangements such as 401(k) plans or Individual Retirement Accounts. | |||||||||||||||||||||||||||||||||||||||||||||
| Performance Table Explanation after Tax Higher | The Fund Return After Taxes on Distributions and Sale of Shares may be higher than other return figures when a capital loss occurs upon the redemption of Fund shares. | |||||||||||||||||||||||||||||||||||||||||||||
| Performance [Table] |
|
|||||||||||||||||||||||||||||||||||||||||||||
| Average Annual Return, Caption [Optional Text] | Average Annual Total Returns (for the periods ended 12/31/2025) | |||||||||||||||||||||||||||||||||||||||||||||
| Index No Deduction for Fees, Expenses, or Taxes [Text] | (reflects no deduction for fees, expenses, or income and withholding taxes) | |||||||||||||||||||||||||||||||||||||||||||||
| Performance Table Closing [Text Block] | After-tax returns are calculated using the historical highest individual federal marginal income tax rate, and do not reflect the impact of state and local taxes. Actual after-tax returns depend on the investor’s tax situation and may differ from those shown. After-tax returns shown are not relevant to shareholders who hold Fund shares through tax-deferred arrangements such as 401(k) plans or Individual Retirement Accounts. The Fund Return After Taxes on Distributions and Sale of Shares may be higher than other return figures when a capital loss occurs upon the redemption of Fund shares. |
|||||||||||||||||||||||||||||||||||||||||||||
| Old Westbury Fixed Income Fund | Old Westbury Fixed Income Fund | ||||||||||||||||||||||||||||||||||||||||||||||
| Prospectus [Line Items] | ||||||||||||||||||||||||||||||||||||||||||||||
| Bar Chart and Performance Table [Heading] | Performance Information | |||||||||||||||||||||||||||||||||||||||||||||
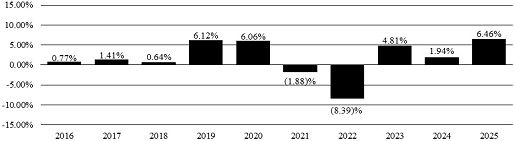
| Performance Narrative [Text Block] | The bar chart and the performance table shown below provide some indication of the risks of investing in the Fund by showing changes in its performance from year to year and by comparing the Fund’s performance to the ICE BofA U.S. Broad Market Index and the ICE BofA 1-10 Year AAA-A US Corporate & Government Index. The ICE BofA U.S. Broad Market Index serves as the Fund’s regulatorily-required broad-based securities market index and provides a broad measure of market performance. The ICE BofA 1-10 Year AAA-A US Corporate & Government Index is the Fund’s additional index and is generally more representative of the Fund’s investment universe than the regulatory index. For additional information about the indexes, please see the section entitled “Index Descriptions.”
Past performance (before and after taxes) does not necessarily predict future performance. Fund performance shown below reflects fees, waivers and/or expense reimbursements during such period and reinvestment of distributions, if any. Without waivers/reimbursements, performance would have been lower. |
|||||||||||||||||||||||||||||||||||||||||||||
| Performance Past Does Not Indicate Future [Text] | Past performance (before and after taxes) does not necessarily predict future performance. | |||||||||||||||||||||||||||||||||||||||||||||
| Performance Information Illustrates Variability of Returns [Text] | The bar chart and the performance table shown below provide some indication of the risks of investing in the Fund by showing changes in its performance from year to year and by comparing the Fund’s performance to the ICE BofA U.S. Broad Market Index and the ICE BofA 1-10 Year AAA-A US Corporate & Government Index. | |||||||||||||||||||||||||||||||||||||||||||||
| Bar Chart [Heading] | Annual Total Returns (for calendar years ended December 31st) | |||||||||||||||||||||||||||||||||||||||||||||
| Bar Chart [Table] |
|
|||||||||||||||||||||||||||||||||||||||||||||
| Bar Chart Closing [Text Block] | During the periods shown in the bar chart, the highest return for a quarter was 5.02% (quarter ended 12/31/2023) and the lowest return for a quarter was (4.27)% (quarter ended 3/31/2022). |
|||||||||||||||||||||||||||||||||||||||||||||
| Highest Quarterly Return, Label [Optional Text] | highest return for a quarter | |||||||||||||||||||||||||||||||||||||||||||||
| Highest Quarterly Return | 5.02% | |||||||||||||||||||||||||||||||||||||||||||||
| Highest Quarterly Return, Date | Dec. 31, 2023 | |||||||||||||||||||||||||||||||||||||||||||||
| Lowest Quarterly Return, Label [Optional Text] | lowest return for a quarter | |||||||||||||||||||||||||||||||||||||||||||||
| Lowest Quarterly Return | (4.27%) | |||||||||||||||||||||||||||||||||||||||||||||
| Lowest Quarterly Return, Date | Mar. 31, 2022 | |||||||||||||||||||||||||||||||||||||||||||||
| Performance Table Market Index Changed | As a result of new regulatory requirements, the Fund’s regulatory or primary index previously changed from the ICE BofA 1-10 Year AAA-A U.S. Corporate & Government Index to the ICE BofA U.S. Broad Market Index. | |||||||||||||||||||||||||||||||||||||||||||||
| Performance Table Uses Highest Federal Rate | After-tax returns are calculated using the historical highest individual federal marginal income tax rate, and do not reflect the impact of state and local taxes. | |||||||||||||||||||||||||||||||||||||||||||||
| Performance Table Not Relevant to Tax Deferred | Actual after-tax returns depend on the investor’s tax situation and may differ from those shown. After-tax returns shown are not relevant to shareholders who hold Fund shares through tax-deferred arrangements such as 401(k) plans or Individual Retirement Accounts. | |||||||||||||||||||||||||||||||||||||||||||||
| Performance Table Explanation after Tax Higher | The Fund Return After Taxes on Distributions and Sale of Shares may be higher than other return figures when a capital loss occurs upon the redemption of Fund shares. | |||||||||||||||||||||||||||||||||||||||||||||
| Performance [Table] |
|
|||||||||||||||||||||||||||||||||||||||||||||
| Average Annual Return, Caption [Optional Text] | Average Annual Total Returns (for the periods ended 12/31/2025) | |||||||||||||||||||||||||||||||||||||||||||||
| Index No Deduction for Fees, Expenses, or Taxes [Text] | (reflects no deduction for fees, expenses, or income and withholding taxes) | |||||||||||||||||||||||||||||||||||||||||||||
| Performance Table Closing [Text Block] | After-tax returns are calculated using the historical highest individual federal marginal income tax rate, and do not reflect the impact of state and local taxes. Actual after-tax returns depend on the investor’s tax situation and may differ from those shown. After-tax returns shown are not relevant to shareholders who hold Fund shares through tax-deferred arrangements such as 401(k) plans or Individual Retirement Accounts. The Fund Return After Taxes on Distributions and Sale of Shares may be higher than other return figures when a capital loss occurs upon the redemption of Fund shares. |
|||||||||||||||||||||||||||||||||||||||||||||
| Old Westbury Short-Term Bond Fund | Old Westbury Short-Term Bond Fund | ||||||||||||||||||||||||||||||||||||||||||||||
| Prospectus [Line Items] | ||||||||||||||||||||||||||||||||||||||||||||||
| Bar Chart and Performance Table [Heading] | Performance Information | |||||||||||||||||||||||||||||||||||||||||||||
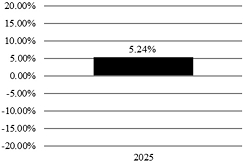
| Performance Narrative [Text Block] | The bar chart and the performance table shown below provide some indication of the risks of investing in the Fund by showing changes in its performance from year to year and by comparing the Fund’s performance to the ICE BofA U.S. Broad Market Index and the ICE BofA 1-3 Year AAA-A U.S. Corporate & Government Index. The ICE BofA U.S. Broad Market Index serves as the Fund’s regulatorily-required broad-based securities market index and provides a broad measure of market performance. For additional information about the indexes, please see the section entitled “Index Descriptions.”
Past performance (before and after taxes) does not necessarily predict future performance. Fund performance shown below reflects fees, waivers and/or expense reimbursements during such period and reinvestment of distributions, if any. Without waivers/reimbursements, performance would have been lower. |
|||||||||||||||||||||||||||||||||||||||||||||
| Performance Past Does Not Indicate Future [Text] | Past performance (before and after taxes) does not necessarily predict future performance. | |||||||||||||||||||||||||||||||||||||||||||||
| Performance Information Illustrates Variability of Returns [Text] | The bar chart and the performance table shown below provide some indication of the risks of investing in the Fund by showing changes in its performance from year to year and by comparing the Fund’s performance to the ICE BofA U.S. Broad Market Index and the ICE BofA 1-3 Year AAA-A U.S. Corporate & Government Index. | |||||||||||||||||||||||||||||||||||||||||||||
| Bar Chart [Heading] | Annual Total Returns (for calendar year ended December 31st) | |||||||||||||||||||||||||||||||||||||||||||||
| Bar Chart [Table] |
|
|||||||||||||||||||||||||||||||||||||||||||||
| Bar Chart Closing [Text Block] | During the periods shown in the bar chart, the highest return for a quarter was 1.60% (quarter ended 03/31/2025) and the lowest return for a quarter was 1.04% (quarter ended 12/31/2025). |
|||||||||||||||||||||||||||||||||||||||||||||
| Highest Quarterly Return, Label [Optional Text] | highest return for a quarter | |||||||||||||||||||||||||||||||||||||||||||||
| Highest Quarterly Return | 1.60% | |||||||||||||||||||||||||||||||||||||||||||||
| Highest Quarterly Return, Date | Mar. 31, 2025 | |||||||||||||||||||||||||||||||||||||||||||||
| Lowest Quarterly Return, Label [Optional Text] | lowest return for a quarter | |||||||||||||||||||||||||||||||||||||||||||||
| Lowest Quarterly Return | 1.04% | |||||||||||||||||||||||||||||||||||||||||||||
| Lowest Quarterly Return, Date | Dec. 31, 2025 | |||||||||||||||||||||||||||||||||||||||||||||
| Performance Table Market Index Changed | As a result of new regulatory requirements, the Fund’s regulatory or primary index previously changed from the ICE BofA 1-3 Year AAA-A U.S. Corporate & Government Index to the ICE BofA U.S. Broad Market Index. | |||||||||||||||||||||||||||||||||||||||||||||
| Performance Table Uses Highest Federal Rate | After-tax returns are calculated using the historical highest individual federal marginal income tax rate, and do not reflect the impact of state and local taxes. | |||||||||||||||||||||||||||||||||||||||||||||
| Performance Table Not Relevant to Tax Deferred | Actual after-tax returns depend on the investor’s tax situation and may differ from those shown. After-tax returns shown are not relevant to shareholders who hold Fund shares through tax-deferred arrangements such as 401(k) plans or Individual Retirement Accounts. | |||||||||||||||||||||||||||||||||||||||||||||
| Performance Table Explanation after Tax Higher | The Fund Return After Taxes on Distributions and Sale of Shares may be higher than other return figures when a capital loss occurs upon the redemption of Fund shares. | |||||||||||||||||||||||||||||||||||||||||||||
| Performance [Table] |
|
|||||||||||||||||||||||||||||||||||||||||||||
| Average Annual Return, Caption [Optional Text] | Average Annual Total Returns (for the periods ended 12/31/2025) | |||||||||||||||||||||||||||||||||||||||||||||
| Index No Deduction for Fees, Expenses, or Taxes [Text] | (reflects no deduction for fees, expenses, or income and withholding taxes) | |||||||||||||||||||||||||||||||||||||||||||||
| Performance Table Closing [Text Block] | After-tax returns are calculated using the historical highest individual federal marginal income tax rate, and do not reflect the impact of state and local taxes. Actual after-tax returns depend on the investor’s tax situation and may differ from those shown. After-tax returns shown are not relevant to shareholders who hold Fund shares through tax-deferred arrangements such as 401(k) plans or Individual Retirement Accounts. The Fund Return After Taxes on Distributions and Sale of Shares may be higher than other return figures when a capital loss occurs upon the redemption of Fund shares. |
|||||||||||||||||||||||||||||||||||||||||||||
| Old Westbury Municipal Bond Fund | Old Westbury Municipal Bond Fund | ||||||||||||||||||||||||||||||||||||||||||||||
| Prospectus [Line Items] | ||||||||||||||||||||||||||||||||||||||||||||||
| Bar Chart and Performance Table [Heading] | Performance Information | |||||||||||||||||||||||||||||||||||||||||||||
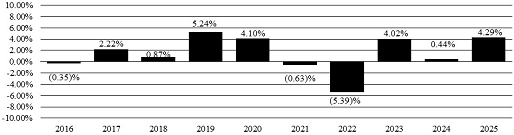
| Performance Narrative [Text Block] | The bar chart and the performance table shown below provide some indication of the risks of investing in the Fund by showing changes in its performance from year to year and by comparing the Fund’s performance to the ICE BofA U.S. Municipal Securities Index and the ICE BofA 1-12 Year AAA-AA Municipal Securities Index. The ICE BofA U.S. Municipal Securities Index serves as the Fund’s regulatorily-required broad-based securities market index and provides a broad measure of market performance. The ICE BofA 1-12 Year AAA-AA Municipal Securities Index is the Fund’s additional index and is generally more representative of the Fund’s investment universe than the regulatory index. For additional information about the indexes, please see the section entitled “Index Descriptions.”
Past performance (before and after taxes) does not necessarily predict future performance. Fund performance shown below reflects fees, waivers and/or expense reimbursements during such period and reinvestment of distributions, if any. Without waivers/reimbursements, performance would have been lower. |
|||||||||||||||||||||||||||||||||||||||||||||
| Performance Past Does Not Indicate Future [Text] | Past performance (before and after taxes) does not necessarily predict future performance. | |||||||||||||||||||||||||||||||||||||||||||||
| Performance Information Illustrates Variability of Returns [Text] | The bar chart and the performance table shown below provide some indication of the risks of investing in the Fund by showing changes in its performance from year to year and by comparing the Fund’s performance to the ICE BofA U.S. Municipal Securities Index and the ICE BofA 1-12 Year AAA-AA Municipal Securities Index. | |||||||||||||||||||||||||||||||||||||||||||||
| Bar Chart [Heading] | Annual Total Returns (for calendar years ended December 31st) | |||||||||||||||||||||||||||||||||||||||||||||
| Bar Chart [Table] |
|
|||||||||||||||||||||||||||||||||||||||||||||
| Bar Chart Closing [Text Block] | During the periods shown in the bar chart, the highest return for a quarter was 5.56% (quarter ended 12/31/2023) and the lowest return for a quarter was (4.90)% (quarter ended 3/31/2022). |
|||||||||||||||||||||||||||||||||||||||||||||
| Highest Quarterly Return, Label [Optional Text] | highest return for a quarter | |||||||||||||||||||||||||||||||||||||||||||||
| Highest Quarterly Return | 5.56% | |||||||||||||||||||||||||||||||||||||||||||||
| Highest Quarterly Return, Date | Dec. 31, 2023 | |||||||||||||||||||||||||||||||||||||||||||||
| Lowest Quarterly Return, Label [Optional Text] | lowest return for a quarter | |||||||||||||||||||||||||||||||||||||||||||||
| Lowest Quarterly Return | (4.90%) | |||||||||||||||||||||||||||||||||||||||||||||
| Lowest Quarterly Return, Date | Mar. 31, 2022 | |||||||||||||||||||||||||||||||||||||||||||||
| Performance Table Market Index Changed | As a result of new regulatory requirements, the Fund’s regulatory or primary index previously changed from the ICE BofA 1-12 Year AAA-AA Municipal Securities Index to the ICE BofA U.S. Municipal Securities Index. | |||||||||||||||||||||||||||||||||||||||||||||
| Performance Table Uses Highest Federal Rate | After-tax returns are calculated using the historical highest individual federal marginal income tax rate, and do not reflect the impact of state and local taxes. | |||||||||||||||||||||||||||||||||||||||||||||
| Performance Table Not Relevant to Tax Deferred | Actual after-tax returns depend on the investor’s tax situation and may differ from those shown. After-tax returns shown are not relevant to shareholders who hold Fund shares through tax-deferred arrangements such as 401(k) plans or Individual Retirement Accounts. | |||||||||||||||||||||||||||||||||||||||||||||
| Performance Table Explanation after Tax Higher | The Fund Return After Taxes on Distributions and Sale of Shares may be higher than other return figures when a capital loss occurs upon the redemption of Fund shares. | |||||||||||||||||||||||||||||||||||||||||||||
| Performance [Table] |
|
|||||||||||||||||||||||||||||||||||||||||||||
| Average Annual Return, Caption [Optional Text] | Average Annual Total Returns (for the periods ended 12/31/2025) | |||||||||||||||||||||||||||||||||||||||||||||
| Index No Deduction for Fees, Expenses, or Taxes [Text] | (reflects no deduction for fees, expenses or income and withholding taxes) | |||||||||||||||||||||||||||||||||||||||||||||
| Performance Table Closing [Text Block] | After-tax returns are calculated using the historical highest individual federal marginal income tax rate, and do not reflect the impact of state and local taxes. Actual after-tax returns depend on the investor’s tax situation and may differ from those shown. After-tax returns shown are not relevant to shareholders who hold Fund shares through tax-deferred arrangements such as 401(k) plans or Individual Retirement Accounts. The Fund Return After Taxes on Distributions and Sale of Shares may be higher than other return figures when a capital loss occurs upon the redemption of Fund shares. |
|||||||||||||||||||||||||||||||||||||||||||||
| Old Westbury California Municipal Bond Fund | Old Westbury California Municipal Bond Fund | ||||||||||||||||||||||||||||||||||||||||||||||
| Prospectus [Line Items] | ||||||||||||||||||||||||||||||||||||||||||||||
| Bar Chart and Performance Table [Heading] | Performance Information | |||||||||||||||||||||||||||||||||||||||||||||
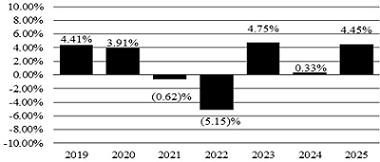
| Performance Narrative [Text Block] | The bar chart and the performance table shown below provide some indication of the risks of investing in the Fund by showing changes in its performance from year to year and by comparing the Fund’s performance to the ICE BofA U.S. Municipal Securities Index and the ICE BofA 3-7 Year AAA-AA Municipal Securities Index. The ICE BofA U.S. Municipal Securities Index serves as the Fund’s regulatorily-required broad-based securities market index and provides a broad measure of market performance. The ICE BofA 3-7 Year AAA-AA Municipal Securities Index is the Fund’s additional index and is generally more representative of the Fund’s investment universe than the regulatory index. For additional information about the indexes, please see the section entitled “Index Descriptions.”
Past performance (before and after taxes) does not necessarily predict future performance. Fund performance shown below reflects fees, waivers and/or expense reimbursements during such period and reinvestment of distributions, if any. Without waivers/reimbursements, performance would have been lower. |
|||||||||||||||||||||||||||||||||||||||||||||
| Performance Past Does Not Indicate Future [Text] | Past performance (before and after taxes) does not necessarily predict future performance. | |||||||||||||||||||||||||||||||||||||||||||||
| Performance Information Illustrates Variability of Returns [Text] | The bar chart and the performance table shown below provide some indication of the risks of investing in the Fund by showing changes in its performance from year to year and by comparing the Fund’s performance to the ICE BofA U.S. Municipal Securities Index and the ICE BofA 3-7 Year AAA-AA Municipal Securities Index. | |||||||||||||||||||||||||||||||||||||||||||||
| Bar Chart [Heading] | Annual Total Returns (for calendar years ended December 31st) | |||||||||||||||||||||||||||||||||||||||||||||
| Bar Chart [Table] |
|
|||||||||||||||||||||||||||||||||||||||||||||
| Bar Chart Closing [Text Block] | During the periods shown in the bar chart, the highest return for a quarter was 5.48% (quarter ended 12/31/2023) and the lowest return for a quarter was (4.72)% (quarter ended 3/31/2022). |
|||||||||||||||||||||||||||||||||||||||||||||
| Highest Quarterly Return, Label [Optional Text] | highest return for a quarter | |||||||||||||||||||||||||||||||||||||||||||||
| Highest Quarterly Return | 5.48% | |||||||||||||||||||||||||||||||||||||||||||||
| Highest Quarterly Return, Date | Dec. 31, 2023 | |||||||||||||||||||||||||||||||||||||||||||||
| Lowest Quarterly Return, Label [Optional Text] | lowest return for a quarter | |||||||||||||||||||||||||||||||||||||||||||||
| Lowest Quarterly Return | (4.72%) | |||||||||||||||||||||||||||||||||||||||||||||
| Lowest Quarterly Return, Date | Mar. 31, 2022 | |||||||||||||||||||||||||||||||||||||||||||||
| Performance Table Market Index Changed | As a result of new regulatory requirements, the Fund’s regulatory or primary index previously changed from the ICE BofA 3-7 Year AAA-AA Municipal Securities Index to the ICE BofA U.S. Municipal Securities Index. | |||||||||||||||||||||||||||||||||||||||||||||
| Performance Table Uses Highest Federal Rate | After-tax returns are calculated using the historical highest individual federal marginal income tax rate, and do not reflect the impact of state and local taxes. | |||||||||||||||||||||||||||||||||||||||||||||
| Performance Table Not Relevant to Tax Deferred | Actual after-tax returns depend on the investor’s tax situation and may differ from those shown. After-tax returns shown are not relevant to shareholders who hold Fund shares through tax-deferred arrangements such as 401(k) plans or Individual Retirement Accounts. | |||||||||||||||||||||||||||||||||||||||||||||
| Performance Table Explanation after Tax Higher | The Fund Return After Taxes on Distributions and Sale of Shares may be higher than other return figures when a capital loss occurs upon the redemption of Fund shares. | |||||||||||||||||||||||||||||||||||||||||||||
| Performance [Table] |
|
|||||||||||||||||||||||||||||||||||||||||||||
| Average Annual Return, Caption [Optional Text] | Average Annual Total Returns (for the periods ended 12/31/2025) | |||||||||||||||||||||||||||||||||||||||||||||
| Index No Deduction for Fees, Expenses, or Taxes [Text] | (reflects no deduction for fees, expenses, or income and withholding taxes) | |||||||||||||||||||||||||||||||||||||||||||||
| Performance Table Closing [Text Block] | After-tax returns are calculated using the historical highest individual federal marginal income tax rate, and do not reflect the impact of state and local taxes. Actual after-tax returns depend on the investor’s tax situation and may differ from those shown. After-tax returns shown are not relevant to shareholders who hold Fund shares through tax-deferred arrangements such as 401(k) plans or Individual Retirement Accounts. The Fund Return After Taxes on Distributions and Sale of Shares may be higher than other return figures when a capital loss occurs upon the redemption of Fund shares. |
|||||||||||||||||||||||||||||||||||||||||||||
| Old Westbury New York Municipal Bond Fund | Old Westbury New York Municipal Bond Fund | ||||||||||||||||||||||||||||||||||||||||||||||
| Prospectus [Line Items] | ||||||||||||||||||||||||||||||||||||||||||||||
| Bar Chart and Performance Table [Heading] | Performance Information | |||||||||||||||||||||||||||||||||||||||||||||
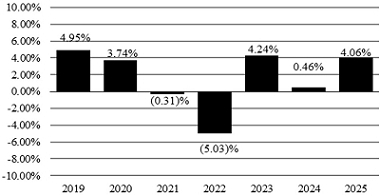
| Performance Narrative [Text Block] | The bar chart and the performance table shown below provide some indication of the risks of investing in the Fund by showing changes in its performance from year to year and by comparing the Fund’s performance to the ICE BofA U.S. Municipal Securities Index and the ICE BofA 3-7 Year AAA-AA Municipal Securities Index. The ICE BofA U.S. Municipal Securities Index serves as the Fund’s regulatorily-required broad-based securities market index and provides a broad measure of market performance. The ICE BofA 3-7 Year AAA-AA Municipal Securities Index is the Fund’s additional index and is generally more representative of the Fund’s investment universe than the regulatory index. For additional information about the indexes, please see the section entitled “Index Descriptions.”
Past performance (before and after taxes) does not necessarily predict future performance. Fund performance shown below reflects fees, waivers and/or expense reimbursements during such period and reinvestment of distributions, if any. Without waivers/reimbursements, performance would have been lower. |
|||||||||||||||||||||||||||||||||||||||||||||
| Performance Past Does Not Indicate Future [Text] | Past performance (before and after taxes) does not necessarily predict future performance. | |||||||||||||||||||||||||||||||||||||||||||||
| Bar Chart [Heading] | Annual Total Returns (for calendar years ended December 31st) | |||||||||||||||||||||||||||||||||||||||||||||
| Bar Chart [Table] |
|
|||||||||||||||||||||||||||||||||||||||||||||
| Bar Chart Closing [Text Block] | During the periods shown in the bar chart, the highest return for a quarter was 5.53% (quarter ended 12/31/2023) and the lowest return for a quarter was (4.76)% (quarter ended 3/31/2022). |
|||||||||||||||||||||||||||||||||||||||||||||
| Highest Quarterly Return, Label [Optional Text] | highest return for a quarter | |||||||||||||||||||||||||||||||||||||||||||||
| Highest Quarterly Return | 5.53% | |||||||||||||||||||||||||||||||||||||||||||||
| Highest Quarterly Return, Date | Dec. 31, 2023 | |||||||||||||||||||||||||||||||||||||||||||||
| Lowest Quarterly Return, Label [Optional Text] | lowest return for a quarter | |||||||||||||||||||||||||||||||||||||||||||||
| Lowest Quarterly Return | (4.76%) | |||||||||||||||||||||||||||||||||||||||||||||
| Lowest Quarterly Return, Date | Mar. 31, 2022 | |||||||||||||||||||||||||||||||||||||||||||||
| Performance Table Market Index Changed | As a result of new regulatory requirements, the Fund’s regulatory or primary index previously changed from the ICE BofA 3-7 Year AAA-AA Municipal Securities Index to the ICE BofA U.S. Municipal Securities Index. | |||||||||||||||||||||||||||||||||||||||||||||
| Performance Table Uses Highest Federal Rate | After-tax returns are calculated using the historical highest individual federal marginal income tax rate, and do not reflect the impact of state and local taxes. | |||||||||||||||||||||||||||||||||||||||||||||
| Performance Table Not Relevant to Tax Deferred | Actual after-tax returns depend on the investor’s tax situation and may differ from those shown. After-tax returns shown are not relevant to shareholders who hold Fund shares through tax-deferred arrangements such as 401(k) plans or Individual Retirement Accounts. | |||||||||||||||||||||||||||||||||||||||||||||
| Performance Table Explanation after Tax Higher | The Fund Return After Taxes on Distributions and Sale of Shares may be higher than other return figures when a capital loss occurs upon the redemption of Fund shares. | |||||||||||||||||||||||||||||||||||||||||||||
| Performance [Table] |
|
|||||||||||||||||||||||||||||||||||||||||||||
| Average Annual Return, Caption [Optional Text] | Average Annual Total Returns (for the periods ended 12/31/2025) | |||||||||||||||||||||||||||||||||||||||||||||
| Index No Deduction for Fees, Expenses, or Taxes [Text] | (reflects no deduction for fees, expenses, or income and withholding taxes) | |||||||||||||||||||||||||||||||||||||||||||||
| Performance Table Closing [Text Block] | After-tax returns are calculated using the historical highest individual federal marginal income tax rate, and do not reflect the impact of state and local taxes. Actual after-tax returns depend on the investor’s tax situation and may differ from those shown. After-tax returns shown are not relevant to shareholders who hold Fund shares through tax-deferred arrangements such as 401(k) plans or Individual Retirement Accounts. The Fund Return After Taxes on Distributions and Sale of Shares may be higher than other return figures when a capital loss occurs upon the redemption of Fund shares. |