Feb. 27, 2026
Indexperts
Quality Earnings Focused ETF (the “Fund”) seeks total return.
This table describes the fees and expenses that you may pay if you buy, hold, and sell shares of the Fund (“Shares”). Investors purchasing or selling Shares in the secondary market may be subject to costs (including customary brokerage commissions) charged by their broker. These costs are not included in the fee table or expense example below.
| Annual Fund Operating Expenses (expenses that you pay each year as a percentage of the value of your investment) | |
| Management Fees | 0.50% |
| Other Expenses | 0.00% |
| Total Annual Fund Operating Expenses | 0.50% |
This Example is intended to help you compare the cost of investing in the Fund with the cost of investing in other funds. The Example assumes that you invest $10,000 in the Fund for the time periods indicated and then sell (or you hold) all of your shares at the end of those periods. The Example also assumes that your investment has a 5% return each year and the Fund’s operating expenses remain the same. Although your actual costs may be higher or lower, based on these assumptions your costs would be:
|
1 Year
|
3 Years
|
5 Year
|
10 Year
|
| $51 |
$160 |
$280 |
$628 |
The Fund may pay transaction costs, such as commissions, when it buys and sells securities (or “turns over” its portfolio). A higher portfolio turnover rate may indicate higher transaction costs and may result in higher taxes when Shares are held in a taxable account. These costs, which are not reflected in Annual Fund Operating Expenses or in the Example, affect the Fund’s performance. For the fiscal year ended October 31, 2025, the portfolio turnover rate was 22.21%.
As an actively managed exchange-traded fund (“ETF”), the Fund will not seek to
replicate the performance of an index. Under normal circumstances, the Fund seeks to achieve its investment objective by investing at least 80% of the Fund’s net assets (plus borrowings for investment purposes) in common stocks of companies that
the Funds’ investment advisor, Indexperts, LLC (the “Advisor”), believes have a consistent history of earnings stability or growth, and strong prospects for continued earnings stability and growth based on the Advisor’s research and
analysis. These securities may be of any market capitalization.
The Fund will generally invest in a group of domestic equity securities selected from the components of a blend
of the Indexperts Large Cap Core Growth Index, Indexperts Large Cap Core Value Index, Indexperts Mid Cap Consistent Value Index, and the Indexperts Small Cap Consistent Value Index, but the Advisor will adjust the sector allocation, style exposure,
or specific securities based on market conditions in its discretion based on the factors described below. For example, the Advisor may decide that the target allocation between the four indices should be adjusted, or a specific stock in one or
both indices carries risks not captured by the security selection methodology of the indices (e.g., Merger & Acquisition risk) and
exclude it from the portfolio, or that an entire industry should be excluded based factors that have broad ranging impact such as regulatory, tax or technological changes.
Target allocations may be adjusted by the Advisor based on its judgment and analysis of both broad market
conditions and individual securities. This analysis considers: Federal Reserve interest rate policy; analysis of trading volume and market sentiment indicators including bid and ask volumes; recent growth or decline trends in markets, market
sectors and individual securities; market averages for per share financial data based on earnings, revenues, net income and dividends and the comparison to individual securities within the indices; and other factors.
The Indexperts Large Cap Core Growth Index, Indexperts Large Cap Core Value Index, Indexperts Mid Cap Consistent
Value Index, and the Indexperts Small Cap Consistent Value Index are proprietary indices. The Fund will generally seek to have 20% of the Fund’s portfolio match the components of the Indexperts Large Cap Core Growth Index, 50% of the Fund’s
portfolio match the components of the Indexperts Large Cap Core Value Index, 15% of the Fund’s portfolio match the components of the Indexperts Mid Cap Consistent Value Index, and 15% of the Fund’s portfolio match the components of the Indexperts
Small Cap Consistent Value Index.
The Indexperts Large Cap Core Growth Index determines its constituent securities by starting with a universe of
500 large cap stocks that meet are in the 25th percentile or greater in trading volume and average daily float of shares trading. Next, a composite growth score is calculated for each security using variables including profitability,
liquidity, operating efficiency, momentum, revenue growth, earnings growth, earnings variability, and expectations of the potential for deviation from consensus forecasts based on information provided in filed financial reports and financial
analyst reports. The indexing model then attempts to maximize the portfolio’s composite growth. The Indexperts Large Cap Core Growth Index is rebalanced annually and reconstituted annually.
The Indexperts Large Cap Core Value Index determines its constituent securities by starting with a universe of
500 large cap stocks that meet are in the 25th percentile or greater in trading volume and average daily float of shares trading. Next, a composite value score is calculated for each security using variables including profitability, liquidity,
operating efficiency, momentum, revenue growth, earnings variability, and expectations of the potential for deviation from consensus forecasts based on information provided in filed financial reports and financial analyst reports. The indexing
model then attempts to maximize the portfolio’s composite value score within the bounds of certain constraints such as turnover limits and maximum number of constituents. The Indexperts Large Cap Core Value Index is rebalanced annually and
reconstituted annually.
The Indexperts Mid Cap Consistent Value Index determines its constituent securities by starting with a universe
of 3000 large-, mid-, and small-cap stocks that meet are in the 25th percentile or greater in trading volume and average daily float of shares trading. Next, a composite value score is calculated for each security using variables including
profitability, liquidity, operating efficiency, momentum, revenue growth, earnings variability, and expectations of the potential for deviation from consensus forecasts based on information provided in filed financial reports and financial analyst
reports. The indexing model then attempts to maximize the portfolio’s composite value score within the bounds of certain constraints such as turnover limits and maximum number of constituents with preference given to stocks in the starting universe
that are identified as mid-cap (defined as stocks with a market cap ranking between 501 and 1000). The Indexperts Mid Cap Consistent Value Index is rebalanced annually and reconstituted annually.
The Indexperts Small Cap Consistent Value Index determines its constituent securities by starting with a
universe of 3000 large-, mid-, and small-cap stocks that meet are in the 25th percentile or greater in trading volume and average daily float of shares trading. Next, a composite value score is calculated for each security using
variables including profitability, liquidity, operating efficiency, momentum, revenue growth, earnings variability, and expectations of the potential for deviation from consensus forecasts based on information provided in filed financial reports
and financial analyst reports. The indexing model then attempts to maximize the portfolio’s composite value score within the bounds of certain constraints such as turnover limits and maximum number of constituents with preference given to stocks in
the starting universe that are identified as small cap (defined as stocks with a market cap ranking between 1001 and 3000). The Indexperts Small Cap Consistent Value Index is rebalanced annually and reconstituted annually.
The Advisor will review the portfolio and prevailing market conditions at least monthly, or more frequently
based market events. The Advisor may buy or sell a portfolio security as part of the review, or as reconstitution and rebalancing of the underlying indices, used to inform security selection, occurs.
As an actively managed ETF that does not seek to replicate the performance of a specified index, the Fund may
have a higher degree of portfolio turnover than funds that seek to replicate the performance of an index.
From time to time, the Fund may focus its investments in one or more particular sectors. As of October 31,
2025, the Fund focused its investments in the Industrials and Technology sectors.
The following bar chart and tables provide an indication of the risks of investing in the Fund by showing changes in the Fund’s performance from year to year and by showing how the average annual total returns compared to that of a broad-based securities market index. The Fund’s past performance (before and after taxes) is not necessarily an indication of how the Fund will perform in the future. Updated performance information on the Fund’s results can be obtained by visiting https://etfpages.com/QIDX.
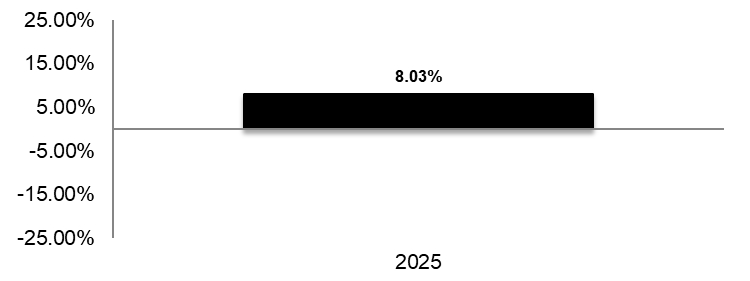
During the periods shown in the bar chart above, the Fund’s highest quarterly return was 5.81% (quarter ended June 30, 2025) and the Fund’s lowest quarterly return was -1.94% (quarter ended December 31, 2025).
| Average Annual Total Returns Period Ended December 31, 2025 | Past 1 Year | Since Inception1 |
| Institutional Class Shares | ||
| Before taxes | 8.03% | 8.03% |
| After taxes on distributions | 7.65% | 7.65% |
| After taxes on distributions and sale of shares | 4.75% | 4.75% |
| S&P 500 Index (reflects no deductions for fees and expenses) | 17.88% | 17.88% |
1 The Fund commenced operations on December 31, 2024.
After-tax returns are calculated using the historical highest individual federal marginal income tax rates and do not reflect the impact of state and local taxes. Actual after-tax returns depend on an investor’s tax situation and may differ from those shown and are not applicable to investors who hold Fund shares through tax-deferred arrangements such as a 401(k) plan or an individual retirement account (IRA).