Feb. 27, 2026
Indexperts Yield
Focused Fixed Income ETF (the “Fund”) seeks current income.
This table describes the fees and expenses that you may pay if you buy, hold, and sell shares of the Fund (“Shares”). Investors purchasing or selling Shares in the secondary market may be subject to costs (including customary brokerage commissions) charged by their broker. These costs are not included in the fee table or expense example below.
| Annual Fund Operating Expenses (expenses that you pay each year as a percentage of the value of your investment) | |
| Management Fees | 0.50% |
| Other Expenses | 0.00% |
| Total Annual Fund Operating Expenses | 0.50% |
This Example is intended to help you compare the cost of investing in the Fund with the cost of investing in other funds. The Example assumes that you invest $10,000 in the Fund for the time periods indicated and then sell (or you hold) all of your shares at the end of those periods. The Example also assumes that your investment has a 5% return each year and the Fund’s operating expenses remain the same. Although your actual costs may be higher or lower, based on these assumptions your costs would be:
|
1 Year
|
3 Years
|
5 Year
|
10 Year
|
| $51 |
$160 |
$280 |
$628 |
The Fund may pay transaction costs, such as commissions, when it buys and sells securities (or “turns over” its portfolio). A higher portfolio turnover rate may indicate higher transaction costs and may result in higher taxes when Shares are held in a taxable account. These costs, which are not reflected in Annual Fund Operating Expenses or in the Example, affect the Fund’s performance. For the fiscal year ended October 31, 2025, the portfolio turnover rate was 3.87%.
As an actively managed exchange-traded fund (“ETF”), the Fund will not seek to
replicate the performance of an index. The Fund seeks to achieve its investment objective by investing primarily in investment grade, fixed income securities. Under normal market conditions, the Fund will invest at least 80% of its net assets
(plus the amount of borrowings for investment purposes) in fixed-income securities. These fixed-income securities will include corporate bonds, Treasury notes, bills and bonds, asset backed securities and preferred stocks.
The fixed income securities in which the Fund invests will typically be domestic investment grade (rated Baa2 or
better by Moody’s Investors Services, Inc. (“Moody’s”) or rated BBB or better by Standard & Poor’s (“S&P”) and unrated securities considered by the Advisor to be of comparable credit quality). The Fund will invest in these securities with
the intention to buy and hold such securities to maturity. The Fund may invest in fixed-income securities of any maturity or duration. The average maturity or duration of the Fund’s portfolio of fixed income securities will vary based on the
Advisor’s assessment of economic and market conditions, as well as current and anticipated changes in interest rates. The Fund may also invest in certain preferred stocks with yields comparable to bonds of similar credit quality.
The Fund will invest in fixed income securities that the Funds’ investment advisor, Indexperts, LLC (the “Advisor”),
believes will offer attractive cash flow and yield characteristics. The Fund will invest in fixed income securities across various sectors. The portfolio will primarily invest in corporate fixed income securities, but it may also hold U.S.
Treasuries and preferred stocks based on the Advisor’s view of relative yield based on differences in credit quality in order to achieve some diversity in credit quality, maturity range, and expected duration. Relative yield refers to the typical
yield spread differences between bonds with different credit quality and maturities, and the yield difference for the same company issuing both corporate debt and preferred stocks. As the spreads widen or narrow, the relative attractiveness of
securities when compared to one another is a factor of consideration in portfolio composition decisions.
The Advisor analyzes fundamental and technical data for investment grade fixed income securities. The approach
screens eligible fixed income securities for credit rating, coupon, yield to worst, and maturity date. Based upon these variables, weights are then assigned regarding target company and sector exposure. Management then uses the information
generated to select fixed income securities that maximize cash flow and yield for the Fund based on current market conditions, the Fund’s current composition of fixed income securities with different credit quality, maturity, and duration, and the
Advisor’s assessment of current and expected future fixed income market conditions. given perceived risk characteristics of a given credit.
The Advisor will review the portfolio and prevailing market conditions at least monthly. The Advisor may buy or
sell a portfolio security as part of this monthly review, or when there is a reconstitution of the underlying models used to inform security selection. The models are reviewed for possible reconstitution on a quarterly basis. The Advisor may also
sell a portfolio security other than as part of a reconstitution of the models if the Advisor believes there is a possibility or likelihood of a change in the credit quality of such portfolio security, or if there is a potential for negative change
in the issuers financial health or future prospects.
The Fund seeks to maintain a 2-4% cash allocation at any given point as a buffer for any additional
purchase opportunities that may arise.
As an actively managed ETF that does not seek to replicate the performance of a specified index, the Fund may
have a higher degree of portfolio turnover than funds that seek to replicate the performance of an index.
From time to time, the Fund may focus its investments in one or more particular sectors. As of October 31,
2025, the Fund focused its investments in the Utilities, Energy, and Financial sectors.
The following bar chart and tables provide an indication of the risks of investing in the Fund by showing changes in the Fund’s performance from year to year and by showing how the average annual total returns compared to that of a broad-based securities market index and a style-specific index (one reflecting the market segments in which the Fund invests). The Fund’s past performance (before and after taxes) is not necessarily an indication of how the Fund will perform in the future. Updated performance information on the Fund’s results can be obtained by visiting https://etfpages.com/YFFI.
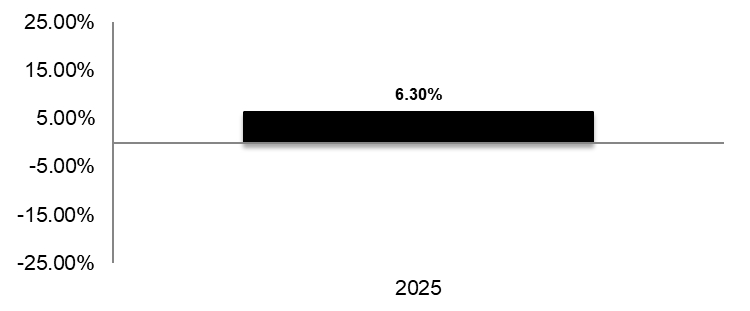
During the periods shown in the bar chart above, the Fund’s highest quarterly return was 2.65% (quarter ended September 30, 2025) and the Fund’s lowest quarterly return was 0.79% (quarter ended March 31, 2025).
After-tax returns are calculated using the historical highest individual federal marginal income tax rates and do not reflect the impact of state and local taxes. Actual after-tax returns depend on an investor’s tax situation and may differ from those shown and are not applicable to investors who hold Fund shares through tax-deferred arrangements such as a 401(k) plan or an individual retirement account (IRA).