The following bar chart and table below provide some indication of the risks of investing in the Fund by showing changes in the performance of Class N Shares of the Fund from year to year and by showing how the Fund’s Class A, Class C and Class N average annual returns compare with those of a broad measure of market performance. The Class A sales charge is reflected in the average annual total return table. Past performance (before and after taxes) does not necessarily indicate how a Fund will perform in the future. Updated performance information is available at no cost by visiting www.dunham.com or by calling toll free (888) 3DUNHAM (338-6426).
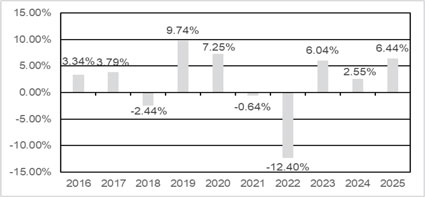
During the periods shown in the bar chart, the highest return for a quarter was 6.43% (quarter ended December 31, 2023) and the lowest return for a quarter was -5.48% (quarter ended June 30, 2022).
| For the periods ended December 31, 2025 | 1 Year | 5 Years | 10 Years |
| Class N Shares | |||
| return before taxes | 6.44% | 0.15% | 2.18% |
| return after taxes on distributions | 4.58% | -1.11% | 1.02% |
| return after taxes on distributions and sale of Fund shares | 3.78% | -0.43% | 1.16% |
| Class C Shares | |||
| return before taxes | 5.63% | -0.61% | 1.42% |
| Class A Shares | |||
| return before taxes | 1.44% | -1.01% | 1.46% |
| Bloomberg U.S. Aggregate Bond Index (reflects no deduction for fees, expenses, or taxes) | 7.30% | -0.36% | 2.01% |
| Morningstar Intermediate Core-Plus Bond Category (return before taxes)* | 8.11% | 0.68% | 2.05% |
| * | The Morningstar Intermediate Core-Plus Bond Category is generally representative of intermediate-term bond mutual funds that primarily invest in corporate and other investment-grade U.S. fixed-income securities and typically have durations of 3.5 to 6.0 years. Funds in this category also invest in high-yield and foreign bonds. |
After-tax returns are estimated and are based on the highest historical individual federal marginal income tax rates, and do not reflect the impact of state and local taxes; actual after-tax returns depend on an individual investor’s tax situation and are likely to differ from those shown. If you own shares of the Fund in a tax-deferred account, such as an individual retirement account or a 401(k) plan, this information is not applicable to your investment, because such accounts are only subject to taxes upon distribution. After tax returns for Class C and Class A shares, which are not shown, will vary from those of Class N shares.
The following bar chart and table below provide some indication of the risks of investing in the Fund by showing changes in the performance of Class N Shares of the Fund from year to year and by showing how the Fund’s Class A, Class C and Class N average annual returns compare with those of a broad measure of market performance. The Class A sales charge is reflected in the average annual total return table. Past performance (before and after taxes) does not necessarily indicate how a Fund will perform in the future. Updated performance information is available at no cost by visiting www.dunham.com or by calling toll free (888) 3DUNHAM (338-6426).
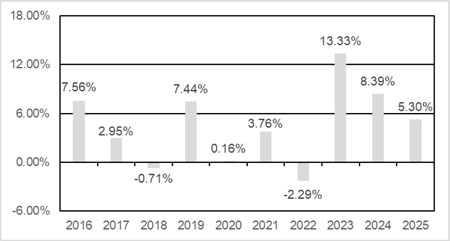
During the periods shown in the bar chart, the highest return for a quarter was 6.98% (quarter ended June 30, 2020) and the lowest return for a quarter was -12.29% (quarter ended March 31, 2020).
| For the periods ended December 31, 2025 | 1 Year | 5 Years | 10 Years |
| Class N Shares | |||
| return before taxes | 5.30% | 5.57% | 4.49% |
| return after taxes on distributions | 2.18% | 2.63% | 2.18% |
| return after taxes on distributions and sale of Fund shares | 3.10% | 2.96% | 2.41% |
| Class C Shares | |||
| return before taxes | 4.64% | 4.78% | 3.72% |
| Class A Shares | |||
| return before taxes | 0.28% | 4.35% | 3.76% |
| Bloomberg U.S. Aggregate Bond Index (reflects no deduction for fees, expenses, or taxes) | 7.30% | -0.36% | 2.01% |
| Morningstar LSTA U.S. Leveraged Loan 100 Index (reflects no deduction for fees, expenses, or taxes) | 7.35% | 6.32% | 5.81% |
| Morningstar Bank Loan Category (return before taxes)* | 6.06% | 6.29% | 5.76% |
| * | The Morningstar Bank Loan Category is generally representative of mutual funds that primarily invest in floating-rate bank loans instead of bonds. These bank loans generally offer interest payments that typically float above a common short-term benchmark such as the Interbank Offered Rate, or IBOR, or the Secured Overnight Financing Rate (SOFR). |
After-tax returns are estimated and are based on the highest historical individual federal marginal income tax rates, and do not reflect the impact of state and local taxes; actual after-tax returns depend on an individual investor’s tax situation and are likely to differ from those shown. If you own shares of the Fund in a tax-deferred account, such as an individual retirement account or a 401(k) plan, this information is not applicable to your investment, because such accounts are only subject to taxes upon distribution. After tax returns for Class C and Class A shares, which are not shown, will vary from those of Class N shares.
The following bar chart and table below provide some indication of the risks of investing in the Fund by showing changes in the performance of Class N Shares of the Fund from year to year and by showing how the Fund’s Class A, Class C and Class N average annual returns compare with those of a broad measure of market performance. The Class A sales charge is reflected in the average annual total return table. Past performance (before and after taxes) does not necessarily indicate how a Fund will perform in the future. Updated performance information is available at no cost by visiting www.dunham.com or by calling toll free (888) 3DUNHAM (338-6426).
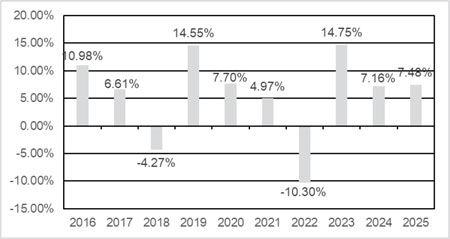
During the periods shown in the bar chart, the highest return for a quarter was 9.20% (quarter ended June 30, 2020) and the lowest return for a quarter was -11.13% (quarter ended March 31, 2020).
| For the periods ended December 31, 2025 | 1 Year | 5 Years | 10 Years |
| Class N Shares | |||
| return before taxes | 7.48% | 4.47% | 5.69% |
| return after taxes on distributions | 4.76% | 2.06% | 3.40% |
| return after taxes on distributions and sale of Fund shares | 4.38% | 2.34% | 3.36% |
| Class C Shares | |||
| return before taxes | 6.74% | 3.70% | 4.91% |
| Class A Shares | |||
| return before taxes | 2.43% | 3.28% | 4.94% |
| Bloomberg U.S. Aggregate Bond Index (reflects no deduction for fees, expenses, or taxes) | 7.30% | -0.36% | 2.01% |
| Bloomberg U.S. Corporate High-Yield Bond Ba/B 2% Issuer Capped Index (reflects no deduction for fees, expenses, or taxes) | 8.78% | 4.11% | 6.15% |
| Morningstar High-Yield Bond Category (return before taxes)* | 8.80% | 4.87% | 6.27% |
| * | The Morningstar High-Yield Bond Category is generally representative of mutual funds that primarily invest in U.S. high-income debt securities where at least 65% or more of bond assets are not rated or are rated by a major agency such as Standard & Poor’s or Moody’s at the level of BB (considered speculative for taxable bonds) and below. |
After-tax returns are estimated and are based on the highest historical individual federal marginal income tax rates, and do not reflect the impact of state and local taxes; actual after-tax returns depend on an individual investor’s tax situation and are likely to differ from those shown. If you own shares of the Fund in a tax-deferred account, such as an individual retirement account or a 401(k) plan, this information is not applicable to your investment, because such accounts are only subject to taxes upon distribution. In certain cases, after-tax returns may be higher than the other return figures for the same period. After tax returns for Class C and Class A shares, which are not shown, will vary from those of Class N shares.
The following bar chart and table below provide some indication of the risks of investing in the Fund by showing changes in the performance of Class N Shares of the Fund from year to year and by showing how the Fund’s Class A, Class C and Class N average annual returns compare with those of a broad measure of market performance. The Class A sales charge is reflected in the average annual total return table. Past performance (before and after taxes) does not necessarily indicate how a Fund will perform in the future. Updated performance information is available at no cost by visiting www.dunham.com or by calling toll free (888) 3DUNHAM (338-6426).
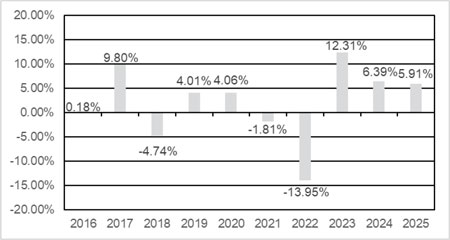
During the periods shown in the bar chart, the highest return for a quarter was 14.75% (quarter ended June 30, 2020) and the lowest return for a quarter was -16.18% (quarter ended March 31, 2020).
| For the periods ended December 31, 2025 | 1 Year | 5 Years | 10 Years |
| Class N Shares | |||
| return before taxes | 5.91% | 1.35% | 1.95% |
| return after taxes on distributions | 4.97% | -0.27% | 0.96% |
| return after taxes on distributions and sale of Fund shares | 3.49% | 0.29% | 1.07% |
| Class C Shares | |||
| return before taxes | 5.25% | 0.62% | 1.19% |
| Class A Shares | |||
| return before taxes | 1.02% | 0.19% | 1.24% |
| Bloomberg Global Aggregate Bond ex-US Index Unhedged (reflects no deduction for fees, expenses, or taxes) | 8.85% | -3.59% | 0.56% |
| Bloomberg Global Aggregate Bond ex-US Total Return Index Hedged (reflects no deduction for fees, expenses, or taxes) | 2.80% | 0.79% | 2.57% |
| Morningstar Global Bond Category (return before taxes)* | 10.25% | -0.25% | 2.00% |
| * | The Morningstar Global Bond Category is generally representative of funds that invest at least 40% of bonds in foreign markets. |
After-tax returns are estimated and are based on the highest historical individual federal marginal income tax rates, and do not reflect the impact of state and local taxes; actual after-tax returns depend on an individual investor’s tax situation and are likely to differ from those shown. If you own shares of the Fund in a tax-deferred account, such as an individual retirement account or a 401(k) plan, this information is not applicable to your investment, because such accounts are only subject to taxes upon distribution. After tax returns for Class C and Class A shares, which are not shown, will vary from those of Class N shares.
The following bar chart and table below provide some indication of the risks of investing in the Fund by showing changes in the performance of Class N Shares of the Fund from year to year and by showing how the Fund’s Class A, Class C and Class N average annual returns compare with those of a broad measure of market performance. The Class A sales charge is reflected in the average annual total return table. Past performance (before and after taxes) does not necessarily indicate how a Fund will perform in the future. Updated performance information is available at no cost by visiting www.dunham.com or by calling toll free (888) 3DUNHAM (338-6426).
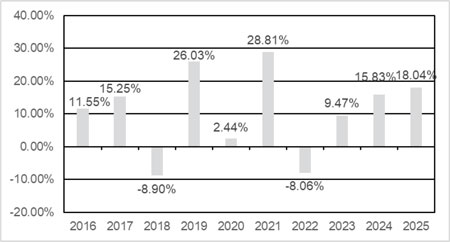
During the periods shown in the bar chart, the highest return for a quarter was 14.52% (quarter ended December 31, 2020) and the lowest return for a quarter was -25.33% (quarter ended March 31, 2020).
| For the periods ended December 31, 2025 | 1 Year | 5 Years | 10 Years |
| Class N Shares | |||
| return before taxes | 18.04% | 12.13% | 10.36% |
| return after taxes on distributions | 16.68% | 10.77% | 9.35% |
| return after taxes on distributions and sale of Fund shares | 11.62% | 9.41% | 8.29% |
| Class C Shares | |||
| return before taxes | 16.85% | 11.01% | 9.26% |
| Class A Shares | |||
| return before taxes | 10.92% | 10.53% | 9.43% |
| S&P 500 Total Return Index (reflects no deduction for fees, expenses, or taxes) | 17.88% | 14.42% | 14.82% |
| Russell 1000® Value Index (reflects no deduction for fees, expenses, or taxes) | 15.91% | 11.33% | 10.53% |
| Morningstar US Large-Mid Cap Broad Value Index (reflects no deduction for fees, expenses, or taxes)* | 18.83% | 13.38% | 12.50% |
| Morningstar Large Cap Value Category (return before taxes)** | 15.79% | 12.54% | 12.11% |
| * | The Fund has added this additional benchmark. |
| ** | The Morningstar Large Cap Value Category is generally representative of mutual funds that primarily invest in big (large capitalization) U.S. companies that are less expensive or growing more slowly than other large-cap stocks. |
After-tax returns are estimated and are based on the highest historical individual federal marginal income tax rates, and do not reflect the impact of state and local taxes; actual after-tax returns depend on an individual investor’s tax situation and are likely to differ from those shown. If you own shares of the Fund in a tax-deferred account, such as an individual retirement account or a 401(k) plan, this information is not applicable to your investment, because such accounts are only subject to taxes upon distribution. After tax returns for Class C and Class A shares, which are not shown, will vary from those of Class N shares.
The following bar chart and table below provide some indication of the risks of investing in the Fund by showing changes in the performance of Class N Shares of the Fund from year to year and by showing how the Fund’s Class A, Class C and Class N average annual returns compare with those of a broad measure of market performance. The Class A sales charge is reflected in the average annual total return table. Past performance (before and after taxes) does not necessarily indicate how a Fund will perform in the future. Updated performance information is available at no cost by visiting www.dunham.com or by calling toll free (888) 3DUNHAM (338-6426).
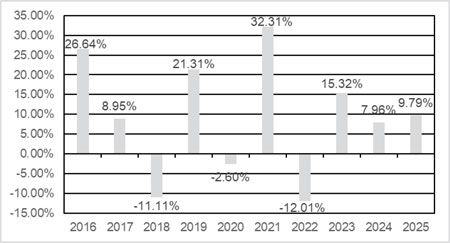
During the periods shown in the bar chart, the highest return for a quarter was 26.79% (quarter ended December 31, 2020) and the lowest return for a quarter was -35.47% (quarter ended March 31, 2020).
| For the periods ended December 31, 2025* | 1 Year* | 5 Years* | 10 Years* |
| Class N Shares | |||
| return before taxes | 9.79% | 9.74% | 8.71% |
| return after taxes on distributions | 7.36% | 6.92% | 6.44% |
| return after taxes on distributions and sale of Fund shares | 5.95% | 6.71% | 6.19% |
| Class C Shares | |||
| return before taxes | 8.70% | 8.67% | 7.63% |
| Class A Shares | |||
| return before taxes | 3.23% | 8.18% | 7.80% |
| S&P 500 Total Return Index (reflects no deduction for fees, expenses, or taxes) | 17.88% | 14.42% | 14.82% |
| Russell 2000® Value Index (reflects no deduction for fees, expenses, or taxes) | 12.59% | 8.88% | 9.27% |
| Morningstar US Small Cap Broad Value Extended Index (reflects no deduction for fees, expenses, or taxes)** | 10.48% | 10.32% | 9.50% |
| Morningstar Small Cap Value Category (return before taxes)*** | 7.93% | 10.93% | 11.51% |
| * | On April 1, 2024, the Fund’s principal investment strategies were substantially changed. Therefore, the performance prior to each date may have been different had the current principal investment strategies been in place. |
| ** | The Fund has added this additional benchmark. |
| *** | The Morningstar Small Cap Value Category is generally representative of mutual funds that primarily invest in Small (small capitalization) U.S. companies that are less expensive or growing more slowly than other small-cap stocks. |
After-tax returns are estimated and are based on the highest historical individual federal marginal income tax rates, and do not reflect the impact of state and local taxes; actual after-tax returns depend on an individual investor’s tax situation and are likely to differ from those shown. If you own shares of the Fund in a tax-deferred account, such as an individual retirement account or a 401(k) plan, this information is not applicable to your investment, because such accounts are only subject to taxes upon distribution. After tax returns for Class C and Class A shares, which are not shown, will vary from those of Class N.
The following bar chart and table below provide some indication of the risks of investing in the Fund by showing changes in the performance of Class N Shares of the Fund from year to year and by showing how the Fund’s Class A, Class C and Class N average annual returns compare with those of a broad measure of market performance. The Class A sales charge is reflected in the average annual total return table. Past performance (before and after taxes) does not necessarily indicate how a Fund will perform in the future. Updated performance information is available at no cost by visiting www.dunham.com or by calling toll free (888) 3DUNHAM (338-6426).
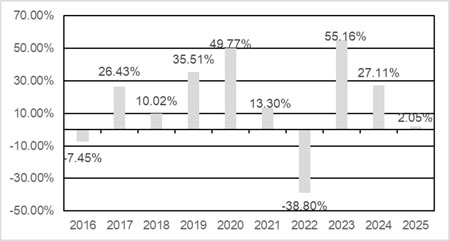
During the periods shown in the bar chart, the highest return for a quarter was 36.19% (quarter ended June 30, 2020) and the lowest return for a quarter was -26.95% (quarter ended June 30, 2022).
| For the periods ended December 31, 2025 | 1 Year | 5 Years | 10 Years |
| Class N Shares | |||
| return before taxes | 2.05% | 6.89% | 13.81% |
| return after taxes on distributions | -1.24% | 5.10% | 12.46% |
| return after taxes on distributions and sale of Fund shares | 3.55% | 5.34% | 11.43% |
| Class C Shares | |||
| return before taxes | 1.05% | 5.83% | 12.67% |
| Class A Shares | |||
| return before taxes | -4.07% | 5.37% | 12.86% |
| S&P 500 Total Return Index (reflects no deduction for fees, expenses, or taxes) | 17.88% | 14.42% | 14.82% |
| Russell 1000® Growth Index (reflects no deduction for fees, expenses, or taxes) | 18.70% | 15.35% | 18.14% |
| Morningstar US Large-Mid Cap Broad Growth Index (reflects no deduction for fees, expenses, or taxes)* | 16.67% | 13.44% | 16.49% |
| Morningstar Large Cap Growth Category (return before taxes)** | 16.64% | 12.24% | 15.72% |
| * | The Fund has added this additional benchmark. |
| ** | The Morningstar Large Cap Growth Category Index is generally representative of mutual funds that primarily invest in big (large capitalization) U.S. companies that are projected to grow faster than other large-cap stocks. |
After-tax returns are estimated and are based on the highest historical individual federal marginal income tax rates, and do not reflect the impact of state and local taxes; actual after-tax returns depend on an individual investor’s tax situation and are likely to differ from those shown. If you own shares of the Fund in a tax-deferred account, such as an individual retirement account or a 401(k) plan, this information is not applicable to your investment, because such accounts are only subject to taxes upon distribution. In certain cases, after-tax returns may be higher than the other return figures for the same period. After tax returns for Class C and Class A shares, which are not shown, will vary from those of Class N shares.
The following bar chart and table below provide some indication of the risks of investing in the Fund by showing changes in the performance of Class N Shares of the Fund from year to year and by showing how the Fund’s Class A, Class C and Class N average annual returns compare with those of a broad measure of market performance. The Class A sales charge is reflected in the average annual total return table. Past performance (before and after taxes) does not necessarily indicate how a Fund will perform in the future. Updated performance information is available at no cost by visiting www.dunham.com or by calling toll free (888) 3DUNHAM (338-6426).
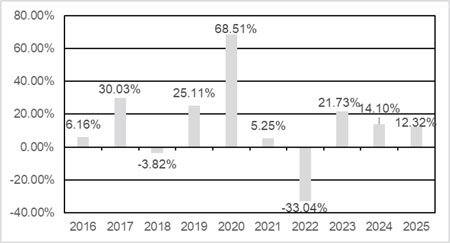
During the periods shown in the bar chart, the highest return for a quarter was 41.61% (quarter ended June 30, 2020) and the lowest return for a quarter was -24.96% (quarter ended December 31, 2018).
| For the periods ended December 31, 2025 | 1 Year | 5 Years | 10 Years |
| Class N Shares | |||
| return before taxes | 12.32% | 1.91% | 11.90% |
| return after taxes on distributions | 11.35% | 0.67% | 9.43% |
| return after taxes on distributions and sale of Fund shares | 8.01% | 1.16% | 8.84% |
| Class C Shares | |||
| return before taxes | 11.20% | 0.90% | 10.79% |
| Class A Shares | |||
| return before taxes | 5.61% | 0.46% | 10.96% |
| S&P 500 Total Return Index (reflects no deduction for fees, expenses, or taxes) | 17.88% | 14.42% | 14.82% |
| Russell 2000® Growth Index (reflects no deduction for fees, expenses, or taxes) | 13.01% | 3.18% | 9.57% |
| Morningstar US Small Cap Broad Growth Extended Index (reflects no deduction for fees, expenses, or taxes)* | 13.12% | 4.22% | 9.92% |
| Morningstar Small Cap Growth Category (return before taxes)** | 8.83% | 3.95% | 11.13% |
| * | The Fund has added this additional benchmark. |
| ** | The Morningstar Small Cap Growth Category is generally representative of mutual funds that primarily invest in small (small capitalization) U.S. companies that are projected to grow faster than other small-cap stocks. |
After-tax returns are estimated and are based on the highest historical individual federal marginal income tax rates, and do not reflect the impact of state and local taxes; actual after-tax returns depend on an individual investor’s tax situation and are likely to differ from those shown. If you own shares of the Fund in a tax-deferred account, such as an individual retirement account or a 401(k) plan, this information is not applicable to your investment, because such accounts are only subject to taxes upon distribution. After tax returns for Class C and Class A shares, which are not shown, will vary from those of Class N shares.
The following bar chart and table below provide some indication of the risks of investing in the Fund by showing changes in the performance of Class N Shares of the Fund from year to year and by showing how the Fund’s Class A, Class C and Class N average annual returns compare with those of a broad measure of market performance. The Class A sales charge is reflected in the average annual total return table. Past performance (before and after taxes) does not necessarily indicate how a Fund will perform in the future. Updated performance information is available at no cost by visiting www.dunham.com or by calling toll free (888) 3DUNHAM (338-6426).
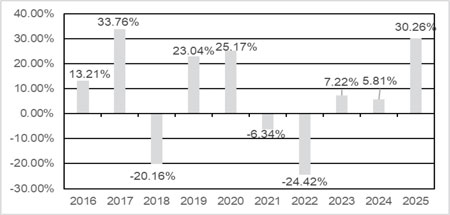
During the periods shown in the bar chart, the highest return for a quarter was 23.87% (quarter ended December 31, 2020) and the lowest return for a quarter was -23.87% (quarter ended March 31, 2020).
| For the periods ended December 31, 2025 | 1 Year | 5 Years | 10 Years |
| Class N Shares | |||
| return before taxes | 30.26% | 0.90% | 6.89% |
| return after taxes on distributions | 28.93% | -0.02% | 6.26% |
| return after taxes on distributions and sale of Fund shares | 17.91% | 0.34% | 5.34% |
| Class C Shares | |||
| return before taxes | 28.91% | -0.09% | 5.83% |
| Class A Shares | |||
| return before taxes | 22.44% | -0.52% | 6.01% |
| MSCI All Country World ex U.S. Index Net (reflects no deduction for fees, expenses, or taxes) | 32.38% | 7.91% | 8.41% |
| MSCI Emerging Markets Index Net (reflects no deduction for fees, expenses, or taxes) | 33.57% | 4.20% | 8.42% |
| Morningstar Diversified Emerging Markets Category (return before taxes)* | 31.52% | 5.25% | 8.04% |
| * | The Morningstar Diversified Emerging Markets Category is generally representative of mutual funds that primarily invest among 20 or more developing nations, with a general focus on the emerging markets of Asia and Latin America rather than on the emerging markets countries in the Middle East, Africa, or Europe. |
After-tax returns are estimated and are based on the highest historical individual federal marginal income tax rates, and do not reflect the impact of state and local taxes; actual after-tax returns depend on an individual investor’s tax situation and are likely to differ from those shown. If you own shares of the Fund in a tax-deferred account, such as an individual retirement account or a 401(k) plan, this information is not applicable to your investment, because such accounts are only subject to taxes upon distribution. After tax returns for Class C and Class A shares, which are not shown, will vary from those of Class N shares.
The following bar chart and table below provide some indication of the risks of investing in the Fund by showing changes in the performance of Class N Shares of the Fund from year to year and by showing how the Fund’s Class A, Class C and Class N average annual returns compare with those of a broad measure of market performance. The Class A sales charge is reflected in the average annual total return table. Past performance (before and after taxes) does not necessarily indicate how a Fund will perform in the future. Updated performance information is available at no cost by visiting www.dunham.com or by calling toll free (888) 3DUNHAM (338-6426).
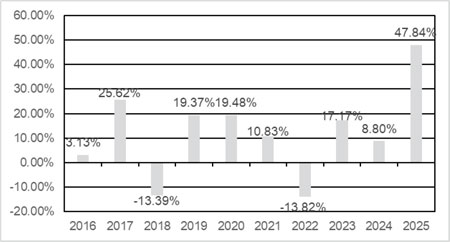
During the periods shown in the bar chart, the highest return for a quarter was 22.07% (quarter ended December 31, 2020) and the lowest return for a quarter was -23.27% (quarter ended March 31, 2020).
| For the periods ended December 31, 2025 | 1 Year | 5 Year | 10 Years |
| Class N Shares | |||
| return before taxes | 47.84% | 12.48% | 11.16% |
| return after taxes on distributions | 43.51% | 9.82% | 9.49% |
| return after taxes on distributions and sale of Fund shares | 29.71% | 9.07% | 8.66% |
| Class C Shares | |||
| return before taxes | 46.46% | 11.36% | 10.05% |
| Class A Shares | |||
| return before taxes | 39.02% | 10.88% | 10.22% |
| MSCI All Country World ex U.S. Index Net (reflects no deduction for fees, expenses, or taxes) | 32.38% | 7.91% | 8.41% |
| Morningstar Foreign Large Cap Value Category (return before taxes)* | 39.28% | 12.29% | 9.39% |
| * | The Morningstar Foreign Large Cap Value Category is generally representative of mutual funds that primarily invest in non-U.S. stocks that have market caps in the top 70% of each economically integrated market (such as Europe or Asia ex-Japan). Foreign large value portfolios invest mainly in big international stocks that are less expensive or growing more slowly than other large-cap stocks. Value is defined based on low valuations (low price ratios and high dividend yields) and slow growth (low growth rates for earnings, sales, book value, and cash flow). |
After-tax returns are estimated and are based on the highest historical individual federal marginal income tax rates, and do not reflect the impact of state and local taxes; actual after-tax returns depend on an individual investor’s tax situation and are likely to differ from those shown. If you own shares of the Fund in a tax-deferred account, such as an individual retirement account or a 401(k) plan, this information is not applicable to your investment, because such accounts are only subject to taxes upon distribution. After tax returns for Class C and Class A shares, which are not shown, will vary from those of Class N shares.
The following bar chart and table below provide some indication of the risks of investing in the Fund by showing changes in the performance of Class N Shares of the Fund from year to year and by showing how the Fund’s Class A, Class C and Class N average annual returns compare with those of a broad measure of market performance. The Class A sales charge is reflected in the average annual total return table. Past performance (before and after taxes) does not necessarily indicate how a Fund will perform in the future. Updated performance information is available at no cost by visiting www.dunham.com or by calling toll free (888) 3DUNHAM (338-6426).
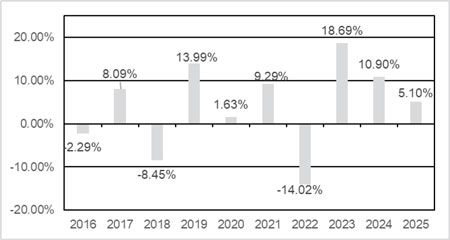
During the periods shown in the bar chart, the highest return for a quarter was 8.60% (quarter ended June 30, 2023) and the lowest return for a quarter was -12.37% (quarter ended March 31, 2020).
| For the periods ended December 31, 2025* | 1 Year | 5 Years | 10 Years |
| Class N Shares | |||
| return before taxes | 5.10% | 5.38% | 3.83% |
| return after taxes on distributions | 2.29% | 4.21% | 3.14% |
| return after taxes on distributions and sale of Fund shares | 4.65% | 3.90% | 2.83% |
| Class C Shares | |||
| return before taxes | 4.11% | 4.34% | 2.80% |
| Class A Shares | |||
| return before taxes | -1.21% | 3.89% | 2.95% |
| MSCI All Country World Index (reflects no deduction for fees, expenses, or taxes) | 22.34% | 11.19% | 11.72% |
Dow Jones Moderately Aggressive Portfolio Index (reflects no deduction for fees, expenses, or taxes) |
16.73% | 7.64% | 9.35% |
| Morningstar Tactical Allocation Category (return before taxes)** | 13.39% | 6.88% | 6.98% |
| * | On each of October 1, 2014, and February 1, 2023, the Fund’s principal investment strategies were substantially changed. Therefore, the performance prior to each date may have been different had the current principal investment strategies been in place. |
| ** | The Morningstar Tactical Allocation Category is generally representative of mutual funds that primarily actively shift allocations across investments. These include material shifts across equity regions and bond sectors on a frequent basis. To qualify for the Morningstar Tactical Allocation category, a fund must have minimum exposure of 10% in bonds and 20% in equity and the fund must historically demonstrate material shifts in sector or regional allocations, either through a gradual shift during three years or through a series of material shifts on a quarterly basis. Within a three-year period, typically, the average quarterly changes between equity regions and bond sectors exceeds 15% or the difference between the maximum and minimum exposure to a single-equity region or bond sector exceeds 50%. |
After-tax returns are estimated and are based on the highest historical individual federal marginal income tax rates, and do not reflect the impact of state and local taxes; actual after-tax returns depend on an individual investor’s tax situation and are likely to differ from those shown. If you own shares of the Fund in a tax-deferred account, such as an individual retirement account or a 401(k) plan, this information is not applicable to your investment, because such accounts are only subject to taxes upon distribution. In certain cases, after-tax returns may be higher than the other return figures for the same period. After tax returns for Class C and Class A shares, which are not shown, will vary from those of Class N shares.
The following bar chart and table below provide some indication of the risks of investing in the Fund by showing changes in the performance of Class N Shares of the Fund from year to year and by showing how the Fund’s Class A, Class C and Class N average annual returns compare with those of a broad measure of market performance. The Class A sales charge is reflected in the average annual total return table. Past performance (before and after taxes) does not necessarily indicate how a Fund will perform in the future. Updated performance information is available at no cost by visiting www.dunham.com or by calling toll free (888) 3DUNHAM (338-6426).
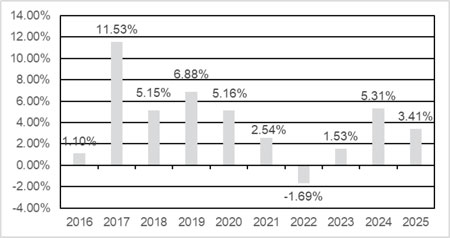
During the periods shown in the bar chart, the highest return for a quarter was 6.68% (quarter ended September 30, 2016) and the lowest return for a quarter was -6.03% (quarter ended March 31, 2016).
| For the periods ended December 31, 2025* | 1 Year | 5 Years | 10 Years |
| Class N Shares | |||
| return before taxes | 3.41% | 2.19% | 4.04% |
| return after taxes on distributions | 2.34% | 0.78% | 2.81% |
| return after taxes on distributions and sale of Fund shares | 2.01% | 1.09% | 2.64% |
| Class C Shares | |||
| return before taxes | 2.47% | 1.19% | 3.01% |
| Class A Shares | |||
| return before taxes | -2.81% | 0.74% | 3.18% |
| Bloomberg U.S. Aggregate Bond Index (reflects no deduction for fees, expenses, or taxes) | 7.30% | -0.36% | 2.01% |
| BofA Merrill Lynch 3-month Treasury Bill Index PLUS 300 bps. (reflects no deduction for fees, expenses, or taxes) | 7.24% | 6.20% | 5.19% |
| Morningstar Nontraditional Bond Category (return before taxes)** | 6.96% | 3.77% | 4.29% |
| * | On July 1, 2018, the Fund’s principal investment strategy was materially changed. Therefore, the Fund’s performance prior to that date may have been different had the current principal investment strategy been in place. |
| ** | The Morningstar Nontraditional Bond Category is generally representative of mutual funds that deploy absolute return strategies, strategies that are low-correlated to the overall bond market, and strategies that take long and short market and security-level positions. |
After-tax returns are estimated and are based on the highest historical individual federal marginal income tax rates, and do not reflect the impact of state and local taxes; actual after-tax returns depend on an individual investor’s tax situation and are likely to differ from those shown. If you own shares of the Fund in a tax-deferred account, such as an individual retirement account or a 401(k) plan, this information is not applicable to your investment, because such accounts are only subject to taxes upon distribution. After tax returns for Class C and Class A shares, which are not shown, will vary from those of Class N shares.
The following bar chart and table below provide some indication of the risks of investing in the Fund by showing changes in the performance of Class N Shares of the Fund from year to year and by showing how the Fund’s average annual returns compare with those of a broad measure of market performance. The sales charge is reflected in the average annual total return table. Past performance (before and after taxes) does not necessarily indicate how a Fund will perform in the future. Updated performance information is available at no cost by visiting www.dunham.com or by calling toll free (888) 3DUNHAM (338-6426).
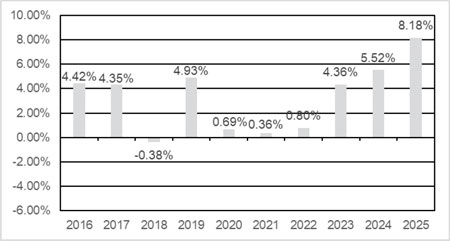
During the periods shown in the bar chart, the highest return for a quarter was 3.17% (quarter ended September 30, 2023) and the lowest return for a quarter was -4.30% (quarter ended March 31, 2020).
| For the periods ended December 31, 2025* | 1 Year | 5 Years | 10 Years |
| Class N Shares | |||
| return before taxes | 8.18% | 3.80% | 3.29% |
| return after taxes on distributions | 5.01% | 2.65% | 2.27% |
| return after taxes on distributions and sale of Fund shares | 4.78% | 2.52% | 2.21% |
| Class C Shares | |||
| return before taxes | 7.11% | 2.77% | 2.26% |
| Class A Shares | |||
| return before taxes | 1.70% | 2.33% | 2.42% |
| S&P 500 Total Return Index (reflects no deduction for fees, expenses, or taxes) | 17.88% | 14.42% | 14.82% |
| S&P Merger Arbitrage Total Return Local Currency Index** (reflects no deduction for fees, expenses, or taxes) | 12.72% | 5.55% | 4.26% |
| Credit
Suisse Merger Arbitrage Liquid Index* (reflects no deduction for fees, expenses, or taxes) |
12.53% | 6.06% | 4.63% |
| Morningstar
Event Driven Category (return before taxes)*** |
10.22% | 5.37% | 5.89% |
| * | On April 1, 2021, the Fund’s principal investment strategy was materially changed. Therefore, the Fund’s performance prior to that date may have been different had the current principal investment strategy been in place. |
| ** | In prior prospectuses, the Fund compared its performance against the Credit Suisse Merger Arbitrage Liquid Index. The Fund’s Adviser believes the S&P Merger Arbitrage Total Return Local Currency Index is a more appropriate and accurate index against which to compare the Fund’s investment strategies and, therefore, the S&P Merger Arbitrage Total Return Local Currency Index replaces the Credit Suisse Merger Arbitrage Liquid Index as the Fund’s primary benchmark. |
| *** | The Morningstar Event Driven Category is generally representative of mutual funds that primarily employ strategies that seek to profit from corporate actions, such as mergers and acquisitions. Mutual funds in this category typically focus on equity securities but can invest across the capital structure. However, they typically have low to moderate equity market sensitivity since company-specific developments tend to drive security prices. |
After-tax returns are estimated and are based on the highest historical individual federal marginal income tax rates, and do not reflect the impact of state and local taxes; actual after-tax returns depend on an individual investor’s tax situation and are likely to differ from those shown. If you own shares of the Fund in a tax-deferred account, such as an individual retirement account or a 401(k) plan, this information is not applicable to your investment, because such accounts are only subject to taxes upon distribution. After tax returns for Class C and Class A shares, which are not shown, will vary from those of Class N shares.
The following bar chart and table below provide some indication of the risks of investing in the Fund by showing changes in the performance of Class N Shares of the Fund from year to year and by showing how the Fund’s Class A, Class C and Class N average annual returns compare with those of a broad measure of market performance. The Class A sales charge is reflected in the average annual total return table. Past performance (before and after taxes) does not necessarily indicate how a Fund will perform in the future. Updated performance information is available at no cost by visiting www.dunham.com or by calling toll free (888) 3DUNHAM (338-6426).
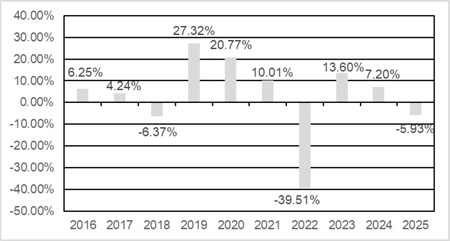
During the periods shown in the bar chart, the highest return for a quarter was 16.78% (quarter ended June 30, 2020) and the lowest return for a quarter was -19.20% (quarter ended June 30, 2022).
| For the periods ended December 31, 2025 | 1 Year | 5 Years | 10 Years |
| Class N Shares | |||
| return before taxes | -5.93% | -5.28% | 1.97% |
| return after taxes on distributions | -6.41% | -5.92% | 0.54% |
| return after taxes on distributions and sale of Fund shares | -3.51% | -3.96% | 1.28% |
| Class C Shares | |||
| return before taxes | -6.83% | -6.22% | 0.96% |
| Class A Shares | |||
| return before taxes | -11.52% | -6.63% | 1.13% |
| S&P 500 Total Return Index (reflects no deduction for fees, expenses, or taxes) | 17.88% | 14.42% | 14.82% |
| Dow Jones Global Select REIT Total Return Net Index (reflects no deduction for fees, expenses, or taxes)* | 7.39% | 3.85% | 2.98% |
| Dow Jones U.S. Real Estate Total Return Index (reflects no deduction for fees, expenses, or taxes)* | 3.78% | 4.91% | 5.81% |
| Morningstar Real Estate Category (return before taxes)** | 2.14% | 5.28% | 5.73% |
| * | In prior prospectuses, the Fund compared its performance against the Dow Jones U.S. Real Estate Total Return Index. The Fund’s Adviser believes the Dow Jones Global Select REIT Total Return Net Index is a more appropriate and accurate index against which to compare the Fund’s investment strategies and, therefore, the Dow Jones Global Select REIT Total Return Net Index replaces the Dow Jones U.S. Real Estate Total Return Index as the Fund’s primary benchmark. |
| ** | The Morningstar Real Estate Category is generally representative of mutual funds that primarily invest in REITs of various types. REITs are companies that develop and manage real estate properties. |
After-tax returns are estimated and are based on the highest historical individual federal marginal income tax rates, and do not reflect the impact of state and local taxes; actual after-tax returns depend on an individual investor’s tax situation and are likely to differ from those shown. If you own shares of the Fund in a tax-deferred account, such as an individual retirement account or a 401(k) plan, this information is not applicable to your investment, because such accounts are only subject to taxes upon distribution. After tax returns for Class C and Class A shares, which are not shown, will vary from those of Class N shares.
The following bar chart and table below provide some indication of the risks of investing in the Fund by showing the performance of Class N Shares of the Fund for the past year and by showing how the Fund’s Class A, Class C and Class N average annual returns compare with those of a broad measure of market performance. The Class A sales charge is reflected in the average annual total return table. Past performance (before and after taxes) does not necessarily indicate how a Fund will perform in the future. Updated performance information is available at no cost by visiting www.dunham.com or by calling toll free (888) 3DUNHAM (338-6426).
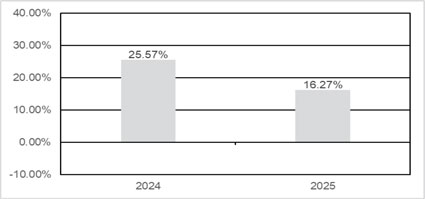
During the periods shown in the bar chart, the highest return for a quarter was 11.54% (quarter ended March 31, 2024) and the lowest return for a quarter was -5.98% (quarter ended March 31, 2025).
| For the periods ended December 31, 2025 | 1 Year | Since Inception* |
| Class N Shares | ||
| return before taxes | 16.27% | 21.01% |
| return after taxes on distributions | 9.37% | 14.19% |
| return after taxes on distributions and sale of Fund shares | 11.79% | 14.61% |
| Class C Shares | ||
| return before taxes | 15.08% | 19.83% |
| Class A Shares | ||
| return before taxes | 10.76% | 18.67% |
| S&P 500 Total Return Index (reflects no deduction for fees, expenses, or taxes) | 17.88% | 22.14% |
| Morningstar Global Moderately Conservative Allocation Category (return before taxes)** | 13.15% | 10.33% |
| * | The Dunham U.S. Enhanced Market Fund commenced operations on May 1, 2023 |
| ** | The Morningstar Global Moderately Conservative Allocation Category is generally comprised of funds and ETFs that invest in stocks, bonds, and cash to provide growth and income. These funds typically have 30–50% of their assets in equities. |
After-tax returns are estimated and are based on the highest historical individual federal marginal income tax rates, and do not reflect the impact of state and local taxes; actual after-tax returns depend on an individual investor’s tax situation and are likely to differ from those shown. If you own shares of the Fund in a tax-deferred account, such as an individual retirement account or a 401(k) plan, this information is not applicable to your investment, because such accounts are only subject to taxes upon distribution. After tax returns for Class C and Class A shares, which are not shown, will vary from those of Class N shares.