Performance Management |
Oct. 31, 2025 |
|||||||||||||||||||||||||||||||||||||||||||||||||||||||||||||||||||||||||||||||||
|---|---|---|---|---|---|---|---|---|---|---|---|---|---|---|---|---|---|---|---|---|---|---|---|---|---|---|---|---|---|---|---|---|---|---|---|---|---|---|---|---|---|---|---|---|---|---|---|---|---|---|---|---|---|---|---|---|---|---|---|---|---|---|---|---|---|---|---|---|---|---|---|---|---|---|---|---|---|---|---|---|---|---|
| abrdn Funds | abrdn Dynamic Dividend Fund | ||||||||||||||||||||||||||||||||||||||||||||||||||||||||||||||||||||||||||||||||||
| Prospectus [Line Items] | ||||||||||||||||||||||||||||||||||||||||||||||||||||||||||||||||||||||||||||||||||
| Bar Chart and Performance Table [Heading] | Performance | |||||||||||||||||||||||||||||||||||||||||||||||||||||||||||||||||||||||||||||||||
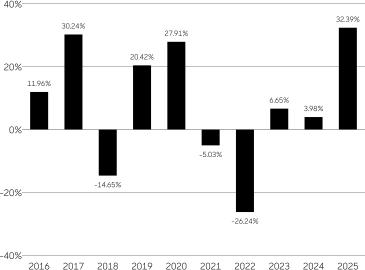
| Performance Narrative [Text Block] | The bar chart and table below can help you evaluate potential risks of the Dynamic Dividend Fund. The bar chart shows how the Fund’s annual total returns for Institutional Class shares have varied from year to year. The table following the bar chart compares the Fund’s performance over time with those of a broad measure of market performance. The table compares the Fund’s average annual total returns to the returns of the MSCI All Country World Index (Net TR)*, a broad-based securities index. Remember, however, that past performance (before and after taxes) is not necessarily indicative of how the Fund will perform in the future. For updated performance information, please visit https://www.aberdeeninvestments.com/en-us/investor/funds/view-all-funds or call 866-667-9231. The returns presented for the Fund for periods prior to May 7, 2018 reflect the performance of a Predecessor Fund (the “Predecessor Fund”), which was a registered investment company. The Fund adopted the performance of the Predecessor Fund as the result of a reorganization that occurred as of the close of business on May 4, 2018, in which the Fund acquired all of the assets, subject to the liabilities, of the Predecessor Fund. The Fund and the Predecessor Fund have substantially similar investment objectives and strategies. Returns of the Predecessor Fund have not been adjusted to reflect the expenses applicable to the respective classes of the Fund. abrdn Inc. and abrdn Investments Limited began advising and sub-advising, respectively, the Fund immediately following the closing of the reorganization. Performance prior to this date reflects the performance of an unaffiliated investment adviser.
|
|||||||||||||||||||||||||||||||||||||||||||||||||||||||||||||||||||||||||||||||||
| Performance Past Does Not Indicate Future [Text] | Remember, however, that past performance (before and after taxes) is not necessarily indicative of how the Fund will perform in the future. | |||||||||||||||||||||||||||||||||||||||||||||||||||||||||||||||||||||||||||||||||
| Performance Information Illustrates Variability of Returns [Text] | The bar chart and table below can help you evaluate potential risks of the Dynamic Dividend Fund. | |||||||||||||||||||||||||||||||||||||||||||||||||||||||||||||||||||||||||||||||||
| Bar Chart [Heading] | Annual Total Returns – Institutional Class Shares(Years Ended Dec. 31) | |||||||||||||||||||||||||||||||||||||||||||||||||||||||||||||||||||||||||||||||||
| Bar Chart [Table] | ![]() |
|||||||||||||||||||||||||||||||||||||||||||||||||||||||||||||||||||||||||||||||||
| Bar Chart Closing [Text Block] | Highest Return: 19.11% - 2nd quarter 2020 Lowest Return: -23.77% - 1st quarter 2020
|
|||||||||||||||||||||||||||||||||||||||||||||||||||||||||||||||||||||||||||||||||
| Performance Table Heading | Average Annual Total Returns as of December 31, 2025 | |||||||||||||||||||||||||||||||||||||||||||||||||||||||||||||||||||||||||||||||||
| Performance Table Narrative | After-tax returns are shown in the following table for Institutional Class shares only and will vary for other classes. After–tax returns are calculated using the historical highest individual federal marginal income tax rates in effect and do not reflect the impact of state and local taxes. Your actual after-tax return depends on your personal tax situation and may differ from what is shown here. After-tax returns are not relevant to investors in tax-deferred arrangements, such as individual retirement accounts, 401(k) plans or certain other employer-sponsored retirement plans.
|
|||||||||||||||||||||||||||||||||||||||||||||||||||||||||||||||||||||||||||||||||
| Performance Table Uses Highest Federal Rate | After–tax returns are calculated using the historical highest individual federal marginal income tax rates in effect and do not reflect the impact of state and local taxes. | |||||||||||||||||||||||||||||||||||||||||||||||||||||||||||||||||||||||||||||||||
| Performance Table Not Relevant to Tax Deferred | Your actual after-tax return depends on your personal tax situation and may differ from what is shown here. After-tax returns are not relevant to investors in tax-deferred arrangements, such as individual retirement accounts, 401(k) plans or certain other employer-sponsored retirement plans. | |||||||||||||||||||||||||||||||||||||||||||||||||||||||||||||||||||||||||||||||||
| Performance [Table] |
|
[1] | ||||||||||||||||||||||||||||||||||||||||||||||||||||||||||||||||||||||||||||||||
| Performance Table One Class of after Tax Shown [Text] | After-tax returns are shown in the following table for Institutional Class shares only and will vary for other classes. | |||||||||||||||||||||||||||||||||||||||||||||||||||||||||||||||||||||||||||||||||
| Index No Deduction for Fees, Expenses, or Taxes [Text] | (reflects no deductions for fees or expenses) | |||||||||||||||||||||||||||||||||||||||||||||||||||||||||||||||||||||||||||||||||
| Performance Availability Website Address [Text] | https://www.aberdeeninvestments.com/en-us/investor/funds/view-all-funds | |||||||||||||||||||||||||||||||||||||||||||||||||||||||||||||||||||||||||||||||||
| Performance Availability Phone [Text] | 866-667-9231 | |||||||||||||||||||||||||||||||||||||||||||||||||||||||||||||||||||||||||||||||||
| abrdn Funds | abrdn Dynamic Dividend Fund | AMUN | ||||||||||||||||||||||||||||||||||||||||||||||||||||||||||||||||||||||||||||||||||
| Prospectus [Line Items] | ||||||||||||||||||||||||||||||||||||||||||||||||||||||||||||||||||||||||||||||||||
| Highest Quarterly Return, Label [Optional Text] | Highest Return: 19.11% - 2nd quarter 2020 | |||||||||||||||||||||||||||||||||||||||||||||||||||||||||||||||||||||||||||||||||
| Highest Quarterly Return | 19.11% | |||||||||||||||||||||||||||||||||||||||||||||||||||||||||||||||||||||||||||||||||
| Highest Quarterly Return, Date | Jun. 30, 2020 | |||||||||||||||||||||||||||||||||||||||||||||||||||||||||||||||||||||||||||||||||
| Lowest Quarterly Return, Label [Optional Text] | Lowest Return: -23.77% - 1st quarter 2020 | |||||||||||||||||||||||||||||||||||||||||||||||||||||||||||||||||||||||||||||||||
| Lowest Quarterly Return | (23.77%) | |||||||||||||||||||||||||||||||||||||||||||||||||||||||||||||||||||||||||||||||||
| Lowest Quarterly Return, Date | Mar. 31, 2020 | |||||||||||||||||||||||||||||||||||||||||||||||||||||||||||||||||||||||||||||||||
| abrdn Funds | abrdn Emerging Markets ex-China Fund | ||||||||||||||||||||||||||||||||||||||||||||||||||||||||||||||||||||||||||||||||||
| Prospectus [Line Items] | ||||||||||||||||||||||||||||||||||||||||||||||||||||||||||||||||||||||||||||||||||
| Bar Chart and Performance Table [Heading] | Performance | |||||||||||||||||||||||||||||||||||||||||||||||||||||||||||||||||||||||||||||||||
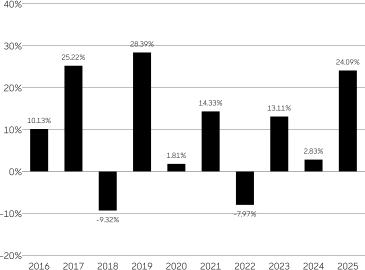
| Performance Narrative [Text Block] | The bar chart and table below can help you evaluate potential risks of the Emerging Markets ex-China Fund. The bar chart shows how the Fund’s annual total returns for Class A shares have varied from year to year. The returns in the bar chart do not reflect the impact of sales charges, if any. If the applicable sales charges were included, the annual total returns would be lower than those shown. The table following the bar chart compares the Fund’s performance over time with those of a broad measure of market performance. Unlike the bar chart, the returns in the table reflect the maximum applicable sales charges. The table compares the Fund’s average annual total returns to the returns of the MSCI Emerging Markets ex-China Index (Net TR)*, a broad-based securities index. Remember, however, that past performance (before and after taxes) is not necessarily indicative of how the Fund will perform in the future. For updated performance information, please visit https://www.aberdeeninvestments.com/en-us/investor/funds/view-all-funds or call 866-667-9231. The Fund changed its investment strategy effective February 28, 2022 from a global equity strategy to an emerging markets ex-China strategy. In connection with the change in investment strategy, the Fund changed its name from Aberdeen Global Equity Fund to abrdn Emerging Markets ex-China Fund. Performance information for periods prior to February 28, 2022 does not reflect the Fund’s current investment strategy.
|
|||||||||||||||||||||||||||||||||||||||||||||||||||||||||||||||||||||||||||||||||
| Performance Past Does Not Indicate Future [Text] | Remember, however, that past performance (before and after taxes) is not necessarily indicative of how the Fund will perform in the future. | |||||||||||||||||||||||||||||||||||||||||||||||||||||||||||||||||||||||||||||||||
| Performance Information Illustrates Variability of Returns [Text] | The bar chart and table below can help you evaluate potential risks of the Emerging Markets ex-China Fund. | |||||||||||||||||||||||||||||||||||||||||||||||||||||||||||||||||||||||||||||||||
| Bar Chart Does Not Reflect Sales Loads [Text] | The returns in the bar chart do not reflect the impact of sales charges, if any. If the applicable sales charges were included, the annual total returns would be lower than those shown. | |||||||||||||||||||||||||||||||||||||||||||||||||||||||||||||||||||||||||||||||||
| Bar Chart [Heading] | Annual Total Returns – Class A Shares(Years Ended Dec. 31) | |||||||||||||||||||||||||||||||||||||||||||||||||||||||||||||||||||||||||||||||||
| Bar Chart [Table] | ![]() |
|||||||||||||||||||||||||||||||||||||||||||||||||||||||||||||||||||||||||||||||||
| Bar Chart Closing [Text Block] | Highest Return: 17.54% - 2nd quarter 2020 Lowest Return: -20.39% - 1st quarter 2020
|
|||||||||||||||||||||||||||||||||||||||||||||||||||||||||||||||||||||||||||||||||
| Performance Table Heading | Average Annual Total Returns as of December 31, 2025 | |||||||||||||||||||||||||||||||||||||||||||||||||||||||||||||||||||||||||||||||||
| Performance Table Narrative | After-tax returns are shown in the following table for Class A shares only and will vary for other classes. After–tax returns are calculated using the historical highest individual federal marginal income tax rates in effect and do not reflect the impact of state and local taxes. Your actual after-tax return depends on your personal tax situation and may differ from what is shown here. After-tax returns are not relevant to investors in tax-deferred arrangements, such as individual retirement accounts, 401(k) plans or certain other employer-sponsored retirement plans.
|
|||||||||||||||||||||||||||||||||||||||||||||||||||||||||||||||||||||||||||||||||
| Performance Table Does Reflect Sales Loads | Unlike the bar chart, the returns in the table reflect the maximum applicable sales charges. | |||||||||||||||||||||||||||||||||||||||||||||||||||||||||||||||||||||||||||||||||
| Performance Table Uses Highest Federal Rate | After–tax returns are calculated using the historical highest individual federal marginal income tax rates in effect and do not reflect the impact of state and local taxes. | |||||||||||||||||||||||||||||||||||||||||||||||||||||||||||||||||||||||||||||||||
| Performance Table Not Relevant to Tax Deferred | Your actual after-tax return depends on your personal tax situation and may differ from what is shown here. After-tax returns are not relevant to investors in tax-deferred arrangements, such as individual retirement accounts, 401(k) plans or certain other employer-sponsored retirement plans. | |||||||||||||||||||||||||||||||||||||||||||||||||||||||||||||||||||||||||||||||||
| Performance [Table] |
|
|||||||||||||||||||||||||||||||||||||||||||||||||||||||||||||||||||||||||||||||||
| Performance Table One Class of after Tax Shown [Text] | After-tax returns are shown in the following table for Class A shares only and will vary for other classes. | |||||||||||||||||||||||||||||||||||||||||||||||||||||||||||||||||||||||||||||||||
| Index No Deduction for Fees, Expenses, or Taxes [Text] | (reflects no deduction for fees or expenses) | |||||||||||||||||||||||||||||||||||||||||||||||||||||||||||||||||||||||||||||||||
| Performance Availability Website Address [Text] | https://www.aberdeeninvestments.com/en-us/investor/funds/view-all-funds | |||||||||||||||||||||||||||||||||||||||||||||||||||||||||||||||||||||||||||||||||
| Performance Availability Phone [Text] | 866-667-9231 | |||||||||||||||||||||||||||||||||||||||||||||||||||||||||||||||||||||||||||||||||
| abrdn Funds | abrdn Emerging Markets ex-China Fund | A | ||||||||||||||||||||||||||||||||||||||||||||||||||||||||||||||||||||||||||||||||||
| Prospectus [Line Items] | ||||||||||||||||||||||||||||||||||||||||||||||||||||||||||||||||||||||||||||||||||
| Highest Quarterly Return, Label [Optional Text] | Highest Return: 17.54% - 2nd quarter 2020 | |||||||||||||||||||||||||||||||||||||||||||||||||||||||||||||||||||||||||||||||||
| Highest Quarterly Return | 17.54% | |||||||||||||||||||||||||||||||||||||||||||||||||||||||||||||||||||||||||||||||||
| Highest Quarterly Return, Date | Jun. 30, 2020 | |||||||||||||||||||||||||||||||||||||||||||||||||||||||||||||||||||||||||||||||||
| Lowest Quarterly Return, Label [Optional Text] | Lowest Return: -20.39% - 1st quarter 2020 | |||||||||||||||||||||||||||||||||||||||||||||||||||||||||||||||||||||||||||||||||
| Lowest Quarterly Return | (20.39%) | |||||||||||||||||||||||||||||||||||||||||||||||||||||||||||||||||||||||||||||||||
| Lowest Quarterly Return, Date | Mar. 31, 2020 | |||||||||||||||||||||||||||||||||||||||||||||||||||||||||||||||||||||||||||||||||
| abrdn Funds | abrdn Emerging Markets Fund | ||||||||||||||||||||||||||||||||||||||||||||||||||||||||||||||||||||||||||||||||||
| Prospectus [Line Items] | ||||||||||||||||||||||||||||||||||||||||||||||||||||||||||||||||||||||||||||||||||
| Bar Chart and Performance Table [Heading] | Performance | |||||||||||||||||||||||||||||||||||||||||||||||||||||||||||||||||||||||||||||||||
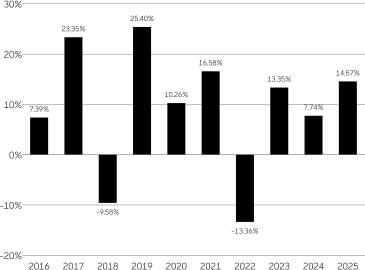
| Performance Narrative [Text Block] | The bar chart and table below can help you evaluate potential risks of the Emerging Markets Fund. The bar chart shows how the Fund’s annual total returns for the Institutional Class have varied from year to year. The table following the bar chart compares the Fund’s performance over time with those of a broad measure of market performance. Returns in the table reflect the maximum applicable sales charges. The table compares the Fund’s average annual total returns to the returns of the MSCI Emerging Markets Index (Net TR)*, a broad-based securities index. Remember, however, that past *Net Total Returnperformance (before and after taxes) is not necessarily indicative of how the Fund will perform in the future. For updated performance information, please visit https://www.aberdeeninvestments.com/en-us/investor/funds/view-all-funds or call 866-667-9231.Class A, Class C and Class R returns prior to the commencement of operations of Class A, Class C and Class R (inception date: May 21, 2012) are based on the previous performance of the Fund’s Institutional Class shares. Excluding the effect of any fee waivers or reimbursements, this performance is substantially similar to what each individual class would have produced because all classes invest in the same portfolio of securities. Returns would only differ to the extent of the differences in expenses between the two classes. | |||||||||||||||||||||||||||||||||||||||||||||||||||||||||||||||||||||||||||||||||
| Performance Past Does Not Indicate Future [Text] | Remember, however, that past *Net Total Returnperformance (before and after taxes) is not necessarily indicative of how the Fund will perform in the future. | |||||||||||||||||||||||||||||||||||||||||||||||||||||||||||||||||||||||||||||||||
| Performance Information Illustrates Variability of Returns [Text] | The bar chart and table below can help you evaluate potential risks of the Emerging Markets Fund. | |||||||||||||||||||||||||||||||||||||||||||||||||||||||||||||||||||||||||||||||||
| Bar Chart [Heading] | Annual Total Returns – Institutional Class Shares(Years Ended Dec. 31) | |||||||||||||||||||||||||||||||||||||||||||||||||||||||||||||||||||||||||||||||||
| Bar Chart [Table] | ![]() |
|||||||||||||||||||||||||||||||||||||||||||||||||||||||||||||||||||||||||||||||||
| Bar Chart Closing [Text Block] | Highest Return: 25.95% - 4th quarter 2020 Lowest Return: -26.14% - 1st quarter 2020
|
|||||||||||||||||||||||||||||||||||||||||||||||||||||||||||||||||||||||||||||||||
| Performance Table Heading | Average Annual Total Returns as of December 31, 2025 | |||||||||||||||||||||||||||||||||||||||||||||||||||||||||||||||||||||||||||||||||
| Performance Table Narrative | After-tax returns are shown in the following table for the Institutional Class shares only and will vary for other classes. After-tax returns are calculated using the historical highest individual federal marginal income tax rates in effect and do not reflect the impact of state and local taxes. Your actual after-tax return depends on your personal tax situation and may differ from what is shown here. After-tax returns are not relevant to investors in tax-deferred arrangements, such as individual retirement accounts, 401(k) plans or certain other employer-sponsored retirement plans.
|
|||||||||||||||||||||||||||||||||||||||||||||||||||||||||||||||||||||||||||||||||
| Performance Table Does Reflect Sales Loads | Returns in the table reflect the maximum applicable sales charges. | |||||||||||||||||||||||||||||||||||||||||||||||||||||||||||||||||||||||||||||||||
| Performance Table Uses Highest Federal Rate | After-tax returns are calculated using the historical highest individual federal marginal income tax rates in effect and do not reflect the impact of state and local taxes. | |||||||||||||||||||||||||||||||||||||||||||||||||||||||||||||||||||||||||||||||||
| Performance Table Not Relevant to Tax Deferred | Your actual after-tax return depends on your personal tax situation and may differ from what is shown here. After-tax returns are not relevant to investors in tax-deferred arrangements, such as individual retirement accounts, 401(k) plans or certain other employer-sponsored retirement plans. | |||||||||||||||||||||||||||||||||||||||||||||||||||||||||||||||||||||||||||||||||
| Performance [Table] |
|
[2],[3] | ||||||||||||||||||||||||||||||||||||||||||||||||||||||||||||||||||||||||||||||||
| Performance Table One Class of after Tax Shown [Text] | After-tax returns are shown in the following table for the Institutional Class shares only and will vary for other classes. | |||||||||||||||||||||||||||||||||||||||||||||||||||||||||||||||||||||||||||||||||
| Index No Deduction for Fees, Expenses, or Taxes [Text] | (reflects no deduction for fee or expenses) | |||||||||||||||||||||||||||||||||||||||||||||||||||||||||||||||||||||||||||||||||
| Performance Availability Website Address [Text] | https://www.aberdeeninvestments.com/en-us/investor/funds/view-all-funds | |||||||||||||||||||||||||||||||||||||||||||||||||||||||||||||||||||||||||||||||||
| Performance Availability Phone [Text] | 866-667-9231 | |||||||||||||||||||||||||||||||||||||||||||||||||||||||||||||||||||||||||||||||||
| abrdn Funds | abrdn Emerging Markets Fund | AMUN | ||||||||||||||||||||||||||||||||||||||||||||||||||||||||||||||||||||||||||||||||||
| Prospectus [Line Items] | ||||||||||||||||||||||||||||||||||||||||||||||||||||||||||||||||||||||||||||||||||
| Highest Quarterly Return, Label [Optional Text] | Highest Return: 25.95% - 4th quarter 2020 | |||||||||||||||||||||||||||||||||||||||||||||||||||||||||||||||||||||||||||||||||
| Highest Quarterly Return | 25.95% | |||||||||||||||||||||||||||||||||||||||||||||||||||||||||||||||||||||||||||||||||
| Highest Quarterly Return, Date | Dec. 31, 2020 | |||||||||||||||||||||||||||||||||||||||||||||||||||||||||||||||||||||||||||||||||
| Lowest Quarterly Return, Label [Optional Text] | Lowest Return: -26.14% - 1st quarter 2020 | |||||||||||||||||||||||||||||||||||||||||||||||||||||||||||||||||||||||||||||||||
| Lowest Quarterly Return | (26.14%) | |||||||||||||||||||||||||||||||||||||||||||||||||||||||||||||||||||||||||||||||||
| Lowest Quarterly Return, Date | Mar. 31, 2020 | |||||||||||||||||||||||||||||||||||||||||||||||||||||||||||||||||||||||||||||||||
| abrdn Funds | abrdn Global Infrastructure Fund | ||||||||||||||||||||||||||||||||||||||||||||||||||||||||||||||||||||||||||||||||||
| Prospectus [Line Items] | ||||||||||||||||||||||||||||||||||||||||||||||||||||||||||||||||||||||||||||||||||
| Bar Chart and Performance Table [Heading] | Performance | |||||||||||||||||||||||||||||||||||||||||||||||||||||||||||||||||||||||||||||||||
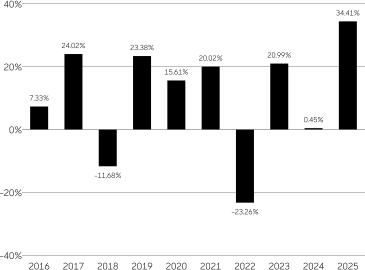
| Performance Narrative [Text Block] | The bar chart and table below can help you evaluate potential risks of the Global Infrastructure Fund. The bar chart shows how the Fund’s annual total returns for Institutional Class shares have varied from year to year.The table following the bar chart compares the Fund’s performance over time with those of a broad measure of market performance and an additional index that more closely reflects the investment strategy of the Fund. Returns in the table reflect the maximum applicable sales charges. The table compares the Fund’s average annual total returns to the returns of the MSCI All Country World Index (Net TR)*, a broad-based securities index, and the S&P Global Infrastructure *Net Total ReturnIndex (Net TR)). Remember, however, that past performance (before and after taxes) is not necessarily indicative of how the Fund will perform in the future. For updated performance information, please visit https://www.aberdeeninvestments.com/en-us/investor/funds/view-all-funds or call 866-667-9231.The returns presented for the Fund for periods prior to May 7, 2018 reflect the performance of a predecessor fund (the “Predecessor Fund”), which was a registered investment company. The Fund adopted the performance of the Predecessor Fund as the result of a reorganization that occurred as of the close of business on May 4, 2018, in which the Fund acquired all of the assets, subject to the liabilities, of the Predecessor Fund. The Fund and the Predecessor Fund have substantially similar investment objectives and strategies.Returns of the Predecessor Fund have not been adjusted to reflect the expenses applicable to the respective classes of the Fund.abrdn Inc. and abrdn Investments Limited (“aIL”) began advising and sub-advising, respectively, the Fund immediately following the closing of the reorganization. Performance prior to this date reflects the performance of an unaffiliated investment adviser. | |||||||||||||||||||||||||||||||||||||||||||||||||||||||||||||||||||||||||||||||||
| Performance Past Does Not Indicate Future [Text] | Remember, however, that past performance (before and after taxes) is not necessarily indicative of how the Fund will perform in the future. | |||||||||||||||||||||||||||||||||||||||||||||||||||||||||||||||||||||||||||||||||
| Performance Information Illustrates Variability of Returns [Text] | The bar chart and table below can help you evaluate potential risks of the Global Infrastructure Fund. | |||||||||||||||||||||||||||||||||||||||||||||||||||||||||||||||||||||||||||||||||
| Bar Chart [Heading] | Annual Total Returns – Institutional Class Shares(Years Ended Dec. 31) | |||||||||||||||||||||||||||||||||||||||||||||||||||||||||||||||||||||||||||||||||
| Bar Chart [Table] | ![]() |
|||||||||||||||||||||||||||||||||||||||||||||||||||||||||||||||||||||||||||||||||
| Bar Chart Closing [Text Block] | Highest Return: 17.31% - 2nd quarter 2020 Lowest Return: -25.55% - 1st quarter 2020
|
|||||||||||||||||||||||||||||||||||||||||||||||||||||||||||||||||||||||||||||||||
| Performance Table Heading | Average Annual Total Returns as of December 31, 2025 | |||||||||||||||||||||||||||||||||||||||||||||||||||||||||||||||||||||||||||||||||
| Performance Table Narrative | After-tax returns are shown in the following table for Institutional Class shares only and will vary for other classes. After–tax returns are calculated using the historical highest individual federal marginal income tax rates in effect and do not reflect the impact of state and local taxes. Your actual after-tax return depends on your personal tax situation and may differ from what is shown here. After-tax returns are not relevant to investors in tax-deferred arrangements, such as individual retirement accounts, 401(k) plans or certain other employer-sponsored retirement plans.
|
|||||||||||||||||||||||||||||||||||||||||||||||||||||||||||||||||||||||||||||||||
| Performance Table Does Reflect Sales Loads | Returns in the table reflect the maximum applicable sales charges. | |||||||||||||||||||||||||||||||||||||||||||||||||||||||||||||||||||||||||||||||||
| Performance Table Uses Highest Federal Rate | After–tax returns are calculated using the historical highest individual federal marginal income tax rates in effect and do not reflect the impact of state and local taxes. | |||||||||||||||||||||||||||||||||||||||||||||||||||||||||||||||||||||||||||||||||
| Performance Table Not Relevant to Tax Deferred | Your actual after-tax return depends on your personal tax situation and may differ from what is shown here. After-tax returns are not relevant to investors in tax-deferred arrangements, such as individual retirement accounts, 401(k) plans or certain other employer-sponsored retirement plans. | |||||||||||||||||||||||||||||||||||||||||||||||||||||||||||||||||||||||||||||||||
| Performance [Table] |
|
|||||||||||||||||||||||||||||||||||||||||||||||||||||||||||||||||||||||||||||||||
| Performance Table One Class of after Tax Shown [Text] | After-tax returns are shown in the following table for Institutional Class shares only and will vary for other classes. | |||||||||||||||||||||||||||||||||||||||||||||||||||||||||||||||||||||||||||||||||
| Index No Deduction for Fees, Expenses, or Taxes [Text] | (reflects no deduction for fees or expenses) | |||||||||||||||||||||||||||||||||||||||||||||||||||||||||||||||||||||||||||||||||
| Performance Availability Website Address [Text] | https://www.aberdeeninvestments.com/en-us/investor/funds/view-all-funds | |||||||||||||||||||||||||||||||||||||||||||||||||||||||||||||||||||||||||||||||||
| Performance Availability Phone [Text] | 866-667-9231 | |||||||||||||||||||||||||||||||||||||||||||||||||||||||||||||||||||||||||||||||||
| abrdn Funds | abrdn Global Infrastructure Fund | AMUN | ||||||||||||||||||||||||||||||||||||||||||||||||||||||||||||||||||||||||||||||||||
| Prospectus [Line Items] | ||||||||||||||||||||||||||||||||||||||||||||||||||||||||||||||||||||||||||||||||||
| Highest Quarterly Return, Label [Optional Text] | Highest Return: 17.31% - 2nd quarter 2020 | |||||||||||||||||||||||||||||||||||||||||||||||||||||||||||||||||||||||||||||||||
| Highest Quarterly Return | 17.31% | |||||||||||||||||||||||||||||||||||||||||||||||||||||||||||||||||||||||||||||||||
| Highest Quarterly Return, Date | Jun. 30, 2020 | |||||||||||||||||||||||||||||||||||||||||||||||||||||||||||||||||||||||||||||||||
| Lowest Quarterly Return, Label [Optional Text] | Lowest Return: -25.55% - 1st quarter 2020 | |||||||||||||||||||||||||||||||||||||||||||||||||||||||||||||||||||||||||||||||||
| Lowest Quarterly Return | (25.55%) | |||||||||||||||||||||||||||||||||||||||||||||||||||||||||||||||||||||||||||||||||
| Lowest Quarterly Return, Date | Mar. 31, 2020 | |||||||||||||||||||||||||||||||||||||||||||||||||||||||||||||||||||||||||||||||||
| abrdn Funds | abrdn High Income Opportunities Fund | ||||||||||||||||||||||||||||||||||||||||||||||||||||||||||||||||||||||||||||||||||
| Prospectus [Line Items] | ||||||||||||||||||||||||||||||||||||||||||||||||||||||||||||||||||||||||||||||||||
| Bar Chart and Performance Table [Heading] | Performance | |||||||||||||||||||||||||||||||||||||||||||||||||||||||||||||||||||||||||||||||||
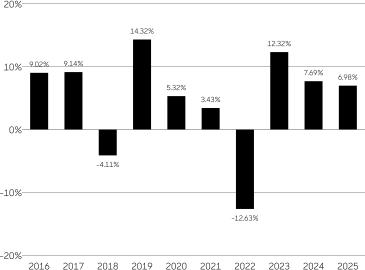
| Performance Narrative [Text Block] | The bar chart and table below can help you evaluate potential risks of the High Income Opportunities Fund. The bar chart shows how the Fund’s annual total returns for Class A shares have varied from year to year. The returns in the bar chart do not reflect the impact of sales charges, if any. If the applicable sales charges were included, the annual total returns would be lower than those shown. The table following the bar chart compares the Fund’s performance over time with those of a broad measure of market performance and an additional index that more closely reflects the Fund’s investment strategy. Unlike the bar chart, the returns in the table reflect the maximum applicable sales charges. The table compares the Fund’s average annual total returns to the returns of the Bloomberg Global Aggregate Bond Index, a broad-based securities index, and the Custom abrdn High Income Opportunities Fund Index (the “Custom Index”). The Custom Index reflects the returns of the ICE BofA US High Yield Constrained Index from August 21, 2023 and the ICE BofA Global High Yield Constrained Index (USD Hedged) for periods prior to August 21, 2023. The indices and time periods for the Custom Index align with the strategies utilized and benchmark for the Fund during the same time periods. Remember, however, that past performance (before and after taxes) is not necessarily indicative of how the Fund will perform in the future. For updated performance information, please visit https://www.aberdeeninvestments.com/en-us/investor/funds/view-all-funds or call 866-667-9231. The Fund changed its investment strategy effective August 18, 2023, which introduced increased flexibility to invest in U.S. issuers. Performance prior to August 18, 2023 does not reflect the current investment strategy. In connection with the investment strategy change, the Fund changed its name from the abrdn Global High Income Fund to the abrdn High Income Opportunities Fund. The returns presented for the Fund for periods prior to December 3, 2021 reflect the performance of a predecessor fund (the “Predecessor Fund”), a registered investment company. The Fund adopted the performance of the Predecessor Fund as the result of a reorganization on December 3, 2021, in which the Fund acquired all of the assets, subject to the liabilities, of the Predecessor Fund. Returns of the Predecessor Fund have been adjusted to reflect applicable sales charges but not the differences in the expenses applicable to the respective classes of the Fund.
|
|||||||||||||||||||||||||||||||||||||||||||||||||||||||||||||||||||||||||||||||||
| Performance Past Does Not Indicate Future [Text] | Remember, however, that past performance (before and after taxes) is not necessarily indicative of how the Fund will perform in the future. | |||||||||||||||||||||||||||||||||||||||||||||||||||||||||||||||||||||||||||||||||
| Performance Information Illustrates Variability of Returns [Text] | The bar chart and table below can help you evaluate potential risks of the High Income Opportunities Fund. | |||||||||||||||||||||||||||||||||||||||||||||||||||||||||||||||||||||||||||||||||
| Bar Chart Does Not Reflect Sales Loads [Text] | The returns in the bar chart do not reflect the impact of sales charges, if any. If the applicable sales charges were included, the annual total returns would be lower than those shown. | |||||||||||||||||||||||||||||||||||||||||||||||||||||||||||||||||||||||||||||||||
| Bar Chart [Heading] | Annual Total Returns – Class A Shares(Years Ended Dec. 31) | |||||||||||||||||||||||||||||||||||||||||||||||||||||||||||||||||||||||||||||||||
| Bar Chart [Table] | ![]() |
|||||||||||||||||||||||||||||||||||||||||||||||||||||||||||||||||||||||||||||||||
| Bar Chart Closing [Text Block] | Highest Return: 12.44% - 2nd quarter 2020 Lowest Return: -15.45% - 1st quarter 2020
|
|||||||||||||||||||||||||||||||||||||||||||||||||||||||||||||||||||||||||||||||||
| Performance Table Heading | Average Annual Total Returns as of December 31, 2025 | |||||||||||||||||||||||||||||||||||||||||||||||||||||||||||||||||||||||||||||||||
| Performance Table Narrative | After-tax returns are shown in the following table for Class A shares only and will vary for other classes. After–tax returns are calculated using the historical highest individual federal marginal income tax rates in effect and do not reflect the impact of state and local taxes. Your actual after-tax return depends on your personal tax situation and may differ from what is shown here. After-tax returns are not relevant to investors in tax-deferred arrangements, such as individual retirement accounts, 401(k) plans or certain other employer-sponsored retirement plans.
|
|||||||||||||||||||||||||||||||||||||||||||||||||||||||||||||||||||||||||||||||||
| Performance Table Does Reflect Sales Loads | Unlike the bar chart, the returns in the table reflect the maximum applicable sales charges. | |||||||||||||||||||||||||||||||||||||||||||||||||||||||||||||||||||||||||||||||||
| Performance Table Uses Highest Federal Rate | After–tax returns are calculated using the historical highest individual federal marginal income tax rates in effect and do not reflect the impact of state and local taxes. | |||||||||||||||||||||||||||||||||||||||||||||||||||||||||||||||||||||||||||||||||
| Performance Table Not Relevant to Tax Deferred | Your actual after-tax return depends on your personal tax situation and may differ from what is shown here. After-tax returns are not relevant to investors in tax-deferred arrangements, such as individual retirement accounts, 401(k) plans or certain other employer-sponsored retirement plans. | |||||||||||||||||||||||||||||||||||||||||||||||||||||||||||||||||||||||||||||||||
| Performance [Table] |
|
[4],[5],[6] | ||||||||||||||||||||||||||||||||||||||||||||||||||||||||||||||||||||||||||||||||
| Performance Table One Class of after Tax Shown [Text] | After-tax returns are shown in the following table for Class A shares only and will vary for other classes. | |||||||||||||||||||||||||||||||||||||||||||||||||||||||||||||||||||||||||||||||||
| Index No Deduction for Fees, Expenses, or Taxes [Text] | (reflects no deductions for fees, expenses or taxes) | |||||||||||||||||||||||||||||||||||||||||||||||||||||||||||||||||||||||||||||||||
| Performance Availability Website Address [Text] | https://www.aberdeeninvestments.com/en-us/investor/funds/view-all-funds | |||||||||||||||||||||||||||||||||||||||||||||||||||||||||||||||||||||||||||||||||
| Performance Availability Phone [Text] | 866-667-9231 | |||||||||||||||||||||||||||||||||||||||||||||||||||||||||||||||||||||||||||||||||
| abrdn Funds | abrdn High Income Opportunities Fund | A | ||||||||||||||||||||||||||||||||||||||||||||||||||||||||||||||||||||||||||||||||||
| Prospectus [Line Items] | ||||||||||||||||||||||||||||||||||||||||||||||||||||||||||||||||||||||||||||||||||
| Highest Quarterly Return, Label [Optional Text] | Highest Return: 12.44% - 2nd quarter 2020 | |||||||||||||||||||||||||||||||||||||||||||||||||||||||||||||||||||||||||||||||||
| Highest Quarterly Return | 12.44% | |||||||||||||||||||||||||||||||||||||||||||||||||||||||||||||||||||||||||||||||||
| Highest Quarterly Return, Date | Jun. 30, 2020 | |||||||||||||||||||||||||||||||||||||||||||||||||||||||||||||||||||||||||||||||||
| Lowest Quarterly Return, Label [Optional Text] | Lowest Return: -15.45% - 1st quarter 2020 | |||||||||||||||||||||||||||||||||||||||||||||||||||||||||||||||||||||||||||||||||
| Lowest Quarterly Return | (15.45%) | |||||||||||||||||||||||||||||||||||||||||||||||||||||||||||||||||||||||||||||||||
| Lowest Quarterly Return, Date | Mar. 31, 2020 | |||||||||||||||||||||||||||||||||||||||||||||||||||||||||||||||||||||||||||||||||
| abrdn Funds | abrdn Infrastructure Debt Fund | ||||||||||||||||||||||||||||||||||||||||||||||||||||||||||||||||||||||||||||||||||
| Prospectus [Line Items] | ||||||||||||||||||||||||||||||||||||||||||||||||||||||||||||||||||||||||||||||||||
| Bar Chart and Performance Table [Heading] | Performance | |||||||||||||||||||||||||||||||||||||||||||||||||||||||||||||||||||||||||||||||||
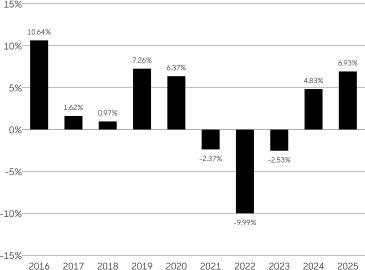
| Performance Narrative [Text Block] | The bar chart and table below can help you evaluate potential risks of the Infrastructure Debt Fund. The bar chart shows how the Fund’s annual total returns for Institutional Service Class shares have varied from year to year. The table following the bar chart compares the Fund’s performance over time with those of a broad measure of market performance. Returns in the table reflect the maximum applicable sales charges. The table compares the Fund’s average annual total returns to the returns of the Bloomberg U.S. Aggregate Bond Index, a broad-based securities index. Remember, however, that past performance (before and after taxes) is not necessarily indicative of how the Fund will perform in the future. For updated performance information, please visit https://www.aberdeeninvestments.com/en-us/investor/funds/view-all-funds or call 866-667-9231. The Fund changed its investment objective and strategies effective August 18, 2023, November 15, 2019 and August 15, 2016. In connection with the changes effective August 18, 2023, the Fund transitioned from an “absolute return” strategy with a global focus to a focus on U.S. and non-U.S. infrastructure-related debt. Performance information for periods prior to August 18, 2023, November 15, 2019 and August 15, 2016 reflect different investment strategies. In connection with the change in investment objective and strategy on August 18, 2023, the Fund changed its name from abrdn Global Absolute Return Strategies Fund to abrdn Infrastructure Debt Fund. In connection with the change in investment objective and strategy on November 15, 2019, the Fund changed its name from Aberdeen Global Unconstrained Fixed Income Fund to Aberdeen Global Absolute Return Strategies Fund. In connection with the change in investment objective and strategy on August 15, 2016, the Fund changed its name from Aberdeen Global Fixed Income Fund to Aberdeen Global Unconstrained Fixed Income Fund.
|
|||||||||||||||||||||||||||||||||||||||||||||||||||||||||||||||||||||||||||||||||
| Performance Past Does Not Indicate Future [Text] | Remember, however, that past performance (before and after taxes) is not necessarily indicative of how the Fund will perform in the future. | |||||||||||||||||||||||||||||||||||||||||||||||||||||||||||||||||||||||||||||||||
| Performance Information Illustrates Variability of Returns [Text] | The bar chart and table below can help you evaluate potential risks of the Infrastructure Debt Fund. | |||||||||||||||||||||||||||||||||||||||||||||||||||||||||||||||||||||||||||||||||
| Bar Chart [Heading] | Annual Total Returns – Institutional Service Class Shares(Years Ended Dec. 31) | |||||||||||||||||||||||||||||||||||||||||||||||||||||||||||||||||||||||||||||||||
| Bar Chart [Table] | ![]() |
|||||||||||||||||||||||||||||||||||||||||||||||||||||||||||||||||||||||||||||||||
| Bar Chart Closing [Text Block] | Highest Return: 6.93% - 4th quarter 2023 Lowest Return: -5.24% - 1st quarter 2022
|
|||||||||||||||||||||||||||||||||||||||||||||||||||||||||||||||||||||||||||||||||
| Performance Table Heading | Average Annual Total Returns as of December 31, 2025 | |||||||||||||||||||||||||||||||||||||||||||||||||||||||||||||||||||||||||||||||||
| Performance Table Narrative | After-tax returns are shown in the following table for Institutional Service Class shares only and will vary for other classes. After–tax returns are calculated using the historical highest individual federal marginal income tax rates in effect and do not reflect the impact of state and local taxes. Your actual after-tax return depends on your personal tax situation and may differ from what is shown here. After-tax returns are not relevant to investors in tax-deferred arrangements, such as individual retirement accounts, 401(k) plans or certain other employer-sponsored retirement plans.
|
|||||||||||||||||||||||||||||||||||||||||||||||||||||||||||||||||||||||||||||||||
| Performance Table Does Reflect Sales Loads | Returns in the table reflect the maximum applicable sales charges. | |||||||||||||||||||||||||||||||||||||||||||||||||||||||||||||||||||||||||||||||||
| Performance Table Uses Highest Federal Rate | After–tax returns are calculated using the historical highest individual federal marginal income tax rates in effect and do not reflect the impact of state and local taxes. | |||||||||||||||||||||||||||||||||||||||||||||||||||||||||||||||||||||||||||||||||
| Performance Table Not Relevant to Tax Deferred | Your actual after-tax return depends on your personal tax situation and may differ from what is shown here. After-tax returns are not relevant to investors in tax-deferred arrangements, such as individual retirement accounts, 401(k) plans or certain other employer-sponsored retirement plans. | |||||||||||||||||||||||||||||||||||||||||||||||||||||||||||||||||||||||||||||||||
| Performance [Table] |
|
[7],[8] | ||||||||||||||||||||||||||||||||||||||||||||||||||||||||||||||||||||||||||||||||
| Performance Table One Class of after Tax Shown [Text] | After-tax returns are shown in the following table for Institutional Service Class shares only and will vary for other classes. | |||||||||||||||||||||||||||||||||||||||||||||||||||||||||||||||||||||||||||||||||
| Index No Deduction for Fees, Expenses, or Taxes [Text] | (reflects no deduction for fees, expenses or taxes) | |||||||||||||||||||||||||||||||||||||||||||||||||||||||||||||||||||||||||||||||||
| Performance Availability Website Address [Text] | https://www.aberdeeninvestments.com/en-us/investor/funds/view-all-funds | |||||||||||||||||||||||||||||||||||||||||||||||||||||||||||||||||||||||||||||||||
| Performance Availability Phone [Text] | 866-667-9231 | |||||||||||||||||||||||||||||||||||||||||||||||||||||||||||||||||||||||||||||||||
| abrdn Funds | abrdn Infrastructure Debt Fund | Institutional Service | ||||||||||||||||||||||||||||||||||||||||||||||||||||||||||||||||||||||||||||||||||
| Prospectus [Line Items] | ||||||||||||||||||||||||||||||||||||||||||||||||||||||||||||||||||||||||||||||||||
| Highest Quarterly Return, Label [Optional Text] | Highest Return: 6.93% - 4th quarter 2023 | |||||||||||||||||||||||||||||||||||||||||||||||||||||||||||||||||||||||||||||||||
| Highest Quarterly Return | 6.93% | |||||||||||||||||||||||||||||||||||||||||||||||||||||||||||||||||||||||||||||||||
| Highest Quarterly Return, Date | Dec. 31, 2023 | |||||||||||||||||||||||||||||||||||||||||||||||||||||||||||||||||||||||||||||||||
| Lowest Quarterly Return, Label [Optional Text] | Lowest Return: -5.24% - 1st quarter 2022 | |||||||||||||||||||||||||||||||||||||||||||||||||||||||||||||||||||||||||||||||||
| Lowest Quarterly Return | (5.24%) | |||||||||||||||||||||||||||||||||||||||||||||||||||||||||||||||||||||||||||||||||
| Lowest Quarterly Return, Date | Mar. 31, 2022 | |||||||||||||||||||||||||||||||||||||||||||||||||||||||||||||||||||||||||||||||||
| abrdn Funds | abrdn Real Estate Fund | ||||||||||||||||||||||||||||||||||||||||||||||||||||||||||||||||||||||||||||||||||
| Prospectus [Line Items] | ||||||||||||||||||||||||||||||||||||||||||||||||||||||||||||||||||||||||||||||||||
| Bar Chart and Performance Table [Heading] | Performance | |||||||||||||||||||||||||||||||||||||||||||||||||||||||||||||||||||||||||||||||||
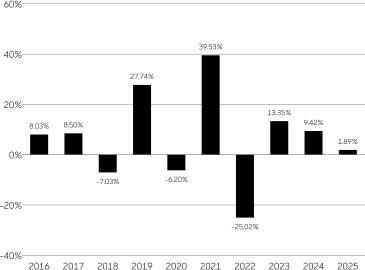
| Performance Narrative [Text Block] | The bar chart and table below can help you evaluate potential risks of the Real Estate Fund. The bar chart shows how the Fund’s annual total returns for Institutional Class shares have varied from year to year. The table following the bar chart compares the Fund’s performance over time with those of a broad measure of market performance and an additional index that more closely reflects the Fund’s investment strategy. Returns in the table reflect the maximum applicable sales charges. The table compares the Fund’s average annual total returns to the returns of the S&P 500® Index, a broad-based securities index, and the MSCI US REIT Index. Remember, however, that past performance (before and after taxes) is not necessarily indicative of how the Fund will perform in the future. For updated performance information, please visit https://www.aberdeeninvestments.com/en-us/investor/funds/view-all-funds or call 866-667-9231.
The returns presented for the Fund for periods prior to May 7, 2018 reflect the performance of a predecessor fund (the “Predecessor Fund”), which was a registered investment company. The Fund adopted the performance of the Predecessor Fund as the result of a reorganization that occurred as of the close of business on May 4, 2018, in which the Fund acquired all of the assets, subject to the liabilities, of the Predecessor Fund. The Fund and the Predecessor Fund have substantially similar investment objectives and strategies. Returns of the Predecessor Fund have not been adjusted to reflect the expenses applicable to the respective classes of the Fund. abrdn Inc. and abrdn Investments Limited began advising and sub-advising, respectively, the Fund immediately following the closing of the reorganization. Performance prior to this date reflects the performance of an unaffiliated investment adviser. |
|||||||||||||||||||||||||||||||||||||||||||||||||||||||||||||||||||||||||||||||||
| Performance Past Does Not Indicate Future [Text] | Remember, however, that past performance (before and after taxes) is not necessarily indicative of how the Fund will perform in the future. | |||||||||||||||||||||||||||||||||||||||||||||||||||||||||||||||||||||||||||||||||
| Performance Information Illustrates Variability of Returns [Text] | The bar chart and table below can help you evaluate potential risks of the Real Estate Fund. | |||||||||||||||||||||||||||||||||||||||||||||||||||||||||||||||||||||||||||||||||
| Bar Chart [Heading] | Annual Total Returns – Institutional Class Shares(Years Ended Dec. 31) | |||||||||||||||||||||||||||||||||||||||||||||||||||||||||||||||||||||||||||||||||
| Bar Chart [Table] | ![]() |
|||||||||||||||||||||||||||||||||||||||||||||||||||||||||||||||||||||||||||||||||
| Bar Chart Closing [Text Block] | Highest Return: 17.03% - 1st quarter 2019 Lowest Return: -25.28% - 1st quarter 2020
|
|||||||||||||||||||||||||||||||||||||||||||||||||||||||||||||||||||||||||||||||||
| Performance Table Heading | Average Annual Total Returns as of December 31, 2025 | |||||||||||||||||||||||||||||||||||||||||||||||||||||||||||||||||||||||||||||||||
| Performance Table Narrative | After-tax returns are shown in the following table for Institutional Class shares only and will vary for other classes. After–tax returns are calculated using the historical highest individual federal marginal income tax rates in effect and do not reflect the impact of state and local taxes. Your actual after-tax return depends on your personal tax situation and may differ from what is shown here. After-tax returns are not relevant to investors in tax-deferred arrangements, such as individual retirement accounts, 401(k) plans or certain other employer-sponsored retirement plans.
|
|||||||||||||||||||||||||||||||||||||||||||||||||||||||||||||||||||||||||||||||||
| Performance Table Does Reflect Sales Loads | Returns in the table reflect the maximum applicable sales charges. | |||||||||||||||||||||||||||||||||||||||||||||||||||||||||||||||||||||||||||||||||
| Performance Table Uses Highest Federal Rate | After–tax returns are calculated using the historical highest individual federal marginal income tax rates in effect and do not reflect the impact of state and local taxes. | |||||||||||||||||||||||||||||||||||||||||||||||||||||||||||||||||||||||||||||||||
| Performance Table Not Relevant to Tax Deferred | Your actual after-tax return depends on your personal tax situation and may differ from what is shown here. After-tax returns are not relevant to investors in tax-deferred arrangements, such as individual retirement accounts, 401(k) plans or certain other employer-sponsored retirement plans. | |||||||||||||||||||||||||||||||||||||||||||||||||||||||||||||||||||||||||||||||||
| Performance [Table] |
|
[9],[10],[11] | ||||||||||||||||||||||||||||||||||||||||||||||||||||||||||||||||||||||||||||||||
| Performance Table One Class of after Tax Shown [Text] | After-tax returns are shown in the following table for Institutional Class shares only and will vary for other classes. | |||||||||||||||||||||||||||||||||||||||||||||||||||||||||||||||||||||||||||||||||
| Index No Deduction for Fees, Expenses, or Taxes [Text] | (reflects no deduction for fees, expenses or taxes) | |||||||||||||||||||||||||||||||||||||||||||||||||||||||||||||||||||||||||||||||||
| Performance Availability Website Address [Text] | https://www.aberdeeninvestments.com/en-us/investor/funds/view-all-funds | |||||||||||||||||||||||||||||||||||||||||||||||||||||||||||||||||||||||||||||||||
| Performance Availability Phone [Text] | 866-667-9231 | |||||||||||||||||||||||||||||||||||||||||||||||||||||||||||||||||||||||||||||||||
| abrdn Funds | abrdn Real Estate Fund | AMUN | ||||||||||||||||||||||||||||||||||||||||||||||||||||||||||||||||||||||||||||||||||
| Prospectus [Line Items] | ||||||||||||||||||||||||||||||||||||||||||||||||||||||||||||||||||||||||||||||||||
| Highest Quarterly Return, Label [Optional Text] | Highest Return: 17.03% - 1st quarter 2019 | |||||||||||||||||||||||||||||||||||||||||||||||||||||||||||||||||||||||||||||||||
| Highest Quarterly Return | 17.03% | |||||||||||||||||||||||||||||||||||||||||||||||||||||||||||||||||||||||||||||||||
| Highest Quarterly Return, Date | Mar. 31, 2019 | |||||||||||||||||||||||||||||||||||||||||||||||||||||||||||||||||||||||||||||||||
| Lowest Quarterly Return, Label [Optional Text] | Lowest Return: -25.28% - 1st quarter 2020 | |||||||||||||||||||||||||||||||||||||||||||||||||||||||||||||||||||||||||||||||||
| Lowest Quarterly Return | (25.28%) | |||||||||||||||||||||||||||||||||||||||||||||||||||||||||||||||||||||||||||||||||
| Lowest Quarterly Return, Date | Mar. 31, 2020 | |||||||||||||||||||||||||||||||||||||||||||||||||||||||||||||||||||||||||||||||||
| abrdn Funds | abrdn Short Duration High Yield Municipal Fund | ||||||||||||||||||||||||||||||||||||||||||||||||||||||||||||||||||||||||||||||||||
| Prospectus [Line Items] | ||||||||||||||||||||||||||||||||||||||||||||||||||||||||||||||||||||||||||||||||||
| Bar Chart and Performance Table [Heading] | Performance | |||||||||||||||||||||||||||||||||||||||||||||||||||||||||||||||||||||||||||||||||
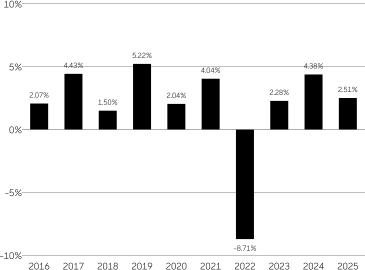
| Performance Narrative [Text Block] | The bar chart and table below can help you evaluate potential risks of the Short Duration High Yield Municipal Fund. The bar chart shows how the Fund’s annual total returns for Institutional Class shares have varied from year to year. The table following the bar chart compares the Fund’s performance over time with those of a broad measure of market performance and an additional index that more closely reflects the Fund’s investment strategy. Returns in the table reflect the maximum applicable sales charges, if any. The table compares the Fund’s performance over time with those of the Bloomberg Municipal Bond Index, a broad based securities index, and the Custom abrdn Short Duration High Yield Municipal Fund Index (the “Custom Index”). The Custom Index reflects the returns of the Bloomberg Municipal Bond Inter-Short (1-10 Y) Index from March 31, 2025 and the S&P Municipal Bond Short Intermediate Index for periods prior to March 31, 2025. The indices and time periods for the Custom Index align with the strategies utilized and benchmark for the Fund during the same time periods. Remember, however, that past performance (before and after taxes) is not necessarily indicative of how the Fund will perform in the future. For updated performance information, please visit https://www.aberdeeninvestments.com/en-us/investor/funds/view-all-funds or call 866-667-9231. The Fund changed its investment strategy effective February 28, 2019 to adopt a target weighted average effective duration. Performance information for periods prior to February 28, 2019 does not reflect such investment policy. In connection with the change in investment policy, the Fund changed its name from Aberdeen High Yield Managed Duration Municipal Fund to Aberdeen Short Duration High Yield Municipal Fund. The returns presented for the Fund for periods prior to May 7, 2018 reflect the performance of a predecessor fund (the “Predecessor Fund”), which was a registered investment company. The Fund adopted the performance of the Predecessor Fund as the result of a reorganization that occurred as of the close of business on May 4, 2018, in which the Fund acquired all of the assets, subject to the liabilities, of the Predecessor Fund. The Fund and the Predecessor Fund had substantially similar investment objectives and strategies prior to the Fund’s adoption of its current investment strategies on February 28, 2019. Returns of the Predecessor Fund have not been adjusted to reflect the expenses applicable to the respective classes of the Fund. abrdn Inc. began advising the Fund immediately following the closing of the reorganization. Performance prior to this date reflects the performance of an unaffiliated investment adviser. Class C returns prior to the commencement of operations of Class C (inception date: 12/18/2020) are based on the previous performance of the Fund’s Class A shares (inception date 5/31/2013). Excluding the effect of any fee waivers or reimbursements, this performance is substantially similar to what each individual class would have produced because all classes invest in the same portfolio of securities. Returns would only differ to the extent of the differences in expenses between the two classes.
|
|||||||||||||||||||||||||||||||||||||||||||||||||||||||||||||||||||||||||||||||||
| Performance Past Does Not Indicate Future [Text] | Remember, however, that past performance (before and after taxes) is not necessarily indicative of how the Fund will perform in the future. | |||||||||||||||||||||||||||||||||||||||||||||||||||||||||||||||||||||||||||||||||
| Performance Information Illustrates Variability of Returns [Text] | The bar chart and table below can help you evaluate potential risks of the Short Duration High Yield Municipal Fund. | |||||||||||||||||||||||||||||||||||||||||||||||||||||||||||||||||||||||||||||||||
| Bar Chart [Heading] | Annual Total Returns – Institutional Class Shares(Years Ended Dec. 31) | |||||||||||||||||||||||||||||||||||||||||||||||||||||||||||||||||||||||||||||||||
| Bar Chart [Table] | ![]() |
|||||||||||||||||||||||||||||||||||||||||||||||||||||||||||||||||||||||||||||||||
| Bar Chart Closing [Text Block] | Highest Return: 2.97% - 4th quarter 2023 Lowest Return: -4.88% - 1st quarter 2022
|
|||||||||||||||||||||||||||||||||||||||||||||||||||||||||||||||||||||||||||||||||
| Performance Table Heading | Average Annual Total Returns as of December 31, 2025 | |||||||||||||||||||||||||||||||||||||||||||||||||||||||||||||||||||||||||||||||||
| Performance Table Narrative | After-tax returns are shown in the following table for Institutional Class shares only and will vary for other classes. After–tax returns are calculated using the historical highest individual federal marginal income tax rates in effect and do not reflect the impact of state and local taxes. Your actual after-tax return depends on your personal tax situation and may differ from what is shown here. After-tax returns are not relevant to investors in tax-deferred arrangements, such as individual retirement accounts, 401(k) plans or certain other employer-sponsored retirement plans.
|
|||||||||||||||||||||||||||||||||||||||||||||||||||||||||||||||||||||||||||||||||
| Performance Table Does Reflect Sales Loads | Returns in the table reflect the maximum applicable sales charges, if any. | |||||||||||||||||||||||||||||||||||||||||||||||||||||||||||||||||||||||||||||||||
| Performance Table Uses Highest Federal Rate | After–tax returns are calculated using the historical highest individual federal marginal income tax rates in effect and do not reflect the impact of state and local taxes. | |||||||||||||||||||||||||||||||||||||||||||||||||||||||||||||||||||||||||||||||||
| Performance Table Not Relevant to Tax Deferred | Your actual after-tax return depends on your personal tax situation and may differ from what is shown here. After-tax returns are not relevant to investors in tax-deferred arrangements, such as individual retirement accounts, 401(k) plans or certain other employer-sponsored retirement plans. | |||||||||||||||||||||||||||||||||||||||||||||||||||||||||||||||||||||||||||||||||
| Performance [Table] |
|
[12],[13],[14] | ||||||||||||||||||||||||||||||||||||||||||||||||||||||||||||||||||||||||||||||||
| Performance Table One Class of after Tax Shown [Text] | After-tax returns are shown in the following table for Institutional Class shares only and will vary for other classes. | |||||||||||||||||||||||||||||||||||||||||||||||||||||||||||||||||||||||||||||||||
| Index No Deduction for Fees, Expenses, or Taxes [Text] | (reflects no deduction for fees, expenses or taxes) | |||||||||||||||||||||||||||||||||||||||||||||||||||||||||||||||||||||||||||||||||
| Performance Availability Website Address [Text] | https://www.aberdeeninvestments.com/en-us/investor/funds/view-all-funds | |||||||||||||||||||||||||||||||||||||||||||||||||||||||||||||||||||||||||||||||||
| Performance Availability Phone [Text] | 866-667-9231 | |||||||||||||||||||||||||||||||||||||||||||||||||||||||||||||||||||||||||||||||||
| abrdn Funds | abrdn Short Duration High Yield Municipal Fund | AMUN | ||||||||||||||||||||||||||||||||||||||||||||||||||||||||||||||||||||||||||||||||||
| Prospectus [Line Items] | ||||||||||||||||||||||||||||||||||||||||||||||||||||||||||||||||||||||||||||||||||
| Highest Quarterly Return, Label [Optional Text] | Highest Return: 2.97% - 4th quarter 2023 | |||||||||||||||||||||||||||||||||||||||||||||||||||||||||||||||||||||||||||||||||
| Highest Quarterly Return | 2.97% | |||||||||||||||||||||||||||||||||||||||||||||||||||||||||||||||||||||||||||||||||
| Highest Quarterly Return, Date | Dec. 31, 2023 | |||||||||||||||||||||||||||||||||||||||||||||||||||||||||||||||||||||||||||||||||
| Lowest Quarterly Return, Label [Optional Text] | Lowest Return: -4.88% - 1st quarter 2022 | |||||||||||||||||||||||||||||||||||||||||||||||||||||||||||||||||||||||||||||||||
| Lowest Quarterly Return | (4.88%) | |||||||||||||||||||||||||||||||||||||||||||||||||||||||||||||||||||||||||||||||||
| Lowest Quarterly Return, Date | Mar. 31, 2022 | |||||||||||||||||||||||||||||||||||||||||||||||||||||||||||||||||||||||||||||||||
| abrdn Funds | abrdn U.S. Small Cap Equity Fund | ||||||||||||||||||||||||||||||||||||||||||||||||||||||||||||||||||||||||||||||||||
| Prospectus [Line Items] | ||||||||||||||||||||||||||||||||||||||||||||||||||||||||||||||||||||||||||||||||||
| Bar Chart and Performance Table [Heading] | Performance | |||||||||||||||||||||||||||||||||||||||||||||||||||||||||||||||||||||||||||||||||
| Performance Narrative [Text Block] | The bar chart and table below can help you evaluate potential risks of the U.S. Small Cap Equity Fund. The bar chart shows how the Fund’s annual total returns for Class A shares have varied from year to year. The returns in the bar chart do not reflect the impact of sales charges, if any. If the applicable sales charges were included, the annual total returns would be lower than those shown. The table following the bar chart compares the Fund’s performance over time with those of a broad measure of market performance and an additional index that more closely reflects the Fund’s investment strategy. Unlike the bar chart, the returns in the table reflect the maximum applicable sales charges. The table compares the Fund’s average annual total returns to the returns of the Russell 3000® Index, a broad-based securities index, and the Russell 2000® Index. Remember, however, that past performance (before and after taxes) is not necessarily indicative of how the Fund will perform in the future. For updated performance information, please visit https://www.aberdeeninvestments.com/en-us/investor/funds/view-all-funds or call 866-667-9231.
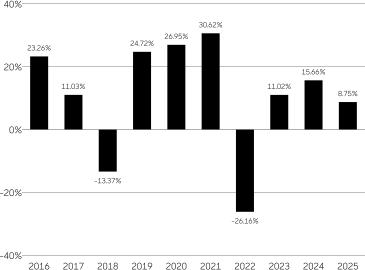
|
|||||||||||||||||||||||||||||||||||||||||||||||||||||||||||||||||||||||||||||||||
| Bar Chart [Heading] | Annual Total Returns – Class A Shares(Years Ended Dec. 31) | |||||||||||||||||||||||||||||||||||||||||||||||||||||||||||||||||||||||||||||||||
| Bar Chart [Table] | ![]() |
|||||||||||||||||||||||||||||||||||||||||||||||||||||||||||||||||||||||||||||||||
| Bar Chart Closing [Text Block] | Highest Return: 29.29% - 2nd quarter 2020 Lowest Return: -23.76% - 1st quarter 2020
|
|||||||||||||||||||||||||||||||||||||||||||||||||||||||||||||||||||||||||||||||||
| Performance Table Heading | Average Annual Total Returns as of December 31, 2025 | |||||||||||||||||||||||||||||||||||||||||||||||||||||||||||||||||||||||||||||||||
| Performance Table Narrative | After-tax returns are shown in the following table for Class A shares only and will vary for other classes. After–tax returns are calculated using the historical highest individual federal marginal income tax rates in effect and do not reflect the impact of state and local taxes. Your actual after-tax return depends on your personal tax situation and may differ from what is shown here. After-tax returns are not relevant to investors in tax-deferred arrangements, such as individual retirement accounts, 401(k) plans or certain other employer-sponsored retirement plans.
|
|||||||||||||||||||||||||||||||||||||||||||||||||||||||||||||||||||||||||||||||||
| Performance Table Uses Highest Federal Rate | After–tax returns are calculated using the historical highest individual federal marginal income tax rates in effect and do not reflect the impact of state and local taxes. | |||||||||||||||||||||||||||||||||||||||||||||||||||||||||||||||||||||||||||||||||
| Performance Table Not Relevant to Tax Deferred | Your actual after-tax return depends on your personal tax situation and may differ from what is shown here. After-tax returns are not relevant to investors in tax-deferred arrangements, such as individual retirement accounts, 401(k) plans or certain other employer-sponsored retirement plans. | |||||||||||||||||||||||||||||||||||||||||||||||||||||||||||||||||||||||||||||||||
| Performance [Table] |
|
[15],[16],[17] | ||||||||||||||||||||||||||||||||||||||||||||||||||||||||||||||||||||||||||||||||
| Performance Table One Class of after Tax Shown [Text] | After-tax returns are shown in the following table for Class A shares only and will vary for other classes. | |||||||||||||||||||||||||||||||||||||||||||||||||||||||||||||||||||||||||||||||||
| Index No Deduction for Fees, Expenses, or Taxes [Text] | (reflects no deduction for fees, expenses or taxes) | |||||||||||||||||||||||||||||||||||||||||||||||||||||||||||||||||||||||||||||||||
| Performance Availability Website Address [Text] | https://www.aberdeeninvestments.com/en-us/investor/funds/view-all-funds | |||||||||||||||||||||||||||||||||||||||||||||||||||||||||||||||||||||||||||||||||
| Performance Availability Phone [Text] | 866-667-9231 | |||||||||||||||||||||||||||||||||||||||||||||||||||||||||||||||||||||||||||||||||
| abrdn Funds | abrdn U.S. Small Cap Equity Fund | A | ||||||||||||||||||||||||||||||||||||||||||||||||||||||||||||||||||||||||||||||||||
| Prospectus [Line Items] | ||||||||||||||||||||||||||||||||||||||||||||||||||||||||||||||||||||||||||||||||||
| Highest Quarterly Return, Label [Optional Text] | Highest Return: 29.29% - 2nd quarter 2020 | |||||||||||||||||||||||||||||||||||||||||||||||||||||||||||||||||||||||||||||||||
| Highest Quarterly Return | 29.29% | |||||||||||||||||||||||||||||||||||||||||||||||||||||||||||||||||||||||||||||||||
| Highest Quarterly Return, Date | Jun. 30, 2020 | |||||||||||||||||||||||||||||||||||||||||||||||||||||||||||||||||||||||||||||||||
| Lowest Quarterly Return, Label [Optional Text] | Lowest Return: -23.76% - 1st quarter 2020 | |||||||||||||||||||||||||||||||||||||||||||||||||||||||||||||||||||||||||||||||||
| Lowest Quarterly Return | (23.76%) | |||||||||||||||||||||||||||||||||||||||||||||||||||||||||||||||||||||||||||||||||
| Lowest Quarterly Return, Date | Mar. 31, 2020 | |||||||||||||||||||||||||||||||||||||||||||||||||||||||||||||||||||||||||||||||||
| abrdn Funds | abrdn U.S. Sustainable Leaders Fund | ||||||||||||||||||||||||||||||||||||||||||||||||||||||||||||||||||||||||||||||||||
| Prospectus [Line Items] | ||||||||||||||||||||||||||||||||||||||||||||||||||||||||||||||||||||||||||||||||||
| Bar Chart and Performance Table [Heading] | Performance | |||||||||||||||||||||||||||||||||||||||||||||||||||||||||||||||||||||||||||||||||
| Performance Narrative [Text Block] | The bar chart and table below can help you evaluate potential risks of the U.S. Sustainable Leaders Fund. The bar chart shows how the Fund’s annual total returns for Class A shares have varied from year to year. The returns in the bar chart do not reflect the impact of sales charges, if any. If the applicable sales charges were included, the annual total returns would be lower than those shown. The table following the bar chart compares the Fund’s performance over time with those of a broad measure of market performance. Unlike the bar chart, the returns in the table reflect the maximum applicable sales charges. The table compares the Fund’s average annual total returns to the returns of the Russell 3000® Index, a broad-based securities index. Remember, however, that past performance (before and after taxes) is not necessarily indicative of how the Fund will perform in the future. For updated performance information, please visit https://www.aberdeeninvestments.com/en-us/investor/funds/view-all-funds or call 866-667-9231. The Fund changed its investment strategy effective December 1, 2020. In connection with the change in investment strategy, the Fund changed its name from Aberdeen U.S. Multi-Cap Equity Fund to Aberdeen U.S. Sustainable Leaders Fund. Performance information for periods prior to December 1, 2020 do not reflect the current investment strategy.
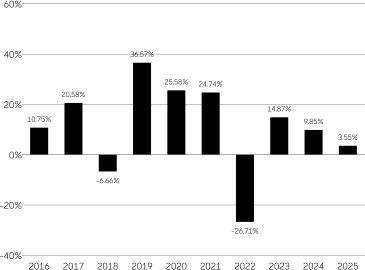
|
|||||||||||||||||||||||||||||||||||||||||||||||||||||||||||||||||||||||||||||||||
| Performance Past Does Not Indicate Future [Text] | Remember, however, that past performance (before and after taxes) is not necessarily indicative of how the Fund will perform in the future. | |||||||||||||||||||||||||||||||||||||||||||||||||||||||||||||||||||||||||||||||||
| Performance Information Illustrates Variability of Returns [Text] | The bar chart and table below can help you evaluate potential risks of the U.S. Sustainable Leaders Fund. | |||||||||||||||||||||||||||||||||||||||||||||||||||||||||||||||||||||||||||||||||
| Bar Chart Does Not Reflect Sales Loads [Text] | The returns in the bar chart do not reflect the impact of sales charges, if any. If the applicable sales charges were included, the annual total returns would be lower than those shown. | |||||||||||||||||||||||||||||||||||||||||||||||||||||||||||||||||||||||||||||||||
| Bar Chart [Heading] | Annual Total Returns – Class A Shares(Years Ended Dec. 31) | |||||||||||||||||||||||||||||||||||||||||||||||||||||||||||||||||||||||||||||||||
| Bar Chart [Table] | ![]() |
|||||||||||||||||||||||||||||||||||||||||||||||||||||||||||||||||||||||||||||||||
| Bar Chart Closing [Text Block] | Highest Return: 22.32% - 2nd quarter 2020 Lowest Return: -17.23% - 2nd quarter 2022
|
|||||||||||||||||||||||||||||||||||||||||||||||||||||||||||||||||||||||||||||||||
| Performance Table Heading | Average Annual Total Returns as of December 31, 2025 | |||||||||||||||||||||||||||||||||||||||||||||||||||||||||||||||||||||||||||||||||
| Performance Table Narrative | After-tax returns are shown in the following table for Class A shares only and will vary for other classes. After–tax returns are calculated using the historical highest individual federal marginal income tax rates in effect and do not reflect the impact of state and local taxes. Your actual after-tax return depends on your personal tax situation and may differ from what is shown here. After-tax returns are not relevant to investors in tax-deferred arrangements, such as individual retirement accounts, 401(k) plans or certain other employer-sponsored retirement plans.
|
|||||||||||||||||||||||||||||||||||||||||||||||||||||||||||||||||||||||||||||||||
| Performance Table Does Reflect Sales Loads | Unlike the bar chart, the returns in the table reflect the maximum applicable sales charges. | |||||||||||||||||||||||||||||||||||||||||||||||||||||||||||||||||||||||||||||||||
| Performance Table Uses Highest Federal Rate | After–tax returns are calculated using the historical highest individual federal marginal income tax rates in effect and do not reflect the impact of state and local taxes. | |||||||||||||||||||||||||||||||||||||||||||||||||||||||||||||||||||||||||||||||||
| Performance Table Not Relevant to Tax Deferred | Your actual after-tax return depends on your personal tax situation and may differ from what is shown here. After-tax returns are not relevant to investors in tax-deferred arrangements, such as individual retirement accounts, 401(k) plans or certain other employer-sponsored retirement plans. | |||||||||||||||||||||||||||||||||||||||||||||||||||||||||||||||||||||||||||||||||
| Performance [Table] |
|
[18],[19] | ||||||||||||||||||||||||||||||||||||||||||||||||||||||||||||||||||||||||||||||||
| Performance Table One Class of after Tax Shown [Text] | After-tax returns are shown in the following table for Class A shares only and will vary for other classes. | |||||||||||||||||||||||||||||||||||||||||||||||||||||||||||||||||||||||||||||||||
| Index No Deduction for Fees, Expenses, or Taxes [Text] | (reflects no deduction for fees, expenses or taxes) | |||||||||||||||||||||||||||||||||||||||||||||||||||||||||||||||||||||||||||||||||
| Performance Availability Website Address [Text] | https://www.aberdeeninvestments.com/en-us/investor/funds/view-all-funds | |||||||||||||||||||||||||||||||||||||||||||||||||||||||||||||||||||||||||||||||||
| Performance Availability Phone [Text] | 866-667-9231 | |||||||||||||||||||||||||||||||||||||||||||||||||||||||||||||||||||||||||||||||||
| abrdn Funds | abrdn U.S. Sustainable Leaders Fund | A | ||||||||||||||||||||||||||||||||||||||||||||||||||||||||||||||||||||||||||||||||||
| Prospectus [Line Items] | ||||||||||||||||||||||||||||||||||||||||||||||||||||||||||||||||||||||||||||||||||
| Highest Quarterly Return, Label [Optional Text] | Highest Return: 22.32% - 2nd quarter 2020 | |||||||||||||||||||||||||||||||||||||||||||||||||||||||||||||||||||||||||||||||||
| Highest Quarterly Return | 22.32% | |||||||||||||||||||||||||||||||||||||||||||||||||||||||||||||||||||||||||||||||||
| Highest Quarterly Return, Date | Jun. 30, 2020 | |||||||||||||||||||||||||||||||||||||||||||||||||||||||||||||||||||||||||||||||||
| Lowest Quarterly Return, Label [Optional Text] | Lowest Return: -17.23% - 2nd quarter 2022 | |||||||||||||||||||||||||||||||||||||||||||||||||||||||||||||||||||||||||||||||||
| Lowest Quarterly Return | (17.23%) | |||||||||||||||||||||||||||||||||||||||||||||||||||||||||||||||||||||||||||||||||
| Lowest Quarterly Return, Date | Jun. 30, 2022 | |||||||||||||||||||||||||||||||||||||||||||||||||||||||||||||||||||||||||||||||||
| abrdn Funds | abrdn Ultra Short Municipal Income Fund | ||||||||||||||||||||||||||||||||||||||||||||||||||||||||||||||||||||||||||||||||||
| Prospectus [Line Items] | ||||||||||||||||||||||||||||||||||||||||||||||||||||||||||||||||||||||||||||||||||
| Bar Chart and Performance Table [Heading] | Performance | |||||||||||||||||||||||||||||||||||||||||||||||||||||||||||||||||||||||||||||||||
| Performance Narrative [Text Block] | The bar chart and table below can help you evaluate potential risks of the Ultra Short Municipal Income Fund. The bar chart shows how the Fund’s annual total returns for Institutional Class shares have varied from year to year. The table following the bar chart compares the Fund’s performance over time with those of a broad measure of market performance and an additional index that more closely reflects the Fund’s investment strategy. Returns in the table reflect the maximum applicable sales charges, if any. The table compares the Fund’s performance over time with those of the Bloomberg Municipal Bond Index, a broad-based securities index, and the Bloomberg Barclays Municipal Bond: 1 Year (1-2) Index. Remember, however, that past performance (before and after taxes) is not necessarily indicative of how the Fund will perform in the future. For updated performance information, please visit https://www.aberdeeninvestments.com/en-us/investor/funds/view-all-funds or call 866-667-9231.
The returns presented for the Fund for periods prior to May 7, 2018 reflect the performance of a predecessor fund (the “Predecessor Fund”), which was a registered investment company. The Fund adopted the performance of the Predecessor Fund as the result of a reorganization that occurred as of the close of business on May 4, 2018, in which the Fund acquired all of the assets, subject to the liabilities, of the Predecessor Fund. The Fund and the Predecessor Fund have substantially similar investment objectives and strategies. Returns of the Predecessor Fund have not been adjusted to reflect the expenses applicable to the respective classes of the Fund. abrdn Inc. began advising the Fund immediately following the closing of the reorganization. Performance prior to this date reflects the performance of an unaffiliated investment adviser. Class A1 returns prior to the commencement of operations of Class A1 (inception date: February 28, 2019) are based on the previous performance of the Fund’s Class A shares (inception date 3/30/2004). Excluding the effect of any fee waivers or reimbursements, this performance is substantially similar to what each individual class would have produced because all classes invest in the same portfolio of securities. Returns would only differ to the extent of the differences in expenses between the two classes. |
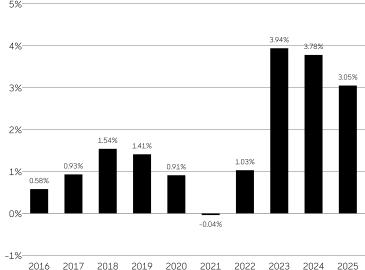
|||||||||||||||||||||||||||||||||||||||||||||||||||||||||||||||||||||||||||||||||
| Performance Past Does Not Indicate Future [Text] | Remember, however, that past performance (before and after taxes) is not necessarily indicative of how the Fund will perform in the future. | |||||||||||||||||||||||||||||||||||||||||||||||||||||||||||||||||||||||||||||||||
| Performance Information Illustrates Variability of Returns [Text] | The bar chart and table below can help you evaluate potential risks of the Ultra Short Municipal Income Fund. | |||||||||||||||||||||||||||||||||||||||||||||||||||||||||||||||||||||||||||||||||
| Bar Chart [Heading] | Annual Total Returns – Institutional Class Shares(Years Ended Dec. 31) | |||||||||||||||||||||||||||||||||||||||||||||||||||||||||||||||||||||||||||||||||
| Bar Chart [Table] | ![]() |
|||||||||||||||||||||||||||||||||||||||||||||||||||||||||||||||||||||||||||||||||
| Bar Chart Closing [Text Block] | Highest Return: 1.12% - 4th quarter 2023
Lowest Return: -0.17% - 1st quarter 2022 |
|||||||||||||||||||||||||||||||||||||||||||||||||||||||||||||||||||||||||||||||||
| Performance Table Heading | Average Annual Total Returns as of December 31, 2025 | |||||||||||||||||||||||||||||||||||||||||||||||||||||||||||||||||||||||||||||||||
| Performance Table Narrative | After-tax returns are shown in the following table for Institutional Class shares only and will vary for other classes. After–tax returns are calculated using the historical highest individual federal marginal income tax rates in effect and do not reflect the impact of state and local taxes. Your actual after-tax return depends on your personal tax situation and may differ from what is shown here. After-tax returns are not relevant to investors in tax-deferred arrangements, such as individual retirement accounts, 401(k) plans or certain other employer-sponsored retirement plans.
|
|||||||||||||||||||||||||||||||||||||||||||||||||||||||||||||||||||||||||||||||||
| Performance Table Uses Highest Federal Rate | After–tax returns are calculated using the historical highest individual federal marginal income tax rates in effect and do not reflect the impact of state and local taxes. | |||||||||||||||||||||||||||||||||||||||||||||||||||||||||||||||||||||||||||||||||
| Performance Table Not Relevant to Tax Deferred | Your actual after-tax return depends on your personal tax situation and may differ from what is shown here. After-tax returns are not relevant to investors in tax-deferred arrangements, such as individual retirement accounts, 401(k) plans or certain other employer-sponsored retirement plans. | |||||||||||||||||||||||||||||||||||||||||||||||||||||||||||||||||||||||||||||||||
| Performance [Table] |
|
|||||||||||||||||||||||||||||||||||||||||||||||||||||||||||||||||||||||||||||||||
| Performance Table One Class of after Tax Shown [Text] | After-tax returns are shown in the following table for Institutional Class shares only and will vary for other classes. | |||||||||||||||||||||||||||||||||||||||||||||||||||||||||||||||||||||||||||||||||
| Index No Deduction for Fees, Expenses, or Taxes [Text] | (reflects no deduction for fees, expenses or taxes) | |||||||||||||||||||||||||||||||||||||||||||||||||||||||||||||||||||||||||||||||||
| Performance Availability Website Address [Text] | https://www.aberdeeninvestments.com/en-us/investor/funds/view-all-funds | |||||||||||||||||||||||||||||||||||||||||||||||||||||||||||||||||||||||||||||||||
| Performance Availability Phone [Text] | 866-667-9231 | |||||||||||||||||||||||||||||||||||||||||||||||||||||||||||||||||||||||||||||||||
| abrdn Funds | abrdn Ultra Short Municipal Income Fund | AMUN | ||||||||||||||||||||||||||||||||||||||||||||||||||||||||||||||||||||||||||||||||||
| Prospectus [Line Items] | ||||||||||||||||||||||||||||||||||||||||||||||||||||||||||||||||||||||||||||||||||
| Highest Quarterly Return, Label [Optional Text] | Highest Return: 1.12% - 4th quarter 2023 | |||||||||||||||||||||||||||||||||||||||||||||||||||||||||||||||||||||||||||||||||
| Highest Quarterly Return | 1.12% | |||||||||||||||||||||||||||||||||||||||||||||||||||||||||||||||||||||||||||||||||
| Highest Quarterly Return, Date | Dec. 31, 2023 | |||||||||||||||||||||||||||||||||||||||||||||||||||||||||||||||||||||||||||||||||
| Lowest Quarterly Return, Label [Optional Text] | Lowest Return: -0.17% - 1st quarter 2022 | |||||||||||||||||||||||||||||||||||||||||||||||||||||||||||||||||||||||||||||||||
| Lowest Quarterly Return | (0.17%) | |||||||||||||||||||||||||||||||||||||||||||||||||||||||||||||||||||||||||||||||||
| Lowest Quarterly Return, Date | Mar. 31, 2022 | |||||||||||||||||||||||||||||||||||||||||||||||||||||||||||||||||||||||||||||||||
| abrdn Multi Fund ETF | abrdn Emerging Markets Dividend Active ETF | ||||||||||||||||||||||||||||||||||||||||||||||||||||||||||||||||||||||||||||||||||
| Prospectus [Line Items] | ||||||||||||||||||||||||||||||||||||||||||||||||||||||||||||||||||||||||||||||||||
| Bar Chart and Performance Table [Heading] | Performance | |||||||||||||||||||||||||||||||||||||||||||||||||||||||||||||||||||||||||||||||||
| Performance Narrative [Text Block] | The bar chart and table below can help you evaluate potential risks of the Emerging Markets Dividend Active ETF. The bar chart shows how the Fund’s annual total returns for Fund shares have varied from year to year. The table following the bar chart compares the Fund’s performance over time with those of a broad measure of market performance and an additional index that more closely reflects the Fund’s investment strategy. The table compares the Fund’s average annual total returns to the returns of the MSCI Emerging Markets Index (Net TR)*, a broad-based securities index, and Custom abrdn Emerging Markets Dividend Active ETF Index (the “Custom Index”).The Custom Index reflects the returns of the MSCI Emerging Markets Index (Net TR) from March 1, 2024 and the MSCI All Country World ex USA Index (Net TR) for periods prior to March 1, 2024. The indices and time periods for the Custom Index align with the strategies utilized and benchmark for the Fund during the same time periods. Remember, however, that past performance (before and after taxes) is not necessarily indicative of how the Fund will perform in the future. For updated performance information, please visit www.aberdeeninvestments.com/usa/etf or call 844-383-7289. Effective after the close of business on February 14, 2025, the Fund adopted the performance of the Predecessor Fund, a registered investment company, as a result of a reorganization (the “Reorganization”) in which the Fund acquired all of the assets and assumed certain stated liabilities of the Predecessor Fund. Performance shown below for periods prior to the Reorganization is based on the investment objective and investment strategies utilized by the Predecessor Fund, which were the same as those of the Fund. The Predecessor Fund was managed by the same investment adviser as that of the Fund. The returns presented for the Fund prior to the Reorganization reflect the performance of Institutional Class shares of the Predecessor Fund. Prior to February 29, 2024, the Predecessor Fund pursued a different investment strategy. Performance for the Fund’s Shares has not been adjusted to reflect the Fund’s Shares’ lower expenses than those of the Predecessor Fund’s Institutional Class Shares. Performance for the Predecessor Fund is based on the NAV per share of the Predecessor Fund shares rather than on market-determined prices.
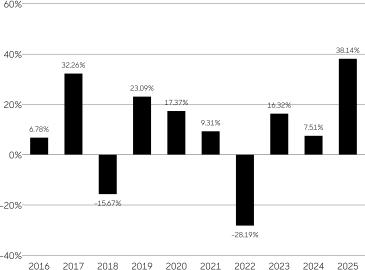
|
|||||||||||||||||||||||||||||||||||||||||||||||||||||||||||||||||||||||||||||||||
| Performance Past Does Not Indicate Future [Text] | Remember, however, that past performance (before and after taxes) is not necessarily indicative of how the Fund will perform in the future. | |||||||||||||||||||||||||||||||||||||||||||||||||||||||||||||||||||||||||||||||||
| Performance Information Illustrates Variability of Returns [Text] | The bar chart and table below can help you evaluate potential risks of the Emerging Markets Dividend Active ETF. | |||||||||||||||||||||||||||||||||||||||||||||||||||||||||||||||||||||||||||||||||
| Bar Chart [Heading] | Annual Total Returns(Years Ended Dec. 31) | |||||||||||||||||||||||||||||||||||||||||||||||||||||||||||||||||||||||||||||||||
| Bar Chart [Table] | ![]() |
|||||||||||||||||||||||||||||||||||||||||||||||||||||||||||||||||||||||||||||||||
| Bar Chart Closing [Text Block] | Highest Return: 18.71% - 2nd quarter 2020 Lowest Return: -23.57% - 1st quarter 2020
|
|||||||||||||||||||||||||||||||||||||||||||||||||||||||||||||||||||||||||||||||||
| Performance Table Heading | Average Annual Total Returns as of December 31, 2025 | |||||||||||||||||||||||||||||||||||||||||||||||||||||||||||||||||||||||||||||||||
| Performance Table Narrative | After-tax returns are calculated using the historical highest individual federal marginal income tax rates in effect and do not reflect the impact of state and local taxes. Your actual after-tax return depends on your personal tax situation and may differ from what is shown here. After-tax returns are not relevant to investors in tax-deferred arrangements, such as individual retirement accounts, 401(k) plans or certain other employer-sponsored retirement plans.
|
|||||||||||||||||||||||||||||||||||||||||||||||||||||||||||||||||||||||||||||||||
| Performance Table Uses Highest Federal Rate | After-tax returns are calculated using the historical highest individual federal marginal income tax rates in effect and do not reflect the impact of state and local taxes. | |||||||||||||||||||||||||||||||||||||||||||||||||||||||||||||||||||||||||||||||||
| Performance Table Not Relevant to Tax Deferred | Your actual after-tax return depends on your personal tax situation and may differ from what is shown here. After-tax returns are not relevant to investors in tax-deferred arrangements, such as individual retirement accounts, 401(k) plans or certain other employer-sponsored retirement plans. | |||||||||||||||||||||||||||||||||||||||||||||||||||||||||||||||||||||||||||||||||
| Performance [Table] |
|
|||||||||||||||||||||||||||||||||||||||||||||||||||||||||||||||||||||||||||||||||
| Index No Deduction for Fees, Expenses, or Taxes [Text] | (reflects no deductions for fees or expenses) | |||||||||||||||||||||||||||||||||||||||||||||||||||||||||||||||||||||||||||||||||
| Performance Availability Website Address [Text] | www.aberdeeninvestments.com/usa/etf | |||||||||||||||||||||||||||||||||||||||||||||||||||||||||||||||||||||||||||||||||
| Performance Availability Phone [Text] | 844-383-7289 | |||||||||||||||||||||||||||||||||||||||||||||||||||||||||||||||||||||||||||||||||
| abrdn Multi Fund ETF | abrdn Emerging Markets Dividend Active ETF | AMUN | ||||||||||||||||||||||||||||||||||||||||||||||||||||||||||||||||||||||||||||||||||
| Prospectus [Line Items] | ||||||||||||||||||||||||||||||||||||||||||||||||||||||||||||||||||||||||||||||||||
| Highest Quarterly Return, Label [Optional Text] | Highest Return: 18.71% - 2nd quarter 2020 | |||||||||||||||||||||||||||||||||||||||||||||||||||||||||||||||||||||||||||||||||
| Highest Quarterly Return | 18.71% | |||||||||||||||||||||||||||||||||||||||||||||||||||||||||||||||||||||||||||||||||
| Highest Quarterly Return, Date | Jun. 30, 2020 | |||||||||||||||||||||||||||||||||||||||||||||||||||||||||||||||||||||||||||||||||
| Lowest Quarterly Return, Label [Optional Text] | Lowest Return: -23.57% - 1st quarter 2020 | |||||||||||||||||||||||||||||||||||||||||||||||||||||||||||||||||||||||||||||||||
| Lowest Quarterly Return | (23.57%) | |||||||||||||||||||||||||||||||||||||||||||||||||||||||||||||||||||||||||||||||||
| Lowest Quarterly Return, Date | Mar. 31, 2020 | |||||||||||||||||||||||||||||||||||||||||||||||||||||||||||||||||||||||||||||||||
| abrdn Multi Fund ETF | abrdn Focused U.S. Small Cap Active ETF | ||||||||||||||||||||||||||||||||||||||||||||||||||||||||||||||||||||||||||||||||||
| Prospectus [Line Items] | ||||||||||||||||||||||||||||||||||||||||||||||||||||||||||||||||||||||||||||||||||
| Bar Chart and Performance Table [Heading] | Performance | |||||||||||||||||||||||||||||||||||||||||||||||||||||||||||||||||||||||||||||||||
| Performance Narrative [Text Block] | The bar chart and table below can help you evaluate potential risks of the Focused U.S. Small Cap Active ETF. The bar chart shows how the Fund’s annual total returns for Fund shares have varied from year to year. The table following the bar chart compares the Fund’s performance over time with those of a broad measure of market performance and an additional index that more closely reflects the Fund’s investment strategy. The table compares the Fund’s average annual total returns to the returns of the Russell 3000® Index, a broad-based securities index, and Custom abrdn Focused U.S. Small Cap Active ETF Index (the “Custom Index”). The Custom Index reflects the returns of the Russell 2000® Index from March 1, 2024, the Russell 2500® Index from November 30, 2020 until February 29, 2024, the S&P 500® Index prior to November 30, 2020, and the FTSE 3-Month T-Bill Index for periods prior to November 15, 2017. The indices and time periods for the Custom Index align with the strategies utilized and benchmark for the Fund during the same time periods. Remember, however, that past performance (before and after taxes) is not necessarily indicative of how the Fund will perform in the future. For updated performance information, please visit www.aberdeeninvestments.com/usa/etf or call 844-383-7289. Effective after the close of business on February 14, 2025, the Fund adopted the performance of the Predecessor Fund, a registered investment company, as a result of a reorganization (the “Reorganization”) in which the Fund acquired all of the assets and assumed certain stated liabilities of the Predecessor Fund. Performance shown below for periods prior to the Reorganization is based on the investment objective and investment strategies utilized by the Predecessor Fund, which were the same as those of the Fund. The Predecessor Fund was managed by the same investment adviser as that of the Fund. The returns presented for the Fund prior to the Reorganization reflect the performance of Institutional Class shares of the Predecessor Fund. Prior to February 29, 2024, the Predecessor Fund pursued a different investment strategy. Performance for the Fund’s shares has not been adjusted to reflect the Fund’s lower expenses than those of the Predecessor Fund’s Institutional Class Shares. Performance for the Predecessor Fund is based on the NAV per share of the Predecessor Fund shares rather than on market-determined prices.
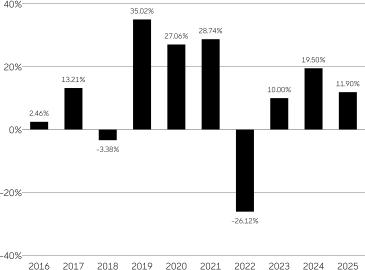
|
|||||||||||||||||||||||||||||||||||||||||||||||||||||||||||||||||||||||||||||||||
| Performance Past Does Not Indicate Future [Text] | Remember, however, that past performance (before and after taxes) is not necessarily indicative of how the Fund will perform in the future. | |||||||||||||||||||||||||||||||||||||||||||||||||||||||||||||||||||||||||||||||||
| Performance Information Illustrates Variability of Returns [Text] | The bar chart and table below can help you evaluate potential risks of the Focused U.S. Small Cap Active ETF. | |||||||||||||||||||||||||||||||||||||||||||||||||||||||||||||||||||||||||||||||||
| Bar Chart [Heading] | Annual Total Returns(Years Ended Dec. 31) | |||||||||||||||||||||||||||||||||||||||||||||||||||||||||||||||||||||||||||||||||
| Bar Chart [Table] | ![]() |
|||||||||||||||||||||||||||||||||||||||||||||||||||||||||||||||||||||||||||||||||
| Bar Chart Closing [Text Block] | Highest Return: 18.45% - 2nd quarter 2020 Lowest Return: -18.83% - 2nd quarter 2022
|
|||||||||||||||||||||||||||||||||||||||||||||||||||||||||||||||||||||||||||||||||
| Performance Table Heading | Average Annual Total Returns as of December 31, 2025 | |||||||||||||||||||||||||||||||||||||||||||||||||||||||||||||||||||||||||||||||||
| Performance Table Narrative | After-tax returns are calculated using the historical highest individual federal marginal income tax rates in effect and do not reflect the impact of state and local taxes. Your actual after-tax return depends on your personal tax situation and may differ from what is shown here. After-tax returns are not relevant to investors in tax-deferred arrangements, such as individual retirement accounts, 401(k) plans or certain other employer-sponsored retirement plans.
|
|||||||||||||||||||||||||||||||||||||||||||||||||||||||||||||||||||||||||||||||||
| Performance Table Uses Highest Federal Rate | After-tax returns are calculated using the historical highest individual federal marginal income tax rates in effect and do not reflect the impact of state and local taxes. | |||||||||||||||||||||||||||||||||||||||||||||||||||||||||||||||||||||||||||||||||
| Performance Table Not Relevant to Tax Deferred | Your actual after-tax return depends on your personal tax situation and may differ from what is shown here. After-tax returns are not relevant to investors in tax-deferred arrangements, such as individual retirement accounts, 401(k) plans or certain other employer-sponsored retirement plans. | |||||||||||||||||||||||||||||||||||||||||||||||||||||||||||||||||||||||||||||||||
| Performance [Table] |
|
|||||||||||||||||||||||||||||||||||||||||||||||||||||||||||||||||||||||||||||||||
| Index No Deduction for Fees, Expenses, or Taxes [Text] | (reflects no deduction for fees, expenses or taxes) | |||||||||||||||||||||||||||||||||||||||||||||||||||||||||||||||||||||||||||||||||
| Performance Availability Website Address [Text] | www.aberdeeninvestments.com/usa/etf | |||||||||||||||||||||||||||||||||||||||||||||||||||||||||||||||||||||||||||||||||
| Performance Availability Phone [Text] | 844-383-7289 | |||||||||||||||||||||||||||||||||||||||||||||||||||||||||||||||||||||||||||||||||
| abrdn Multi Fund ETF | abrdn Focused U.S. Small Cap Active ETF | AMUN | ||||||||||||||||||||||||||||||||||||||||||||||||||||||||||||||||||||||||||||||||||
| Prospectus [Line Items] | ||||||||||||||||||||||||||||||||||||||||||||||||||||||||||||||||||||||||||||||||||
| Highest Quarterly Return, Label [Optional Text] | Highest Return: 18.45% - 2nd quarter 2020 | |||||||||||||||||||||||||||||||||||||||||||||||||||||||||||||||||||||||||||||||||
| Highest Quarterly Return | 18.45% | |||||||||||||||||||||||||||||||||||||||||||||||||||||||||||||||||||||||||||||||||
| Highest Quarterly Return, Date | Jun. 30, 2020 | |||||||||||||||||||||||||||||||||||||||||||||||||||||||||||||||||||||||||||||||||
| Lowest Quarterly Return, Label [Optional Text] | Lowest Return: -18.83% - 2nd quarter 2022 | |||||||||||||||||||||||||||||||||||||||||||||||||||||||||||||||||||||||||||||||||
| Lowest Quarterly Return | (18.83%) | |||||||||||||||||||||||||||||||||||||||||||||||||||||||||||||||||||||||||||||||||
| Lowest Quarterly Return, Date | Jun. 30, 2022 | |||||||||||||||||||||||||||||||||||||||||||||||||||||||||||||||||||||||||||||||||
| abrdn Multi Fund ETF | abrdn International Small Cap Active ETF | ||||||||||||||||||||||||||||||||||||||||||||||||||||||||||||||||||||||||||||||||||
| Prospectus [Line Items] | ||||||||||||||||||||||||||||||||||||||||||||||||||||||||||||||||||||||||||||||||||
| Bar Chart and Performance Table [Heading] | Performance | |||||||||||||||||||||||||||||||||||||||||||||||||||||||||||||||||||||||||||||||||
| Performance Narrative [Text Block] | The bar chart and table below can help you evaluate potential risks of the International Small Cap Active ETF. The bar chart shows how the Fund’s annual total returns for Fund shares have varied from year to year. The table following the bar chart compares the Fund’s performance over time with those of a broad measure of market performance and an additional index that more closely reflects the Fund’s investment strategy. The table compares the Fund’s average annual total returns to the returns of the MSCI AC World ex-USA Index (Net TR)*, a broad-based securities index, and Custom abrdn International Small Cap Active ETF Index (the “Custom Index”). The Custom Index reflects the returns of the MSCI All Country World ex-USA Small Cap Index (Net TR) from March 1, 2016 and the MSCI World Small Cap Index (Net TR) for periods prior to March 1, 2016. The indices and time periods for the Custom Index align with the strategies utilized and benchmark for the Fund during the same time periods. Remember, however, that past performance (before and after taxes) is not necessarily indicative of how the Fund will perform in the future. For updated performance information, please visit www.aberdeeninvestments.com/usa/etf or call 844-383-7289. Effective after the close of business on October 17, 2025, the Fund adopted the performance of the “Predecessor Fund”, a registered investment company, as a result of a reorganization (the “Reorganization”) in which the Fund acquired all of the assets and assumed certain stated liabilities of the Predecessor Fund. Performance shown below for periods prior to the Reorganization are based on the investment objective and investment strategies utilized by the Predecessor Fund, which were the same as those of the Fund. The Predecessor Fund was managed by the same investment adviser as that of the Fund. The returns presented for the Fund for periods prior to the Reorganization reflect the performance of Institutional Shares of the Predecessor Fund. The Predecessor Fund changed its investment strategy effective February
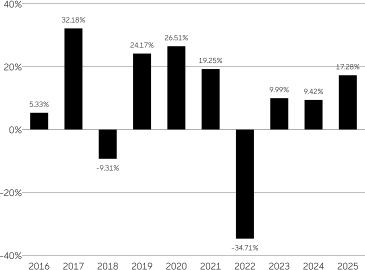
|
|||||||||||||||||||||||||||||||||||||||||||||||||||||||||||||||||||||||||||||||||
| Performance Past Does Not Indicate Future [Text] | Remember, however, that past performance (before and after taxes) is not necessarily indicative of how the Fund will perform in the future. | |||||||||||||||||||||||||||||||||||||||||||||||||||||||||||||||||||||||||||||||||
| Performance Information Illustrates Variability of Returns [Text] | The bar chart and table below can help you evaluate potential risks of the International Small Cap Active ETF. | |||||||||||||||||||||||||||||||||||||||||||||||||||||||||||||||||||||||||||||||||
| Bar Chart [Heading] | Annual Total Returns(Years Ended Dec. 31) | |||||||||||||||||||||||||||||||||||||||||||||||||||||||||||||||||||||||||||||||||
| Bar Chart [Table] | ![]() |
|||||||||||||||||||||||||||||||||||||||||||||||||||||||||||||||||||||||||||||||||
| Bar Chart Closing [Text Block] | Highest Return: 26.58% - 2nd quarter 2020 Lowest Return: -25.77% - 1st quarter 2020
|
|||||||||||||||||||||||||||||||||||||||||||||||||||||||||||||||||||||||||||||||||
| Performance Table Heading | Average Annual Total Returns as of December 31, 2025 | |||||||||||||||||||||||||||||||||||||||||||||||||||||||||||||||||||||||||||||||||
| Performance Table Narrative | After-tax returns are calculated using the historical highest individual federal marginal income tax rates in effect and do not reflect the impact of state and local taxes. Your actual after-tax return depends on your personal tax situation and may differ from what is shown here. After-tax returns are not relevant to investors in tax-deferred arrangements, such as individual retirement accounts, 401(k) plans or certain other employer-sponsored retirement plans.
|
|||||||||||||||||||||||||||||||||||||||||||||||||||||||||||||||||||||||||||||||||
| Performance Table Uses Highest Federal Rate | After-tax returns are calculated using the historical highest individual federal marginal income tax rates in effect and do not reflect the impact of state and local taxes. | |||||||||||||||||||||||||||||||||||||||||||||||||||||||||||||||||||||||||||||||||
| Performance Table Not Relevant to Tax Deferred | Your actual after-tax return depends on your personal tax situation and may differ from what is shown here. After-tax returns are not relevant to investors in tax-deferred arrangements, such as individual retirement accounts, 401(k) plans or certain other employer-sponsored retirement plans. | |||||||||||||||||||||||||||||||||||||||||||||||||||||||||||||||||||||||||||||||||
| Performance [Table] |
|
|||||||||||||||||||||||||||||||||||||||||||||||||||||||||||||||||||||||||||||||||
| Index No Deduction for Fees, Expenses, or Taxes [Text] | (reflects deductions for expenses and taxes) | |||||||||||||||||||||||||||||||||||||||||||||||||||||||||||||||||||||||||||||||||
| Performance Availability Website Address [Text] | www.aberdeeninvestments.com/usa/etf | |||||||||||||||||||||||||||||||||||||||||||||||||||||||||||||||||||||||||||||||||
| Performance Availability Phone [Text] | 844-383-7289 | |||||||||||||||||||||||||||||||||||||||||||||||||||||||||||||||||||||||||||||||||
| abrdn Multi Fund ETF | abrdn International Small Cap Active ETF | AMUN | ||||||||||||||||||||||||||||||||||||||||||||||||||||||||||||||||||||||||||||||||||
| Prospectus [Line Items] | ||||||||||||||||||||||||||||||||||||||||||||||||||||||||||||||||||||||||||||||||||
| Highest Quarterly Return, Label [Optional Text] | Highest Return: 26.58% - 2nd quarter 2020 | |||||||||||||||||||||||||||||||||||||||||||||||||||||||||||||||||||||||||||||||||
| Highest Quarterly Return | 26.58% | |||||||||||||||||||||||||||||||||||||||||||||||||||||||||||||||||||||||||||||||||
| Highest Quarterly Return, Date | Jun. 30, 2020 | |||||||||||||||||||||||||||||||||||||||||||||||||||||||||||||||||||||||||||||||||
| Lowest Quarterly Return, Label [Optional Text] | Lowest Return: -25.77% - 1st quarter 2020 | |||||||||||||||||||||||||||||||||||||||||||||||||||||||||||||||||||||||||||||||||
| Lowest Quarterly Return | (25.77%) | |||||||||||||||||||||||||||||||||||||||||||||||||||||||||||||||||||||||||||||||||
| Lowest Quarterly Return, Date | Mar. 31, 2020 | |||||||||||||||||||||||||||||||||||||||||||||||||||||||||||||||||||||||||||||||||
| abrdn Multi Fund ETF | abrdn Ultra Short Municipal Income Active ETF | ||||||||||||||||||||||||||||||||||||||||||||||||||||||||||||||||||||||||||||||||||
| Prospectus [Line Items] | ||||||||||||||||||||||||||||||||||||||||||||||||||||||||||||||||||||||||||||||||||
| Bar Chart and Performance Table [Heading] | Performance | |||||||||||||||||||||||||||||||||||||||||||||||||||||||||||||||||||||||||||||||||
| Performance Narrative [Text Block] | The bar chart and table below can help you evaluate potential risks of the Ultra Short Municipal Income Active ETF. The bar chart shows how the Fund’s annual total returns for Fund shares have varied from year to year. The table following the bar chart compares the Fund’s performance over time with those of a broad measure of market performance and an additional index that more closely reflects the Fund’s investment strategy. The table compares the Fund’s average annual total returns to the returns of the Bloomberg Municipal Bond Index, a broad-based securities index, and Custom abrdn Ultra Short Municipal Income Active ETF Index (the “Custom Index”). The Custom Index reflects the returns of the Bloomberg Municipal Bond 1 Year (1-2 Y) Index from October 20, 2025, BofA 1-22 Year U.S. Municipal Securities Index from September 14, 2017 until October 20, 2025, and the Bloomberg Municipal Bond Index for periods prior to September 14, 2017. The indices and time periods for the Custom Index align with the strategies utilized and benchmark for the Fund during the same time periods. Remember, however, that past performance (before and after taxes) is not necessarily indicative of how the Fund will perform in the future. For updated performance information, please visit www.aberdeeninvestments.com/usa/etf or call 844-383-7289. Effective after the close of business on October 17, 2025, the Fund adopted the performance of the “Predecessor Fund”, a registered investment company, as a result of a reorganization (the “Reorganization”) in which the Fund acquired all of the assets and assumed certain stated liabilities of the Predecessor Fund. The Fund has a different investment objective and strategies from those of the Predecessor Fund. Performance shown below for periods prior to the Reorganization are based on the investment objective and investment strategies utilized by the Predecessor Fund. The Predecessor Fund was managed by the same investment adviser as that of the Fund. The returns presented for the Fund for periods prior to the Reorganization reflect the performance of Institutional Shares of the Predecessor Fund. The Predecessor Fund changed its investment strategy effective February 28, 2019 to adopt a target average weighted effective duration. Performance information for periods prior to February 28, 2019 does not reflect such investment policy. In connection with the change in investment policy, the Predecessor Fund changed its name from Aberdeen Tax-Free Income Fund to Aberdeen Intermediate Municipal Income Fund. Performance for the Fund’s Shares has not been adjusted to reflect the Fund’s Shares’ lower expenses than those of the Predecessor Fund’s Institutional Class Shares. Performance for the Predecessor Fund is based on the NAV per share of the Predecessor Fund shares rather than on market-determined prices.
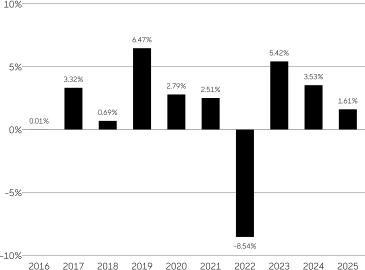
|
|||||||||||||||||||||||||||||||||||||||||||||||||||||||||||||||||||||||||||||||||
| Performance Past Does Not Indicate Future [Text] | Remember, however, that past performance (before and after taxes) is not necessarily indicative of how the Fund will perform in the future. | |||||||||||||||||||||||||||||||||||||||||||||||||||||||||||||||||||||||||||||||||
| Performance Information Illustrates Variability of Returns [Text] | The bar chart and table below can help you evaluate potential risks of the Ultra Short Municipal Income Active ETF. | |||||||||||||||||||||||||||||||||||||||||||||||||||||||||||||||||||||||||||||||||
| Bar Chart [Heading] | Annual Total Returns(Years Ended Dec. 31) | |||||||||||||||||||||||||||||||||||||||||||||||||||||||||||||||||||||||||||||||||
| Bar Chart [Table] | ![]() |
|||||||||||||||||||||||||||||||||||||||||||||||||||||||||||||||||||||||||||||||||
| Bar Chart Closing [Text Block] | Highest Return: 6.81% - 4th quarter 2023 Lowest Return: -5.54% - 1st quarter 2022
|
|||||||||||||||||||||||||||||||||||||||||||||||||||||||||||||||||||||||||||||||||
| Performance Table Heading | Average Annual Total Returns as of December 31, 2025 | |||||||||||||||||||||||||||||||||||||||||||||||||||||||||||||||||||||||||||||||||
| Performance Table Narrative | After-tax returns are calculated using the historical highest individual federal marginal income tax rates in effect and do not reflect the impact of state and local taxes. Your actual after-tax return depends on your personal tax situation and may differ from what is shown here. After-tax returns are not relevant to investors in tax-deferred arrangements, such as individual retirement accounts, 401(k) plans or certain other employer-sponsored retirement plans.
|
|||||||||||||||||||||||||||||||||||||||||||||||||||||||||||||||||||||||||||||||||
| Performance Table Uses Highest Federal Rate | After-tax returns are calculated using the historical highest individual federal marginal income tax rates in effect and do not reflect the impact of state and local taxes. | |||||||||||||||||||||||||||||||||||||||||||||||||||||||||||||||||||||||||||||||||
| Performance Table Not Relevant to Tax Deferred | Your actual after-tax return depends on your personal tax situation and may differ from what is shown here. After-tax returns are not relevant to investors in tax-deferred arrangements, such as individual retirement accounts, 401(k) plans or certain other employer-sponsored retirement plans. | |||||||||||||||||||||||||||||||||||||||||||||||||||||||||||||||||||||||||||||||||
| Performance [Table] |
|
|||||||||||||||||||||||||||||||||||||||||||||||||||||||||||||||||||||||||||||||||
| Index No Deduction for Fees, Expenses, or Taxes [Text] | (reflects no deduction for fees, expenses or taxes) | |||||||||||||||||||||||||||||||||||||||||||||||||||||||||||||||||||||||||||||||||
| Performance Availability Website Address [Text] | www.aberdeeninvestments.com/usa/etf | |||||||||||||||||||||||||||||||||||||||||||||||||||||||||||||||||||||||||||||||||
| Performance Availability Phone [Text] | 844-383-7289 | |||||||||||||||||||||||||||||||||||||||||||||||||||||||||||||||||||||||||||||||||
| abrdn Multi Fund ETF | abrdn Ultra Short Municipal Income Active ETF | AMUN | ||||||||||||||||||||||||||||||||||||||||||||||||||||||||||||||||||||||||||||||||||
| Prospectus [Line Items] | ||||||||||||||||||||||||||||||||||||||||||||||||||||||||||||||||||||||||||||||||||
| Highest Quarterly Return, Label [Optional Text] | Highest Return: 6.81% - 4th quarter 2023 | |||||||||||||||||||||||||||||||||||||||||||||||||||||||||||||||||||||||||||||||||
| Highest Quarterly Return | 6.81% | |||||||||||||||||||||||||||||||||||||||||||||||||||||||||||||||||||||||||||||||||
| Highest Quarterly Return, Date | Dec. 31, 2023 | |||||||||||||||||||||||||||||||||||||||||||||||||||||||||||||||||||||||||||||||||
| Lowest Quarterly Return, Label [Optional Text] | Lowest Return: -5.54% - 1st quarter 2022 | |||||||||||||||||||||||||||||||||||||||||||||||||||||||||||||||||||||||||||||||||
| Lowest Quarterly Return | (5.54%) | |||||||||||||||||||||||||||||||||||||||||||||||||||||||||||||||||||||||||||||||||
| Lowest Quarterly Return, Date | Mar. 31, 2022 | |||||||||||||||||||||||||||||||||||||||||||||||||||||||||||||||||||||||||||||||||
| abrdn EM SMA Completion Fund | abrdn EM SMA Completion Fund | ||||||||||||||||||||||||||||||||||||||||||||||||||||||||||||||||||||||||||||||||||
| Prospectus [Line Items] | ||||||||||||||||||||||||||||||||||||||||||||||||||||||||||||||||||||||||||||||||||
| Bar Chart and Performance Table [Heading] | Performance | |||||||||||||||||||||||||||||||||||||||||||||||||||||||||||||||||||||||||||||||||
| Performance Narrative [Text Block] | The bar chart and table below can help you evaluate potential risks of the Fund. The bar chart shows the Fund’s annual total returns for the Institutional Class have varied from year to year. The table following the bar chart compares the Fund’s performance over time with those of a broad measure of market performance. Returns in the table reflect the maximum applicable sales charges. The table compares the Fund’s average annual total returns to the returns of the MSCI Emerging Markets Index (Net TR)*, a broad-based securities market index. Remember, however, that past performance (before and after taxes) is not necessarily indicative of how the Fund will perform in the future. For updated performance information, please visit https://www.aberdeeninvestments.com/en-us/investor/funds/view-all-funds or call 866-667-9231.
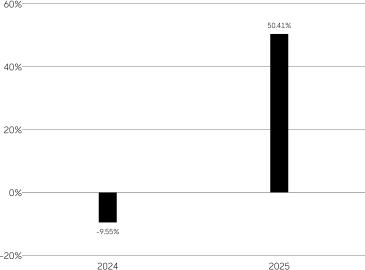
|
|||||||||||||||||||||||||||||||||||||||||||||||||||||||||||||||||||||||||||||||||
| Performance Past Does Not Indicate Future [Text] | Remember, however, that past performance (before and after taxes) is not necessarily indicative of how the Fund will perform in the future. | |||||||||||||||||||||||||||||||||||||||||||||||||||||||||||||||||||||||||||||||||
| Performance Information Illustrates Variability of Returns [Text] | The bar chart and table below can help you evaluate potential risks of the Fund. | |||||||||||||||||||||||||||||||||||||||||||||||||||||||||||||||||||||||||||||||||
| Bar Chart [Heading] | Annual Total Returns – Institutional Class Shares(Years Ended Dec. 31) | |||||||||||||||||||||||||||||||||||||||||||||||||||||||||||||||||||||||||||||||||
| Bar Chart [Table] | ![]() |
|||||||||||||||||||||||||||||||||||||||||||||||||||||||||||||||||||||||||||||||||
| Bar Chart Closing [Text Block] | Highest Return: 18.82% - 3rd quarter 2025 Lowest Return: -7.97% - 4th quarter 2024
|
|||||||||||||||||||||||||||||||||||||||||||||||||||||||||||||||||||||||||||||||||
| Performance Table Heading | Average Annual Total Returns as of December 31, 2025 | |||||||||||||||||||||||||||||||||||||||||||||||||||||||||||||||||||||||||||||||||
| Performance Table Narrative | After-tax returns are shown in the following table for the Institutional Class shares only and will vary for other classes. After-tax returns are calculated using the historical highest individual federal marginal income tax rates in effect and do not reflect the impact of state and local taxes. Your actual after-tax return depends on your personal tax situation and may differ from what is shown here. After-tax returns are not relevant to investors in tax-deferred arrangements, such as individual retirement accounts, 401(k) plans or certain other employer-sponsored retirement plans.
|
|||||||||||||||||||||||||||||||||||||||||||||||||||||||||||||||||||||||||||||||||
| Performance Table Does Reflect Sales Loads | Returns in the table reflect the maximum applicable sales charges. | |||||||||||||||||||||||||||||||||||||||||||||||||||||||||||||||||||||||||||||||||
| Performance Table Uses Highest Federal Rate | After-tax returns are calculated using the historical highest individual federal marginal income tax rates in effect and do not reflect the impact of state and local taxes. | |||||||||||||||||||||||||||||||||||||||||||||||||||||||||||||||||||||||||||||||||
| Performance Table Not Relevant to Tax Deferred | Your actual after-tax return depends on your personal tax situation and may differ from what is shown here. After-tax returns are not relevant to investors in tax-deferred arrangements, such as individual retirement accounts, 401(k) plans or certain other employer-sponsored retirement plans. | |||||||||||||||||||||||||||||||||||||||||||||||||||||||||||||||||||||||||||||||||
| Performance [Table] |
|
[20] | ||||||||||||||||||||||||||||||||||||||||||||||||||||||||||||||||||||||||||||||||
| Performance Table One Class of after Tax Shown [Text] | After-tax returns are shown in the following table for the Institutional Class shares only and will vary for other classes. | |||||||||||||||||||||||||||||||||||||||||||||||||||||||||||||||||||||||||||||||||
| Index No Deduction for Fees, Expenses, or Taxes [Text] | (reflects no deduction for fees or expenses) | |||||||||||||||||||||||||||||||||||||||||||||||||||||||||||||||||||||||||||||||||
| Performance Availability Website Address [Text] | https://www.aberdeeninvestments.com/en-us/investor/funds/view-all-funds | |||||||||||||||||||||||||||||||||||||||||||||||||||||||||||||||||||||||||||||||||
| Performance Availability Phone [Text] | 866-667-9231 | |||||||||||||||||||||||||||||||||||||||||||||||||||||||||||||||||||||||||||||||||
| abrdn EM SMA Completion Fund | abrdn EM SMA Completion Fund | abrdn EM SMA Completion Fund | ||||||||||||||||||||||||||||||||||||||||||||||||||||||||||||||||||||||||||||||||||
| Prospectus [Line Items] | ||||||||||||||||||||||||||||||||||||||||||||||||||||||||||||||||||||||||||||||||||
| Highest Quarterly Return, Label [Optional Text] | Highest Return: 18.82% - 3rd quarter 2025 | |||||||||||||||||||||||||||||||||||||||||||||||||||||||||||||||||||||||||||||||||
| Highest Quarterly Return | 18.82% | |||||||||||||||||||||||||||||||||||||||||||||||||||||||||||||||||||||||||||||||||
| Highest Quarterly Return, Date | Sep. 30, 2025 | |||||||||||||||||||||||||||||||||||||||||||||||||||||||||||||||||||||||||||||||||
| Lowest Quarterly Return, Label [Optional Text] | Lowest Return: -7.97% - 4th quarter 2024 | |||||||||||||||||||||||||||||||||||||||||||||||||||||||||||||||||||||||||||||||||
| Lowest Quarterly Return | (7.97%) | |||||||||||||||||||||||||||||||||||||||||||||||||||||||||||||||||||||||||||||||||
| Lowest Quarterly Return, Date | Dec. 31, 2024 | |||||||||||||||||||||||||||||||||||||||||||||||||||||||||||||||||||||||||||||||||
| ||||||||||||||||||||||||||||||||||||||||||||||||||||||||||||||||||||||||||||||||||