Performance Management
|
Feb. 27, 2026 |
| Capital Group Core Bond Completion Fund |
|
| Prospectus [Line Items] |
|
| Bar Chart and Performance Table [Heading] |
Investment
results
|
| Performance Narrative [Text Block] |
The following bar
chart shows the fund’s investment results for its first full calendar year of operations, and the following table shows how the
fund’s average annual total returns for various periods compare with a broad measure of securities market results and, if applicable,
other measures of market results that reflect the fund’s investment universe. This information provides some indication of the
risks of investing in the fund. Past investment results (before and after taxes) are not predictive of future investment results. Updated
information on the fund’s investment results can be obtained by visiting capitalgroup.com.
|
| Performance Past Does Not Indicate Future [Text] |
Past investment results (before and after taxes) are not predictive of future investment results.
|
| Performance Information Illustrates Variability of Returns [Text] |
The following bar
chart shows the fund’s investment results for its first full calendar year of operations, and the following table shows how the
fund’s average annual total returns for various periods compare with a broad measure of securities market results and, if applicable,
other measures of market results that reflect the fund’s investment universe.
|
| Bar Chart Narrative [Text Block] |
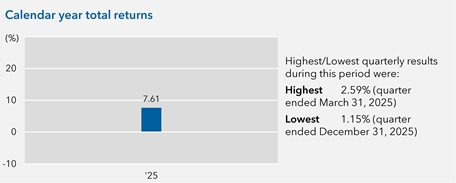
The following bar chart shows the fund’s investment results for its first full calendar year of operations, and the following table shows how the fund’s average annual total returns for various periods compare with a broad measure of securities market results and, if applicable, other measures of market results that reflect the fund’s investment universe.
|
| Bar Chart [Heading] |
Calendar year total returns
|
| Bar Chart [Table] |
|
| Bar Chart Closing [Text Block] |
Highest/Lowest quarterly results during this period were:
Highest 2.59% (quarter ended March 31, 2025)
Lowest 1.15% (quarter ended December 31, 2025)
|
| Highest Quarterly Return, Label [Optional Text] |
Highest
|
| Highest Quarterly Return |
2.59%
|
| Highest Quarterly Return, Date |
Mar. 31, 2025
|
| Lowest Quarterly Return, Label [Optional Text] |
Lowest
|
| Lowest Quarterly Return |
1.15%
|
| Lowest Quarterly Return, Date |
Dec. 31, 2025
|
| Performance Table Uses Highest Federal Rate |
After-tax
returns are calculated using the highest individual federal income tax rates in effect during each year of the periods shown and do not
reflect the impact of state and local taxes.
|
| Performance Table Not Relevant to Tax Deferred |
Your actual after-tax returns depend on your individual tax situation and likely will differ
from the results shown above. In addition, after-tax returns are not relevant if you hold your fund shares through a tax-favored arrangement,
such as a 401(k) plan, individual retirement account (IRA) or 529 college savings plan.
|
| Performance [Table] |
| | | | | Average annual total returns For the periods ended December 31, 2025: | 1 year | Lifetime | | Fund (inception date – 9/13/2024) | 7.61% | 3.74% | | − After taxes on distributions | N/A | N/A | | − After taxes on distributions and sale of fund shares | N/A | N/A |
| | | | | Indexes | 1 year | Lifetime
(since fund’s inception) | | Bloomberg U.S. Aggregate Index (reflects no deductions for sales charges, account fees, expenses or U.S. federal income taxes) | 7.30% | 2.71% | The fund’s annualized 30-day yield at December 31, 2025: 4.94% (For current yield information, please call American Funds Service Company at (800) 421-4225 or visit capitalgroup.com |
|
| Average Annual Return, Caption [Optional Text] |
Average annual total returns For the periods ended December 31, 2025:
|
| Performance Table Closing [Text Block] |
After-tax
returns are calculated using the highest individual federal income tax rates in effect during each year of the periods shown and do not
reflect the impact of state and local taxes. Your actual after-tax returns depend on your individual tax situation and likely will differ
from the results shown above. In addition, after-tax returns are not relevant if you hold your fund shares through a tax-favored arrangement,
such as a 401(k) plan, individual retirement account (IRA) or 529 college savings plan.
|
| Thirty Day Yield Caption [Optional Text] |
The fund’s annualized 30-day yield at December 31, 2025:
|
| Thirty Day Yield Phone |
(800) 421-4225
|
| Thirty Day Yield |
4.94%
|
| Performance Availability Website Address [Text] |
capitalgroup.com
|
| Capital Group Core Plus Completion Fund |
|
| Prospectus [Line Items] |
|
| Bar Chart and Performance Table [Heading] |
Investment
results
|
| Performance Narrative [Text Block] |
Because the fund has been
in operation for less than one full calendar year, information regarding investment results is not available as of the date of this prospectus.
|
| Performance One Year or Less [Text] |
Because the fund has been
in operation for less than one full calendar year, information regarding investment results is not available as of the date of this prospectus.
|
| Capital Group Municipal Income Completion Fund |
|
| Prospectus [Line Items] |
|
| Bar Chart and Performance Table [Heading] |
Investment
results
|
| Performance Narrative [Text Block] |
Because the fund
has been in operation for less than one full calendar year, information regarding investment results is not available as of the date
of this prospectus.
|
| Performance One Year or Less [Text] |
Because the fund
has been in operation for less than one full calendar year, information regarding investment results is not available as of the date
of this prospectus.
|